

••••Faculty of AgriSciences
Umezuruike Linus Opara
SA Research Chair in Postharvest Technology
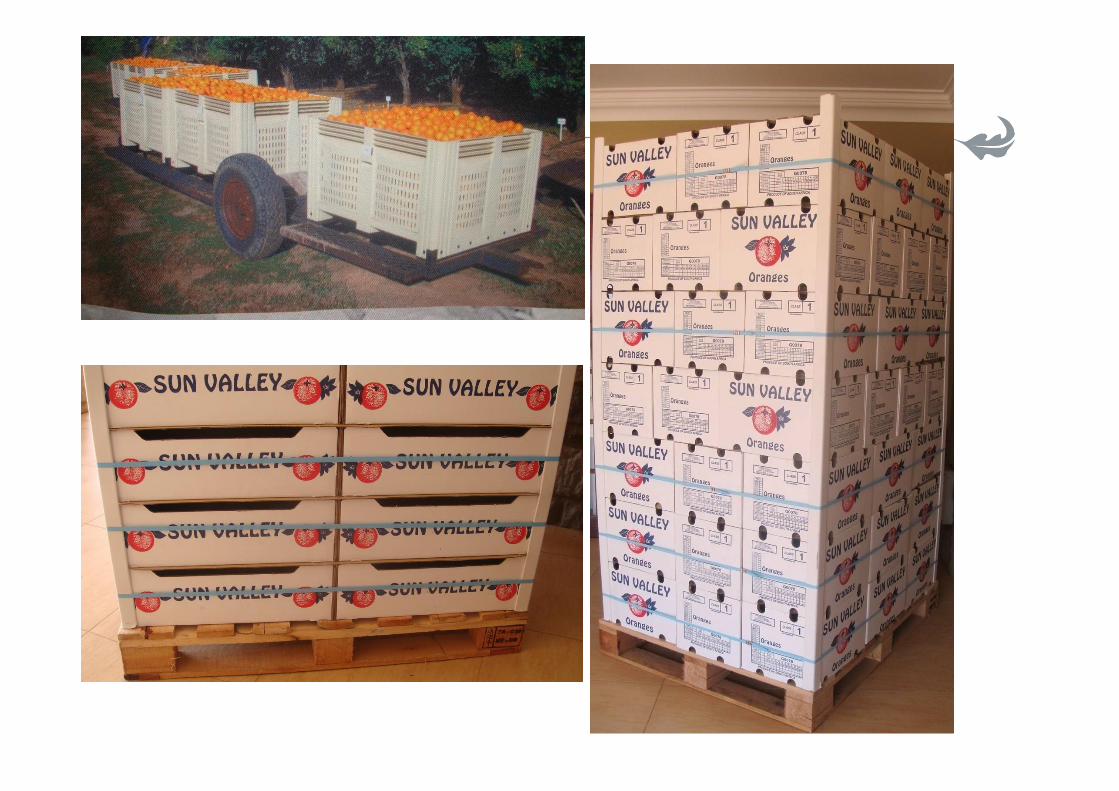
PACKAGING FOR SEA
FREIGHT
Umezuruike Linus Opara
SA Research Chair in Postharvest Technology
A view from inside-out of ventilated packaging

Packaging for the cold chain


What is a Cold Chain?
*A logistics *A logistics processprocess where where temperaturetemperature--sensitivesensitive
cargo will maintain its integrity through multicargo will maintain its integrity through multi--modal modal
movementmovement and kept in ambient and kept in ambient facilitiesfacilities to ensure to ensure
100% quality, freshness, and customer satisfaction.100% quality, freshness, and customer satisfaction.
TransLogistique TransLogistique Canada. Canada. Conference Conference –– Fairmont Hotel Dubai Fairmont Hotel Dubai ––
October 12 / 13, 2004. www.translogistique.orgOctober 12 / 13, 2004. www.translogistique.org
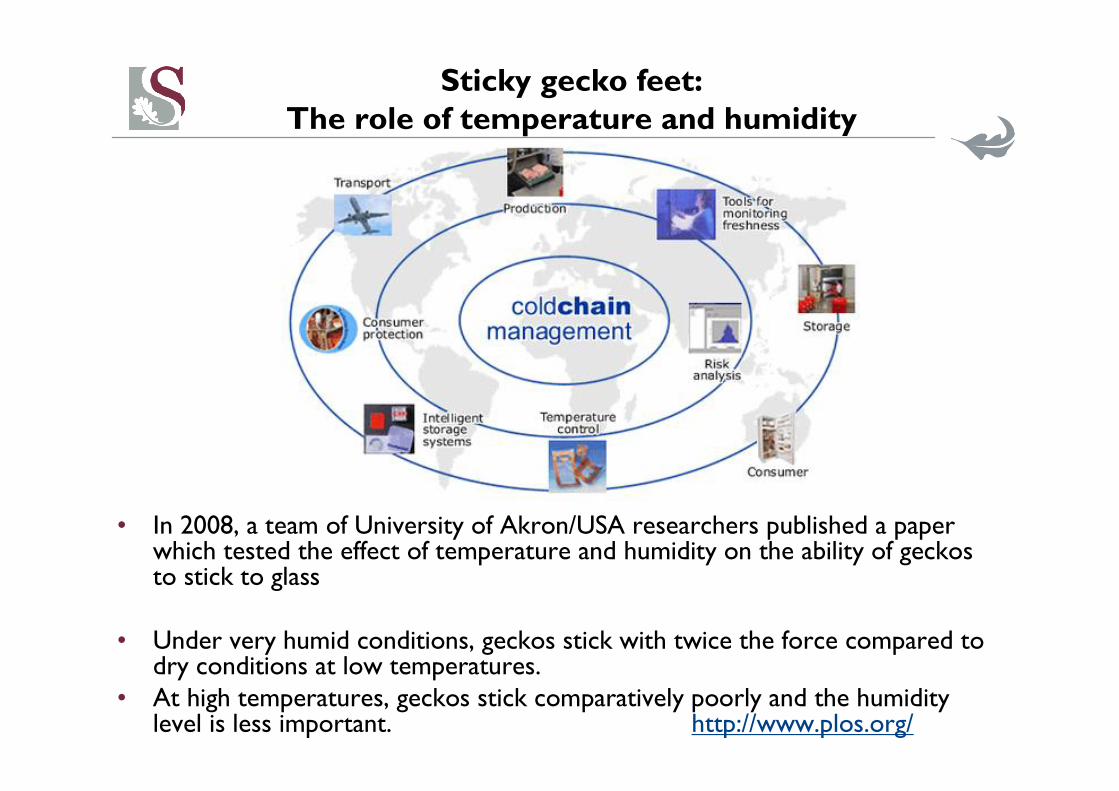
Sticky gecko feet: The role of temperature and humidity
• In 2008, a team of University of Akron/USA researchers published a paper which tested the effect of temperature and humidity on the ability of geckos to stick to glass
• Under very humid conditions, geckos stick with twice the force compared to dry conditions at low temperatures.
• At high temperatures, geckos stick comparatively poorly and the humidity level is less important. http://www.plos.org/

Role of packaging in the cold chain

WHAT DOES FRUIT AND BEER HAVE IN COMMON?
VENTILATED PACKAGING!

Sometimes small changechange in package can make a big impact
Coors Brewing Company Vented Wide
Mouth™ can.
The real innovation here: not the wide-mouth
opening, but the "vent" that is part of the
opening.
Slightly raised portion of the opening allows
for better airflow when drinking – enhancing
"gulp-ability" – long, smooth drinking motion.
More in the pourMore in the pourMore in the pourMore in the pour

Fruit Container Net weight (kg)
Oranges Fiberboard carton
Fiberboard box
Carton for place packing
20
39
17–18
Tangerines/ mandarins/hybrids
Fiberboard carton
Fiberboard carton
Master carton with 10 bags of 1.3 to 1.4 kg
Master carton with 16 bags of 1.4 kg
20
11-12
13–13.5
22
Grapefruit Fiberboard carton (28.9 lit)
Fiberboard carton
Master carton with 6 bags of 3.6 kg
Master carton with 10 bags of 2.4 kg
19
17–18
22
24
Limes Small carton
Fiberboard carton (28.9 lit)
4.5
17-18
Lemons Fiberboard carton (28.9 lit) 17
Containers Generally Used for Fresh Citrus in the U.S.A.
What Package? Which Package? Whose Package?

Packaging,Costs, Value and Postharvest Losses

Contribution of Individual Postharvest Operations
(Total=60.82%)
6.97
8.74
18.95
21.16
0
4
8
12
16
20
24
Storage Harvesting Marketing+Transport Grading+Packing
Co
ntr
ibu
tio
n t
o P
os
tha
rve
st
Co
st
(%)
Cost of a Unit Weight of Apple Fruit
(Source: UK Grower, Wk 37, 1994)
12

Data from Mr Reinhardt Reingruh,
SOURCE (2010)

Economic Develo
pment
Grains Meat, Fish and Dairy
Valu
e-ad
din
g
Fruit & Vegetables
threshing
packaging
cold storage
CA storageMAP
transport:
truck, ship, rail
airfreight
Relationship between Postharvest Technology Relationship between Postharvest Technology Relationship between Postharvest Technology Relationship between Postharvest Technology and Economic Developmentand Economic Developmentand Economic Developmentand Economic Development
Perishables-orientedDurables-oriented
Farming-
oriented
Business-
oriented
drying
milling
baking
brewing
fermentationstorage
freezing
pickling
Freeze-drying
Minimal processing,
ready-to-eat
industrial food
manufacturing
health-foods
hurdle technologies

Packaging adds 20% to cost of fruit
• Based on recent supermarket survey in the UK
• Environment minister Ben Bradshaw urged shoppers to boycott heavily packaged fruit and boycott heavily packaged fruit and
vegetablesvegetables in order to pressure supermarkets to be more environmentally friendly
N. Cecil & E. Widdup, Evening Standard, 18 April 2007
http/www.thisismoney.co.uk/consumer/

Postharvest Losses and Waste
• 30-50% food postharvest losses and wastage in many less developed countries
• 2-3% food wastage in developed countries
• Less than 1% of packed 1% of packed food goes to waste, compared with 1010--20% of unpacked food20% of unpacked food
• A Tetra Pak motto is that a package should save a package should save
more than its costsmore than its costs


Table grapes packaging loss
(a) Weight loss from shipping to retail market
under near optimal postharvest handling ~2%.
(b) Weight loss from shipping to retail market
under sub-optimal postharvest handling
conditions (e.g. delays, higher °C, lower RH) ~7%.
(c) The 5% weight loss + low appearance quality
= 15% loss in value and returns

Package Handling Environment
• Climate
• High/low temperature, moisture, relative humidity, loght, gases, volatile, dust
• Physical/mechanical
• Shocks, compression, puncture, vibration, abrasion, tearing, racking
• Biochemical
• Microbes – bacteria, fungi, moulds, yeasts, viruses
• Pests – rodents, insects, mites, birds

Table: Effect of ventilation level in packaging material on
fruit weight loss of peach under ambient conditions.
Ventilation level Weight loss (%) after days
1 2 3 4 5
0 % 0.1 0.3 0.5 0.8 1.0
2.5% 2.5 4.7 6.2 8.7 10.6
5% 3.2 7.4 9.8 12.6 -
7.5% 3.7 8.3 11.4 15.1 -
Control Control 5.7 5.7 16.8 16.8 24.6 24.6 34.6 34.6 --
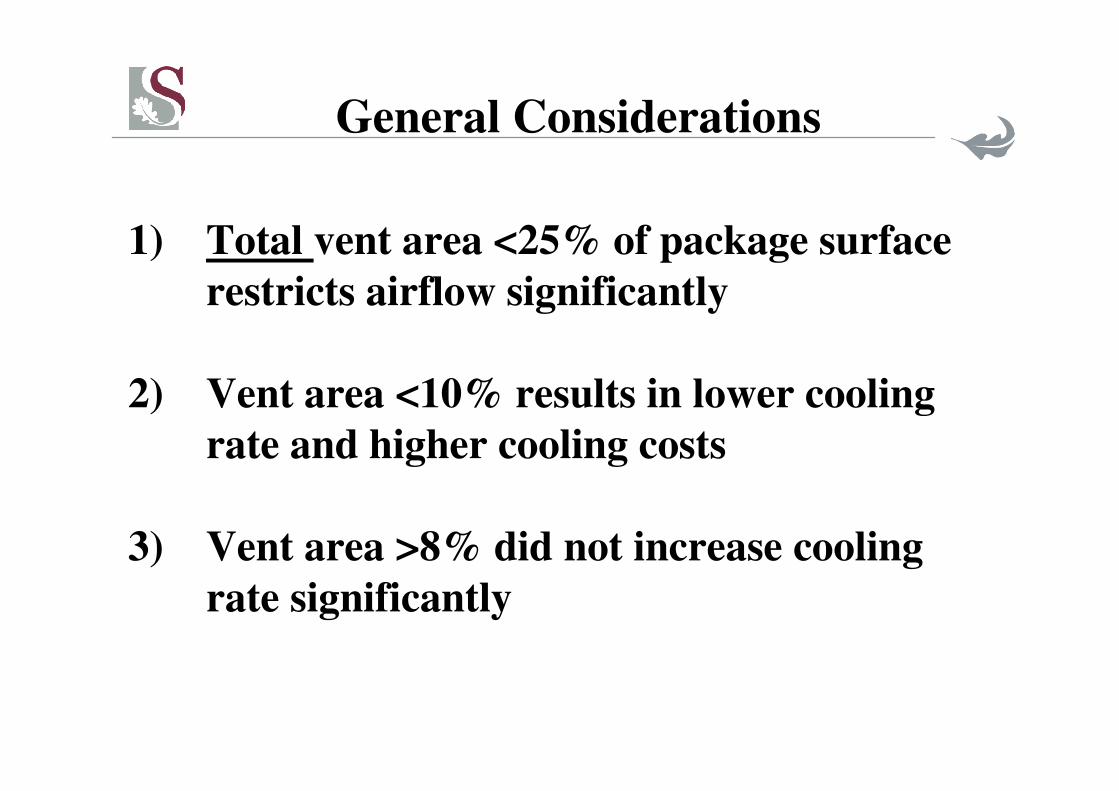
General Considerations
1) Total vent area <25% of package surface
restricts airflow significantly
2) Vent area <10% results in lower cooling
rate and higher cooling costs
3) Vent area >8% did not increase cooling
rate significantly

Background to Packaging Cold Chain Modelling Research
• Tanner, D.J., Cleland, A.C., Robertson, T.R., Opara, L.U., 2000. Use of CO2 as a trace gas for determining in-package airflow distribution. Journal of Agricultural Engineering Research 77(4): 409-417.
• Tanner, D.J., A.C. Cleland, L.U. Opara, T.R. Robertson. 2002. A generalised mathematical modelling methodology for design of horticultural food packages exposed to refrigerated conditions: Part 1, formulation. International Journal of Refrigeration, 25(1): 33-42.
• Tanner, D.J., A.C. Cleland, L.U. Opara, T.R. Robertson. 2002. A generalised mathematical modelling methodology for design of horticultural food packages exposed to refrigerated conditions: Part 2. Heat transfer modelling and testing. International Journal of Refrigeration, 25(1): 43-53.
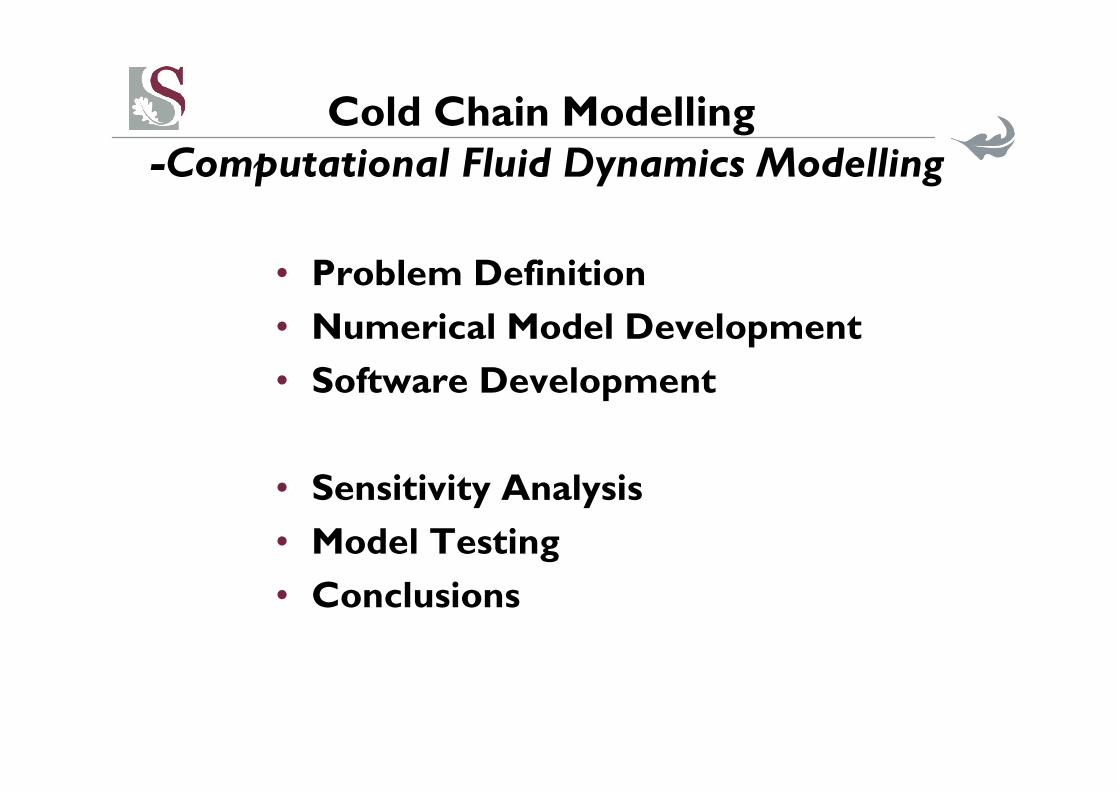
Cold Chain Modelling-Computational Fluid Dynamics Modelling
• Problem Definition
• Numerical Model Development
• Software Development
• Sensitivity Analysis
• Model Testing
• Conclusions
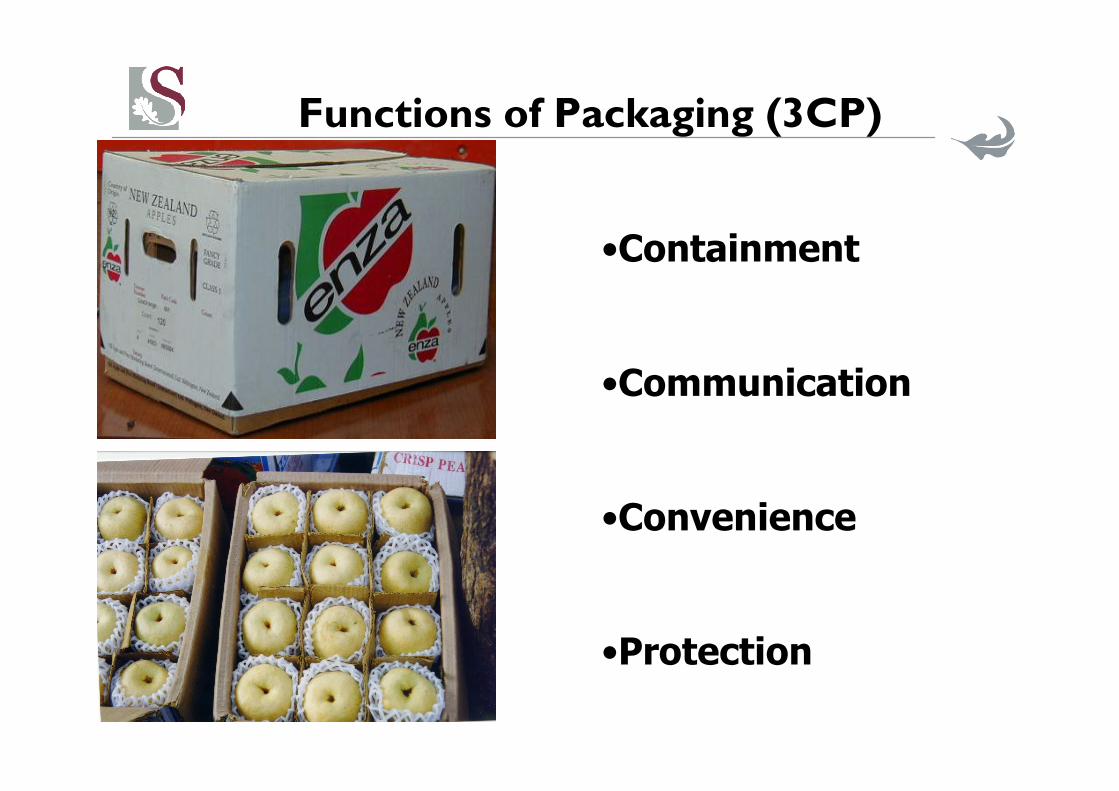
Functions of Packaging (3CP)
•Containment
•Communication
•Convenience
•Protection

Fruit Packaging & Protection: A Complex Problem
The Problem : Therm odynam ic D esign of F ruit PackagingThe Problem : Therm odynam ic D esign of F ruit PackagingThe Problem : Therm odynam ic D esign of F ruit PackagingThe Problem : Therm odynam ic D esign of F ruit Packaging

Fruit Packaging&
Cooling Problem
The Problem : Therm odynam ic D esign of F ruit PackagingThe Problem : Therm odynam ic D esign of F ruit PackagingThe Problem : Therm odynam ic D esign of F ruit PackagingThe Problem : Therm odynam ic D esign of F ruit Packaging

The Problem : Therm odynam ic D esign of F ruit PackagingThe Problem : Therm odynam ic D esign of F ruit PackagingThe Problem : Therm odynam ic D esign of F ruit PackagingThe Problem : Therm odynam ic D esign of F ruit Packaging

Critical success factors:
•Vent designdesign
••placementplacement of produce

Consequences of bad packaging
•Non-uniform cooling
•Inadequate cooling rate
0
5
10
15
20
25
30
0 5 10 15
Time
Fru
it t
em
pera
ture
No ventilation
Ventilated

Features of the System to be Modelled
Features Descriptions
Domains •Individual package
•Stack of packages
Package types •Bulk package
•Layered package
Transport
processes
•Air mass transfer
•Air momentum transfer
•Heat transfer
•Moisture transfer
Boundary
conditions
•On one side of stack or individual package, airflow
leaves or enters vents with fixed velocity
•On the other sides, airflow pressure on the vents is
equal to that of the surrounding environment
•If airflow enters a vent, it has fixed temperature equal
to the cooling temperature
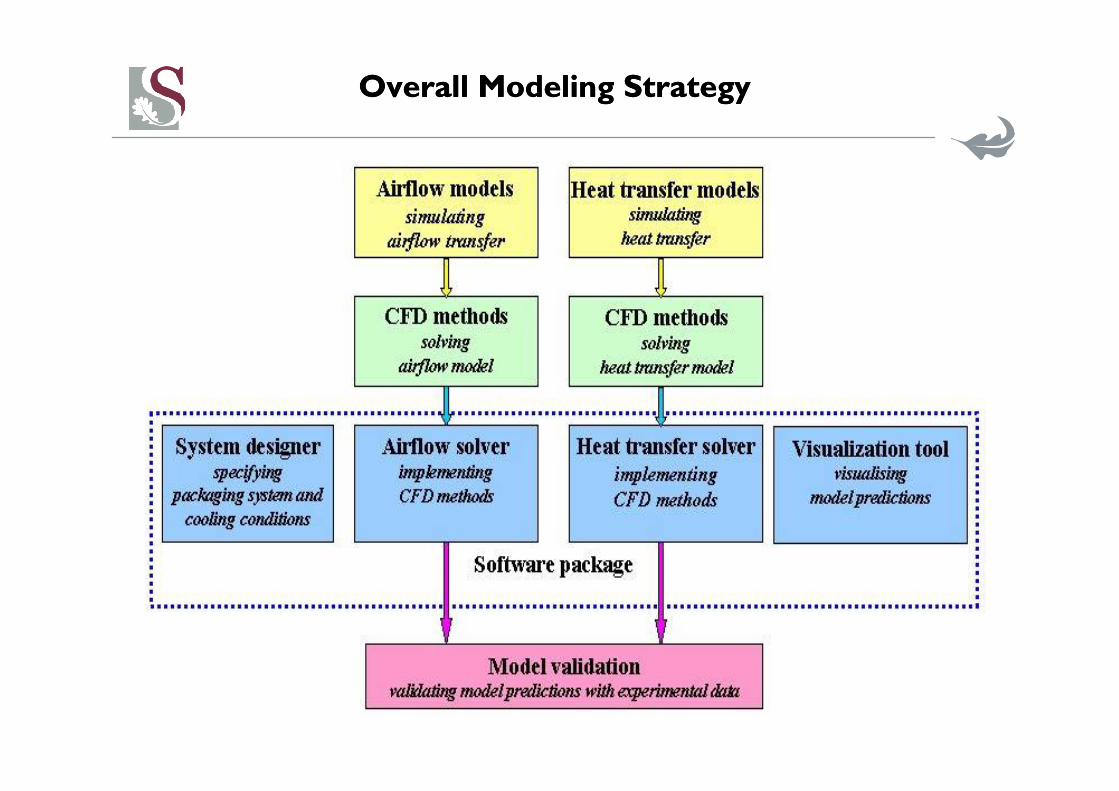
Overall Modeling Strategy
Moisture transfer models
simulating
weight/water loss
CFD methods
solving
moisture loss model
Moisture transfer models
simulating
weight/water loss
CFD methods
solving
moisture loss model
Moisture transfer models
simulating
weight/water loss
CFD methods
solving
moisture loss model
Moisture transfer models
simulating
weight/water loss
CFD methods
solving
moisture loss model
Moisture transfer models
simulating
weight/water loss
Moisture transfer models
simulating
weight/water loss
CFD methods
solving
moisture loss model
Moisture transfer models
simulating
weight/water loss
Moisture transfer models
simulating
weight/water loss
CFD methods
solving
moisture loss model
Moisture transfer models
simulating
weight/water loss
CFD methods
solving
moisture loss model
Moisture transfer models
simulating
weight/water loss
CFD methods
solving
moisture loss model
Moisture transfer models
simulating
weight/water loss
CFD methods
solving
moisture loss model
Moisture transfer models
simulating
weight/water loss
CFD methods
solving
moisture loss model
Moisture transfer models
simulating
weight/water loss
CFD methods
solving
moisture loss model
CFD methods
solving
moisture loss model
Overall Modeling Strategy

Overall Modeling Strategy
Moisture transfer models
simulating
weight/water loss
CFD methods
solving
moisture loss model
Moisture transfer models
simulating
weight/water loss
CFD methods
solving
moisture loss model
Moisture transfer models
simulating
weight/water loss
CFD methods
solving
moisture loss model
Moisture transfer models
simulating
weight/water loss
CFD methods
solving
moisture loss model
Moisture transfer models
simulating
weight/water loss
Moisture transfer models
simulating
weight/water loss
CFD methods
solving
moisture loss model
Moisture transfer models
simulating
weight/water loss
Moisture transfer models
simulating
weight/water loss
CFD methods
solving
moisture loss model
Moisture transfer models
simulating
weight/water loss
CFD methods
solving
moisture loss model
Moisture transfer models
simulating
weight/water loss
CFD methods
solving
moisture loss model
Moisture transfer models
simulating
weight/water loss
CFD methods
solving
moisture loss model
Moisture transfer models
simulating
weight/water loss
CFD methods
solving
moisture loss model
Moisture transfer models
simulating
weight/water loss
CFD methods
solving
moisture loss model
Moisture transfer models
simulating
weight/water loss
CFD methods
solving
moisture loss model
Moisture transfer models
simulating
weight/water loss
Moisture transfer models
simulating
weight/water loss
CFD methods
solving
moisture loss model
Moisture transfer models
simulating
weight/water loss
Moisture transfer models
simulating
weight/water loss
CFD methods
solving
moisture loss model
Moisture transfer models
simulating
weight/water loss
CFD methods
solving
moisture loss model
Moisture transfer models
simulating
weight/water loss
CFD methods
solving
moisture loss model
Moisture transfer models
simulating
weight/water loss
Overall Modeling Strategy
Moisture transfer models
simulating
weight/water loss
CFD methods
solving
moisture loss model
Moisture transfer models
simulating
weight/water loss
CFD methods
solving
moisture loss model
Moisture transfer models
simulating
weight/water loss
CFD methods
solving
moisture loss model
Moisture transfer models
simulating
weight/water loss
CFD methods
solving
moisture loss model
Moisture transfer models
simulating
weight/water loss
CFD methods
solving
moisture loss model
Moisture transfer models
simulating
weight/water loss
CFD methods
solving
moisture loss model
Moisture transfer models
simulating
weight/water loss

CFD Models of Airflow Pattern &
Heat Transfer Inside Bulk and Layered Packages

Regions in bulk and layered packages

Illustration of the porous media approach for a layered package

Global grid systems for the domains of a single package and a layer of packages.

Illustration of grid generation processes for a layered package (grid generation for x-z plane of a layered package).

Journal of Food Engineering, Vol. 77, 2005, pp.1037–1047
A CFD modeling system for airflow and heattransfer in ventilated packaging for fresh foods: I. initial analysis and development of mathematical models
Zou, Q., Opara, L.U. and McKibbin, R.
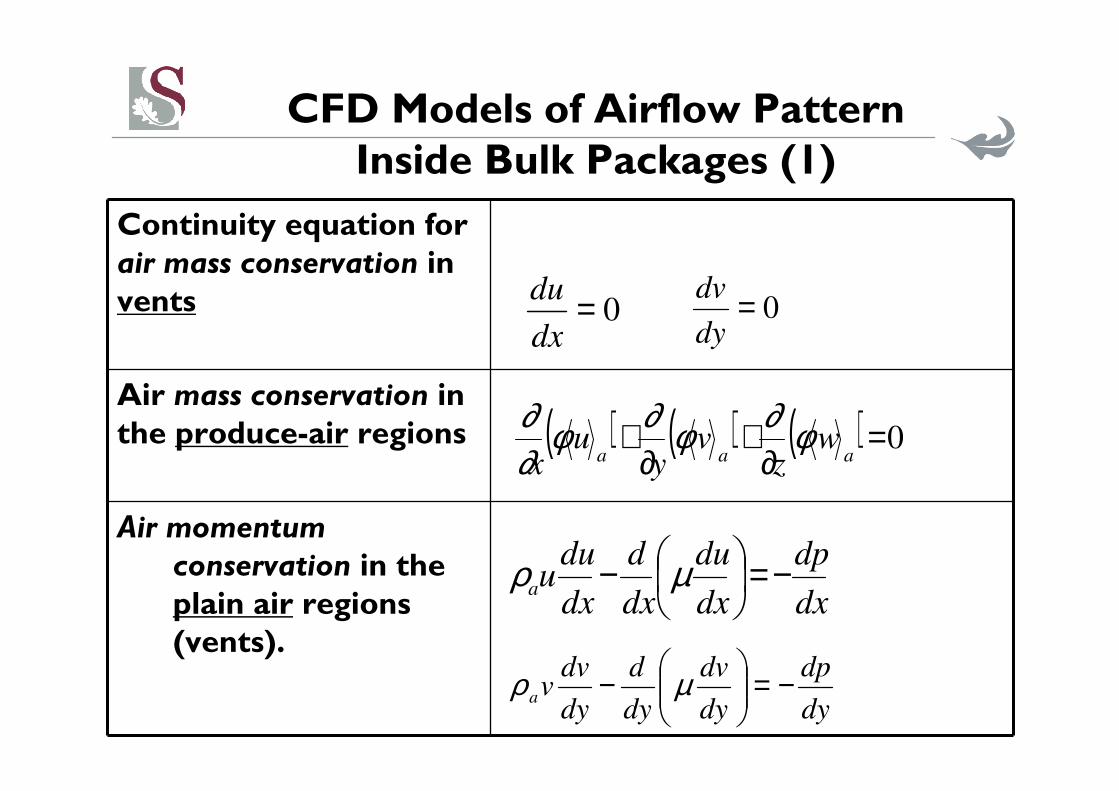
CFD Models of Airflow Pattern Inside Bulk Packages (1)
Continuity equation for air mass conservation in vents
Air mass conservation in the produce-air regions
Air momentum conservation in the plain air regions (vents).
( ) ( ) ( ) 0=∂
+∂
+aaa
wz
vy
ux
φ∂φ∂φ∂∂
0=dx
du0=
dy
dv
dx
dp
dx
du
dx
d
dx
duua −=
− µρ
dy
dp
dy
dv
dy
d
dy
dvva −=
− µρ

Air momentum conservation in the produce-air regions (generalised volume average momentum equation)
( ) ( ) ( )
( )aaaa
aaa
aaa
aaaaaaaaa
uwvuK
F
K
u
x
p
z
u
zy
u
yx
u
x
uwz
uvy
uux
2
1222
32
)( ++−−−
=
∂∂
∂∂−
∂∂
∂∂−
∂∂
∂∂−
++
ρφµφ∂
φ∂
µφµφµφ
φρ∂∂φρ
∂∂φρ
∂∂
( ) ( ) ( )
( )aaaa
aaa
aaa
aaaaaaaaa
vwvuK
F
K
v
y
p
z
v
zy
v
yx
v
x
vwz
vvy
vux
2
1222
32
)( ++−−−
=
∂∂
∂∂−
∂∂
∂∂−
∂∂
∂∂−
++
ρφµφ∂
φ∂
µφµφµφ
φρ∂∂φρ
∂∂φρ
∂∂
( ) ( ) ( )
( )aaaa
aaa
aaa
aaaaaaaaa
wwvuK
F
K
w
z
p
z
w
zy
w
yx
w
x
wwz
wvy
wux
2
1222
32
)( ++−−−
=
∂∂
∂∂−
∂∂
∂∂−
∂∂
∂∂−
++
ρφµφ∂
φ∂
µφµφµφ
φρ∂∂φρ
∂∂φρ
∂∂
CFD Models of Airflow Pattern Inside Bulk Packages (2)

Auxiliary algebraic equations in the produce-air regions
Porosity near a package wall, φφφφ
Permeability, K
Forchheimer coefficient, F
Equivalent mean diameter of produce items, deq
)1( eqd
by
ae−
∞ += φφ
2
32
)1( φφ
−=
A
dK
eq
3φA
BF =
p
p
eqS
Vd 6=
CFD Models of Airflow Pattern Inside Bulk Packages (3)

CFD Models of Heat Transfer
Air energy conservation equation in vents
Energy conservation equation in the solid region
Volume-averaged air energy equation in the produce-air regions
Volume-averaged product energy equation in the produce-air regions
Energy conservation equation in single produce items
Auxiliary algebraic equations

Solution of systems of discretisation equations
• The solution of the systems of discretisation equations followed the SIMPLER procedure (Patankar, 1980).
• GMRES (Generalised Minimum Residual) iterative method was employed to solve the systems of algebraic equations in each inner iteration step (Kelley, 1995).

• The solvers were written in C language.
• Java interface was employed to integrate the solvers with the other model components.
• Users interact with the software via three components: • System Designer
• Solution Monitor
• Visualization Tool.

Journal of Food Engineering, Vol. 77, 2005, pp.1048–1058
A CFD modeling system for airflow and heat transfer in ventilated packaging for fresh foods: II. computational solution, software development and model testing
Zou, Q., Opara, L.U. and McKibbin, R.

Model Testing

Model Testing
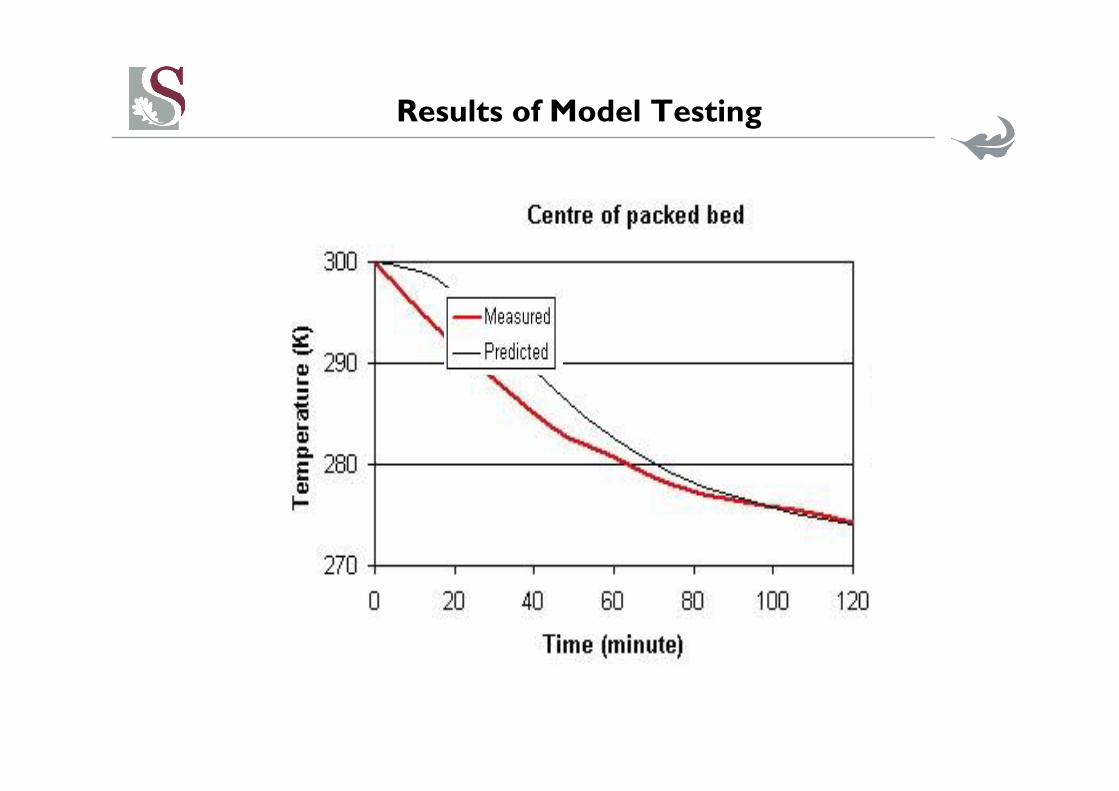
Results of Model Testing

Int. J. Postharvest Technology and Innovation, Vol. 1, No. 2, 2006, 155-169
Novel computational fluid dynamics simulation software for
thermal design and evaluation of horticultural packaging
Linus U. Opara*Postharvest Technology Research Programme and Agricultural
Experiment Station, College of Agricultural and Marine Sciences,
Sultan Qaboos University, Al-Khod, Sultanate of Oman
E-mail: [email protected] *Corresponding author
Qian ZouFood Systems and Technology,
AgResearch Limited,
Ruakura MIRINZ Centre,
Hamilton, New Zealand
E-mail: [email protected]
Keywords: computational fluid dynamics; horticultural produce;
innovation; packaging; thermal design.
Copyright © 2006 Inderscience Enterprises Ltd.

Components of ‘CoolSimu’ simulation software

CoolSimu: A User-friendly software

International Journal of Food
Engineering
Volume 3, Issue 5 2007 Article 16
Sensitivity Analysis of a CFD Modelling
System for Airflow and Heat Transfer of Fresh
Food Packaging: Inlet Air Flow Velocity and
Inside-Package Configurations
Linus U. Opara Qian Zou†
KEYWORDS: CFD modeling, airflow, heat transfer, ventilated packaging, fruit
temperature, sensitivity analysis
Copyright ©2007 The Berkeley Electronic Press. All rights reserved.

Sensitivity Analysis
4-Layered Cardboard Package

Variations in vent area (±±±± 20% change on both back and front walls)
• Variations in the vent area did not have significant effect on model predictions in the near-inlet regions, but had noticeable influence in the package centre and near-outlet regions (areas can be easily measured to the required accuracy)
Positions
Predicted product centre temperature
(K) for the specified vent areas Temperature difference (K)
400 mm2 320 mm2 480 mm2 320-400 mm2 480 -400 mm2
Cell (1, 3, 1) 276.65 277.35 276.00 0.70 -0.65
Cell (3, 3, 1) 284.66 286.06 283.34 1.40 -1.32
Cell (3, 1, 1) 281.22 282.71 280.26 1.49 -0.96
Cell (5, 3, 1) 287.19 288.07 286.28 0.88 -0.91
Cell (1, 3, 2) 274.36 274.69 274.07 0.33 -0.29
Cell (3, 3, 2) 281.47 282.33 280.20 0.86 -1.27
Average 279.62 280.61 278.77 0.99 -0.85

Variations in vent position on the carton(lowering the positions of the vents on both back and
front walls by 30mm)
Positions
Predicted product centre temperature (K) for
the specified vent positionsTemperature
difference
(K) Base case 30mm lower
Cell (1, 3, 1) 276.65 275.66 -0.99
Cell (3, 3, 1) 284.66 281.67 -2.99
Cell (3, 1, 1) 281.22 279.89 -1.33
Cell (5, 3, 1) 287.19 285.26 -1.93
Cell (1, 3, 2) 274.36 273.10 -1.26
Cell (3, 3, 2) 281.47 277.40 -4.07
Cell (3, 1, 2) 279.34 278.11 -1.23
Cell (5, 3, 2) 286.50 282.90 -3.60

Variations in vent position on the carton(lowering the positions of the vents on both back and
front walls by 30mm)
• Vent position significantly affected model predictions, as it alters the distribution of airflow among the produce layers, and consequently affects the heat transfer between air and produce items.
Cell (3, 3, 4) 279.08 281.81 2.73
Cell (3, 1, 4) 278.09 280.17 2.08
Cell (5, 3, 4) 282.92 285.11 2.19
Positions
Predicted product centre temperature (K) for
the specified vent positionsTemperature
difference (K) Base case 30mm lower

Airflow and heat transfer inside ventilated packaging
containing six tray layers of fruit: CFD simulation results
and experimental validation
Linus U. Opara Qian Zou
Keywords: CFD; Airflow; Heat transfer; Forced-air cooling; Fruit trays;
Simulation; Model validation; Flow visualization; Tray layers

Simulation of Fruit Cooling Inside 6-Layered Cardboard Package

Predicted airflow pattern and pressure distribution on the top (6th) produce layer XY surface, Z=6) inside a 'Standard' 6-layer apple carton
Predicted airflow pattern and pressure distribution in the bottom (1st) produce layer (XY surface, Z=1) inside a 'Standard' 6-layer apple carton
Predicted airflow pattern and pressure distribution in the 5th produce layer (XY surface, Z=5) inside a 'Standard' 6-layer apple carton

Predicted air and produce temperature profile in the top (6th) produce layer (XY surface, Z=6) in a 'Standard' 6-layer apple carton after 1 hour of cooling.
Predicted air and produce temperature profile in the 5th
produce layer (XY surface, Z=5) in a 'Standard' 6-layer apple carton after 1 hour of cooling
Predicted air and produce temperature profile in the bottom (1st) produce layer (XY surface, Z=1) in a 'Standard' 6-layer apple carton after 1 hour of cooling

Temperature profiles in the centre of produce items in the top (6th) layer
Temperature profiles in the centre of produce items in the 5th layer (nearest to the vent)

Conclusions
• Airflow patterns and heat transfer processes inside layered and bulk packaging for fresh produce are complex
• We developed and tested a CFD model for predicting the thermal performance inside such complex packaging systems

Conclusions
• Extensive model testing gave fairly good and consistent agreement with experimental data on product cooling rates
• In all carton layers, the model slightly under-predicted the cooling rates of the produce items located
• along package sidewalls and
• in the middle of the carton
Conclusions
Sensitivity analysis of model predictions:
• Changes in vent size (area) did not significantly affect model predictions in the near-inlet regions, but had noticeable influence in the package centre and near-outlet regions;
• Vent position significantly affected model predictions;
• Model predictions were very sensitive to variation in the width of air gaps between trays and package walls.

TH A N K TH A N K TH A N K TH A N K Y O U !Y O U !Y O U !Y O U !


