
Proceedings of International and INCCOM-6 Conference Future Trends in Composite Materials and Processing
December 12-14, 2007 Indian Institute of Technology Kanpur
STUDIES ON ACOUSTIC RADIATION FROM RECTANGULAR
COMPOSITE PANELS
B. Pattabhi Ramaiah ∗a , B. Rammohan∗ , T.S.S. Narayana■
∗ Scientists, Aeronautical Development Establishment (ADE), DRDO, Bangalore ■ Project Manager, NVH Group, CADES Digitech Pvt. Ltd, Bangalore
ABSTRACT
Material tailoring of structures, use of damping layers, attaching point masses are some of the methods attempted by researchers for reducing the acoustic radiation from the vibrating panels. In applications like submarines and ships, it may help to achieve the control over the directivity of the externally radiated sound, in addition to attenuating it to the extent possible. In an attempt to achieve the above objective, an analytical study is performed to estimate the radiated sound and its directivity from a simply supported rectangular composite panel (set in a baffle) excited by a point force. Further, to obtain a change in the directivity, point masses have been attached to the composite panel at certain locations. The aim is to identify the size, number and locations of the point masses as well as the frequency of excitation at which there is a significant change in directivity. The forced response analysis of the panel with attached point masses is done through the Receptance method. The analytical results have been compared with the results obtained from the commercially available numerical codes.
1. INTRODUCTION
The prime objective of the structural engineer is to design an airframe whose flight envelope is limited by engine power rather than its structural limitations. One of the situations faced in a typical Aircraft industry is quietening of a radiating panel set into vibration by various forces using a closed form solution rather than Numerical techniques.
Material tailoring of structures [1], where the authors solved the problem in two steps, for designing structures that radiate sound inefficiently in light fluids. In first step, given a frequency and over all geometry of the structure, a surface velocity distribution is found that produces a minimum radiation condition. Second, a distribution of Young’s modulus and density distribution is found for the structure such that it exhibits the weak radiator velocity profile as one of its mode shapes.
Lamancusa and Wodtke [2] discussed the use of damping layers in sound power minimization. They mainly concentrated on the minimization of sound power radiated from plates under broad band excitation by redistribution of unconstrained damping layers, by assuming the total radiated sound power is represented by the power radiated at structural resonances. Other methods include reduction of dynamic compliance, Jog [3] and point mass attachments to structures, St.Pierre [4]. These methods are grouped as passive methods of noise attenuation, which work well at high frequencies.
Complimentary to this is the active noise control technique that covers the lower frequency range. In active noise control, global control can be achieved for enclosed sound fields at low frequencies, due to modal behaviour, by appropriate placement of sensors and actuators, Elliott ad Curtis [5]. In contrast, global control in unbounded domains, such as external radiation is a challenge. Guo and Pan [6] have demonstrated active noise control in free field environments. It requires appreciable hardware and achieves reasonable broadband control when the microphones and speakers are optimally located in the sound field. In the free fields, exact cancellation of sound occurs only when the secondary source is a replica of the primary and placed at the same location, which cannot happen in practice.
In applications such as stealth in submarines and ships, one alternative might be to achieve the control over the directivity of the external radiated sound, rather than attenuating sound totally; a Corresponding Author: [email protected]
1
Even in industrial applications it is useful to direct the sound away from the work place and make the environment acceptable. The present work is aimed at achieving a change in directivity of a point driven simply supported plate set in baffle by attaching point masses to it. The main strategy here involves deliberate changes in mode shapes of the radiator in order to achieve the objective. The analysis for the point mass attachments, determination of new resonances, modes and the response, is performed using the Receptance method [7-9].
The natural frequencies and mode shapes of a simply supported composite plate are given in [10], in semi analytic form. Using the natural frequencies and mode shapes, the response of the simply supported plate to appoint force can be computed [7]. Knowing the plate response, the pressure field radiated from the plate set in the baffle can be estimated using the Rayleigh integral and the sound power from the plate can be calculated as explained in [12].
The mode shapes of the simply supported panel with attached point masses to it can be obtained using the Receptance method as described in section 2. The advantage of the Receptance method is that it is totally analytical and does not require any packages like FEM. The new mode shapes can be computed in terms of the old modes. Once the new modes are known, the response of the plate to a point force with attached masses can be computed. And the acoustic pressure of the new system is obtained using Rayleigh integral. The method has the advantage that the new mode shapes and natural frequencies are expressible in terms of the original modes and the natural frequencies. The strategy can be easily programmable in a computational package like MatLab. Thus, the salient feature of this paper is the simplicity with which a constraint can be implemented analytically, which affords quick physical insights and helps to make a quick decision.
2. THE RECEPTANCE THEORY
The Receptance method is well developed and a detailed description for plates can be found in [7]. With the Receptance method, vibration characteristics of a combined system, for instance, a plate attached with a mass, are calculated from the characteristics of the component systems, in this case the plate and the mass. A Receptance is defined as
ijα = Deflection response of system A at location i / Harmonic force or moment input To system A at location j (1)
The response may be either a line deflection or a slope. Usually, the subsystems are labeled A, B, C and so on, and the Receptances are labeled γβα ,, and so on. From Maxwell’s Reciprocity theorem jiij αα = .
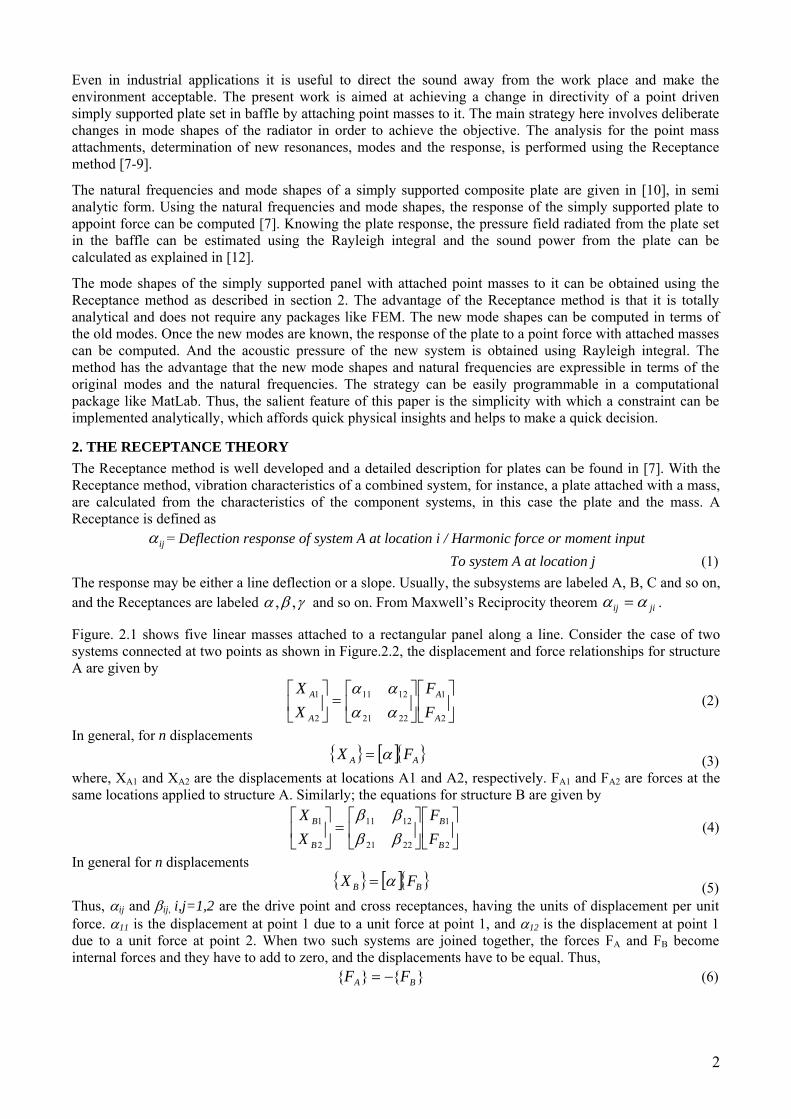
Figure. 2.1 shows five linear masses attached to a rectangular panel along a line. Consider the case of two systems connected at two points as shown in Figure.2.2, the displacement and force relationships for structure A are given by
(2) ⎥⎦
⎤⎢⎣
⎡⎥⎦
⎤⎢⎣
⎡=⎥
⎦
⎤⎢⎣
⎡
2
1
2221
1211
2
1
A
A
A
A
FF
XX
αααα
In general, for n displacements
{ } [ ]{ }AA FX α= (3) where, XA1 and XA2 are the displacements at locations A1 and A2, respectively. FA1 and FA2 are forces at the same locations applied to structure A. Similarly; the equations for structure B are given by
(4) ⎥
⎦
⎤⎢⎣
⎡⎥⎦
⎤⎢⎣
⎡=⎥
⎦
⎤⎢⎣
⎡
2
1
2221
1211
2
1
B
B
B
B
FF
XX
ββββ
In general for n displacements
{ } [ ]{ }BB FX α= (5)
Thus, αij and βij, i,j=1,2 are the drive point and cross receptances, having the units of displacement per unit force. α11 is the displacement at point 1 due to a unit force at point 1, and α12 is the displacement at point 1 due to a unit force at point 2. When two such systems are joined together, the forces FA and FB become internal forces and they have to add to zero, and the displacements have to be equal. Thus,
B
}{}{ BA FF −= (6)
2
and }{}{ BA XX = (7)
Figure 2.1. Five masses attached to a plate along a line
Figure 2.2. Two structures A and B connected at two points 1 and 2
where the curly brackets indicate force and displacement vectors. By combining equations (1) to (7) the following expression is obtained,
0)()(0)()(
2222212121
2121211111
=+++=+++
AA
AA
FFFF
βαβαβαβα
(8)
In general,
[ ] [ ] 0}]{[ =+ AFβα (9) FA1= FA2= 0 being trivial solutions, the non-trivial solution is found by setting the determinant
.0
22222121
12121111 =++++
βαβαβαβα
(10)
For the case of a single mass, Eqn. (10) becomes
01111 =+ βα (11)
Thus, one needs to know the α’s and the β’s of the two structures. A simply supported plate is attached with masses is considered for the present work. Let the α’s belong to the plate and the β’s to the masses. The 2x2 receptance matrix [α] for the composite laminate is derived below. The bending equation of the 2D orthotropic symmetric composite panel is given by [11]
( ) ( )tyxftwh
ywD
yxwDD
xwD pp ,,22 2
2
4
4
2222
4
66124
4
11 =∂∂
−∂∂
+∂∂
∂++
∂∂ ρ
The harmonic point force damped response at point (x, y) of a rectangular plate due to a harmonic point force at (x
(12)
p,yp) on the panel is given by [7]
∑∑
= =
Φ+−Γ
=1 1
22 ),()2*(
)1),,(m n
mnmnmnmn
tpp
mn
yxj
FextyxW
ωωξωω
ω∞ ∞ Φ ,( jmn y
(13)
where is the material constant, and is given by mnΓ
(14) ∫ ∫Φ=Γa b
mnmn dxdy0 0
2
If λ is the equivalent viscous damping factor, the modal damping coefficient mnξ is given by
3
mnpp
mn h ωρλξ
2= (15)
mnΦ Represents the mode shapes of the plate, given by [10]
)()(),( yYxXyxmn =Φ (16) where X(x) and Y(y) are chosen as the fundamental mode shapes of the beam having the simply supported boundary conditions. And the expressions for X and Y are given by [10]
⎟⎠⎞
⎜⎝⎛=
axmxX πsin)(
The functions Y(y) are obtained by replacing x by y and a by b and m by n in equation (16). The natural frequencies
for m = 1,2,3, …. (17)
mnω of the Simply Supported plate are given by
( )⎥⎥⎦
⎤
⎢⎢⎣
⎡⎟⎠⎞
⎜⎝⎛+⎟
⎠⎞
⎜⎝⎛
⎟⎠⎞
⎜⎝⎛++⎟
⎠⎞
⎜⎝⎛=
4
22
22
6612
4
112 221
bnD
bn
amDD
amD
hpp
mnππππ
ρω (18)
Thus 11α is given by, using Equations (1) and (13)
( ) ),(),(1
112211
111
111 yxyx
heFX
mn
mn
mn
nmmnpptj Φ
−
ΦΓ
== ∑∑∞
=
∞
= ωωρα ω
(19)
and 12α is given by,
( ) ),(),(1
112222
112
112 yxyx
heFX
mn
mn
mn
nmmnpptj Φ
−
ΦΓ
== ∑∑∞
=
∞
= ωωρα ω (20)
The Receptance of mass can be found by knowing the steady state response of a mass to a harmonic force input. From Newton’s second law
(21) tjBB
tjB eXmeF ωω ω 1
211 −=
Thus,
1
111
B
B
FX
=β = 21
1ωBm
− (22)
Hence, for a plate connected to two masses, from Eqn. (10), the Receptance matrix appear as,
.01
1
22
2221
1221
11
=−
−
ωαα
αω
α
B
B
m
m (23)
The structure of the matrix can now be extended to the case where N masses are attached. The determinant of the NxN receptance matrix set to zero gives the new natural frequencies of the plate-mass system. The new mode shapes of the plate-mass system can be determined from the forced response expression of the original plate [7]. For the case of plate with single mass, Eqn. (2) gives the new mode shape, when ω, the excitation frequency, is set to the new natural frequency and (xp, yp) is set to the coordinates of the point of mass attachment (xm, ym). For the N mass case the characteristic equation is an NxN matrix whose determinant is set to zero, and there will be N roots, which are the new resonances. Since the plate is constrained at N points through N point masses, it will experience point forces at those N locations. The magnitudes of these point forces are given by the elements of the eigenvector corresponding to the zero Eigen value of the receptance matrix evaluated at the new natural frequency ωk. Thus, the new kth mode shape is given by substituting ωk for ω in Eqn. (2) with an additional summation term as follows
( ) ( yxFyx
yx mn
kmn
kiiimn
N
i
nmmnk ,
),(1),(
22
1
11Φ
−
Φ
Γ=Φ
∑∑∑ =
∞
=
∞
= ωω) (24)
4
where Fik is the ith element of the eigenvector of the zero eigen value, corresponding to the kth new natural frequency and (xi, yi)are the location of the ith mass.
The response of the plate-mass system to a point force can again be calculated using the new mode shapes, Eqn. (23) as
( ) ),(2*
),(11),,(22
1yx
j
Feyxh
tyxW k
kkk
tjppk
K kpp
Φ+−
Φ
Γ= ∑
∞
= ωωξωωρ
ω
(25)
where, F is the force amplitude at location (xp,yp) ωk the kth natural frequency in rad/s, ξk the modal damping coefficient, given by
kppk h ωρ
λξ2
= (26)
and
(27) dxdyk
ba
k2
00
Φ=Γ ∫∫
3. SOUND CALCULATIONS
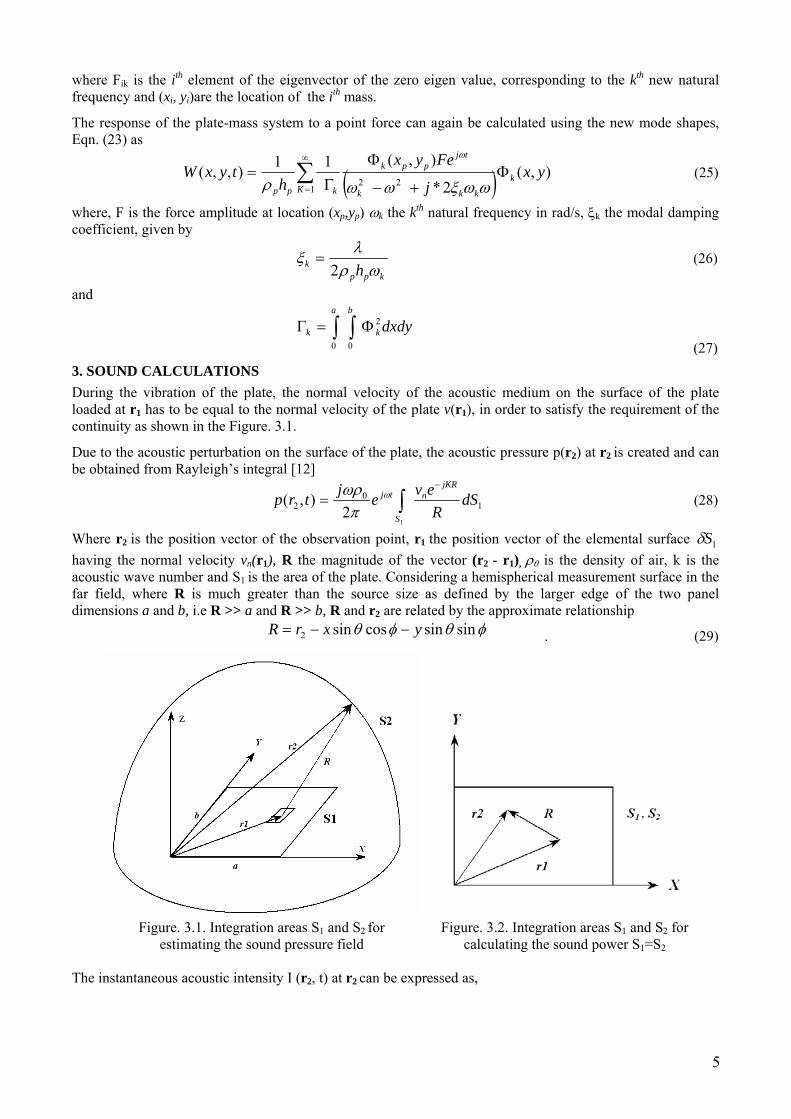
During the vibration of the plate, the normal velocity of the acoustic medium on the surface of the plate loaded at r1 has to be equal to the normal velocity of the plate v(r1), in order to satisfy the requirement of the continuity as shown in the Figure. 3.1.
Due to the acoustic perturbation on the surface of the plate, the acoustic pressure p(r2) at r2 is created and can be obtained from Rayleigh’s integral [12]
1
02
12
),( dSR
evejtrpjKR
n
S
tj−
∫= ω
πωρ
(28)
Where r2 is the position vector of the observation point, r1 the position vector of the elemental surface 1Sδ having the normal velocity vn(r1), R the magnitude of the vector (r2 - r1), ρ0 is the density of air, k is the acoustic wave number and S1 is the area of the plate. Considering a hemispherical measurement surface in the far field, where R is much greater than the source size as defined by the larger edge of the two panel dimensions a and b, i.e R >> a and R >> b, R and r2 are related by the approximate relationship
φθφθ sinsincossin2 yxrR −−= . (29)
Figure. 3.1. Integration areas S1 and S2 for estimating the sound pressure field
Figure. 3.2. Integration areas S1 and S2 for calculating the sound power S1=S2
The instantaneous acoustic intensity I (r2, t) at r2 can be expressed as,
5
( ) ( ){ }trvtrptrI ,,Re
21),( 2
*212 =
(30) where v(r2, t) is the normal velocity of the acoustic medium at r2 and * denotes it’s complex conjugate. The intensity I, which is the time average of I(t), i.e the time averaged rate of energy transmission through a unit area normal to the direction of propagation, is given by
( )c
rpI
0
2
2,,
ρφθ
= (31)
And the sound pressure level at a particular point is given by
refp p
pL log20= (32)
Where pref is the reference pressure, which is 20 μ Pa. The sound power Wp radiated into the semi-infinite space above the plate can be estimated from (33) 22
1
)( dSrIWS
p ∫=
where S2 is an arbitrary surface which covers area S1 and r2 is the position vector of S2, see Figure. 3.1. Substituting equations (32) and (34) into Eqn (36) and allowing S2 = S1 then r1 and r2 would represent any two arbitrary position vectors on the surface of the plate as shown in Figure. 3.2. The power radiated by the plate can then be expressed as [2]
22
0 0 0 0112
*1
0 )()sin()(4
dydxdydxrvRkRrvW
a b a b
p ∫ ∫ ∫ ∫ ⎥⎦
⎤⎢⎣
⎡=
πωρ
(34)
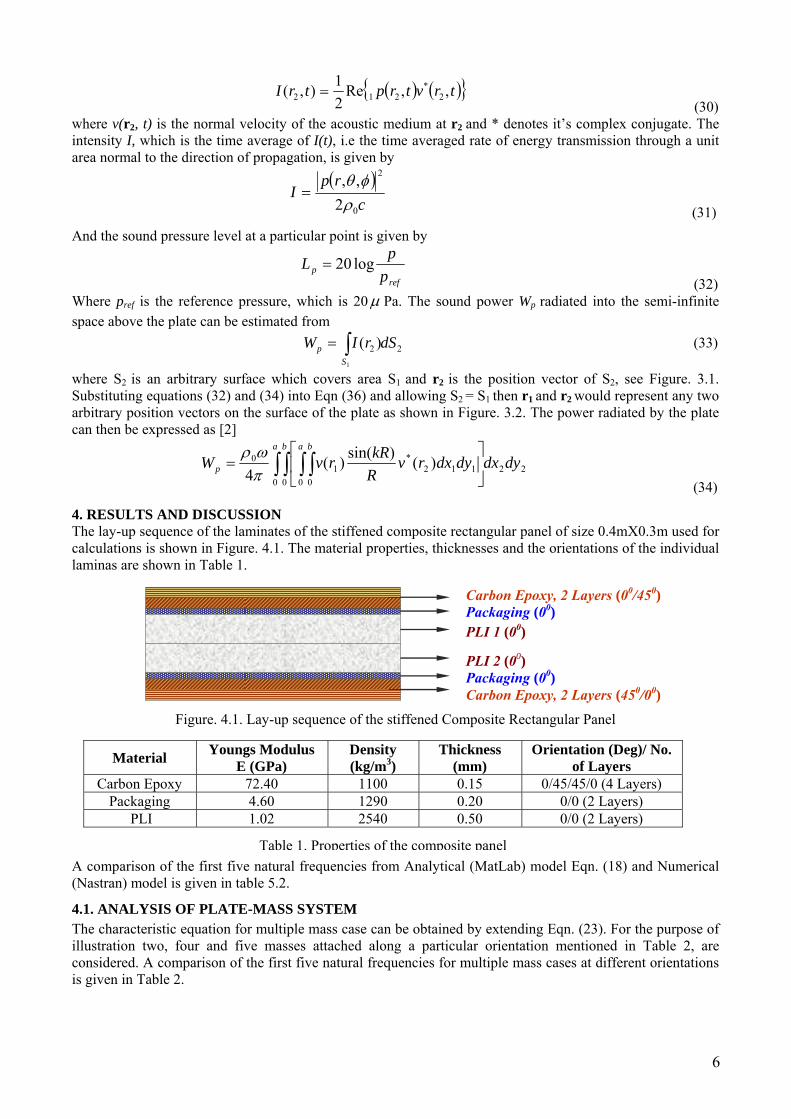
4. RESULTS AND DISCUSSION The lay-up sequence of the laminates of the stiffened composite rectangular panel of size 0.4mX0.3m used for calculations is shown in Figure. 4.1. The material properties, thicknesses and the orientations of the individual laminas are shown in Table 1.
Carbon Epoxy, 2 Layers (00/450) Packaging (00)
PLI 1 (00)
PLI 2 (0
Packaging (00) Carbon Epoxy, 2 Layers (450/00)
0)
Figure. 4.1. Lay-up sequence of the stiffened Composite Rectangular Panel
Material Youngs Modulus E (GPa)
Density (kg/m3)
Thickness (mm)
Orientation (Deg)/ No. of Layers
Carbon Epoxy 72.40 1100 0.15 0/45/45/0 (4 Layers) Packaging 4.60 1290 0.20 0/0 (2 Layers)
PLI 1.02 2540 0.50 0/0 (2 Layers)
Table 1. Properties of the composite panelA comparison of the first five natural frequencies from Analytical (MatLab) model Eqn. (18) and Numerical (Nastran) model is given in table 5.2.
4.1. ANALYSIS OF PLATE-MASS SYSTEM
The characteristic equation for multiple mass case can be obtained by extending Eqn. (23). For the purpose of illustration two, four and five masses attached along a particular orientation mentioned in Table 2, are considered. A comparison of the first five natural frequencies for multiple mass cases at different orientations is given in Table 2.
6

After calculating the new resonances the corresponding modes and response can be obtained from Eqns (28) and (29) respectively. A comparison of the response is provided in Figure. 3.3.
Without Masses Two Masses, along 200 line
Four Masses, along 400 line
Five Masses, along 600 line Mode Analytical Numerical Analytical Numerical Analytical Numerical Analytical Numerical
(Hz) (Hz) (Hz) (Hz) (Hz) (Hz) (Hz) (Hz) 62.05 57.21 56.94 52.76 52.36 54.51 1 62.3 54.21
139.87 130.10 128.83 121.83 122.72 118.01 2 140.7 116.20 173.90 155.09 155.04 160.66 157.32 149.52 3 173.8 150.18 246.23 222.89 221.96 208.09 210.11 218.44 4 249.4 218.70 274.59 272.39 273.18 247.24 241.11 245.81 5 272.9 241.28
Table 2. Comparison of Natural Frequencies of the plate with two, four and five-mass system From analytical and numerical models.
MATLAB NASTRAN
Figure. 4.2.1 Mode 2 with two masses
along 200 line at 130.1 Hz
Figure. 4.2.2. Mode 2 with two masses along 200 line at 128.83 Hz
Figure. 4.2.3. Mode 4 with four masses
along 400 line at 208.09 Hz Figure. 4.2.4. Mode 4 with four masses
along 400 line at 210.11 Hz
Figure. 4.2.5. Mode 3 with five masses
along 600 line at 149.52 Hz
Figure. 4.2.6. Mode 3 with five masses
along 600 line at 150.18 Hz
Figure 4.2: Comparison of Mode Shapes from Analytical Model and Nastran.
7

Figure. 4.3. Point force Response of the panel from MatLab at 200 Hz with five masses
attached along 600 line
Figure. 4.4. Point force Response of the panel from Nastran at 200 Hz with five masses
attached along 600 line
Figure 4.2 shows a comparison of the mode shapes from MatLab and Nastran for different conditions. A comparison of point force response is provided in figures 4.3 and 4.4 respectively. From Table 2 and Figures 4.2, 4.3 and 4.4 it can be concluded that the analytical results are in agreement with the numerical results.
100 180 260 340 420 500 580 660 740 820 900 980 1060 1140 1220 1300 1380 1460 1540 1620 1700 1780 1860 1940200060
65
70
75
80
85
90
95
100
105
110
Frequency (Hz)
Soun
d Pr
essu
re L
evel
(dB
)
Variation of Sound Pressure Level with Frequency
Figure 4.5. Variation of Sound Pressure Level (dB) with frequency (Hz)
100 180 260 340 420 500 580 660 740 820 900 980 1060 1140 1220 1300 1380 1460 1540 1620 1700 1780 1860 1940 200065
70
75
80
85
90
95
100
105
110
115
Frequency (Hz)
Soun
d Po
wer
(dB
)
Variation Sound Power with Frequency
Figure 4.6. Variation of Sound Power (dB) with frequency (Hz)
8
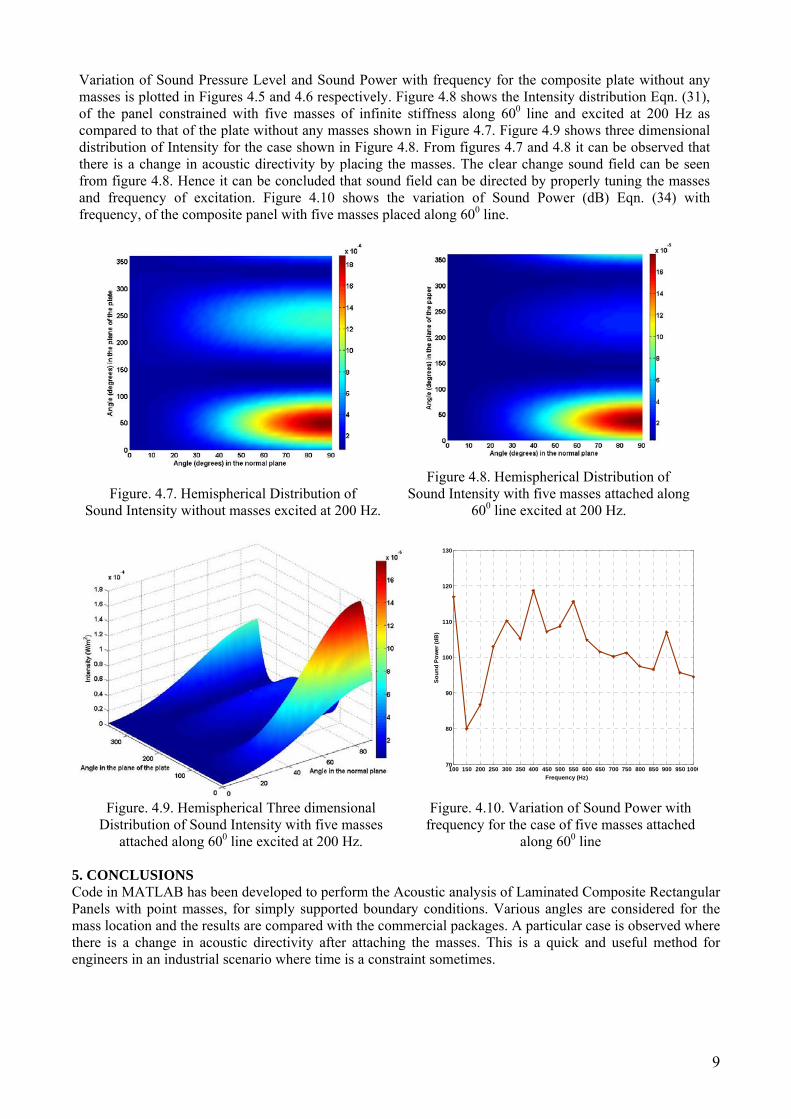
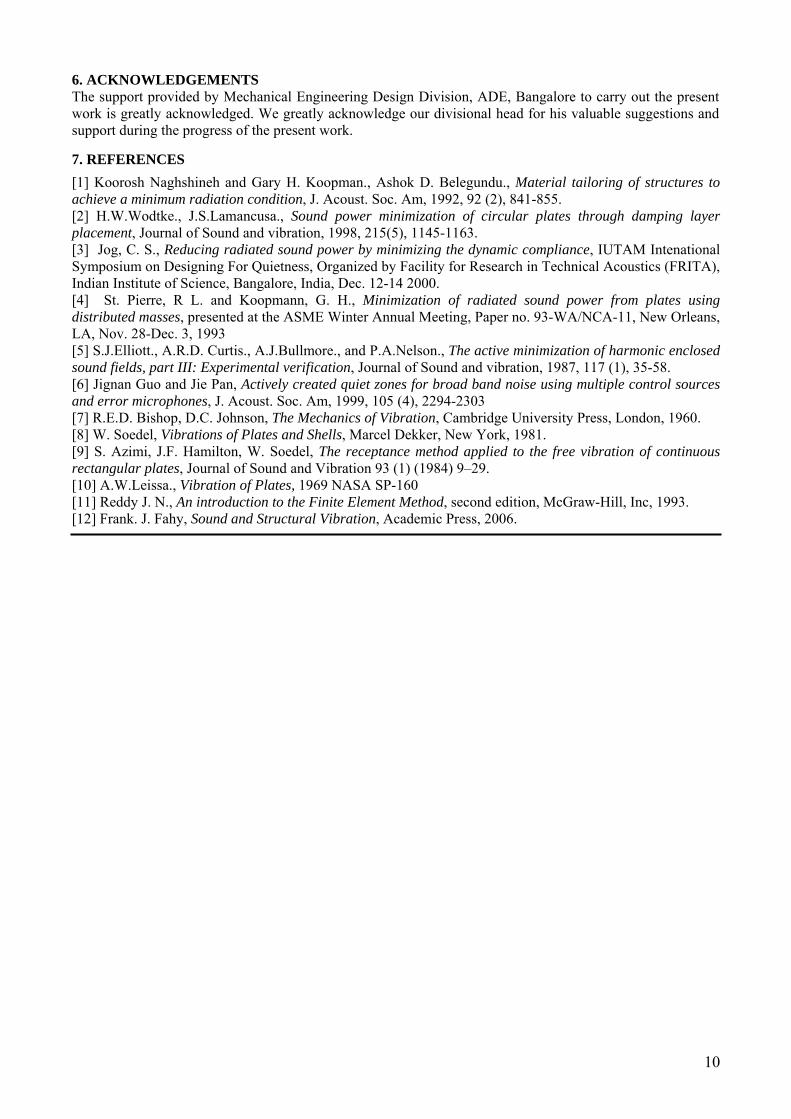
Variation of Sound Pressure Level and Sound Power with frequency for the composite plate without any masses is plotted in Figures 4.5 and 4.6 respectively. Figure 4.8 shows the Intensity distribution Eqn. (31), of the panel constrained with five masses of infinite stiffness along 600 line and excited at 200 Hz as compared to that of the plate without any masses shown in Figure 4.7. Figure 4.9 shows three dimensional distribution of Intensity for the case shown in Figure 4.8. From figures 4.7 and 4.8 it can be observed that there is a change in acoustic directivity by placing the masses. The clear change sound field can be seen from figure 4.8. Hence it can be concluded that sound field can be directed by properly tuning the masses and frequency of excitation. Figure 4.10 shows the variation of Sound Power (dB) Eqn. (34) with frequency, of the composite panel with five masses placed along 600 line.
Figure. 4.7. Hemispherical Distribution of Sound Intensity without masses excited at 200 Hz.
Figure 4.8. Hemispherical Distribution of Sound Intensity with five masses attached along
600 line excited at 200 Hz.
100 150 200 250 300 350 400 450 500 550 600 650 700 750 800 850 900 950 100070
80
90
100
110
120
130
Frequency (Hz)
Soun
d Po
wer
(dB
)
Figure. 4.9. Hemispherical Three dimensional
Distribution of Sound Intensity with five masses attached along 600 line excited at 200 Hz.
Figure. 4.10. Variation of Sound Power with frequency for the case of five masses attached
along 600 line 5. CONCLUSIONS Code in MATLAB has been developed to perform the Acoustic analysis of Laminated Composite Rectangular Panels with point masses, for simply supported boundary conditions. Various angles are considered for the mass location and the results are compared with the commercial packages. A particular case is observed where there is a change in acoustic directivity after attaching the masses. This is a quick and useful method for engineers in an industrial scenario where time is a constraint sometimes.
9
6. ACKNOWLEDGEMENTS The support provided by Mechanical Engineering Design Division, ADE, Bangalore to carry out the present work is greatly acknowledged. We greatly acknowledge our divisional head for his valuable suggestions and support during the progress of the present work. 7. REFERENCES
[1] Koorosh Naghshineh and Gary H. Koopman., Ashok D. Belegundu., Material tailoring of structures to achieve a minimum radiation condition, J. Acoust. Soc. Am, 1992, 92 (2), 841-855. [2] H.W.Wodtke., J.S.Lamancusa., Sound power minimization of circular plates through damping layer placement, Journal of Sound and vibration, 1998, 215(5), 1145-1163. [3] Jog, C. S., Reducing radiated sound power by minimizing the dynamic compliance, IUTAM Intenational Symposium on Designing For Quietness, Organized by Facility for Research in Technical Acoustics (FRITA), Indian Institute of Science, Bangalore, India, Dec. 12-14 2000. [4] St. Pierre, R L. and Koopmann, G. H., Minimization of radiated sound power from plates using distributed masses, presented at the ASME Winter Annual Meeting, Paper no. 93-WA/NCA-11, New Orleans, LA, Nov. 28-Dec. 3, 1993 [5] S.J.Elliott., A.R.D. Curtis., A.J.Bullmore., and P.A.Nelson., The active minimization of harmonic enclosed sound fields, part III: Experimental verification, Journal of Sound and vibration, 1987, 117 (1), 35-58. [6] Jignan Guo and Jie Pan, Actively created quiet zones for broad band noise using multiple control sources and error microphones, J. Acoust. Soc. Am, 1999, 105 (4), 2294-2303 [7] R.E.D. Bishop, D.C. Johnson, The Mechanics of Vibration, Cambridge University Press, London, 1960. [8] W. Soedel, Vibrations of Plates and Shells, Marcel Dekker, New York, 1981. [9] S. Azimi, J.F. Hamilton, W. Soedel, The receptance method applied to the free vibration of continuous rectangular plates, Journal of Sound and Vibration 93 (1) (1984) 9–29. [10] A.W.Leissa., Vibration of Plates, 1969 NASA SP-160 [11] Reddy J. N., An introduction to the Finite Element Method, second edition, McGraw-Hill, Inc, 1993. [12] Frank. J. Fahy, Sound and Structural Vibration, Academic Press, 2006.
10