

51
Part II
Multiscale Dynamics of Subduction Zones

52

53
Chapter 3 A Low Viscosity Wedge in Subduction
Zones
Published in Earth and Planetary Science Letters by Magali I. Billen and Michael Gurnis,
in press, 2001.
54
Abstract
Geochemical, petrologic and seismological observations indicate that there may be
high concentrations of water in the region above a subducting slab (the mantle wedge),
which could decrease the viscosity of the mantle locally by several orders of magnitude.
Using numerical models we demonstrate that a low viscosity wedge has a dramatic
influence on the force balance in a subduction zone and leads to an observable signal in
the topography, gravity and geoid. A regional dynamic model of the Tonga-Kermadec
subduction zone shows that the viscosity of the wedge is at least a factor of 10 smaller
than surrounding mantle lithosphere and asthenosphere, consistent with estimates
from seismic dissipation and deformation experiments.

55
3.1 Introduction
The mantle wedge is the region of the mantle lithosphere and asthenosphere that lies
above a subducting oceanic plate and beneath the overriding plate in a convergent
margin. The wedge plays an important role in subduction zone processes: the vis-
cosity (η) of the wedge links the negative buoyancy force of the sinking slab to the
surface, while melt generation in the wedge links the input of volatiles from the slab
[Morris et al., 1990] to magma extruded at the island arc and back arc spreading
center. However, these dynamic and geochemical/petrologic processes in the wedge
do not act independently: the viscosity of the wedge, which affects the dynamics, de-
pends on the presence of volatiles and melt, the temperature distribution (which itself
depends on melting) and the deformation mechanism [Hirth and Kohlstedt, 1996].
Subduction dynamics depends on the buoyancy of the subducting plate, the vis-
cosity structure of the mantle, and coupling between the subducting and overriding
plate. The location and morphology of the subducted lithosphere, delineated by deep
seismicity [Hamburger and Isacks, 1985] and tomographic images [Zhao et al., 1997],
constrain the buoyancy of the slab, while the viscosity structure is constrained by
surface observations. For example, observations sensitive to the viscosity structure
include: (a) geoid and gravity anomalies (Figure 3.1A), which have a long wavelength
high and short wavelength low directly over subduction zones [Kaula, 1972; Watts
and Talwani, 1974] and (b) topography (Figure 3.1C), characterized by the morphol-
ogy and depth of the trench, the presence (or lack) of a forebulge and high or low
topography on the overriding plate [Bodine and Watts, 1979]. Surface observables
over subduction zones vary over several scales and therefore the physics required to
explain these features is complex.
Previous analytic and numerical models fail to adequately reproduce the multiscale
characteristic of subduction zone surface observables such as topography and geoid.
For example, thin elastic plate models for the subducting plate match gross trench
morphology and short wavelength gravity [Bodine and Watts, 1979], but are not
dynamic given that the forces driving deformation are not considered. Dynamic
models, which include a radial viscosity structure, match the long wavelength geoid
56
A. B.
C. D.
165˚ 180˚ 195˚
-45˚
-30˚
-15˚
-150 0 150mGal
165˚ 180˚ 195˚
-45˚
-30˚
-15˚
-150 0 150mGal
-5
0
5
Km
180 185 190 195
-5
0
5
Km
180 185 190 195
20 S
-5
0
5
Km
180 185 190
-5
0
5
Km
180 185 190
25 S
-5
0
5
Km
175 180 185 190Longitude
-5
0
5
Km
175 180 185 190Longitude
30 S
0
20
m
180 185 190 1950
20
m
180 185 190 195
20 S
0
20
m
180 185 1900
20
m
180 185 190
25 S
0
20
m
175 180 185 190Longitude
0
20
m
175 180 185 190Longitude
30 S
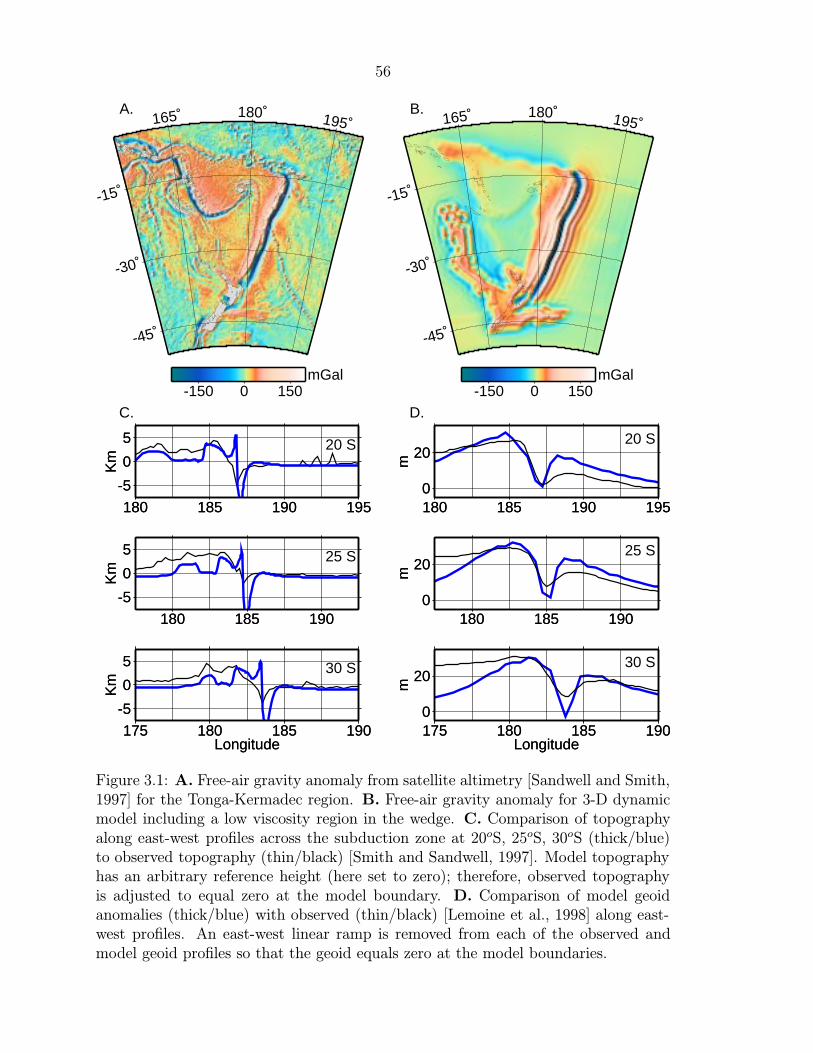
Figure 3.1: A. Free-air gravity anomaly from satellite altimetry [Sandwell and Smith,1997] for the Tonga-Kermadec region. B. Free-air gravity anomaly for 3-D dynamicmodel including a low viscosity region in the wedge. C. Comparison of topographyalong east-west profiles across the subduction zone at 20oS, 25oS, 30oS (thick/blue)to observed topography (thin/black) [Smith and Sandwell, 1997]. Model topographyhas an arbitrary reference height (here set to zero); therefore, observed topographyis adjusted to equal zero at the model boundary. D. Comparison of model geoidanomalies (thick/blue) with observed (thin/black) [Lemoine et al., 1998] along east-west profiles. An east-west linear ramp is removed from each of the observed andmodel geoid profiles so that the geoid equals zero at the model boundaries.
57
(> 1000 km) using analytic solutions of viscous flow [Hager, 1984], but observed
shorter wavelength geoid features are not predicted. Dynamic, numerical models of
subduction that include a fault interface in the lithosphere along the plate boundary
successfully reproduce 2-D trench topography [Zhong and Gurnis, 1994; Zhong et al.,
1998; Zhong and Gurnis, 1992] and match the long wavelength geoid anomaly in
2-D and 3-D regional models [Zhong and Gurnis, 1992; Moresi and Gurnis, 1996].
However, contrary to observations, these numerical models predict large (3–4 km),
negative dynamic topography on the overriding plate (in the arc/back arc region).
Such an excessively deep back arc basin in the models creates a broad (∼500 km)
depression in the gravity and geoid anomalies over the back arc, which is not observed
in active subduction zones. Down-warping of the overriding plate in subduction zone
models is a direct consequence of the dynamic coupling of the negative buoyancy force
of the slab to the overriding lithosphere through the wedge.
Geochemical and petrologic data indicate that fluids from the subducting slab are
incorporated into the wedge prior to melting to form island arc magmas [Morris et al.,
1990; Brenan et al., 1995; Tatsumi et al., 1983]. Seismic studies in subduction zones
reveal anomalies of low velocity [Hasegawa et al., 1991; Roth et al., 2000] and high
attenuation [Roth et al., 2000; Barazangi and Isacks, 1971] in the wedge that suggest
the presence of volatiles, particularly water [Karato and Jung, 1998] and possibly
melt. While melting of the slab itself may occur in limited cases as suggested by
the presence of high Mg# andesites (adakites), which include a component derived
from partial melting of subducted slab [Yogodzinski et al., 1995], hydration of the
mantle and lowering of the solidus are likely the more common cause for the seismic
anomalies observed in the wedge and back arc volcanism. The majority of well-
defined quantitative experimental studies on rheology have been conducted at low
pressures (<300 MPa, e. g., Karato et al. [1986]). These studies have shown that
plastic deformation of upper mantle minerals, particularly olivine, is significantly
enhanced by the presence of water. Rheology of mantle minerals at higher pressures
is still poorly constrained. However, a recent study on olivine at pressures up to
2 GPa has established a quantitative flow law for olivine that can be extrapolated
to higher pressure conditions [Karato and Jung, submitted]. This work combined

58
with the results of Kohlstedt et al. [1996] suggests that at the higher water fugacity
conditions likely in the deep upper mantle in subduction zones, weakening effects of
water will be much more pronounced. These observations and experiments suggest
the viscosity in the region above a subducting slab may be substantially less than
the background asthenosphere and mantle lithosphere. Such a low viscosity wedge
(LVW) could affect the flow, force balance and surface deformation in a subduction
zone, as well as processes governing the transport of fluids and generation of melt.
3.2 Dynamic Models with a Low Viscosity Wedge
We investigate the influence of a LVW on the dynamics of a subduction zone, using
a finite element model for instantaneous viscous flow. Stokes flow calculations are
solved using CitcomT [Chapter 4], a 3-D, spherical finite-element code, based on the
Cartesian code CITCOM [Moresi and Gurnis, 1996]. The momentum and continuity
equations are solved with a primitive variable formulation and validated with known
analytic solutions with large radial and lateral variations in viscosity [Zhong, 1996].
The top and bottom surfaces have free slip, isothermal boundary conditions, while
the side-walls have reflecting boundary conditions. A fault (shear zone) is included
along the subduction zone plate boundary in the upper 100 km. The fault is modeled
with boundary conditions allowing for continuous normal stress and discontinuous
tangential stress on the fault surface [Zhong and Gurnis, 1994; Zhong et al., 1998].
The presence of the fault is required for a trench to form at the plate boundary.
However, the fault discontinuity creates a stress singularity at the fault tip. This
stress singularity leads to unconstrained maximum trench depth and fore arc height.
Therefore, a yield stress, σy = 75 MPa, is used in the upper 100 km to constrain the
stress near the fault tip. In addition, for the gravity calculation, the maximum trench
depth and fore arc height are truncated at 5 km.
The model domain extends from the surface to the core-mantle boundary and
extends 45o in both longitude and latitude for 3-D models. 2-D models are taken from
an east-west cross section through the 3-D models at 28oS. The buoyancy structure
(Figure 3.2A) of the slab down to 660 km and the location of the fault interface in

59
A. B.
C. D.
5500
5750
6000
6250
175˚ 180˚ 185˚
0 500 1000 1500C
-10.0-7.5-5.0-2.50.02.55.07.5
Km
180 185 190Longitude
-10.0-7.5-5.0-2.50.02.55.07.5
Km
180 185 190Longitude
-10.0-7.5-5.0-2.50.02.55.07.5
Km
180 185 190Longitude
No LVW Deep
Shallow
Shallow
5500
5750
6000
6250
175˚ 180˚ 185˚
19 20 21 22Pa s
Deep
A
B
5500
5750
6000
6250
175˚ 180˚ 185˚
19 20 21 22Pa s
Figure 3.2: A. Temperature profile from 3-D model at 28o S used in 2-D models withuniform lithosphere thickness shown for a 15o region spanning the subduction zone.B. Comparison of dynamic topography with a deep (thin/red), shallow (thick/green)LVW and without a LVW (gray). Background radial, temperature-dependent viscos-ity structure with superimposed large, shallow LVW C. and a small, deep LVW D.Vertical white lines, labeled A and B, indicate boundaries of other LVW’s investigated(see text). Yellow line is the location of the fault interface.
the top 100 km are constrained to match the location of seismicity which extends
from the surface to a maximum depth of 660 km (Figure 3.2A). The true dip of the
fault at the surface ranges from 10–30◦. However, due to numerical constraints on
the allowed distortion of the elements, the minimum dip of the fault in the upper 10
km is 30◦.
The imposed temperature structure is obtained by first creating a steady-state
temperature model. We solve the advection-diffusion equation for 45 million years of
subduction starting with 50 myr old lithosphere [Eissen et al., 1998]. Flow velocities
are specified to follow the location of seismicity over a zone of 100 km thickness (the

60
slab) and an approximate (due to varying dip of the slab) corner flow velocity solution
above and below the slab. The background radial viscosity structure is temperature-
dependent with Newtonian viscosity. The maximum viscosity of the lithosphere and
lower mantle is 3 × 10²² Pa s and the minimum viscosity of the asthenosphere is
3 × 10²⁰ Pa s. Viscosity of the slab depends on temperature and has a maximum
value of 3.0× 10²¹ Pa s for the coldest regions.
Initially, 2-D models are used to explore the general influence of a LVW on the flow
field, dynamic topography and trade-offs between the shape of the viscosity region and
magnitude of the viscosity reduction. 3-D models for the Tonga-Kermadec subduction
zone are then used to test whether including a LVW greatly improves model agreement
with observations of topography, gravity and geoid.
3.2.1 2-D Models
Including a low viscosity region in the wedge dramatically changes the dynamic to-
pography (Figure 3.2B). Comparison of 2-D models with and without a LVW (Fig-
ure 3.2C,D) demonstrates that a LVW with a viscosity ten times smaller than the
asthenosphere viscosity reduces the down-warping of the overriding plate from a broad
depression of more than 4 km deep (equivalent model without LVW) to a narrow de-
pression of less than 2.5 km (Figure 3.2B). In addition, the trench is deeper and the
forebulge on the subducting plate is more pronounced with the LVW. Reduction of
the overriding plate topography depends on the depth and overall extent of the LVW.
A shallow, large LVW (Figure 3.2C) decreases the magnitude and lateral extent of
the down-warping more than a smaller and deeper LVW (Figure 3.2D). Decreasing
the viscosity of the wedge further (by a factor of 100 or 1000) has little effect on the
topography but does influence the pattern and magnitude of flow in the wedge. We
will return to this point in the discussion.
The reason for the change in topography and flow is clarified by examining the
change in the pressure due to the LVW. For a model without a LVW, the dynamic
pressure, P , from the top of the slab at 200 km depth to the surface is low (Fig-
ure 3.3A), indicating suction into this region (high pressure indicates expansion). Low
pressure creates a downward stress on the surface and negative dynamic topography.

61
A. B.
C. D.
5900
6000
6100
6200
6300
180˚ 182˚ 184˚ 186˚
-0.8 -0.4 -0.0 0.4 0.8P
5900
6000
6100
6200
6300
180˚ 182˚ 184˚ 186˚
-0.8 -0.4 -0.0 0.4 0.8P
5900
6000
6100
6200
6300
180˚ 182˚ 184˚ 186˚
5900
6000
6100
6200
6300
180˚ 182˚ 184˚ 186˚
Figure 3.3: Dynamic pressure, P , normalized by the maximum for A. model withouta LVW, (Pmax = 1.57 × 10² MPa) and B. model with a shallow LVW (Pmax =0.96×10² MPa). Contour interval is 0.2. Flow field (velocity, v) for C. model withouta LVW (vmax = 1.5 cm/yr) and D. model with a shallow LVW (vmax = 4.8 cm/yr).White line in A and B is the location of the fault interface.
For a model with a LVW, the pressure is higher in the wedge, increasing significantly
above the LVW, except for a region very close to the trench (Figure 3.3B). This differ-
ence in the pressure above the slab is also responsible for increasing the trench depth
and creating the forebulge. The low pressure (suction) above the slab acts to pull the
slab up supporting part of the negative buoyancy of the slab and reducing the net
downward force on the slab [Stevenson and Turner, 1977; Tovish et al., 1978]. When
the LVW is added, there is less suction above the slab acting to pull the slab up and
the coupling of the slab to the wedge is reduced because the viscosity in the wedge is
lower. These two effects act to deepen the trench due to the larger net downward force
on the subducting plate and increase the forebulge height by increasing the viscous
bending stresses within the lithosphere, outboard of the fault.
A uniform reduction of the asthenosphere viscosity does not have the same out-

62
come as reducing the viscosity within an isolated region of the wedge. The limited
extent of the LVW modifies the long and short wavelength pattern of flow. In the
model without a LVW, flow in the mantle and lithosphere is dominated by the sinking
motion of the slab and is long wavelength in character (Figure 3.3C). The presence of
the LVW interrupts the long wavelength character of the flow and creates a stronger
component of horizontal flow entering the wedge and upward flow in the wedge (Fig-
ure 3.3D). The horizontal extent of the LVW is also important. A narrower LVW,
extending only to boundary A (Figure 3.2D), allows the slab flow to couple to the
surface beyond the low viscosity region resulting in a topography depression to the
left of the boundary. While a wider region extending to boundary B (Figure 3.2D)
also reduces the amplitude of the depression (to ∼2.5 km), the long wavelength char-
acter of the flow again dominates so that this depression extends over the full extent
of the LVW rather than being isolated to a narrower region near the trench.
In addition to the models presented in Figures 3.2 and 3.3, other models were used
to investigate the effect of the dimensions and placement of the LVW. As presented
above, the width and depth to the top of the LVW have the largest influence on the
topography. The maximum depth of the LVW has little effect on the topography, but
does influence the flow. Extending the maximum depth of LVW for a wide region
(200 km wide) creates a stronger upward component of flow within the wedge.
3.2.2 3-D Models: Tonga-Kermadec Subduction Zone
We have further tested whether such a LVW is consistent with geophysical ob-
servations by comparing predictions of dynamic topography, gravity and geoid for
3-D regional models of the Tonga-Kermadec subduction zone, including a LVW
(ηlvw = 3 × 10¹⁹Pa s). We include realistic variations in the density structure of
the lithosphere due to age [Muller et al., 1997; Kroenke, 1984] [Chapter 1] and crustal
thickness [Raitt et al., 1955]. Figure 3.1 shows a comparison of observed free-air
gravity (Figure 3.1A) with the model prediction (Figure 3.1B) and comparisons of
topography (Figure 3.1C) and geoid (Figure 3.1D) for three east-west profiles across
the trench. The topography profiles agree well with the observations over the back
arc and the shape of the trench, although the maximum depth of the trench and

63
height of the fore arc and forebulge are still larger than observed.
While the applied yield stress reduces the trench and fore arc topography, the
remaining excess topography is due to residual stress near the fault. The yield stress
of 75 MPa was chosen to limit the region affected by the yield stress to the immediate
region of the fault. A lower yield stress would be more effective at reducing the
stress and the topography near the fault, but would also lead to a broad region of
weakening on the subducting plate that causes the trench to widen. The stresses in
the model depend linearly on the density anomaly of the slab. The maximum density
anomaly in the slab of 80 kg/m3 (due to the temperature anomaly) occurs int he
upper 200 km of the slab. If the density anomaly of the slab is lower than assumed
here (possibly due to a lower coefficient of thermal expansion or phase changes), then
the stresses would also be lower leading to a smaller trench, fore arc and forebulge.
The steeper dip of the fault at the surface in the models (30◦) than observed (10–
15◦) may also contribute to the forebulge topography. The steeper dip of fault in
the models (required by limitations on the maximum allowed distortion of elements
within the mesh) creates a small region of horizontal compression in the subducting
plate that may add to the forebulge height.
The model reproduces the observed long wavelength positive geoid and gravity
high with a single short wavelength depression over the trench. In order to achieve
good agreement with topography and the geoid, it is necessary to include the varia-
tions in both plate age and crustal thickness in addition to the low viscosity region in
the wedge. Models that include only variations in plate age and/or crustal thickness
variations are still dominated by the long wavelength depression in the back arc region
making it difficult to match the long wavelength geoid and gravity. Models that do
not include both lithospheric age and crustal thickness variations do not agree with
the observed topography and short wavelength gravity.
3.3 Discussion
The 2-D models demonstrate that the geometry of the LVW is important and that
neither a simple reduction of the viscosity throughout the asthenosphere nor a change

64
in the wedge viscosity from 10 to 100 times smaller than the asthenosphere viscosity
substantially influence the topography. Instead, in both these cases, we find that
the velocity increases but the pressure remains the same. This behavior is the result
of a balance of forces in which the driving force (i. e., the buoyancy of the slab)
is fixed and is balanced by viscous coupling within the asthenosphere controlling
slab descent. In this case, any reduction in viscosity is matched by an increase in
velocity to balance the driving force, keeping the pressure and resulting topography
constant. However, one can imagine several cases in which the slab descent is not
controlled by the asthenosphere viscosity: (1) if the velocity of the plates is controlled
by the strength of the oceanic lithosphere as it descends into the mantle [Conrad and
Hager, 2001]; and (2) if the slab is strong and coupled to a higher viscosity lower
mantle, so that slab rate is controlled by the viscosity of the lower mantle [Moresi
and Gurnis, 1996]. In these two cases, flow in the wedge becomes analogous to
the kinematically driven cornerflow. The velocity of the slab, Uslab, in a cornerflow
is a boundary condition that does not depend on the wedge viscosity, ηw, and the
pressure in the wedge is P ∝ −ηwUslab. In this case, since the velocity is fixed,
any reduction in the wedge viscosity reduces the magnitude of the pressure and the
basin topography on the overriding plate. However, even in this case, the shape of
the wedge becomes important. In a cornerflow, while the velocity in the wedge is
proportional to the boundary velocity and pressure is proportional to the viscosity,
the pattern or distribution of velocity and pressure remain the same. Therefore, the
only way to change the character of the flow in the wedge is to modify the geometry
of the wedge, as we have by introducing a shallow LVW.
3.3.1 Mineral Physics Constraints on Wedge Viscosity
Estimates of viscosity in the wedge depend on observed seismic wave anomalies and
attenuation, and theoretical and experimentally determined relationships between
these observations and subsolidus creep. Experiments show that both attenuation
and steady-state creep have similar activation energy and are similarly affected by
water. Both attenuation, Q−1, and viscosity, η, have an exponential dependence on

65
temperature:
Q−1 ∼ ω−α exp(−αH∗
RTeff), (3.1)
and
η ∼ ηo exp(H∗
RTeff), (3.2)
where H∗ is activation enthalpy, Teff is the rheologically effective temperature which
incorporates the effects of water, ω is frequency and α is a constant [Karato and
Spetzler, 1990]. Karato [Karato, in press] hypothesizes that the kinetics of both
attenuation and steady-state creep are affected by water through the same mechanism.
Therefore, attenuation and viscosity can be related by combining Equations (3.1) and
(3.2) [Karato, in press]:
η/ηo = (Q/Qo)(1/α), (3.3)
where α = 0.23, as determined from both seismological and experimental data [Karato
and Spetzler, 1990] and Qo is the reference attenuation. Using observations of low
Q for P waves in the wedge of the Tonga-Kermadec subduction zone of Q = 70–
150 [Barazangi and Isacks, 1971] and a reference attenuation for P waves in the
asthenosphere of Qo = 200 [Dziewonski and Anderson, 1981], Equation (3.3) predicts
that the viscosity of the wedge should range from 0.01 to 0.28 times the reference
viscosity. While Equation (3.3) provides a simple relation between attenuation and
viscosity, seismic velocity anomalies are better resolved than attenuation. P-wave
anomalies in the wedge in the Tonga region range from -2% to -6% [Zhao et al.,
1997]. A more robust estimate of the viscosity variation based on seismic velocity
([Karato, in press], Figure 5) predicts a similar reduction in the wedge viscosity of
2×10⁻² for a P wave anomaly of -2% and a much larger reduction of 8×10⁻⁴ for a P
wave anomaly of -5%. Therefore, the independent estimate of the minimum viscosity
reduction in the wedge, of least a factor of 10, from our dynamic models is well within
the range of viscosity variation predicted by mineral physics and seismic observations.
This agreement between independent estimates of the wedge viscosity supports our
hypothesis of a weak mantle wedge.

66
3.3.2 Geophysical and Geochemical Implications of a LVW
Fluids in the Wedge. The presence of a LVW has important implications for in-
terpreting geochemical and petrologic observations that constrain the thermal and
chemical state of the wedge. The viscosity structure strongly influences the pressure
field, which couples flow of fluids to the solid flow in the wedge. Timescales for fluids
traveling through the slab-wedge system range from several million years to as short
as 30,000 yrs [Hawkesworth et al., 1997]. Therefore, the effect of the LVW on the
path fluids take to the surface could provide important constraints on the depths at
which fluids are leaving the slab and migrating through the wedge.
Time-Dependent Structure of the Wedge. The viscosity of the wedge also has an
obvious effect on the pattern of flow in the wedge, causing material to be drawn up
into the wedge corner (Figure 3.3D). In time-dependent models this flow could draw
deep, hotter material into the wedge. Melting experiments on arc basalt compositions
require that temperatures in the wedge be ∼ 1400◦C at 100 km depth [Tatsumi et al.,
1983]. This is far warmer than ∼ 1000◦C temperature at the same depth predicted by
steady-state, kinematic temperature models that use an imposed flow velocity field
for an isoviscous asthenosphere [Peacock and Wang, 1999]. Since the pattern of flow
in dynamic models depends on the relative magnitude of the viscosity reduction in
the wedge, the temperature structure from time-dependent dynamic models including
a LVW would serve as an additional constraint on the wedge viscosity. However, it
is not clear whether a LVW would be a stable feature. Davies and Stevenson [1992]
found that a localized source of buoyancy could modify the wedge flow to include a
small-scale convection cell within the wedge. They suggest that such a reversal of
flow would lead to cooling of the wedge and reduction of the buoyancy force creating
a non-steady-state modification of the wedge flow and temperature structure. While
cooling of the wedge would increase viscosity, the influence of water and melt may
still be sufficient to maintain the LVW. Also, if only a modest reduction of viscosity
occurs (10–100 times smaller), a local reversal of flow may not occur.
If the LVW is an unstable feature of subduction zones, the slab dip and coupling to
the surface will change with time. This would lead to episodes of shallow or steeply

67
dipping subduction and raising and lowering of the overriding plate. This type of
behavior may be recorded in the history of basin development and sediment deposition
on overriding continental plates [Scholl and Herzer, 1992; Moxon, 1986], island arc
volcanics and present day morphology of slabs. One might expect a prominent basin
to form early on during subduction before a substantial amount of slab dehydration
has occurred and could affect the wedge viscosity. Similarly, the coupling between
the slab and the surface might increase after prolonged periods of subduction, due to
high integrated extents of melting of the wedge, making the wedge more refractory
with a higher effective viscosity.
3.4 Conclusions
Using dynamic models of Stokes flow we have shown that an isolated low viscosity re-
gion in the wedge influences the pressure field and pattern and vigor of flow within the
wedge and slab, which in turn affects topography and gravity. Improved agreement
between models that include a low viscosity wedge and observations of topography
and geoid provides a constraint on the minimum viscosity contrast between the wedge
and asthenosphere of at least a factor of 10. The maximum influence of the LVW is
achieved for shallow (20 km) and broad low viscosity regions that are at least as wide
as the deep basin topography present in the models without a LVW. The maximum
depth of the LVW has little influence on the topography for depths exceeding 100 km,
but does influence pattern of flow in the wedge. Larger reductions in the viscosity of
the wedge do not further reduce the topography, but instead modify the flow pattern
and lead to larger velocities within the wedge. Time-dependent models are needed to
constrain the maximum viscosity contrast permitted in the wedge and to investigate
the effect of a LVW on the evolution of the slab-wedge system.

68
References
M. Barazangi and B. Isacks. Lateral variations of seismic-wave attenuation in the
upper mantle above the inclined earthquake zone of the Tonga Island Arc: deep
anomaly in the upper mantle. Journal of Geophysical Research, 76(8493-8515),
1971.
J. H. Bodine and A. B. Watts. On lithospheric flexure seaward of the bonin and
mariana trenches. Earth and Planetary Science Letters, 43:132–148, 1979.
J. M. Brenan, H. F. Shaw, and F. J. Ryerson. Experimental evidence for the origin
of lead enrichment in convergent-margin magmas. Nature, 378:54–57, 1995.
C. P. Conrad and B. H. Hager. Mantle convection with strong subduction zones.
Geophysical Journal International, 144:271–288, 2001.
J. H. Davies and D. J. Stevenson. Physical model of source region of subduction zone
volcanics. Journal of Geophysical Research, 97:2037–2070, 1992.
Adam M. Dziewonski and Don L. Anderson. Preliminary Reference Earth Model.
Physics of Earth and Planetary Interiors, 25:297–356, 1981.
J. P. Eissen, A. J. Crawford, J. Cotten, S. Mettre, H. Bellon, and M. Delaune. Geo-
chemistry and tectonic significance of basalts in the Poya Terrane, New Caledonia.
Tectonophysics, 284:203–219, 1998.
Bradford H. Hager. Subducted slabs and the geoid: constraints on mantle rheology
and flow. Journal of Geophysical Research, 89(B7):6003–6015, July 1984.
M. W. Hamburger and B. L. Isacks. Deep earthquakes in the Southwest Pacific:
morphology and tectonic history. Earthquake Notes, 55:32, 1985.
Akira Hasegawa, Dapeng Zhao, Shuichiro Hori, Akira Yamamoto, and Shigeki Hori-
uchi. Deep structure of the Northeastern Japan Arc and its relationship to seismic
and volcanic activity. Nature, 352:683–689, August 1991.

69
C. J. Hawkesworth, S. P. Turner, F. McDermott, D. W. Peate, and P. van Calsteren.
U-th isotopes in arc magmas: implications for element transfer from the subducted
crust. Science, 276:551–555, 1997.
G. Hirth and D. L. Kohlstedt. Water in the oceanic upper mantle: implications for
rheology, melt extraction and the evolution of the lithosphere. Earth and Planetary
Science Letters, 144:93–108, 1996.
S. Karato. Mapping water content in the upper mantle. In J. Eiler, editor, Subduc-
tion Factory, AGU Monograph, Washington D. C., in press. American Geophysical
Union.
S. Karato and H. Jung. Water, partial melting and the origin of the seismic low
velocity and high attenuation zone in the upper mantle. Earth and Planetary
Science Letters, 157:193–207, 1998.
S. Karato and H. Jung. Effects of pressure on high-temperature dislocation creep in
olivine. Philosophical Magazine Annals, submitted.
S. Karato, M. S. Paterson, and J. D. Fitzgerald. Rheology of synthetic olivine ag-
gregates: influence of grain size and water. Journal of Geophysical Research, 91:
8151–8176, 1986.
S. Karato and H. A. Spetzler. Defect microdynamics and physical mechanisms of
seismic wave attenuation and velocity dispersion in the Earth’s mantle. Reviews of
Geophysics, 28:399–421, 1990.
W. M. Kaula. Global gravity and tectonics. In E. C. Robertson, J. F. Hays, and
L. Knopoff, editors, The Nature of the Solid Earth, pages 385–405. McGraw-Hill,
New York City, 1972.
D. L. Kohlstedt, H. Keppler, and D. C. Rubie. Solubility of water in a, b, and g
phases of (Mg,Fe)2SiO4. Contribution to Mineralogy and Petrology, 123:345–357,
1996.
70
L. W. Kroenke. Cenozoic Tectonic Development of the Southwest Pacific. U.N.
ESCAP CCOP/SOPAC Tech. Bull. 6, New Zealand, 1984.
F. G. Lemoine, S. C. Kenyon, J. K. Factor, R. G. Trimmer, N. K. Pavlis, and et al. The
Development of the Joint NASA GSFC and NIMA Geopotential Model EGM96.
Technical report, NASA Goddard Space Flight Center, Greenbelt, Maryland, 1998.
Louis Moresi and Michael Gurnis. Constraints on the lateral strength of slabs from
three-dimensional dynamic flow models. Earth and Planetary Science Letters, 138:
15–28, 1996.
J. D. Morris, W. P. Leeman, and F. Tera. The subducted component in island arc
lavas: constraints from Be isotopes and B-Be systematics. Nature, 344:31–36, 1990.
Ian Moxon. Subsidence history of Great Valley: forearc basin evolution during
Laramide Orogeny. AAPG Bulletin, 70:473–474, 1986.
R. D. Muller, W. R. Roest, J. Y. Royer, L. M. Gahagan, and J. G. Sclater. Digital
isochrons of the world’s ocean floor. Journal of Geophysical Research, 102:3211–
3214, 1997.
S. M. Peacock and K. Wang. Seismic consequences of warm versus cool subduction
metamorphism: examples from Southwest and Northeast Japan. Science, 286:
937–939, 1999.
R. W. Raitt, R. L. Fisher, and R. G. Mason. Tonga Trench. In Geological Society
of America, Special Paper, Crust of the Earth, volume 62, pages 237–254. Waverly
Press, Baltimore, Maryland, 1955.
E. Roth, D. Wiens, and D. Zhao. An empirical relationship between seismic atten-
uation and velocity anomalies in the upper mantle. Geophysical Research Letters,
27:601–604, 2000.
D. T. Sandwell and W. H. F. Smith. Marine gravity anomaly from GeoSat and ERS1
satellite altimetry. Journal of Geophysical Research, 102(B5):10039–10054, 1997.
71
David W. Scholl and Richard H. Herzer. Geology and resource potential of the
Southern Tonga Platform. In Joel S. Watkins, Feng Shiqiang, and Kenneth J.
McMillen, editors, Geology and Geophysics of Continental Margins, AAPG Mem-
oir, volume 53, chapter 9, pages 139–156. The American Association of Petrolem
Geologists, 1992.
W. H. F. Smith and D. T. Sandwell. Global sea floor topography from satellite
altimetry and ship depth soundings. Science, 277:1956–1962, 1997.
D. J. Stevenson and J. S. Turner. Angle of subduction. Nature, 270:334–336, 1977.
Y. Tatsumi, M. Sakayuma, H. Fukuyama, and I. Kushiro. Generation of arc basalt
magmas and thermal structure of the mantle wedge in subduction zones. Journal
of Geophysical Research, 88:5815–5825, 1983.
A. Tovish, G. Schubert, and B. P. Luyendyk. Mantle flow pressure and the angle
of subduction: non-Newtonian corner flows. Journal of Geophysical Research, 83:
5892–5898, 1978.
A. B. Watts and M. Talwani. Gravity anomalies seaward of deep-sea trenches and
their tectonic implications. Geophysical Journal of the Royal Astornomical Society,
36:57–90, 1974.
G. M. Yogodzinski, R. W. Kay, O. N. Volynets, A. V. Koloskov, and S. M. Kay.
Magnesian andesite in the Western Aleutian Komandorsky region - implications for
slab melting and processes in the mantle wedge. Journal of Geophysical Research,
107:505–519, 1995.
Dapeng Zhao, Yingbiao Xu, Douglas A. Wiens, LeRoy Dorman, John Hildebrand,
and Spahr Webb. Depth extent of the Lau Back-arc Spreading Center and its
relation to subduction processes. Science, 278:254–257, October 1997.
Shijie Zhong. Analytic solutions for Stokes’ flow with lateral variations in viscosity.
Geophysical Journal International, 124:18–28, 1996.
72
Shijie Zhong and Michael Gurnis. Viscous flow model of a subduction zone with
a faulted lithosphere: long and short wavelength topography, gravity and geoid.
Geophysical Research Letters, 19(18):1891–1894, September 1992.
Shijie Zhong and Michael Gurnis. Controls on trench topography from dynamic
models of subducted slabs. Journal of Geophysical Research, 99(B8):15683–15695,
August 1994.
Shijie Zhong, Michael Gurnis, and Louis Moresi. Role of faults, nonlinear rheology,
and viscosity structure in generating plates from instantaneous mantle flow models.
Journal of Geophysical Research, 103(B7):15255–15268, July 1998.


