
116
PCR BASED MOLECULAR CHARACTERIZATION FOR
PHYLOGENETICALLY STUDY
6.1. INTRODUCTION
Cyanobacteria represent one of the major bacterial phyla, being a large, diverse and
widespread group inhabiting most of the Earth’s environments. They play an important role
as primary producers (Chisholm et al., 1988; Waterbury et al., 1979), but are also capable of
extensive growth, resulting in bloom events that can cause a significant threat to human and
animal health (Carmichael, 1992). The current classification of cyanobacteria relies heavily
upon morphological observations such as cell size, shape and arrangement (filamentous,
colonial or single cells), colouration and the presence of characters such as gas vacuoles and a
sheath (Castenholz and Waterbury, 1989).
The morphology of cyanobacteria in laboratory cultures is known to be modified and
the variation between same species become reduced due to the controlled culture conditions
(Dores and Parker, 1988). There has been increased interest in applying molecular techniques
to resolve many of the issues and problems in cyanobacterial taxonomy (Giovannoni et al.,
1988; Wilmotte and Golubic, 1991). Molecular polymorphisms can be identified at random
and used to discriminate the phylogenetic relatedness of microorganisms. Using this clue a
renowned molecular technique was developed. The technique is randomly amplified
polymorphic DNA assay. Actually this is a PCR reaction but it amplify segment of DNA,
which are essentially unknown to the researcher (random). Often, PCR is used to amplify a
known sequence of DNA that has to be amplified, design and makes primers which will
anneal to sequences flanking the sequence of interest.
Thus, PCR leads to the amplification of a particular segment of DNA. This makes it a
tool of great power and general applicability. RAPD technique in conjunction with PCR has
been employed to identify many organisms to the strain level (Welsh and McClelland, 1990).

117
Modern molecular approaches have increasingly been employed to elucidate cyanobacterial
phylogenies and population level questions (Neilan, 1995; Bartish et al., 2000; Payne et al.,
2001; Waltenbury et al., 2005). Randomly amplified polymorphic DNA (RAPD) analysis is
one such tool often employed to examine the genetic diversity among cyanobacterial strains
(Moschetti et al., 1998; Quiberoni et al., 1998; Bolch et al., 1999; Casamatta et al., 2003).
Although RAPD’s dominant expression may bias population genetic parameters and some
assumptions are required (Lynch and Milligan, 1994), the technique is widely used for cluster
analysis to study geographic patterns and to evaluate whether correlation exists between
morphology and genetic characterization.
Actual phylogenetic reconstructions, however, often rely on DNA sequencing, most
commonly of the 16S rDNA gene (Casamatta et al., 2005; Gkelis et al., 2005; Comte et al.,
2007). The species and genus concept of cyanobacteria is changing from the traditional
morphological classification to a concept using different phenotypic features (e.g.
biochemical and ultrastructural characteristics) and genotypic features (Anagnostidis and
Komarek, 1985, 1988; Castenholz et al., 2001; Wilmotte and Herdman, 2001). For
phylogenetic analyses of bacteria and cyanobacteria one of the most informative gene is the
16S rRNA gene (Woese, 1987; Olsen and Woese, 1993; Ludwig and Schleifer, 1994; Ludwig
and Klenk, 2001). The 16S rRNA gene has a conserved function and is universally present in
bacteria and cyanobacteria.
The phylogenetic investigations using 16S sequences have shown that many
unicellular and filamentous non heterocystous cyanobacterial genera are probably
polyphyletic and cannot be grouped as natural taxa, whereas heterocystous strains form a
monophyletic group (Giovannoni et al., 1988; Wilmotte, 1994; Castenholz et al., 2001;
Rippka et al., 2001; Wilmotte and Herdman, 2001). In the present study, Nostocalean
cyanobacteria of the north eastern region of India which belong to different ecological niches
118
were characterized through molecular techniques for authentic identification using RAPD and
16S rRNA markers.
6.2. MATERIALS AND METHODS
6.2.1. Isolation of genomic DNA-Avijeet et al., 2013 (modified Tillett and
Neilan, 2000)
Mid logarithmic grown strains of the selected highest acetylene reduction activity
yielding 09 strains viz. Anabaena sp. BTA650, Calothrix sp. BTA265, Scytonema hofmanni
BTA124, Rivularia sp. BTA510, Nostoc sp. BTA197, Anabaena sp. BTA281, Anabaena
doliolum BTA280, Anabaena bergii BTA284 and Nostoc sp. BTA676 along with 03 strains
acquired from UTEX, The Culture Collection of Algae, Austin, TX, USA viz. Scytonema sp.
UTEX1163, Nostoc sp. UTEXB2211 and Calothrix anomala UTEX1319 were investigated
in present study and genomic DNA extracted. 2 ml of the cultures were harvested by
centrifugation at 10,000 rpm for 10 mins in 2 ml eppendorf tubes. The pellets were washed
with molecular grade double distilled water twice adding 2 ml of double distilled water with
vortexing for 1-2 mins and centrifuged at 10,000 rpm for 5 mins. The pellets were washed
finally by suspending with 2 ml of TE wash buffer (10 mM Tris-HCl, 1 mM EDTA, pH 8.0)
and centrifuged at 10,000 rpm for 5 mins. The pellets were suspended in 2 ml of XS buffer
(1% Potassium ethyl xanthogenate- Sigma-Aldrich; 100 mM Tris-HCl, 20 mM EDTA, pH
8.0; 1% sodium dodecylsulfate- Sigma-Aldrich; 800 mM ammonium acetate) and were
homogenized by mortar and pestle. 1 ml of the homogenized sample were dispensed in 2 ml
eppendorf tube, added 50 µl of RNase A (10 mg ml-1
) to get rid of any contaminating RNA
present and incubation in the water bath at 70°C for 1 and half to 2 hours for the lysis to
complete and vortexing for 10 secs in between the incubation. After incubation, 1 ml
saturated phenol was added to each tubes and vortexed for 5 mins. The tubes were then
centrifuged at 14,000 rpm for 15 mins. The aqueous phase was removed gently and

119
transferred to new eppendorf tube and added equal volume of chloroform: isoamyl alcohol
(24:1 v/v) and centrifuged at 12,000 rpm for 10 mins. The upper layer was transferred to a
new vial and added equal volume of chilled isopropanol gently mixed by turning the tube
end-over-end. After incubation at room temperature for 5 mins, the tubes were centrifuged at
14,000 rpm for 10 mins. The supernatant was removed and washed with 1 ml of 70% ethanol
and centrifuged at 12,000 rpm for 5 mins. The pellet was air dried and eluted with 100 µl of
sterile double distilled water or TE wash buffer (10 mM Tris-HCl, 1 mM EDTA, pH 8.0).
The DNA was loaded with loading buffer in the ratio 5:1 in 0.8% agarose (Sigma) gel and ran
in electrophoresis unit (Elchrom Scientific) using 1X TAE buffer (Promega) for 30 mins at
90V. The size of the genomic DNA was compared with 200 bp DNA markers (Bangalore
Genie). The DNA bands were observed in Gel documentation system (Vilber Lourmet). The
quality and quantity of DNA was checked by nanodrop (Biospectrometer, eppendorf).
6.2.2. RAPD
The RAPD was carried out of the 12 Nostocalean cyanobacterial DNA samples
including 03 strains of UTEX, The Culture Collection of Algae by using Illustra Ready-to-Go
RAPD beads (GE healthcare) containing thermostable polymerases (AmpliTaq™ DNA
polymerase and Stoffel fragment), dNTPs (0.4 mM each dNTP in a 25 μl reaction volume),
BSA (2.5 μg) and buffer [3 mM MgCl2, 30 mM KCl and 10 mM Tris, (pH 8.3)] with primer
concentration of 5 pmol μl-1
in a 25 μl reaction volume along with 5-50 ng of DNA. The
RAPD was carried out using the six primers viz.
Primer-1 (P1)- (5′-[GGTGCGGGAA]-3′) [GE Healthcare];
Primer-2 (P2) - (5′-[GTTTCGCTCC]-3′) [GE Healthcare];
Primer-3 (P3)- (5′-[GTAGACCCGT]-3′) [GE Healthcare];
Primer-4 (P4)- (5′-[AAGAGCCCGT]-3′) [Akopyanz et al., 1992];
Primer-5 (P5)- (5′-[AACGCGCAAC]-3′) [Akopyanz et al., 1992] and
Primer-6 (P6)- (5′-[CCCGTCAGCA]-3′) [Akopyanz et al., 1992]

120
The PCR conditions were set for 45 cycles with initial denaturation at 95°C for 5 mins
then 95°C for 1 min, annealing at 36°C for 1 min and final extension at 72°C for 2 mins in
thermal cycler (Mastercycler gradient, eppendorf).
Reaction mixture: 25 μl
DNA (10 ng) - 2 μl
Primer (25 pmol) - 5 μl
Molecular grade double distilled water - 18 μl
Reconstitution of beads:
1. 18 µl of sterile double distilled water was added
2. Pipetted in and out to reconstitute completely
3. 5 μl of each primer was added
4. 2 μl of DNA sample was added
5. Mixed by pulse vortexing
The RAPD products were loaded with loading buffer in the ratio 5:1 in 2% agarose
(Sigma) gel and ran in electrophoresis unit (Elchrom Scientific) using 1X TAE buffer
(Promega) for 30 mins at 90V. The size of product was compared with 200 bp DNA markers
(Himedia). The product bands were observed in Gel documentation system (Vilber Lourmet).
6.2.2.1. Data analysis
Numerical taxonomy and multivariate analysis system (NTSYSpc) was used in this
study. The molecular weights of bands were estimated based on the standard bands from
Genei DNA ladder marker. The presence of band was scored from the photograph. Only clear
and reproducible bands were given consideration. These bands were considered as
polymorphic when they were absent in some sample in frequency greater than 1% (Jorde,
1995) and change in band intensity were not considered as polymorphism. Clear bands were
scored as present (1) or absent (0) at particular position or distance migrated on the gel. The

121
data matrix of 1’s and 0’s were prepared from the scorable bands and entered into the data
analysis system.
6.2.2.2. Phylogenetic tree construction
The genetic similarities between strains were estimated by means of the Dice
coefficient (Dice, 1945). The dendrograms were constructed using the unweighted pair-group
method of arithmetic mean (UPGMA) (Sneath and Sokal, 1973) employing sequential,
agglomerative, hierarchical and nested clustering (SAHN) of NTSYSpc version 2.21m
software (Rohlf, 1994).
6.2.3. 16S rRNA
The 16S rRNA was carried out of the 09 selected Nostocalean cyanobacterial DNA
samples.
6.2.3.1. Preparation of PCR mix (25 µl reaction mixture):
1X PCR (Tris-EDTA with MgCl2) buffer - 2.5 μl
dNTP mix (25 mM each of dNTPs) - 2.5 μl
Taq DNA polymerase - 0.25 μl
Forward primer (536f 5′-GTGCCAGCAGCCGCGGTRATA-3′) - 0.75 μl
Reverse primer (1488R 5′-CGGTTACCTTGTTACGACTTCACC-3′) - 0.75 μl
Template DNA (50 ng) - 1 μl
Sterile double distilled water - 17.25 μl
The PCR conditions were set for 28 cycles with initial denaturation at 95°C for 5
mins then 95°C for 1 min, annealing at 55°C for 1 min and final extension at 72°C for 2
mins using thermal cycler (Mastercycler gradient, eppendorf).
The amplified PCR product was loaded with loading buffer in the ratio 5:1 in 2%
agarose (Sigma) gel and ran in electrophoresis unit (Elchrom Scientific) using 1X TAE buffer
122
(Promega) for 30 mins at 90V. The size of the PCR product was compared with 200 bp DNA
markers (Himedia). The product bands were observed in Gel documentation system (Vilber
Lourmet). The quality and quantity of amplified PCR product was checked by nanodrop
(Biospectrometer, eppendorf).
6.2.3.2. Sequencing of the 16S rRNA gene
The amplified PCR products of the 16S rRNA were sequenced at NCCS-DBT, Pune
using the same forward and reverse primers.
6.2.3.3. Phylogenetic analysis and construction of tree
Nucleotide sequences obtained from DNA sequencing were compared with sequence
information available in the National Centre for Biotechnology Information (NCBI) database
using BLAST (Altschul et al., 1990; 1997) with nucleotide option by logging onto
http://www.ncbi.nlm.nih.gov. The sequences retrieved were converted to FASTA format.
Phylogenetic and molecular evolutionary analyses were conducted using MEGA
version 4 (Tamura et al., 2007). 16S rRNA gene sequences obtained of the Nostocalean
strains were aligned with selected GenBank entries with Clustal W analysis (Thompson et al.,
1994) of the sequence results were carried out for the phenograms for the selected strains
used in the study. Phylogenetic trees were constructed for the 16S rRNA sequences taking
bootstrap values for 1000 replicates by the methods of maximum parsimony (Eck and
Dayhoff, 1966) and neighbor-joining (Saitou and Nei, 1987).
6.2.3.4. Nucleotide sequence accession numbers
16S rRNA gene sequences of the 09 Nostocalean strains generated by NCCS-DBT,
Pune were deposited to the NCBI GenBank through Sequin Application Version 12.30-
NCBI stand alone software tool for obtaining accession numbers of the said strains.

123
6.3. RESULTS
6.3.1. Genomic DNA
Total genomic DNA of the 12 Nostocalean cyanobacteria including 03 strains of
UTEX, The Culture Collection of Algae were used as templates. The genomic DNA
absorbance A260/ A280 falling in the ratio 1.8 - 1.9 were considered good and use for further
PCR amplifications. The size of the genomic DNA ranges from 18,000-20,000 bp.
6.3.2. RAPD
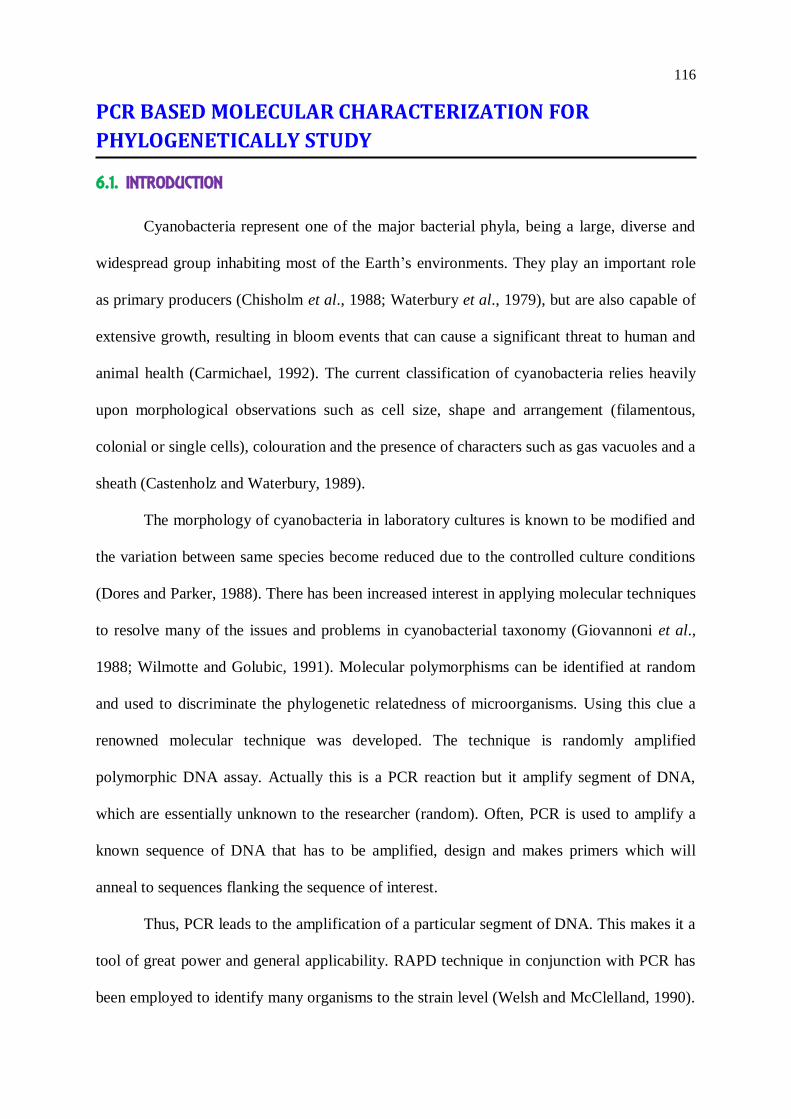
Using the 12 genomic DNA as templates for the 06 primers, a total of 96 bands were
generated, out of which 60 were polymorphic and 36 were monomorphic bands (table-7). The
total number of bands per strain ranged from 4 to 13 (fig.11). Each primer produced from 8 to
25 bands. For Primer-1 (P1), the DNA bands observed for the analysed strains ranges from
320-1,931 bp; for P2 ranges from 716-1,370 bp; for P3 ranges from 827-1,497 bp; for P4
ranges from 949-1,861 bp; for P5 ranges from 303-1,814 bp and for P6 ranges from 432-
1,956 bp. The size of the amplified products ranged from 303 to 1,956 bp. The
reproducibility of the results was assessed by repeating the experiments thrice.
Other than variations in the intensity of bands, no major variation was observed in the
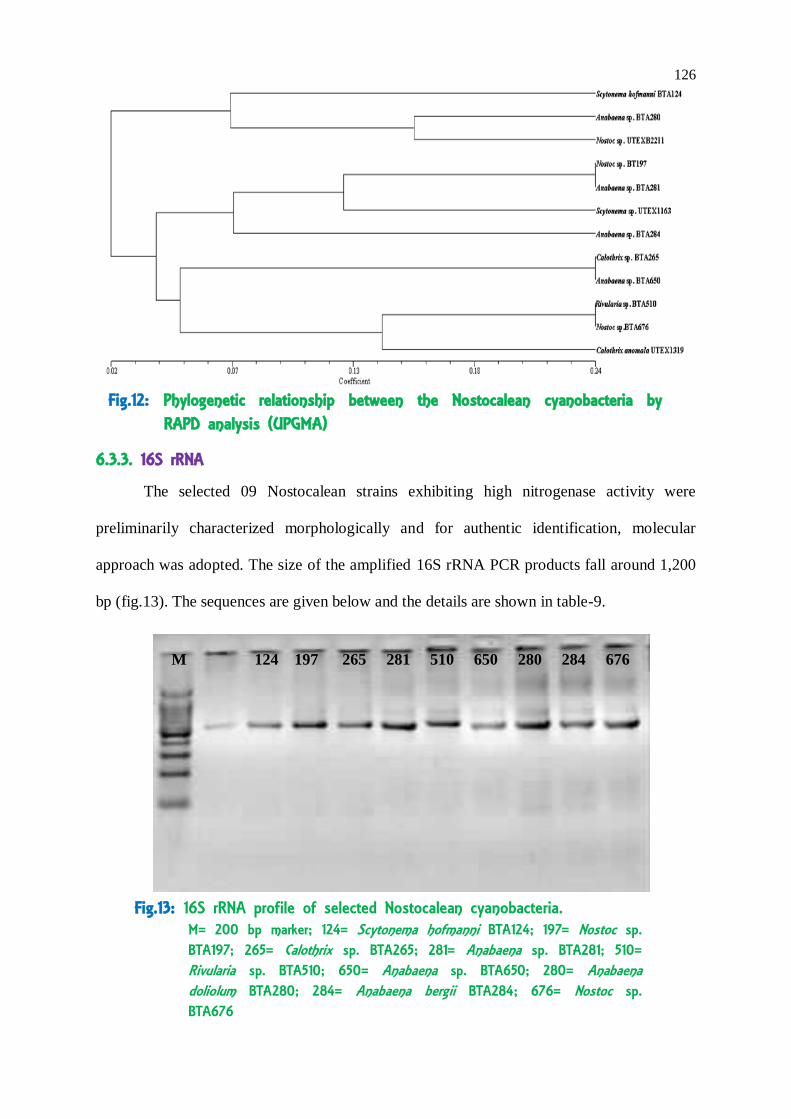
banding profile. A phylogenetic tree (fig.12) was constructed. The highest percentage of
similarity was observed between strains BTA197 and BTA281, BTA265 and BTA650,
BTA510 and BTA676 (24% each); 20% similarity was observed between strains BTA197
and BTA650; 15% similarity was observed between strains BTA510 and UTEX1319,
BTA280 and UTEXB2211. 14% similarity was observed between strains BTA124 and
BTA280, BTA197 and UTEXB2211. 13% similarity was observed between strains BTA197
and UTEX1163, BTA510 and UTEX1163, BTA281 and UTEX1319, BTA676 and
UTEX1319, BTA284 and UTEX1319 as shown in table-8.

124
Table-7: Number of PCR product generated in RAPD analysis of Nostocalean strains with six (06) different primers
Table-8: Symmetric similarity matrix of the RAPD profile of the 12 Nostocalean strains
Primers No. of monomorphic bands No. of polymorphic bands Total no. of bands Percentage of polymorphism
P1 10 15 25 60.00
P2 6 9 15 60.00 P3 0 8 8 100.00
P4 9 5 14 35.71
P5 5 13 18 72.22
P6 6 10 16 62.50
BTA124 BTA197 BTA265 BTA281 BTA510 BTA650 BTA676 BTA284 BTA280 UTEX1163 UTEX1319 UTEXB2211
BTA124 1.000
BTA197 0.000 1.000
BTA265 0.000 0.000 1.000
BTA281 0.000 0.235 0.000 1.000
BTA510 0.000 0.000 0.000 0.000 1.000
BTA650 0.000 0.200 0.235 0.087 0.100 1.000
BTA676 0.000 0.000 0.000 0.000 0.235 0.087 1.000
BTA284 0.000 0.118 0.000 0.000 0.000 0.087 0.000 1.000
BTA280 0.143 0.000 0.000 0.000 0.000 0.000 0.000 0.000 1.000
UTEX1163 0.000 0.133 0.000 0.111 0.133 0.000 0.000 0.000 0.000 1.000
UTEX1319 0.000 0.000 0.000 0.125 0.154 0.105 0.125 0.125 0.000 0.000 1.000
UTEXB2211 0.000 0.143 0.000 0.000 0.000 0.200 0.000 0.000 0.154 0.133 0.000 1.000
125
Fig.11: RAPD profile of selected Nostocalean strains using 6 set of different primers. M=100 bp marker; 1=BTA124; 2=BTA197; 3=BTA265; 4=BTA281; 5=BTA510; 6=BTA650; 7=BTA676; 8=BTA284; 9=BTA280; 10=UTEX1163; 11=UTEX1319; 12=UTEXB2211
M 1 2 3 4 5 6 7 8 9 10 11 12 M
Primer 3
M 1 2 3 4 5 6 7 8 9 10 11 12 M
Primer 4
M 1 2 3 4 5 6 7 8 9 10 11 12 M
Primer 6
M 1 2 3 4 5 6 7 8 9 10 11 12 M
Primer 5
M 1 2 3 4 5 6 7 8 9 10 11 12 M
Primer 2
M 1 2 3 4 5 6 7 8 9 10 11 12 M
Primer 1
126
M 124 197 265 281 510 650 280 284 676
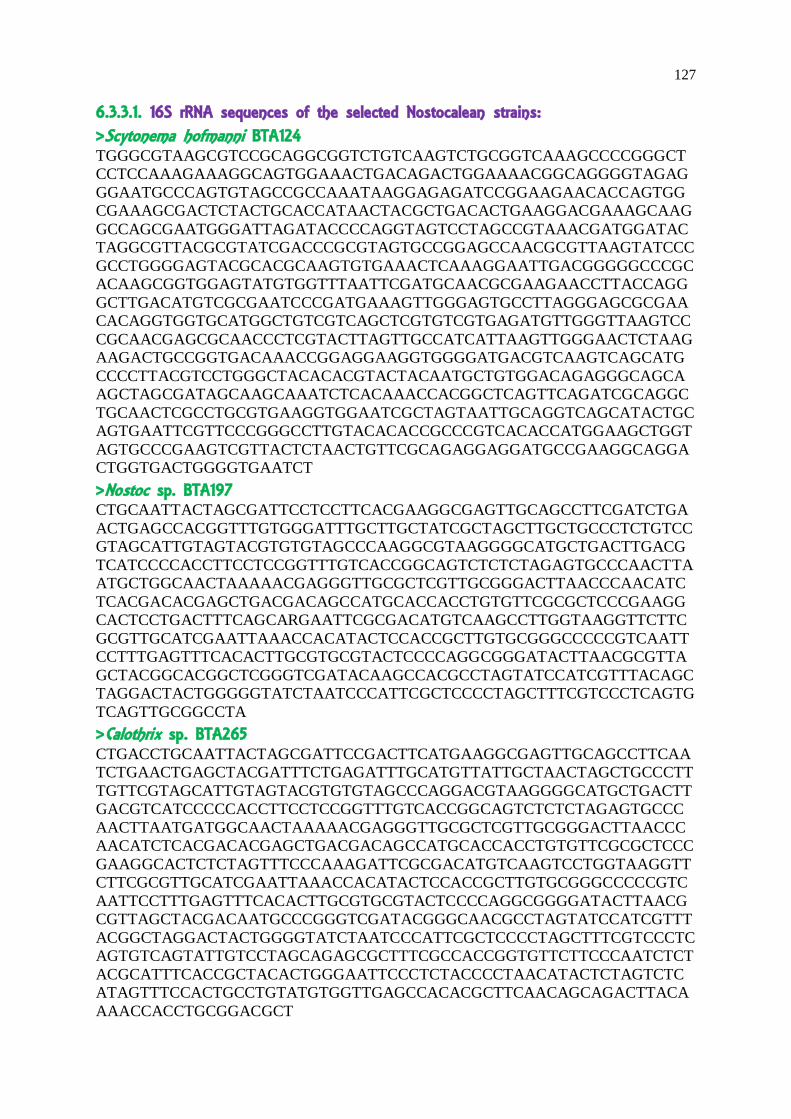
Fig.13: 16S rRNA profile of selected Nostocalean cyanobacteria. M= 200 bp marker; 124= Scytonema hofmanni BTA124; 197= Nostoc sp. BTA197; 265= Calothrix sp. BTA265; 281= Anabaena sp. BTA281; 510= Rivularia sp. BTA510; 650= Anabaena sp. BTA650; 280= Anabaena doliolum BTA280; 284= Anabaena bergii BTA284; 676= Nostoc sp. BTA676
6.3.3. 16S rRNA
The selected 09 Nostocalean strains exhibiting high nitrogenase activity were
preliminarily characterized morphologically and for authentic identification, molecular
approach was adopted. The size of the amplified 16S rRNA PCR products fall around 1,200
bp (fig.13). The sequences are given below and the details are shown in table-9.
Fig.12: Phylogenetic relationship between the Nostocalean cyanobacteria by RAPD analysis (UPGMA)
127
6.3.3.1. 16S rRNA sequences of the selected Nostocalean strains: >Scytonema hofmanni BTA124 TGGGCGTAAGCGTCCGCAGGCGGTCTGTCAAGTCTGCGGTCAAAGCCCCGGGCT
CCTCCAAAGAAAGGCAGTGGAAACTGACAGACTGGAAAACGGCAGGGGTAGAG
GGAATGCCCAGTGTAGCCGCCAAATAAGGAGAGATCCGGAAGAACACCAGTGG
CGAAAGCGACTCTACTGCACCATAACTACGCTGACACTGAAGGACGAAAGCAAG
GCCAGCGAATGGGATTAGATACCCCAGGTAGTCCTAGCCGTAAACGATGGATAC
TAGGCGTTACGCGTATCGACCCGCGTAGTGCCGGAGCCAACGCGTTAAGTATCCC
GCCTGGGGAGTACGCACGCAAGTGTGAAACTCAAAGGAATTGACGGGGGCCCGC
ACAAGCGGTGGAGTATGTGGTTTAATTCGATGCAACGCGAAGAACCTTACCAGG
GCTTGACATGTCGCGAATCCCGATGAAAGTTGGGAGTGCCTTAGGGAGCGCGAA
CACAGGTGGTGCATGGCTGTCGTCAGCTCGTGTCGTGAGATGTTGGGTTAAGTCC
CGCAACGAGCGCAACCCTCGTACTTAGTTGCCATCATTAAGTTGGGAACTCTAAG
AAGACTGCCGGTGACAAACCGGAGGAAGGTGGGGATGACGTCAAGTCAGCATG
CCCCTTACGTCCTGGGCTACACACGTACTACAATGCTGTGGACAGAGGGCAGCA
AGCTAGCGATAGCAAGCAAATCTCACAAACCACGGCTCAGTTCAGATCGCAGGC
TGCAACTCGCCTGCGTGAAGGTGGAATCGCTAGTAATTGCAGGTCAGCATACTGC
AGTGAATTCGTTCCCGGGCCTTGTACACACCGCCCGTCACACCATGGAAGCTGGT
AGTGCCCGAAGTCGTTACTCTAACTGTTCGCAGAGGAGGATGCCGAAGGCAGGA
CTGGTGACTGGGGTGAATCT
>Nostoc sp. BTA197 CTGCAATTACTAGCGATTCCTCCTTCACGAAGGCGAGTTGCAGCCTTCGATCTGA
ACTGAGCCACGGTTTGTGGGATTTGCTTGCTATCGCTAGCTTGCTGCCCTCTGTCC
GTAGCATTGTAGTACGTGTGTAGCCCAAGGCGTAAGGGGCATGCTGACTTGACG
TCATCCCCACCTTCCTCCGGTTTGTCACCGGCAGTCTCTCTAGAGTGCCCAACTTA
ATGCTGGCAACTAAAAACGAGGGTTGCGCTCGTTGCGGGACTTAACCCAACATC
TCACGACACGAGCTGACGACAGCCATGCACCACCTGTGTTCGCGCTCCCGAAGG
CACTCCTGACTTTCAGCARGAATTCGCGACATGTCAAGCCTTGGTAAGGTTCTTC
GCGTTGCATCGAATTAAACCACATACTCCACCGCTTGTGCGGGCCCCCGTCAATT
CCTTTGAGTTTCACACTTGCGTGCGTACTCCCCAGGCGGGATACTTAACGCGTTA
GCTACGGCACGGCTCGGGTCGATACAAGCCACGCCTAGTATCCATCGTTTACAGC
TAGGACTACTGGGGGTATCTAATCCCATTCGCTCCCCTAGCTTTCGTCCCTCAGTG
TCAGTTGCGGCCTA
>Calothrix sp. BTA265 CTGACCTGCAATTACTAGCGATTCCGACTTCATGAAGGCGAGTTGCAGCCTTCAA
TCTGAACTGAGCTACGATTTCTGAGATTTGCATGTTATTGCTAACTAGCTGCCCTT
TGTTCGTAGCATTGTAGTACGTGTGTAGCCCAGGACGTAAGGGGCATGCTGACTT
GACGTCATCCCCCACCTTCCTCCGGTTTGTCACCGGCAGTCTCTCTAGAGTGCCC
AACTTAATGATGGCAACTAAAAACGAGGGTTGCGCTCGTTGCGGGACTTAACCC
AACATCTCACGACACGAGCTGACGACAGCCATGCACCACCTGTGTTCGCGCTCCC
GAAGGCACTCTCTAGTTTCCCAAAGATTCGCGACATGTCAAGTCCTGGTAAGGTT
CTTCGCGTTGCATCGAATTAAACCACATACTCCACCGCTTGTGCGGGCCCCCGTC
AATTCCTTTGAGTTTCACACTTGCGTGCGTACTCCCCAGGCGGGGATACTTAACG
CGTTAGCTACGACAATGCCCGGGTCGATACGGGCAACGCCTAGTATCCATCGTTT
ACGGCTAGGACTACTGGGGTATCTAATCCCATTCGCTCCCCTAGCTTTCGTCCCTC
AGTGTCAGTATTGTCCTAGCAGAGCGCTTTCGCCACCGGTGTTCTTCCCAATCTCT
ACGCATTTCACCGCTACACTGGGAATTCCCTCTACCCCTAACATACTCTAGTCTC
ATAGTTTCCACTGCCTGTATGTGGTTGAGCCACACGCTTCAACAGCAGACTTACA
AAACCACCTGCGGACGCT
128
>Anabaena sp. BTA281 CCTGCAATTACTAGCGATTCCTCCTTCACGAAGGCGAGTTGCAGACTTCGATCTG
AACTGAGACACGGTTTATGGGATTAGCTTGCTATCGCTAGCTTGCTGCCCTTTGC
CGTAGCATTGTAGTACGTGTGTAGCCCAAGACGTAAGGGGCATGCTGACTTGAC
GTCATCCCCACCTTCCTCCGGTTTGTCACCGGCAGTCTCTCTAGAGTGCCCACCCT
AAGTGCTGGCAACTAAAAACGAGGGTTGCGCTCGTTGCGGGACTTAACCCAACA
TCTCACGACACGAGCTGACGACAGCCATGCACCACCTGTGTTCGCGCTCCCGAAG
GCACTCCCAGCTTTTCACCGGGATTCGCGACATGTCAAGTCTTGGTAAGGTTYTT
CGCGTTGCATCGAATTAAACCACATACTCCACCGCTTGTGCGGGCCCCCGTCAAT
TCCTTTGAGTTTCACACTTGCGTGCGTACTCCCCAGGCGGGATACTTAACGCGTT
AGCTACGGCACGGCTCGGGTCGATACAAGCCACGCCTAGTATCCATCGTTTACGG
CTAGGACTACTGGGGTATCTAATCCCATTCGCTCCCCTAGCTTTCGTCCCTCAGTG
TCAGTTGCGGCCCAGCAGAGCGCTTTCGCCACCGGTGTTCTTCCTGATCTCTACG
CATTTCACCGCTACACCAGGAATTCCCTCTG
>Rivularia sp. BTA510 TGCAATTACTAGCGATTCCGACTTCATGAAGGCGAGTTGCAGCCTTCAATCTGAA
CTGAGCGACTATTTCATAGATTTGCATCACATTGCTGTGTAGCTGCCCTTTGTTCG
TCGCATTGTAGTACGTGTGTAGCCCAGGACGTAAGGGGCATGCTGACTTGACGTC
ATCCCCACCTTCCTCCGGTTTGTCACCGGCAGTCTCTCTAGAGTGCCCAACTTAAT
GCTGGCAACTAAAAACGAGGGTTGCGCTCGTTGCGGGACTTAACCCAACATCTC
ACGACACGAGCTGACGACAGCCATGCWCCACCTGTGTTCGCGCTCCCGAAGGCA
CTCACRAGTTTCCCCATGATTCGCGACATGTCAAGTCCTGGTAAGGTTYTTCGCG
TTGCATCKAATWAAACCACATACTCCACCGCTTGTGCGGGGCCCCCGYCAATTC
CTTTGAGTTTCACACTTTGCGTGCGTACCTCCCCAGGSGGGGATACTTTAACGCGT
TAGCTACGACAATGCCCCGGGGTCRATACGGGCAACGCCTTAKTATCCATYKTTT
TACCGGCTAGGAACTCACYGGGGGTATCTAAATCCCMTTYGGCTCCCCYARACT
TTCSYCCCCCTCAGKGTCAGATATWGTCCCTAGCARARCGGCTTTTCSCCACCCG
GKGTTTTCTTCCCMATCTCTTACGACATTTCMCCYCCTACACTGGGGAATTCCCT
CCTACCCCCTAAACAACTCTTAGTCTCCTTATTTTCCCACGGGCCTTTATCATGGG
TAAGGCTGAAGTCTTTTAACAGCAAAAATTTAAAAAAACCCCCCTGGG
>Anabaena sp. BTA650 GACCTGCAATTACTAGCGATTCCTCCTTCACGAAGGCGAGTTGCAGCCTTCGATC
TGAACTGAGCTACGGTTTCTGAGATTTGCTTGCTATCGCTAGCTTGCTGCCCTTTG
TCCGTAGCATTGTAGTACGTGTGTAGCCCAAGACGTAAGGGGCATGCTGACTTGA
CGTCATCCCCCACCTTCCTCCGGTTTGTCACCGGCAGTCTCTCTAGAGTGCCCATC
TTAATGCTGGCAACTAAAAACGAGGGTTGCGCTCGTTGCGGGACTTAACCCAAC
ATCTCACGACACGAGCTGACGACAGCCATGCACCACCTGTCTCTGCGCTCCCGAA
GGCACTCCCACCTTTCAGCAGGATTCGCAGGATGTCAAGTCTTGGTAAGGTTCTT
CGCGTTGCATCGAATTAAACCACATACTCCACCGCTTGTGCGGGCCCCCGTCAAT
TCCTTTGAGTTTCACACTTGCGTGCGTACTCCCCAGGCGGGATACTTAACGCGTT
AGCTCCGGCACGGCTCGGGTCGATACAAGCCACGCCTAGTATCCATCGTTTACGG
CTAGGACTACTGGGGTATCTAATCCCATTCGCTCCCCTAGCTTTCGTCCCTCAGTG
TCAGTCTCGGACTAGCAGAACGCTTTCGCCACCGGTGTTCTTCCTGATATCTACG
CATTTCACCGCTACACCAGGAATTCCTTCTGCCCC
>Nostoc sp. BTA676 ATCTGAACTGAGATACGGTTTACGGGATTGGCTTGCCATCGCTGGTTTGCTGCCC
TTTGTACCGKAGCATTGTAGTGACGTGTGTAGCCCMASACRTAAGGGGCATGMK
GACTTGACGTCATCCYCACCTTCCTCCGGTTTGTCACCGGCAGTCTCTCTAGAGT
GCCCCAACTTAATGCTGGCAACTAAAAACGAGGGTTGCGCTCGTTGCGGGACTT

129
AACCCAACATCTCACGACACGAGCTGACGACAGCCATGCACCACCTGTGTTCGC
GCTCCCTAAGGCACTCCTTCCTTTCAGAAGGATTCGCGACATGTCAAGTCTTGGT
AAGGTTCTTCGCGTTGCATCGAATTAAACCACATACTCCACCGCTTGTGCGGGCC
CCCGTCAATTCCTTTGAGTTTCACACTTGCGTGCGTACTCCCCAGGCGGGATACTT
AACGCGTTAGCTCCGGCACGGCTCGGGTCGATACAAGCCACGCCTAGTATCCATC
GTTTACGGCTAGGATTACTGGGGTATCTAATCCCATTCG
>Anabaena doliolum BTA280 ATTACTAGCGATTCCTCCTTCACGAAGGCGAGTTGCAGCCTTCGATCTGAACTGA
GCCACGGTTTATGGGATTAGCTTGCTATCGCTAGCTTGCTGCCCTCTGTCCGTAGC
ATTGTAGTACGTGTGTAGCCCACGGCGTGAAGGGGCATGCTGACTTGACGTCMT
CCCCCACCTTCCTCCGGTTTGTCACCCGGCAGTCTCTCTAGAGTGCCCAACTTAAT
GCTGGCAACTAAAAAACGAGGGTTGCGCTCGTTGCGGGACTTAACCCAACATCT
CACGACACGAGCTGACGACAGCCATGCACCACCTGTGTTCGCGCTCCCGAAGGC
ACCTCTTCCTTTCAGAAGAGTTCGCGACATGTCAAGCCTTGGTAAGGTTCTTCGC
GTTGCATCGAATTAAACCACATACTCCACCGCTTGTGCGGGCCCCCGTCAATTCC
TTTGAGTTTCACACTTGCGTGCGTACTCCCCAGGCGGGATACTTAACGCGTTAGC
TACGGCACGGCTCGGGTCGATACAAGCCACGCCTAGTATCCATCGTTTACAGCTA
GGACTACTGGGGTATCTAATCCCATTCGCTCCCCTAGCTTTCGTCCTTCAGTGTCA
GTTGCGGCCTAGCAGAGCGCCTTCGCCACCGGTGTTCTTCCTGATCTCTACGCAT
TTCACCGCTACACCAGGAATTCCCTCTGCCCCGAACGCACTCTAGCCGTGTAGTT
TCCACTGCCTTTACAAAGTTGAGCTTTGCTCTTGACAGCAGACTTACACAGCCAC
CTGCGGACGCT
>Anabaena bergii BTA284 TAGATATTCGGAGGAACACCAATGGCGAAGGCGATCTCCCTGGACCAGCACTGA
CGCTGATGCACGAAAGCGTGGGGAGCAAACAGGATTAGATACCCTGGTAGTCCA
CGCCCTAAACGATGAAAACTGGCTGTTGGGAGGGTTTCTTCTCGGTGTGGCAAAT
CTAACGCGTAGTTTACCCCCCTGGGGAGTACAGTCGCAAGATTGAAACTCAAAG
GAAATGACAGGGGCCCGCACAAGCGGTGGAGAATGTGGTTTTATTTTATGCAAC
GCGCAAAAACTTACCCACCCTTGACATGTCTGGAATACTTACCAGATATGGAAGT
GCTCTTTAGAGATCCAGAACACAGGTGCTGCATGGCTGTCGTCAGCTCGTGTCGT
GAGATGTTGGGGTTAAGTCCC
Table-9: Details of the sequences of the selected Nostocalean strains Name of the strains with BTA codes Sequence
length (bp)
% G + C % A + T
Scytonema hofmanni BTA124 940 55.2 44.8
Nostoc sp. BTA197 618 54.2 45.8
Calothrix sp. BTA265 790 52.0 48.0
Anabaena sp. BTA281 691 54.6 45.4
Rivularia sp. BTA510 818 50.2 49.8
Anabaena sp. BTA650 697 54.1 45.9
Nostoc sp. BTA676 532 53.0 47.0
Anabaena doliolum BTA280 781 54.4 45.6
Anabaena bergii BTA284 402 50.7 49.3

130
On subjection of pairwise similarity alignment by BLASTN of the above sequences to
identify the strains by comparing with the sequences available at NCBI GenBank database,
Scytonema hofmanni BTA124 showed 93% identity with Scytonema hofmanni PCC 7110
NCBI accession no. AF132781 and E value (0.0), Nostoc sp. BTA197 showed 99% identity
with Nostoc sp. HA4356-MV1 NCBI accession no. HQ847577 and E value (0.0). Calothrix
sp. BTA265 showed 99% identity with Calothrix sp. PCC 7715 NCBI accession no.
AM230701 and E value (0.0). Anabaena sp. BTA281 showed 96% identity with Anabaena
sp. CH1 NCBI accession no. DQ294214 and E value (0.0). Rivularia sp. BTA510 showed
89% identity with Rivularia sp. MU24 UAM-305 NCBI accession no. EU009149 and E
value (0.0). Anabaena sp. BTA650 showed 97% identity with Anabaena sp. 08-05 NCBI
accession no. FN691915 and E value (0.0). Nostoc sp. BTA676 showed 96% identity with
Nostoc sp. UIC 10274 NCBI accession no. JX1880019 and E value (0.0). Anabaena doliolum
BTA280 showed 99% identity with Anabaena doliolum BF4 NCBI accession no. GU396094
and E value (0.0). Anabaena bergii BTA284 showed 79% identity with Anabaena bergii
ANA283A NCBI accession no. FJ234897 and E value (9e-72). GenBank accession nos. of
the submitted nucleotide sequences are given in table-10. Due to short sequence length
Anabaena bergii BTA284 has been excluded from the phylogenetic tree construction.
Table-10: Nucleotide sequence accession number of the selected Nostocalean strains SN Strain code Strain name GenBank accession no.
1 IBSD.sqn IBSD.GONT.1 Scytonema hofmanni BTA124 KF779147
2 IBSD.sqn IBSD.GONT.2 Nostoc sp. BTA197 KF779148
3 IBSD.sqn IBSD.GONT.3 Calothrix sp. BTA265 KF779149
4 IBSD.sqn IBSD.GONT.4 Anabaena sp. BTA281 KF779150
5 IBSD.sqn IBSD.GONT.5 Rivularia sp. BTA510 KF779151
6 IBSD.sqn IBSD.GONT.6 Anabaena sp. BTA650 KF779152
7 IBSD.sqn IBSD.GONT.7 Nostoc sp. BTA676 KF779153
8 IBSD.sqn IBSD.GONT.8 Anabaena doliolum BTA280 KF779154
9 IBSD.sqn IBSD.GONT.9 Anabaena bergii BTA284 KF779155
131
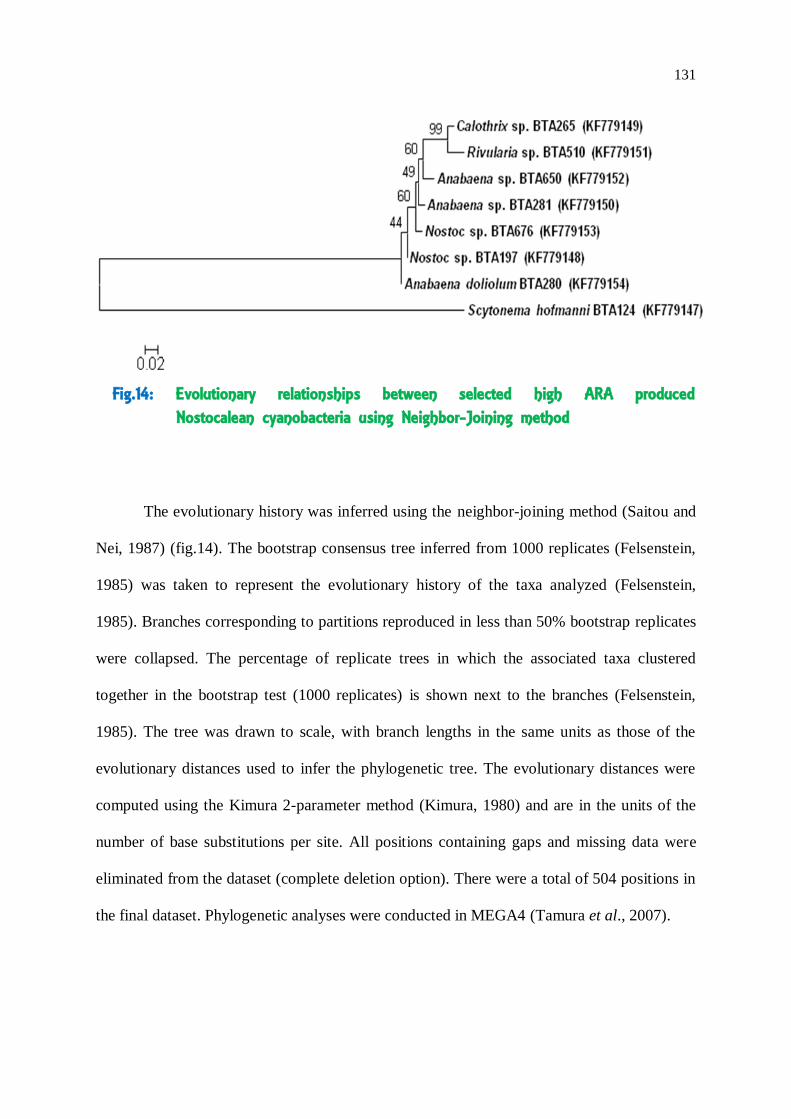
The evolutionary history was inferred using the neighbor-joining method (Saitou and
Nei, 1987) (fig.14). The bootstrap consensus tree inferred from 1000 replicates (Felsenstein,
1985) was taken to represent the evolutionary history of the taxa analyzed (Felsenstein,
1985). Branches corresponding to partitions reproduced in less than 50% bootstrap replicates
were collapsed. The percentage of replicate trees in which the associated taxa clustered
together in the bootstrap test (1000 replicates) is shown next to the branches (Felsenstein,
1985). The tree was drawn to scale, with branch lengths in the same units as those of the
evolutionary distances used to infer the phylogenetic tree. The evolutionary distances were
computed using the Kimura 2-parameter method (Kimura, 1980) and are in the units of the
number of base substitutions per site. All positions containing gaps and missing data were
eliminated from the dataset (complete deletion option). There were a total of 504 positions in
the final dataset. Phylogenetic analyses were conducted in MEGA4 (Tamura et al., 2007).
Fig.14: Evolutionary relationships between selected high ARA produced Nostocalean cyanobacteria using Neighbor-Joining method

132
The evolutionary history was inferred using the maximum parsimony method (Eck
and Dayhoff, 1966). The consensus tree inferred from 2 most parsimonious trees shown
(fig.15). Branches corresponding to partitions reproduced in less than 50% trees were
collapsed. The consistency index was (0.728395), the retention index was (0.620690) and the
composite index was 0.582968 (0.452107) for all sites and parsimony-informative sites (in
parentheses). The percentage of parsimonious trees in which the associated taxa clustered
together was shown next to the branches. The MP tree was obtained using the close-
neighbor-interchange algorithm (Nei and Kumar, 2000) with search level 3 (Tamura et al.,
2007) in which the initial trees were obtained with the random addition of sequences (10
replicates). The tree was drawn to scale, with branch lengths calculated using the average
pathway method and were in the units of the number of changes over the whole sequence. All
positions containing gaps and missing data were eliminated from the dataset. There were a
total of 504 positions in the final dataset, out of which 40 were parsimony informative.
Phylogenetic analyses were conducted in MEGA4 (Tamura et al., 2007).
Fig.15: Evolutionary relationships between selected high ARA produced Nostocalean cyanobacteria using Maximum Parsimony method
133
Table-11: Distance matrix between the selected Nostocalean strains based on 16SrRNA
1 2 3 4 5 6 7 8
1. Scytonema hofmanni
BTA124 (KF779147)
2. Nostoc sp.
BTA197 (KF779148)
1.09
3. Calothrix sp.
BTA265 (KF779149)
1.19 0.06
4. Anabaena sp.
BTA281 (KF779150)
1.11 0.03 0.06
5. Rivularia sp.
BTA510 (KF779151)
1.20 0.08 0.03 0.08
6. Anabaena sp.
BTA650 (KF779152)
1.15 0.03 0.06 0.03 0.08
7. Nostoc sp.
BTA676 (KF779153)
1.10 0.03 0.07 0.03 0.08 0.03
8. Anabaena doliolum
BTA280 (KF779154)
1.08 0.01 0.07 0.03 0.09 0.04 0.03
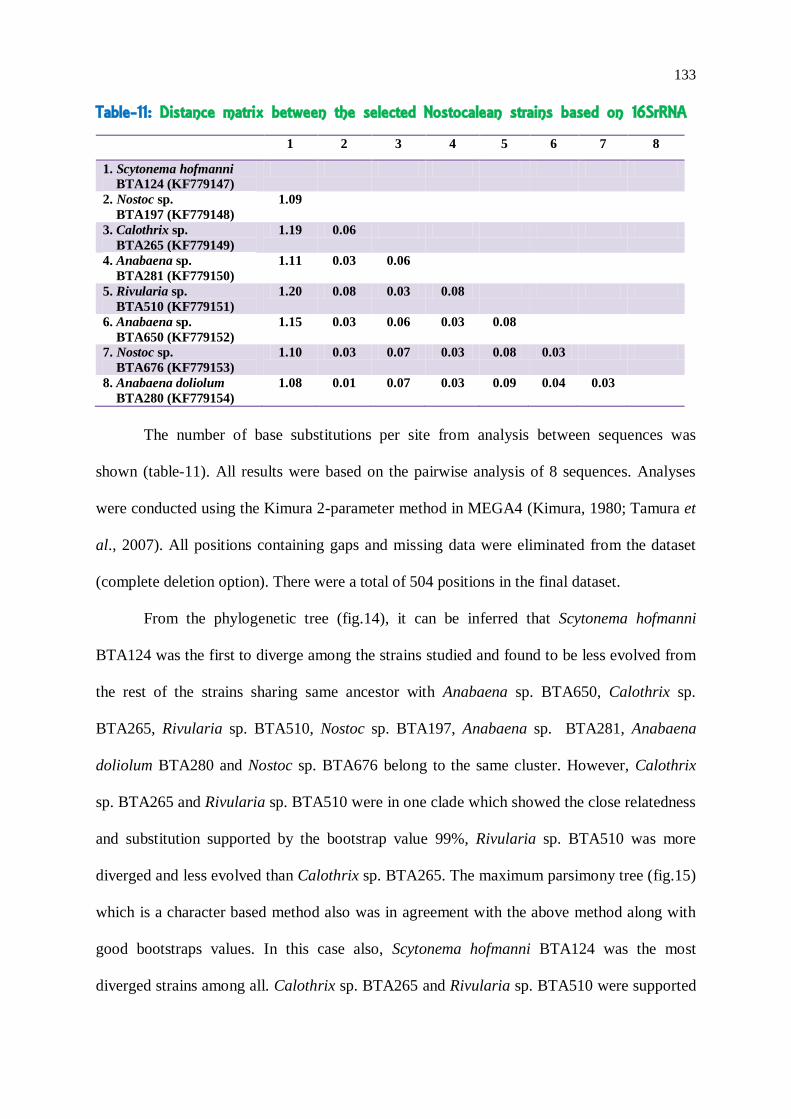
The number of base substitutions per site from analysis between sequences was
shown (table-11). All results were based on the pairwise analysis of 8 sequences. Analyses
were conducted using the Kimura 2-parameter method in MEGA4 (Kimura, 1980; Tamura et
al., 2007). All positions containing gaps and missing data were eliminated from the dataset
(complete deletion option). There were a total of 504 positions in the final dataset.
From the phylogenetic tree (fig.14), it can be inferred that Scytonema hofmanni
BTA124 was the first to diverge among the strains studied and found to be less evolved from
the rest of the strains sharing same ancestor with Anabaena sp. BTA650, Calothrix sp.
BTA265, Rivularia sp. BTA510, Nostoc sp. BTA197, Anabaena sp. BTA281, Anabaena
doliolum BTA280 and Nostoc sp. BTA676 belong to the same cluster. However, Calothrix
sp. BTA265 and Rivularia sp. BTA510 were in one clade which showed the close relatedness
and substitution supported by the bootstrap value 99%, Rivularia sp. BTA510 was more
diverged and less evolved than Calothrix sp. BTA265. The maximum parsimony tree (fig.15)
which is a character based method also was in agreement with the above method along with
good bootstraps values. In this case also, Scytonema hofmanni BTA124 was the most
diverged strains among all. Calothrix sp. BTA265 and Rivularia sp. BTA510 were supported
134
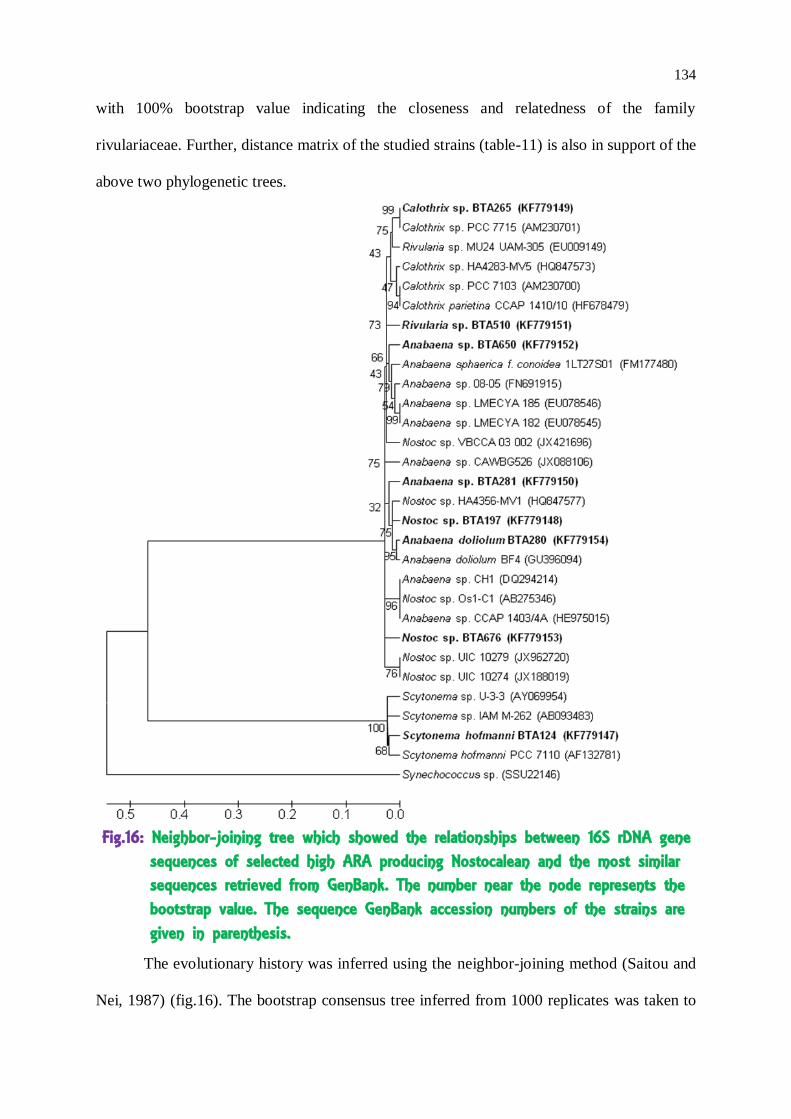
Fig.16: Neighbor-joining tree which showed the relationships between 16S rDNA gene sequences of selected high ARA producing Nostocalean and the most similar sequences retrieved from GenBank. The number near the node represents the bootstrap value. The sequence GenBank accession numbers of the strains are given in parenthesis.
with 100% bootstrap value indicating the closeness and relatedness of the family
rivulariaceae. Further, distance matrix of the studied strains (table-11) is also in support of the
above two phylogenetic trees.
The evolutionary history was inferred using the neighbor-joining method (Saitou and
Nei, 1987) (fig.16). The bootstrap consensus tree inferred from 1000 replicates was taken to

135
represent the evolutionary history of the taxa analyzed (Felsenstein, 1985). Branches
corresponding to partitions reproduced in less than 50% bootstrap replicates were collapsed.
The percentage of replicate trees in which the associated taxa clustered together in the
bootstrap test (1000 replicates) was shown next to the branches (Felsenstein, 1985). The
phylogenetic tree was linearized assuming equal evolutionary rates in all lineages (Takezaki
et al., 2004). The tree was drawn to scale, with branch lengths in the same units as those of
the evolutionary distances used to infer the phylogenetic tree. The evolutionary distances
were computed using the Kimura 2-parameter method (Kimura, 1980) and were in the units
of the number of base substitutions per site. All positions containing gaps and missing data
were eliminated from the dataset (complete deletion option). There were a total of 345
positions in the final dataset. Phylogenetic analyses were conducted in MEGA4 (Tamura et
al., 2007).
Scytonema hofmanni BTA124 forms homolog with Scytonema hofmanni PCC7110
which was supported by consensus of 68% falling under the family scytonemataceae cluster.
Nostoc sp. BTA676 was found to be diverged from Nostoc sp. UIC 10274 and Nostoc sp.UIC
10279 clade as the substitution rate was more than Nostoc sp. UIC 10274. Anabaena
doliolum BTA280 forms homolog with Anabaena doliolum BF4 showed 95% bootstrap value
supporting the similarity shown by BLASTN analysis. Nostoc sp. BTA197 showed the same
rate of substitution with Nostoc sp. HA4356-MV1 that was found to be 99% similarity in
BLAST test. Anabaena sp. BTA281 showed less substitution than Anabaena sp. CH1
forming separate cluster. Anabaena sp. BTA650 showed less substitution rate than Anabaena
sp. 08-05 thereby forming separate clade from the cluster of Anabaena sp. Rivularia sp.
BTA510 was found to be divergent from the rest of the rivulariaceae cluster due to least
substitution rate from the rest of the rivulariaceae cluster. Calothrix sp. BTA265 and

136
Calothrix sp. PCC175 shared same node and was found to be sister homolog supported by
99% bootstrap value.
The evolutionary history was inferred using the maximum parsimony (MP) method
(Eck and Dayhoff, 1966). The consensus tree inferred from 22 most parsimonious trees was
Fig.17: Maximum parsimony tree which showed the relationships between 16S rDNA gene sequences of selected high ARA producing Nostocalean and the most similar sequences retrieved from GenBank. The number near the node represents the bootstrap value. The sequence GenBank accession numbers of the strains are given in parenthesis.

137
shown (fig.17). Branches corresponding to partitions reproduced in less than 50% trees were
collapsed. The consistency index was (0.762626), the retention index was (0.890570) and the
composite index was 0.717250 (0.679172) for all sites and parsimony-informative sites (in
parentheses). The percentage of parsimonious trees in which the associated taxa clustered
together was shown next to the branches. The MP tree was obtained using the close-
neighbor-interchange algorithm with search level 3 (Felsenstein, 1985; Nei and Kumar, 2000)
in which the initial trees were obtained with the random addition of sequences (10 replicates).
The tree was drawn to scale, with branch lengths calculated using the average pathway
method and were in the units of the number of changes over the whole sequence. All
positions containing gaps and missing data were eliminated from the dataset (complete
deletion option). There were a total of 345 positions in the final dataset, out of which 198
were parsimony informative. Phylogenetic analyses were conducted in MEGA4 (Tamura et
al., 2007).
Scytonema hofmanni BTA124 and Scytonema hofmanni PCC7110 showed same node
and showed 100% bootstrap supporting the BLASTN test. Anabaena sp. BTA281 showed
divergent from Anabaena sp. CH1. Anabaena doliolum BTA280 and Anabaena doliolum
BF4 showed same node probably same ancestor supported by 100% bootstrap value. Nostoc
sp. BTA197 showed same node with Nostoc sp. HA4356-MV1 supported by 95% bootstrap
value with same characteristics. Rivularia sp. BTA510 was found to be most diverged from
rivulariaceae cluster which was least evolved and supported by 100%. Anabaena sp. BTA650
was found to be more evolved from Anabaena sp. 08-05. Nostoc sp. BTA676 showed more
evolved than Nostoc sp. UIC 10274 which was found to be diverged from each other.
The 16S rRNA tree topology did not match with that generated via RAPD analysis.

138
6.4. DISCUSSION
In the present investigation 09 selected Nostocalean cyanobacterial strains from north
eastern region of India which belong to different habitats were thoroughly investigated.
While cyanobacteria are undoubtedly a widely distributed group of organisms, cyanobacterial
experts have long debated the existence of cosmopolitan cyanobacteria (Komarek, 1985;
Komarek and Anagnostidis, 1999). Many researchers have concluded that many taxa are not
cosmopolitan, but have more narrowly defined geographic and ecological ranges than
previously thought and argue that endemism is probably common in cyanobacteria
(Komarek, 1999). For example, Cronberg and Komarek (2001, 2004) found that while some
planktonic strains of cyanobacteria from lentic African systems appear to be cosmopolitan,
the majority of prevalent taxa do not easily fit European species descriptions, and thus infer a
high level of regional endemism among both the Nostocales and Oscillatoriales.
Branco and Neechi (1996a, b) and Branco et al. (2001) documented many of the
common lotic cyanobacterial taxa from Brazil and point out that many of the taxa are likely
new to science. Some lineages apparently have numerous cryptic taxa (Boyer et al., 2002;
Casamatta et al., 2003), but it is difficult to reveal such species by morphology alone. Despite
the above findings, many researchers still suggest that cyanobacteria have a low level of
endemism (Vincent, 2000). The recent invasion of Cylindrospermopsis raciborskii from
tropical to temperate regions has been used as evidence that physiologically tolerant
cosmopolitan species exist (Briand et al., 2004). While some degree of variation is likely to
occur even among clonally related isolates (Hyttia et al., 1999; Roberts and Crawford, 2000),
the polymorphic profiles generated by RAPD analysis suggest considerable degree of intra
species heterogeneity despite morphological similarity.
Since morphology might not be strictly controlled by genetics (Saker et al., 1999),
genotypic variations are virtually indistinguishable by morphological means. The failure of

139
morphological features to distinguish cyanobacterial strains agrees with previous findings on
cyanobacterial strains using RAPD markers (Casamatta et al., 2003) and 16S rRNA gene
sequences (Payne et al., 2001). Other authors report that ultrastructural features (thylakoid
arrangement) are useful characters to define taxonomic relationships among closely related
taxa within cyanobacterial families (Casamatta et al., 2005). However, more recent study on
the thylakoid arrangement of cyanobacterial strains suggests that some taxa cannot be
distinguished based on their cellular ultrastructure (Marquardt and Palinska, 2007). The
probability of successful dispersal to other geographical areas depends strongly on the
effectiveness of the carrier and the ability of cyanobacteria to tolerate transport conditions
(Kristiansen, 1996a, b).
However, although nearly all the populations of cyanobacteria from different
locations differ to some degree from each other, yet they may stabilize in long-term cultures
(Waterbury and Rippka, 1989; Kato and Watanabe, 1993). The studies have indicated the
sensitivity of RAPD-PCR technique which is derived by using the entire genome as the PCR
template provides a taxonomy and phylogeny for the cyanobacteria which are comparable to
those achieved by more traditional methods. One of the major drawbacks of RAPD analysis
is the reproducing ability of the technique (Penner et al., 1993; Skroch and Nienhuis, 1995)
which is in agreement of the present study as the genera Scytonema and Calothrix clustered
with the nostocaceae family instead of clustering with their respective families.
The classification of cyanobacteria has routinely relied on morphological
characteristics which are not always trustworthy, as they may show variation depending on
culturing and environmental conditions (Nayak et al., 2007) and lead to misidentifications
(Komarek and Anagnostidis, 1989). These problems of traditional morphological
classification, together with the lack of molecular data, pose serious hindrances for taxonomy
and systematics of cyanobacteria (Hayes et al., 2007; Komarek, 2010).

140
In the present study, morphological characteristics of the studied strains (belonging to
the order Nostocales) revealed remarkable morphological differences between them and were
congruent with recent studies but also with traditional references. Besides morphological
examination, it is currently accepted that characterization and taxonomy of cyanobacteria
must combine multidisciplinary approaches (Castenholz and Waterbury, 1989; Wilmotte,
1994; Gillis et al., 2005; Hayes et al., 2007; Komarek, 2010). This so-called polyphasic
methodology (including phenotypic, chemotaxonomic and genotypic data) has been
increasingly followed by many cyanobacteriologists worldwide, e.g. Rajaniemi et al. (2005),
Willame et al. (2006), Nayak et al. (2007), Li et al. (2008), Saker et al. (2009) and Schleifer
(2009). Among the molecular methods, the analysis of the 16S rRNA gene sequences has
proved to be a useful tool for exploring phylogenetic relationships among cyanobacteria
(Gugger et al., 2002a; Pan et al., 2008; Han et al., 2009; Zapomelova et al., 2010).
The pairwise similarity analysis between the 16S rDNA gene sequence of the
Nostocalean strains showed high identity score between Scytonema hofmanni BTA124 and
Scytonema hofmanni PCC 7110 (AF132781), Nostoc sp. BTA197 and Nostoc sp. HA4356-
MV1 NCBI (HQ847577), Calothrix sp. BTA265 and Calothrix sp. PCC 7715 (AM230701),
Anabaena sp. BTA281 and Anabaena sp. CH1 NCBI (DQ294214), Rivularia sp. BTA510
and Rivularia sp. MU24 UAM-305 (EU009149), Anabaena sp. BTA650 and Anabaena sp.
08-05 (FN691915), Nostoc sp. BTA676 and Nostoc sp. UIC 10274 (JX1880019), Anabaena
doliolum BTA280 and Anabaena doliolum BF4 (GU396094), Anabaena bergii BTA284 and
Anabaena bergii ANA283A (FJ234897) The GenBank accession numbers allotted for the
studied strains which belong to north eastern region of India were KF779147 to KF779155.
The correct identities of the selected Nostocalean strains can be established with a
combination of both morphological and molecular data particularly of 16S rRNA and may
facilitate establishing taxonomic positions of the problematic Nostocalean group.


