

Direct Observation of Dynamic Symmetry Breaking
above Room Temperature in Methylammonium Lead
Iodide Perovskite
Alexander N. Beecher,†,⊥ Octavi E. Semonin,†,⊥ Jonathan M. Skelton,‡ Jarvist M.
Frost,‡ Maxwell W. Terban,¶ Haowei Zhai,¶ Ahmet Alatas,§ Jonathan S. Owen,†
Aron Walsh,‡ and Simon J. L. Billinge∗,¶,‖
Department of Chemistry, Columbia University, New York, NY 10027, USA, Department of
Chemistry, University of Bath, Claverton Down, Bath BA2 7AY, UK, Department of Applied
Physics and Applied Mathematics, Columbia University, New York, NY 10027, USA, Advanced
Photon Source, Argonne National Laboratory, Argonne, IL, 60439, USA, and Condensed Matter
Physics and Materials Science Department, Brookhaven National Laboratory, Upton, NY 11973,
USA
E-mail: [email protected]
Abstract
Lead halide perovskites such as methylammonium lead triiodide (CH3NH3PbI3) have out-
standing optical and electronic properties for photovoltaic applications, yet a full understand-
ing of how this solution processable material works so well is currently missing. Previous∗To whom correspondence should be addressed†Department of Chemistry, Columbia University, New York, NY 10027, USA‡Department of Chemistry, University of Bath, Claverton Down, Bath BA2 7AY, UK¶Department of Applied Physics and Applied Mathematics, Columbia University, New York, NY 10027, USA§Advanced Photon Source, Argonne National Laboratory, Argonne, IL, 60439, USA‖Condensed Matter Physics and Materials Science Department, Brookhaven National Laboratory, Upton, NY
11973, USA⊥Contributed equally to this work
1
arX
iv:1
606.
0926
7v2
[co
nd-m
at.m
trl-
sci]
5 O
ct 2
016

research has revealed that CH3NH3PbI3 possesses multiple forms of static disorder regard-
less of preparation method, which is surprising in light of its excellent performance. Using
high energy resolution inelastic X-ray (HERIX) scattering, we measure phonon dispersions in
CH3NH3PbI3 and find direct evidence for another form of disorder in single crystals: large
amplitude anharmonic zone-edge rotational instabilities of the PbI6 octahedra that persist to
room temperature and above, left over from structural phase transitions that take place tens
to hundreds of degrees below. Phonon calculations show that the orientations of the methy-
lammonium (CH3NH+3 ) couple strongly and cooperatively to these modes. The result is a
non-centrosymmetric, instantaneous local structure, which we observe in atomic pair distribu-
tion function (PDF) measurements. This local symmetry breaking is unobservable by Bragg
diffraction, but can explain key material properties such as the structural phase sequence, ul-
tra low thermal transport, and large minority charge carrier lifetimes despite moderate carrier
mobility.
Structural imperfections normally reduce the photovoltaic action of a material by reducing the
carrier mobilities and providing non-radiative recombination pathways for the photo-generated
carriers. CH3NH3PbI3 exhibits significant nanocrystallinity,1 defects2 and dynamic disorder;3,4
characteristics not normally associated with high efficiency photovoltaic devices.5 The puzzle with
hybrid halide perovskites is how such a defective solution processed material can have efficiencies
rivaling those of high quality crystalline semiconductors.6 Two kinds of framework structural in-
stabilities are expected to be present in perovskites: octahedral tilting,7 which is associated with
antiferroelectricity; and cation off-centering, which can sometimes yield a ferroelectrically active
2

distortion.8 Polarity in the material can affect the optical and electrical properties,9–12 but the
presence of persistent polarity in these materials has not been established and continues to be dis-
puted.13–16 In CsPbCl3, octahedral rotational instabilities have been directly observed by inelastic
neutron scattering23 and more indirectly for CH3NH3PbBr3 and CH3NH3PbCl3.24–26 However, in
CH3NH3PbI3, while the disorder of the organic cation has been extensively investigated,3,13,17–19
only calculations combined with indirect measurements have predicted octahedral rotational insta-
bilities in the cubic phase.20–22 In this work, we directly observe the lattice dynamics related to
these framework distortions and connect them to the physical properties of CH3NH3PbI3.
Inelastic scattering is a standard method to quantify these kinds of dynamics. However, inelas-
tic neutron scattering experiments (INS) require large single crystals and are additionally challeng-
ing on hybrid materials such as CH3NH3PbI3 due to the strong incoherent scattering of hydrogen.
We circumvent these issues by using X-ray based HERIX, which has a larger scattering cross
section and sensitivity, and better selectivity for motion of the inorganic framework.
Measurements were performed on high quality single crystals of CH3NH3PbI3 at the Advanced
Photon Source at the Argonne National Laboratory. Due to the large absorption cross-section of
lead and iodine, crystals were polished to about 100 µm and mounted on a copper post (Fig. S??A).
This polishing and mounting preserves the high quality single crystal, as shown by single crystal
X-ray diffraction (Fig. S??B). Measurements were performed at 350 K, in the cubic (Pm3m) phase,
which gave a reasonable phonon intensity and removed difficulties associated with crystal twin-
ning. Transverse acoustic (TA) and longitudinal acoustic (LA) phonon energies were measured
along the three high-symmetry directions of the Brillouin zone, and one transverse optical (TO)
branch was also measured. Representative plots of the raw spectra are shown in Fig. 1.
The transverse acoustic branch in the [00ζ ] direction (X) is shown in Fig. 1a. Close to the
zone-center (ζ = 0), the strongest signal is a resolution-limited elastic line coming from the tail
of the nearby Bragg peak. Moving across the zone to the zone-edge, the elastic Bragg tail quickly
dies off in intensity (indicated by the dashed line) and inelastic shoulders coming from the low
energy acoustic modes become well resolved peaks at higher energy transfer (hω). These peaks
3
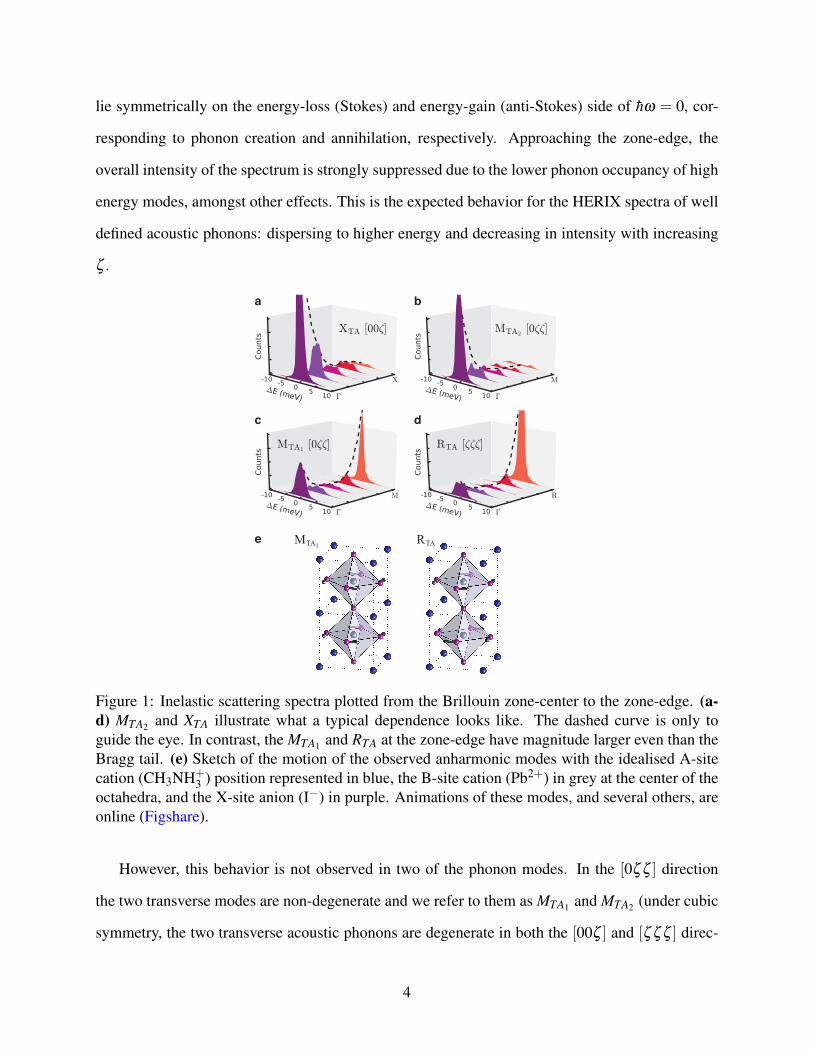
lie symmetrically on the energy-loss (Stokes) and energy-gain (anti-Stokes) side of hω = 0, cor-
responding to phonon creation and annihilation, respectively. Approaching the zone-edge, the
overall intensity of the spectrum is strongly suppressed due to the lower phonon occupancy of high
energy modes, amongst other effects. This is the expected behavior for the HERIX spectra of well
defined acoustic phonons: dispersing to higher energy and decreasing in intensity with increasing
ζ .
1MTA TA
c
b
d
a
e R
Figure 1: Inelastic scattering spectra plotted from the Brillouin zone-center to the zone-edge. (a-d) MTA2 and XTA illustrate what a typical dependence looks like. The dashed curve is only toguide the eye. In contrast, the MTA1 and RTA at the zone-edge have magnitude larger even than theBragg tail. (e) Sketch of the motion of the observed anharmonic modes with the idealised A-sitecation (CH3NH+
3 ) position represented in blue, the B-site cation (Pb2+) in grey at the center of theoctahedra, and the X-site anion (I−) in purple. Animations of these modes, and several others, areonline (Figshare).
However, this behavior is not observed in two of the phonon modes. In the [0ζ ζ ] direction
the two transverse modes are non-degenerate and we refer to them as MTA1 and MTA2 (under cubic
symmetry, the two transverse acoustic phonons are degenerate in both the [00ζ ] and [ζ ζ ζ ] direc-
4

tions). The intensity of the MTA2 branch behaves normally, similar to the transverse [00ζ ] mode
(Fig. 1b), but the MTA1 mode behaves very differently as the zone is crossed from center to edge.
Now, approaching the zone-edge, a strikingly large broad central peak emerges at ζ = 0.4 and
becomes narrower and very intense at ζ = 0.5 (Fig. 1c). The large signal intensity results from the
low energy, and therefore high phonon occupation, of these modes. Even more dramatic behavior
is seen in the response of the RTA mode in the [ζ ζ ζ ] direction, with a resolution-limited hω = 0
peak at the R-point of intensity twelve times the corresponding peak at ζ = 0.1 (Fig. 1d). These
two modes are the most important features of our observed lattice dynamics and correspond to
rotation of the octahedra along the principal cubic axes, with neighboring octahedra along the rota-
tion axis either rotating together (MTA1) or opposite (in-phase and out-of-phase tilting respectively)
to each other (RTA). This motion is illustrated in Fig. 1e.23
We have extracted phonon dispersions for the seven non-degenerate acoustic branches and one
transverse optic branch (Fig. 2). Details of the fitting are presented in the Methods and Fig. S??.
From the initial slope of the acoustic phonons, we extract elastic constants and the bulk modulus
(K = 13±2 GPa), which implies that CH3NH3PbI3 has a softness similar to wood27 (Table S??).
The width (Γ) of the Lorentz oscillator lineshape used to fit the modes is related to the phonon
lifetime, τ = h/Γ. This analysis yields phonon lifetimes between 0.8 and 20 ps. Interestingly,
these lifetimes are comparable to the residence time of CH3NH+3 in different preferred orienta-
tions as measured by quasi-elastic neutron scattering (QENS) at room temperature.18 Combined
with the anharmonic phonon modes, these short phonon lifetimes explain the ultra-low thermal
conductivity,28 as in related lead chalcogenides.29,30
We now turn to first-principles lattice dynamics calculations of the phonon spectrum. The
calculated and measured dispersions along the three directions are in good agreement, as evident
in Fig. 2. The strong softening of the MTA1 and RTA modes is predicted by the athermal harmonic
calculations, where the mode frequencies become imaginary at ζ = 0.3, close to where the onset
of mode softening is observed in experiment.
The spread (shaded regions in Fig. 2b) in the calculated dispersion curves arise from the
5

ΓX0
1
2
3
4
5
6
7Energ
y (
meV
)a
XLA
XTA
M
MLA
MTA1
MTA2
MTO
Γ R
RLA
RTA
ΓX2
1
0
1
2
3
4
5
6
7
Energ
y (
meV
)
b
TA1
M
TA2
Γ R
LA
Figure 2: Measured and calculated dispersion curves. (a) The X , M, and R longitudinal acoustic(LA) and transverse acoustic (TA) modes, and one transverse optical (TO) branch measured byHERIX are plotted. The 1σ uncertainty in ζ and phonon energy (by fitting) are generally less thanthe size of the marker. The lines (sine fits) are only to guide the eye. At the zone-edge of M andR the phonon energy becomes small and overdamped, so we fit to a Lorentzian peak convolutedwith the resolution function and centered at hω = 0 meV, and plot bars with height equal to thehalf width at half maximum of the Lorentzian. (b) Calculated phonon dispersion curves becomeimaginary along MTA1 and RTA as expected for a soft mode.
6

anisotropy of the molecule, which breaks the degeneracy of the high-symmetry points in the Bril-
louin zone. This shows very different restoring forces and mode energies calculated depending
on the orientation of the ion in the cage, indicating a strong coupling of the CH3NH+3 dynamics
to the cubo-octahedral cage in which it resides. The spread, and therefore the coupling, is largest
at the zone edge (Fig. 2b) where the modes soften to zero frequency and are found to be highly
anharmonic.
Considered alongside QENS measurements18 that indicate a hopping rotational dynamics of
the CH3NH+3 , we conclude that the rotational motions of the cation and the cage dynamics are
cooperative with important implications discussed below. Octahedral tilting varies the shape of
the perovskite A-site cavity in which the CH3NH+3 ions reside. As the cavity distorts, it elongates
along one direction and is shortened in the perpendicular direction (Fig. 3a,b). The above analysis
suggests that the CH3NH+3 ions stay aligned within locally-distorted A sites, and only fluctuate
between different local minima of the distorted cavity, cooperatively, on picosecond timescales.
On a timescale important for charge carriers (5 fs carrier scattering time31) and at solar-relevant
temperatures, the crystal structure is effectively frozen in local metastable symmetry-broken do-
mains.
The computed potential landscapes of the anharmonic modes are indeed displaced minima of
shallow double-well potentials (Fig. 3c and Fig. S??), consistent with our observation of a central
peak in the inelastic spectra. This dynamic symmetry breaking (see animations in the Support-
ing Information and Figshare) is also evident in room temperature ab initio molecular dynamics
simulations where persistent octahedral tilting away from the high-symmetry cubic orientation is
observed.32
Further evidence for this hypothesis is provided by X-ray atomic pair-distribution function
(PDF) analysis of these materials. We discover that the low-r region (where r is the inter-atomic
distance) of the PDF is better fit by low symmetry tetragonal models than the cubic one, even at
350 K (Fig. 3d), indicating that the local structure is best described by tilted octahedra. The PDF
refinement is further improved at low-r when Pb is allowed to displace (0.041 Å) from the high-
7

c
d
a b
cubic nonequilibriumstructure
local instantaneousstructure
Figure 3: Local symmetry breaking in CH3NH3PbI3 at 350 K. (a,b) Distortions from cubic sym-metry generate anisotropic cavities and couple to motion of the CH3NH+
3 ion, which we representas off-centered and oriented along the long-axis of the cavity. (c) DFT-based lattice dynamic cal-culations show that the energy minimum at the R-point at 350 K is displaced in a double-wellpotential that causes local symmetry breaking. (d) Comparison of the experimental PDF (purple)to cubic (Pm3m), centrosymmetric (I4/mcm), and non-centrosymmetric (I4cm) tetragonal models(blue) show a superior fit for the low-symmetry models at low-r (2-8 Å). However, the modelsperform oppositely at high-r with the high-symmetry cubic structure giving the best agreement tothe data in the 12-50 Å region. The residuals (orange) are scaled ×3 for clarity.
8

symmetry position (Fig. 3d, bottom row). When we zoom out to the high-r region, we discover
that a cubic model gives a better fit (Fig. 3d, second column), as expected due to averaging over
dynamic differently-oriented symmetry-broken domains. By performing PDF fits across different
refinement ranges (Fig. S??), we estimate the domain size to be 1-3 nm in diameter. Given the
off-centering of the Pb and the methylammonium,33,34 these domains may be polar.
The anharmonic modes indicate an incipient phase transition to the symmetry broken phases
that emerge at lower temperatures, but with diffusive (order-disorder) dynamics persisting many
tens to hundreds of Kelvin above the transition temperatures. This is further supported by the
intensity of the XTA, MTA1 , and RTA zone-edge peaks as a function of temperature. As shown in
320 340 360 380Temp (K)
0
1
2
3
4
5
∆C
ounts
(×
103)
PT =
33
0 K
X
M
R
-2 -1 0 1 2Energy transfer (meV)
0
2
4
6
8
10C
ounts
(×
103)
[.5,.5,.5]320 K
330 K
340 K
350 K
360 K
370 K
380 K
a b
Figure 4: Temperature dependence of inelastic scattering spectra. (a,b) Intensity as a function oftemperature is measured at the X-, M-, and R-points (∆Counts is equal to intensity of the mea-sured mode at a given temperature less the intensity of the least intense peak in the temperatureseries). Scattering at the X-point has little temperature dependence while scattering at the M-pointslightly increases in intensity with decreasing temperature. In contrast, scattering at the R-pointresponds dramatically, increasing sharply upon approaching the phase transition temperature dueto the emergence of a Bragg peak in the tetragonal phase. This response indicates that the phasetransition is driven by condensation of the RTA mode at 330 K.
Fig. 4, there is no change in the intensity of the zone-edge XTA, but the intensity of the zone-
edge RTA intensity diverges sharply through the 330 K phase transition as a Bragg peak of the new
tetragonal (I4/mcm) phase grows in. There is little change in the intensity of the zone-edge MTA1 at
this temperature, suggesting that the MTA1 mode is related to the lower temperature phase transition
at 160 K, reversing the sequence observed in CsPbCl3.23 Although it was not possible to track this
peak to 160 K due to the difficulty of aligning a sample with changing lattice constants, this finding
is supported by crystallography14 where a Bragg peak is observed in the low-temperature phase at
9

the pseudo-cubic M-point of the parent structure.
We now explore implications of the discovery of soft anharmonic motion in CH3NH3PbI3.
First, the soft anharmonic modes provide a large bath of acoustic phonons that are available for
scattering and thermalising carriers. The population of low-energy phonons may explain the find-
ing that electrical transport in these materials is phonon-limited.31 In CH3NH3PbI3, the electronic
band extrema are in the vicinity of the R point, though made slightly indirect by the Rashba in-
teraction.35 As well as local intravalley scattering (by acoustic and optical phonons at Γ), there is
the possibility of intervalley scattering from phonon modes at the Brillouin zone boundary. These
are low in energy with a large occupancy at room temperature, suggesting that intervalley scat-
tering may be significant. In the material GaP,36 where the band extrema have multiple valleys,
intervalley scattering dominates mobility above 200 K.
Second, these anharmonic modes point to a general model of the structural phase sequence
in lead halide perovskites. The cubic-to-tetragonal phase transition arises from a condensation
of the RTA mode (antisymmetric octahedral tilts, R+4 ), while the tetragonal-to-orthorhombic phase
transition is driven by condensation of the MTA1 mode (concerted octahedral tilts, M+3 ).8 In cesium
lead halides the order is reversed,23 likely due to a different coupling mechanism of Cs+ to the M+3
and R+4 modes. The M+
3 and R+4 distortions may also explain the anomalously large halide atomic
displacement parameters seen in structural analyses of many of these materials.14,37
Last, the observation of an instantaneous symmetry broken local structure caused by the com-
bined effects of octahedral tilting and CH3NH+3 and Pb off-centering will have implications for the
electronic band structure, and therefore carrier recombination. For example, the presence of a local
electric polarization can result in an indirect band gap20 or spatial separation of the electron and
hole,9,10,12 which will reduce carrier recombination and thus benefit photovoltaic performance.
The off-centering and orientation of the CH3NH+3 ions, coupled to the local symmetry broken
state, can support a quasi-static local polarization that persists over a wide temperature range if the
CH3NH+3 ion displacement and orientation correlate between crystallographic unit cells. This po-
larization may promote the formation of polarons upon photoexcitation, which can protect carriers
10

from recombination.11
Experimental
Sample Preparation
Single crystals of CH3NH3PbI3 were grown via vapor diffusion,38 as reported previously.39 Crys-
tals with original dimensions on the order of 1 mm were polished down to flakes with a thickness
of approximately 90 µm, the X-ray attenuation length of CH3NH3PbI3 for an X-ray energy of 23.7
keV. We performed a single-crystal X-ray diffraction experiment to confirm that samples remained
single-crystalline after polishing.
Data collection
Measurements were performed on the high-energy resolution inelastic X-ray (HERIX) scatter-
ing instrument at Sector 30-ID of the Advanced Photon Source at Argonne National Laboratory
with incident beam energy of 23.724 keV (λ = 0.5226 Å) and an overall energy resolution of
1.5 meV.40,41 Crystals were mounted on a copper rod using epoxy (Fig. ??b) and placed inside
a beryllium dome. Temperature control was achieved through use of a cryostat. The horizontally
polarized incident beam was focused on the sample using a bimorph KB mirror system with a
beam size of 15×35 µm2 (V ×H) full width at half maximum (FWHM) at the scattering location.
Energy scans, typically in the ±8 meV range with a 0.5 meV step and a collection time of 30 s per
point, were taken at fixed momentum transfers Q = H +q, where H is the reciprocal lattice vector
and q is the phonon wave vector. The scattered beam was analyzed by a system of nine, equally
spaced, spherically bent Si(12 12 12) analyzers. The standard momentum transfer resolution of
the HERIX instrument is 0.066 Å−1
. For the dispersion measurements, we placed a circular slit
in front of the analyzer to increase the momentum transfer resolution to 0.020 Å−1
. The basic
principles of such instrumentation are discussed elsewhere.42,43
11

A small elastic component remains at the center at all positions across the zone, coming from
static disorder associated with defects in the material. This disorder scattering increases slowly
with time in the beam, indicating the presence of beam-damage to the sample (Fig. S??). The level
of the beam damage is small, containing less intensity than the phonon signals, and was mitigated
experimentally by frequently moving the beam to a fresh area of the crystal and realigning the
sample.
Analysis of phonon spectra
The shape of the incident X-ray energy spectrum was fit using a pseudo-Voigt function. This
experimental resolution function r(hω) was then convolved with both an elastic and an inelastic
scattering component to reproduce the entire spectra as in,
S(hω) = r(hω)∗ (δ (hω)+F(hω)) , (1)
where the elastic component was given by a delta function centered on the zero-point so that
the elastic scattering would be given by the resolution function. To model the inelastic scattering
component, a single-phonon scattering model was assumed, and is defined as the response function
for a damped harmonic oscillator, given by,
F(hω) = N(hω)Γhω
(hω2− hω2
0)2
+Γ2hω2, (2)
corrected for temperature-dependent occupation of phonon modes and the relationship between
energy gain and energy loss processes using a Bose-Einstein distribution adjusted by the detailed
balance factor44 N(hω):
N(hω) =1
1− e−hω/kT. (3)
Phonon lifetimes were estimated by τ = h/Γ. For the soft zone-edge modes centered at hω = 0
these are fit with a Lorentzian centered on zero frequency, convoluted with the resolution func-
12

tion, and plotted in Fig. 2 with the bars of height equal to the half width at half maximum of the
Lorentzian.
The respective phonon velocities were extracted from the initial slope of the seven acoustic
phonon branches. These phonon velocities were used to extract elastic constants by minimizing
the difference between the measured velocities and those predicted by v(C11,C12,C44). The bulk
modulus was calculated from the elastic constants as K = (C11 +2C12)/3.
Pair distribution function data collection and analysis
Total scattering PDF measurements were carried out on beamline 28-ID-2 at the National Syn-
chrotron Light Source II (NSLS-II) at Brookhaven National Laboratory. Data were collected in
rapid acquisition mode45 at an x-ray energy of 67.603 keV (λ = 0.18340 ) and a temperature of
350 K. A large area 2D Perkin-Elmer detector (2048×2048 pixels and 200×200 µm pixel size)
was mounted orthogonal to the beam path with a sample-to-detector distance of 207.5270 mm.
Calibration was performed using FIT2D46 on a measurement of nickel. The raw 2D intensity was
corrected for experimental effects and azimuthally integrated using FIT2D to obtain the 1D scat-
tering intensity versus the magnitude of the scattering momentum transfer Q (Q = 4π sinθ/λ for
a scattering angle of 2θ and x-ray wavelength λ ). xPDFsuite47,48 was used for data reduction and
Fourier transformation of the total scattering structure function S(Q) to obtain the PDF, G(r), by
G(r) =2π
∫ Qmax
Qmin
Q[S(Q)−1]sin(Qr)dQ, (4)
where the integration limits, Qmin–Qmax, were governed by the experimental setup.
PDFs refinements were carried out using the program PDFgui,49 in which PDFs were simulated
from model structures using
G(r) =1
rN ∑i, j 6=i
f ∗i f j
〈 f 〉2 δ (r− ri j)−4πrρ0, (5)
summed over all atoms in the model with periodic boundary conditions on the unit cell. N is the
13

number of atoms, fi and f j are the x-ray atomic form factors of atoms i and j respectively, and
ρ0 is the average atom-pair density. Models were derived from cubic and tetragonal structures of
CH3NH3PbI3 determined by neutron powder diffraction.33 Unit cell parameters, thermal factors,
and symmetry allowed positions were refined to give the best fit to the experimental data. Experi-
mental resolution parameters Qdamp=0.0434148 and Qbroad=0.0164506, were determined through
refinements of the PDF of the nickel standard.
Materials modeling
First-principles calclations were carried out using the pseudopotential plane-wave density-functional
theory (DFT) code, VASP,50 in conjunction with the Phonopy lattice-dynamics package.51,52 The
calculations are described in detail elsewhere.21 Projector augmented-wave pseudopotentials53,54
were used, which included the Pb semicore 5d electrons in the valence region. A 700 eV kinetic-
energy cutoff was used for the basis set, and a Γ-centred k-point mesh with 6×6×6 subdivisions
was used to sample the electronic Brillouin zone. A tolerance of 10−8 eV was applied during the
electronic minimisations, and the initial structure was optimised to a force tolerance of 10−3 eV/A.
These tight convergence criteria were found to be necessary for accurate lattice-dynamics calcula-
tions, in particular to eliminate spurious imaginary modes.
Force-constant matrices (FCMs) were calculated from a 2× 2× 2 supercell expansion. Har-
monic phonon dispersions were computed along the Γ→ X , Γ→M and Γ→ R segments of the
phonon Brillouin zone, as measured in the HERIX experiments, and the nature of the anharmonic
modes at M and R were investigated by visualising the phonon-mode eigenvectors (see Supporting
Information and Figshare for animations). Images of the cubic nonequilibrium and local instan-
taneous structures (Fig. 3) were generated with VESTA.55 In our model, the CH3NH+3 cation is
roughly aligned along the Cartesian x direction, between two faces of the cuboctahedral cavity,
which was found in previous work to be the energetically-preferred configuration.56 The fixed
cation orientation breaks the cubic symmetry, leading to three inequivalent X and M directions, all
three of which were analysed in the simulated dispersions.
14

Acknowledgement
Work in the Billinge-group was funded by the US National Science Foundation through grant
DMR-1534910. Growth and characterization of single crystals was supported by the Center for
Precision Assembly of Superstratic and Superatomic Solids, an NSF MRSEC (Award Number
DMR-1420634). This research used resources of the Advanced Photon Source, a U.S. Depart-
ment of Energy (DOE) Office of Science User Facility operated for the DOE Office of Science
by Argonne National Laboratory under Contract No. DE-AC02-06CH11357. X-ray PDF mea-
surements were conducted on beamline 28-ID-2 of the National Synchrotron Light Source II, a
U.S. Department of Energy (DOE) Office of Science User Facility operated for the DOE Office
of Science by Brookhaven National Laboratory under Contract No. DE-SC0012704. The work at
Bath has been supported by the EPSRC (Grant Nos. EP/L000202, EP/M009580/1, EP/K016288/1
and EP/K004956/1), and Federico Brivio is thanked for preliminary phonon calculations. We are
grateful to Soham Banerjee for assistance with PDF measurements, and to Bogdan M. Leu, Daniel
W. Paley, Ayman Said, John Tranquada, and Omer Yaffe for helpful conversations.
Supporting Information Available:
Figures showing the crystal of CH3NH3PbI3 used for HERIX measurements, HERIX spectra fit-
ting, calculated potential energy surfaces for ion displacement in CH3NH3PbI3 comparison of
PDF refinements, HERIX energy scans as a function of temperature, and evidence of sample in-
stability in the X-ray beam as well as a table of extracted elastic constants are all available in the
Supporting Information.
References
(1) Choi, J. J.; Yang, X.; Norman, Z. M.; Billinge, S. J. L.; Owen, J. S. Structure of Methy-
lammonium Lead Iodide Within Mesoporous Titanium Dioxide: Active Material in High-
Performance Perovskite Solar Cells. Nano Lett. 2014, 14, 127–133.
15

(2) Walsh, A.; Scanlon, D. O.; Chen, S.; Gong, X. G.; Wei, S.-H. Self-Regulation Mechanism
for Charged Point Defects in Hybrid Halide Perovskites. Angew. Chem. Int. Edit. 2015, 54,
1791–1794.
(3) Poglitsch, A.; Weber, D. Dynamic disorder in methylammoniumtrihalogenoplumbates (II)
observed by millimeter-wave spectroscopy. J. Chem. Phys. 1987, 87, 6373–6378.
(4) Yaffe, O.; Guo, Y.; Hull, T.; Stoumpos, C. C.; Tan, L. Z.; Egger, D. A.; Zheng, F.; Szpak, . G.;
Semonin, O. E.; Beecher, A. N. et al. The nature of dynamic disorder in lead halide perovskite
crystals. arXiv:1604.08107 [cond-mat] 2016, arXiv: 1604.08107.
(5) Stranks, S. D.; Snaith, H. J. Metal-halide perovskites for photovoltaic and light-emitting de-
vices. Nat. Nanotechnol. 2015, 10, 391–402.
(6) Green, M. A.; Emery, K.; Hishikawa, Y.; Warta, W.; Dunlop, E. D. Solar cell efficiency tables
(version 47). Prog. Photovoltaics 2016, 24, 3–11.
(7) Glazer, A. M. Simple ways of determining perovskite structures. Acta Crystallogr., Sect. A
1975, 31, 756–762.
(8) Benedek, N. A.; Fennie, C. J. Why Are There So Few Perovskite Ferroelectrics? J. Phys.
Chem. C 2013, 117, 13339–13349.
(9) Frost, J. M.; Butler, K. T.; Brivio, F.; Hendon, C. H.; van Schilfgaarde, M.; Walsh, A. Atom-
istic Origins of High-Performance in Hybrid Halide Perovskite Solar Cells. Nano Lett. 2014,
14, 2584–2590.
(10) Ma, J.; Wang, L.-W. Nanoscale Charge Localization Induced by Random Orientations of
Organic Molecules in Hybrid Perovskite CH 3NH 3PbI 3. Nano Lett. 2015, 15, 248–253.
(11) Zhu, X. Y.; Podzorov, V. Charge Carriers in Hybrid Organic–Inorganic Lead Halide Per-
ovskites Might Be Protected as Large Polarons. J. Phys. Chem. Lett. 2015, 6, 4758–4761.
16

(12) Liu, S.; Zheng, F.; Koocher, N. Z.; Takenaka, H.; Wang, F.; Rappe, A. M. Ferroelectric
Domain Wall Induced Band Gap Reduction and Charge Separation in Organometal Halide
Perovskites. J. Phys. Chem. Lett. 2015, 6, 693–699.
(13) Stoumpos, C. C.; Malliakas, C. D.; Kanatzidis, M. G. Semiconducting tin and lead iodide
perovskites with organic cations: phase transitions, high mobilities, and near-infrared photo-
luminescent properties. Inorg. Chem. 2013, 52, 9019–9038.
(14) Baikie, T.; Barrow, N. S.; Fang, Y.; Keenan, P. J.; Slater, P. R.; Piltz, R. O.; Gutmann, M.;
Mhaisalkar, S. G.; White, T. J. A combined single crystal neutron/X-ray diffraction and solid-
state nuclear magnetic resonance study of the hybrid perovskites CH 3NH 3PbX 3(X = I, Br
and Cl). J. Mater. Chem. A 2015, 3, 9298–9307.
(15) Stroppa, A.; Quarti, C.; De Angelis, F.; Picozzi, S. Ferroelectric Polarization of
CH3NH3PbI3: A Detailed Study Based on Density Functional Theory and Symmetry Mode
Analysis. J. Phys. Chem. Lett. 2015, 6, 2223–2231.
(16) Beilsten-Edmands, J.; Eperon, G. E.; Johnson, R. D.; Snaith, H. J.; Radaelli, P. G. Non-
ferroelectric nature of the conductance hysteresis in CH3NH3PbI3 perovskite-based photo-
voltaic devices. Appl. Phys. Lett. 2015, 106, 173502.
(17) Wasylishen, R. E.; Knop, O.; Macdonald, J. B. Cation rotation in methylammonium lead
halides. Solid State Comm. 1985, 56, 581–582.
(18) Leguy, A. M. A.; Frost, J. M.; McMahon, A. P.; Sakai, V. G.; Kochelmann, W.; Law, C.;
Li, X.; Foglia, F.; Walsh, A.; O’Regan, B. C. et al. The dynamics of methylammonium ions
in hybrid organic–inorganic perovskite solar cells. Nat. Commun. 2015, 6, 7124.
(19) Chen, T.; Foley, B. J.; Ipek, B.; Tyagi, M.; Copley, J. R. D.; Brown, C. M.; Choi, J. J.; Lee, S.-
H. Rotational dynamics of organic cations in the CH 3 NH 3 PbI 3 perovskite. Phys. Chem.
Chem. Phys. 2015, 17, 31278–31286.
17

(20) Quarti, C.; Mosconi, E.; De Angelis, F. Interplay of Orientational Order and Electronic Struc-
ture in Methylammonium Lead Iodide: Implications for Solar Cell Operation. Chem. Mater.
2014, 26, 6557–6569.
(21) Brivio, F.; Frost, J. M.; Skelton, J. M.; Jackson, A. J.; Weber, O. J.; Weller, M. T.; Goñi, A. R.;
Leguy, A. M. A.; Barnes, P. R. F.; Walsh, A. Lattice dynamics and vibrational spectra of the
orthorhombic, tetragonal, and cubic phases of methylammonium lead iodide. Phys. Rev. B
2015, 92, 144308.
(22) Quarti, C.; Mosconi, E.; Ball, J. M.; D’Innocenzo, V.; Tao, C.; Pathak, S.; Snaith, H. J.;
Petrozza, A.; De Angelis, F. Structural and optical properties of methylammonium lead iodide
across the tetragonal to cubic phase transition: implications for perovskite solar cells. Energy
Environ. Sci. 2016, 9, 155–163.
(23) Fujii, Y.; Hoshino, S.; Yamada, Y.; Shirane, G. Neutron-scattering study on phase transitions
of CsPb Cl3. Phys. Rev. B 1974, 9, 4549–4559.
(24) Swainson, I. P.; Hammond, R. P.; Soullière, C.; Knop, O.; Massa, W. Phase transitions in the
perovskite methylammonium lead bromide, CH3ND3PbBr3. J. Solid State Chem. 2003, 176,
97–104.
(25) Chi, L.; Swainson, I.; Cranswick, L.; Her, J.-H.; Stephens, P.; Knop, O. The ordered phase of
methylammonium lead chloride CH3ND3PbCl3. J. Solid State Chem. 2005, 178, 1376–1385.
(26) Swainson, I. P.; Stock, C.; Parker, S. F.; Van Eijck, L.; Russina, M.; Taylor, J. W. From soft
harmonic phonons to fast relaxational dynamics in CH3NH3PbBr3. Phys. Rev. B 2015, 92,
100303.
(27) Gindl, W.; Gupta, H. S. Cell-wall hardness and Young’s modulus of melamine-modified
spruce wood by nano-indentation. Composites, Part A 2002, 33, 1141–1145.
18

(28) Pisoni, A.; Jacimovic, J.; Barišic, O. S.; Spina, M.; Gaal, R.; Forró, L.; Horváth, E. Ultra-
Low Thermal Conductivity in Organic–Inorganic Hybrid Perovskite CH 3NH 3PbI 3. J. Phys.
Chem. Lett. 2014, 5, 2488–2492.
(29) Delaire, O.; Ma, J.; Marty, K.; May, A. F.; McGuire, M. A.; Du, M.-H.; Singh, D. J.;
Podlesnyak, A.; Ehlers, G.; Lumsden, M. D. et al. Giant anharmonic phonon scattering in
PbTe. Nat. Mater. 2011, 10, 614–619.
(30) Li, C. W.; Hong, J.; May, A. F.; Bansal, D.; Chi, S.; Hong, T.; Ehlers, G.; Delaire, O. Orbitally
driven giant phonon anharmonicity in SnSe. Nat. Phys. 2015, 11, 1063–1069.
(31) Karakus, M.; Jensen, S. A.; D’Angelo, F.; Turchinovich, D.; Bonn, M.; Cánovas, E. Phonon–
Electron Scattering Limits Free Charge Mobility in Methylammonium Lead Iodide Per-
ovskites. J. Phys. Chem. Lett. 2015, 6, 4991–4996.
(32) Frost, J. M.; Walsh, A. What Is Moving in Hybrid Halide Perovskite Solar Cells? Acc. Chem.
Res. 2016, 49, 528–535.
(33) Weller, M. T.; Weber, O. J.; Henry, P. F.; Di Pumpo, A. M.; Hansen, T. C. Complete structure
and cation orientation in the perovskite photovoltaic methylammonium lead iodide between
100 and 352 K . Chem. Commun. 2015, 51, 4180–4183.
(34) Ren, Y.; Oswald, I. W. H.; Wang, X.; McCandless, G. T.; Chan, J. Y. Orientation of Organic
Cations in Hybrid Inorganic–Organic Perovskite CH3NH3PbI3 from Subatomic Resolution
Single Crystal Neutron Diffraction Structural Studies. Cryst. Growth Des. 2016, 16, 2945–
2951.
(35) Brivio, F.; Butler, K. T.; Walsh, A.; van Schilfgaarde, M. Relativistic quasiparticle self-
consistent electronic structure of hybrid halide perovskite photovoltaic absorbers. Phys. Rev.
B 2014, 89, 155204.
19

(36) Kocsis, S. Lattice scattering mobility of electrons in GaP. Phys. Status Solidi A 1975, 28,
133–138.
(37) Worhatch, R. J.; Kim, H.; Swainson, I. P.; Yonkeu, A. L.; Billinge, S. J. L. Study of Local
Structure in Selected Organic–Inorganic Perovskites in the Pm3m Phase. Chem. Mater. 2008,
20, 1272–1277.
(38) Spingler, B.; Schnidrig, S.; Todorova, T.; Wild, F. Some thoughts about the single crystal
growth of small molecules . Cryst. Eng. Comm. 2012, 14, 751–757.
(39) Glaser, T.; Müller, C.; Sendner, M.; Krekeler, C.; Semonin, O. E.; Hull, T. D.; Yaffe, O.;
Owen, J. S.; Kowalsky, W.; Pucci, A. et al. Infrared Spectroscopic Study of Vibrational Modes
in Methylammonium Lead Halide Perovskites. J. Phys. Chem. Lett. 2015, 6, 2913–2918.
(40) Toellner, T. S.; Alatas, A.; Said, A. H. Six-reflection meV-monochromator for synchrotron
radiation. J. Synchrotron Radiat. 2011, 18, 605–611.
(41) Said, A. H.; Sinn, H.; Divan, R. New developments in fabrication of high-energy-resolution
analyzers for inelastic X-ray spectroscopy. J. Synchrotron Radiat. 2011, 18, 492–496.
(42) Sinn, H. Spectroscopy with meV energy resolution. J. Phys.: Condens. Matter 2001, 13,
7525–7537.
(43) Burkel, E. Phonon spectroscopy by inelastic x-ray scattering. Rep. Prog. Phys. 2000, 63,
171–232.
(44) Dorner, B. The scattering function and symmetry operations in the crystal. Coherent inelastic
neutron scaterring in lattice dynamics 1982, 16–24.
(45) Chupas, P. J.; Qiu, X.; Hanson, J. C.; Lee, P. L.; Grey, C. P.; Billinge, S. J. L. Rapid-
acquisition pair distribution function (RA-PDF) analysis. J. Appl. Crystallogr. 2003, 36,
1342–1347.
20

(46) Hammersley, A. P.; Svensson, S. O.; Hanfland, M.; Fitch, A. N.; Hausermann, D. Two-
dimensional detector software: From real detector to idealised image or two-theta scan. High
Pressure Res. 1996, 14, 235–248.
(47) Juhás, P.; Davis, T.; Farrow, C. L.; Billinge, S. J. L. PDFgetX3: a rapid and highly automat-
able program for processing powder diffraction data into total scattering pair distribution
functions. J. Appl. Crystallogr. 2013, 46, 560–566.
(48) Yang, X.; Juhás, P.; Farrow, C. L.; Billinge, S. J. L. xPDFsuite: an end-to-end software solu-
tion for high throughput pair distribution function transformation, visualization and analysis.
arXiv:1402.3163 [cond-mat] 2014, arXiv: 1402.3163.
(49) Farrow, C. L.; Juhas, P.; Liu, J. W.; Bryndin, D.; Božin, E. S.; Bloch, J.; Proffen, T.;
Billinge, S. J. L. PDFfit2 and PDFgui: computer programs for studying nanostructure in
crystals. J. Phys.: Condens. Matter 2007, 19, 335219.
(50) Kresse, G.; Hafner, J. Ab initio molecular dynamics for liquid metals. Phys. Rev. B 1993, 47,
558–561.
(51) Togo, A.; Oba, F.; Tanaka, I. First-principles calculations of the ferroelastic transition be-
tween rutile-type and CaCl2-type SiO2 at high pressures. Phys. Rev. B 2008, 78, 134106.
(52) Togo, A.; Tanaka, I. First principles phonon calculations in materials science. Scr. Mater.
2015, 108, 1–5.
(53) Blöchl, P. E. Projector augmented-wave method. Phys. Rev. B 1994, 50, 17953–17979.
(54) Kresse, G.; Joubert, D. From ultrasoft pseudopotentials to the projector augmented-wave
method. Phys. Rev. B 1999, 59, 1758–1775.
(55) Momma, K.; Izumi, F. VESTA 3 for three-dimensional visualization of crystal, volumetric
and morphology data. J. Appl. Cryst. 2011, 44, 1272–1276.
21

(56) Frost, J. M.; Butler, K. T.; Walsh, A. Molecular ferroelectric contributions to anomalous
hysteresis in hybrid perovskite solar cells. APL Mater. 2014, 2, 081506.
22

Supporting Information: Direct Observation of
Dynamic Symmetry Breaking above Room
Temperature in Methylammonium Lead Iodide
Perovskite
Alexander N. Beecher,†,⊥ Octavi E. Semonin,†,⊥ Jonathan M. Skelton,‡ Jarvist M.
Frost,‡ Maxwell W. Terban,¶ Haowei Zhai,¶ Ahmet Alatas,§ Jonathan S. Owen,†
Aron Walsh,‡ and Simon J. L. Billinge∗,¶,‖
Department of Chemistry, Columbia University, New York, NY 10027, USA, Department of
Chemistry, University of Bath, Claverton Down, Bath BA2 7AY, UK, Department of Applied
Physics and Applied Mathematics, Columbia University, New York, NY 10027, USA, Advanced
Photon Source, Argonne National Laboratory, Argonne, IL, 60439, USA, and Condensed Matter
Physics and Materials Science Department, Brookhaven National Laboratory, Upton, NY 11973,
USA
E-mail: [email protected]
∗To whom correspondence should be addressed†Department of Chemistry, Columbia University, New York, NY 10027, USA‡Department of Chemistry, University of Bath, Claverton Down, Bath BA2 7AY, UK¶Department of Applied Physics and Applied Mathematics, Columbia University, New York, NY 10027, USA§Advanced Photon Source, Argonne National Laboratory, Argonne, IL, 60439, USA‖Condensed Matter Physics and Materials Science Department, Brookhaven National Laboratory, Upton, NY
11973, USA⊥Contributed equally to this work
1
arX
iv:1
606.
0926
7v2
[co
nd-m
at.m
trl-
sci]
5 O
ct 2
016
List of Figures
1 Image of the polished crystal . . . . . . . . . . . . . . . . . . . . . . . . . . . . . 3
2 Fitting of the inelastic X-ray scattering spectra . . . . . . . . . . . . . . . . . . . . 4
3 Potential energy surfaces calculated for ion displacement in CH3NH3PbI3 . . . . . 5
4 Comparison of PDF refinements across different refinement ranges . . . . . . . . . 6
5 Energy scans as a function of temperature . . . . . . . . . . . . . . . . . . . . . . 6
6 Sample instability to beam exposure . . . . . . . . . . . . . . . . . . . . . . . . . 7
List of Tables
1 Extracted elastic constants (C) and bulk modulus (K). . . . . . . . . . . . . . . . . 3
2

Figure S 1: Image of polished crystal, as mounted, (a) from top and (b) from side. (c) X-rayscattering images showing [111] zone axis diffraction and diffuse scattering between Bragg peaks.The rings correspond to the diffraction of the beryllium dome which is mostly transparent to X-rays.
Table S 1: Extracted elastic constants (C) and bulk modulus (K).
C11 [GPa] C12 [GPa] C44 [GPa] K [GPa]
25±2 7±2 4±1 13±2
3

∆E (meV)
Inte
nsi
ty (
a.
u.)
Max: 5273
ζ = 0.10
Max: 1295 ζ = 0.20
Max: 318 ζ = 0.30
Max: 326 ζ = 0.40
8 6 4 2 0 2 4 6 8
Max: 121 ζ = 0.50
XTAa
∆E (meV)
Inte
nsi
ty (
a.
u.)
Max: 1278
ζ = 0.10
Max: 285 ζ = 0.20
Max: 201 ζ = 0.30
Max: 453 ζ = 0.40
8 6 4 2 0 2 4 6 8
Max: 2727 ζ = 0.50
MTA1b
∆E (meV)
Inte
nsi
ty (
a.
u.)
Max: 3186
ζ = 0.10
Max: 506 ζ = 0.20
Max: 238 ζ = 0.30
Max: 155 ζ = 0.40
8 6 4 2 0 2 4 6 8
Max: 130 ζ = 0.50
MTA2c
∆E (meV)
Inte
nsi
ty (
a.
u.)
Max: 577
ζ = 0.10
Max: 192 ζ = 0.20
Max: 144 ζ = 0.30
Max: 475 ζ = 0.40
8 6 4 2 0 2 4 6 8
Max: 7493 ζ = 0.50
RTAd
∆E (meV)
Inte
nsi
ty (
a.
u.)
Max: 3472
ζ = 0.10
Max: 1077 ζ = 0.15
Max: 1723 ζ = 0.25
Max: 1444 ζ = 0.30
8 6 4 2 0 2 4 6 8
Max: 494 ζ = 0.50
XLAe
∆E (meV)
Inte
nsi
ty (
a.
u.)
Max: 4193
ζ = 0.035
Max: 1938 ζ = 0.05
Max: 1177 ζ = 0.15
8 6 4 2 0 2 4 6 8
Max: 2444 ζ = 0.50
MTOf
∆E (meV)
Inte
nsi
ty (
a.
u.)
Max: 541
ζ = 0.10
Max: 856 ζ = 0.15
Max: 725 ζ = 0.25
Max: 475 ζ = 0.29
8 6 4 2 0 2 4 6 8
Max: 311 ζ = 0.39
MLAg
∆E (meV)
Inte
nsi
ty (
a.
u.)
Max: 1137
ζ = 0.10
Max: 264 ζ = 0.15
Max: 518 ζ = 0.22
8 6 4 2 0 2 4 6 8
Max: 457 ζ = 0.27
RLAh
Figure S 2: Fitting of the inelastic X-ray scattering spectra. The central pseudo-Voigt peak, dampedharmonic oscillator, and total fit are plotted in purple, orange, and teal respectively.
4

Figure S 3: Potential energy surfaces calculated for ion displacement along the imaginary phononeigenvectors at the XTA, MTA1 , and RTA zone-edge points. Surfaces for inequivalent R zone-edgepoints are drawn (RTA1 and RTA2). Surfaces for the soft modes show two energy minima displacedfrom 0. 5
2-86-12
10-1614-20
18-2422-28
26-3230-36
34-4038-44
refinement range (Å)
0
2
4
6
8
10
12
14
16
Rw (
%)
Rw, Pm3m
Rw, I4/mcm
Rw, I4cm
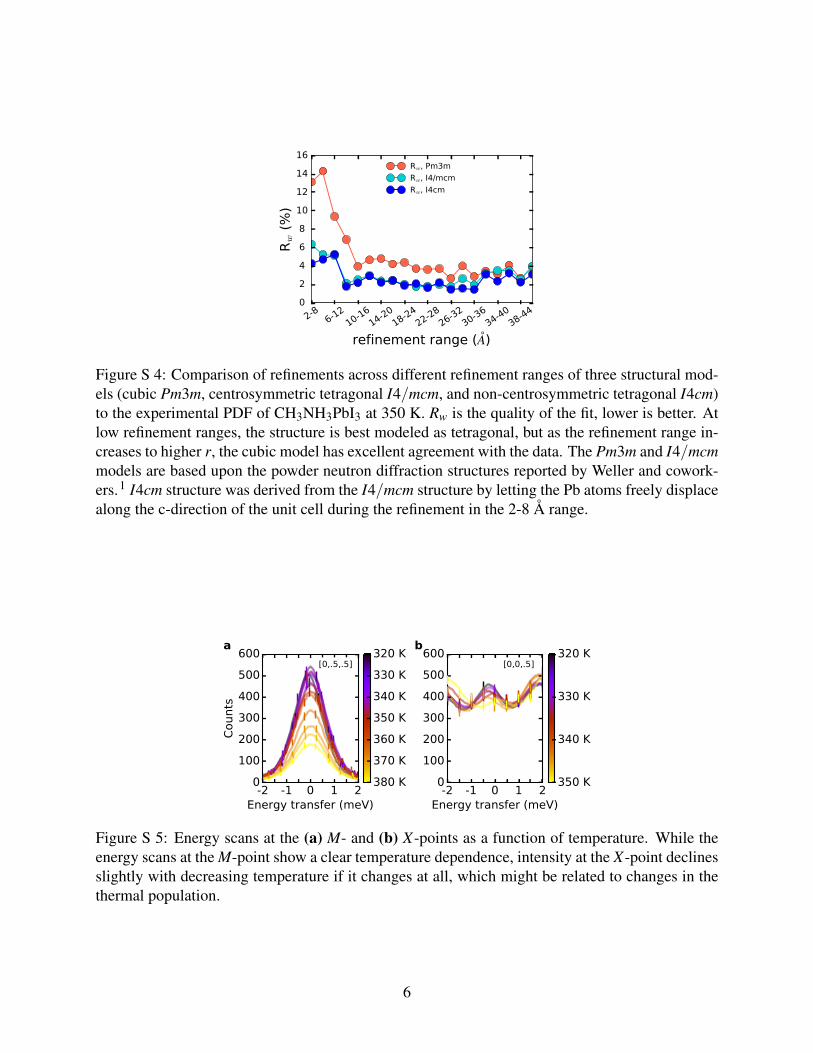
Figure S 4: Comparison of refinements across different refinement ranges of three structural mod-els (cubic Pm3m, centrosymmetric tetragonal I4/mcm, and non-centrosymmetric tetragonal I4cm)to the experimental PDF of CH3NH3PbI3 at 350 K. Rw is the quality of the fit, lower is better. Atlow refinement ranges, the structure is best modeled as tetragonal, but as the refinement range in-creases to higher r, the cubic model has excellent agreement with the data. The Pm3m and I4/mcmmodels are based upon the powder neutron diffraction structures reported by Weller and cowork-ers.1 I4cm structure was derived from the I4/mcm structure by letting the Pb atoms freely displacealong the c-direction of the unit cell during the refinement in the 2-8 Å range.
-2 -1 0 1 2Energy transfer (meV)
0
100
200
300
400
500
600
Counts
[0,.5,.5]320 K
330 K
340 K
350 K
360 K
370 K
380 K-2 -1 0 1 2
Energy transfer (meV)
0
100
200
300
400
500
600[0,0,.5]
320 K
330 K
340 K
350 K
a b
Figure S 5: Energy scans at the (a) M- and (b) X-points as a function of temperature. While theenergy scans at the M-point show a clear temperature dependence, intensity at the X-point declinesslightly with decreasing temperature if it changes at all, which might be related to changes in thethermal population.
6

0 2 4 6 8 10 12 14 16Time (min.)
200
250
300
350
400
450
500
550
Cou
nts
Figure S 6: Sample instability. Over time, we observe a slow increase in the central quasi-elasticpeak (hω = 0), regardless of the reciprocal lattice coordinate of the measurement. This appearsconsistent with a moderate increase of the disorder of the crystal during beam irradiation. Weobserve no change in quasi-elastic scattering intensity if the shutter is kept closed in betweenmeasurements. This data was collected at [0.0 3.5 4.5] at 350 K.
7

References
(1) Weller, M. T.; Weber, O. J.; Henry, P. F.; Di Pumpo, A. M.; Hansen, T. C. Complete structure
and cation orientation in the perovskite photovoltaic methylammonium lead iodide between
100 and 352 K . Chem. Commun. 2015, 51, 4180–4183.
8


