

Bruce D
. Baker ©
2010
Myths & Realities about Private School Enrollments in
New JerseyPre-school

Bruce D
. Baker ©
2010
Claims of Task Force Report• At the program’s inception, nearly 100 percent of students were
served by providers in the private sector, many of which are women‐and minority‐owned businesses. Now, approximately 60 percent are served by private providers, as traditional districts have built preschools at great public expense and unfairly regulated their private‐sector competitors out of business.
• There are currently two sets of state regulations governing pre‐k. The majority of private pre‐k providers are subject to Dept. of Children and Families (DCF) regulations, but private pre‐k providers working in the former Abbott districts and serving low‐income children in some other districts are subject to the regulation of the DOE and the respective districts themselves, effectively crowding out the private sector and driving up costs to the taxpayer without any documented benefit to the children they serve.

Bruce D
. Baker ©
2010
Number of 3 year olds enrolled in public and private school in New Jersey
0
10,000
20,000
30,000
40,000
50,000
60,000
70,000
80,000
1990 2000 2005 2006 2007 2008
Year
Tota
l Num
ber
Not EnrolledPublic SchoolPrivate School
Data Source: Steven Ruggles, J. Trent Alexander, Katie Genadek, Ronald Goeken, Matthew B. Schroeder, and Matthew Sobek. Integrated Public Use Microdata Series: Version 5.0 [Machine-readable database]. Minneapolis: University of Minnesota, 2010.

Bruce D
. Baker ©
2010
Percent of 3 year olds enrolled in public and private school in New Jersey
0
10
20
30
40
50
60
70
80
1990 2000 2005 2006 2007 2008
Year
% o
f Pop
ulat
ion
Not EnrolledPublic SchoolPrivate School
Data Source: Steven Ruggles, J. Trent Alexander, Katie Genadek, Ronald Goeken, Matthew B. Schroeder, and Matthew Sobek. Integrated Public Use Microdata Series: Version 5.0 [Machine-readable database]. Minneapolis: University of Minnesota, 2010.

Bruce D
. Baker ©
2010
Number of 4 year olds enrolled in public and private school in New Jersey
05,000
10,00015,00020,00025,00030,00035,00040,00045,00050,000
1990 2000 2005 2006 2007 2008
Year
Tota
l Num
ber
Not EnrolledPublic SchoolPrivate School
Data Source: Steven Ruggles, J. Trent Alexander, Katie Genadek, Ronald Goeken, Matthew B. Schroeder, and Matthew Sobek. Integrated Public Use Microdata Series: Version 5.0 [Machine-readable database]. Minneapolis: University of Minnesota, 2010.

Bruce D
. Baker ©
2010
Percent of 4 year olds enrolled in public and private school in New Jersey
05
101520253035404550
1990 2000 2005 2006 2007 2008
Year
% o
f Pop
ulat
ion
Not EnrolledPublic SchoolPrivate School
Data Source: Steven Ruggles, J. Trent Alexander, Katie Genadek, Ronald Goeken, Matthew B. Schroeder, and Matthew Sobek. Integrated Public Use Microdata Series: Version 5.0 [Machine-readable database]. Minneapolis: University of Minnesota, 2010.

Bruce D
. Baker ©
2010
Private School Enrollments
0
50,000
100,000
150,000
200,000
250,000
300,000
2000 2002 2004 2006 2008Year
Tota
l Enr
ollm
ent
Preschool Private EnrollAll Private EnrollAll Private [no presch]
Data Source: NCES Private School Universe Survey: http://nces.ed.gov/surveys/pss/pssdata.asp

Bruce D
. Baker ©
2010
The Decline of Private Schools in General?

Bruce D
. Baker ©
2010
160,000
165,000
170,000
175,000
180,000
185,000
190,000
2003-04 2004-05 2005-06 2006-07 2007-08 2008-09
Year
Enro
llmen
t
The Collapse as Reported by the Task Force
http://nj.gov/governor/news/reports/pdf/20100720_np_schools.pdf

Bruce D
. Baker ©
2010
0
50
100
150
200
250
2000 2002 2004 2006 2008Year
Num
ber o
f Sch
ools Cath/Parochial
Cath/DiocesanCath/PrivateConservative ChristianOther Affil. DenominationOther Relig. Not Affil.Nonsectarian - Reg.
Data Source: NCES Private School Universe Survey: http://nces.ed.gov/surveys/pss/pssdata.asp

Bruce D
. Baker ©
2010
0
10,000
20,000
30,000
40,000
50,000
60,000
70,000
80,000
2000 2002 2004 2006 2008
Year
Enro
llmen
t
Cath/ParochialCath/DiocesanCath/PrivateConservative ChristianOther Affil. DenominationOther Relig. Not Affil.Nonsectarian - Reg.
Data Source: NCES Private School Universe Survey: http://nces.ed.gov/surveys/pss/pssdata.asp

Bruce D
. Baker ©
2010
0
10,000
20,000
30,000
40,000
50,000
60,000
70,000
80,000
2002 2004 2006 2008
Year
Enro
llmen
t (Ad
j.
Cath/Parochial
Cath/Diocesan
Cath/Private
Conservative ChristianOther Affil. Denomination
Other Relig. Not Affil.
Nonsectarian - Reg.
Data Source: NCES Private School Universe Survey: http://nces.ed.gov/surveys/pss/pssdata.asp

Bruce D
. Baker ©
2010
0
100,000
200,000
300,000
400,000
500,000
600,000
2000
2001
2002
2003
2004
2005
2006
2007
2008
Year
Enro
llmen
t (Al
l)
Kindergarten
Grade 1 t0 4
Grade 5 to 8
Grade 9 to 12
Data Source: Steven Ruggles, J. Trent Alexander, Katie Genadek, Ronald Goeken, Matthew B. Schroeder, and Matthew Sobek. Integrated Public Use Microdata Series: Version 5.0 [Machine-readable database]. Minneapolis: University of Minnesota, 2010.

Bruce D
. Baker ©
2010
0
10,000
20,000
30,000
40,000
50,000
60,000
70,000
80,000
2000
2001
2002
2003
2004
2005
2006
2007
2008
Year
Priv
ate
Enro
llmen
Kindergarten
Grade 1 t0 4
Grade 5 to 8
Grade 9 to 12
Data Source: Steven Ruggles, J. Trent Alexander, Katie Genadek, Ronald Goeken, Matthew B. Schroeder, and Matthew Sobek. Integrated Public Use Microdata Series: Version 5.0 [Machine-readable database]. Minneapolis: University of Minnesota, 2010.

Bruce D
. Baker ©
2010
5%
7%
9%
11%
13%
15%
17%
19%
21%
23%
2000
2001
2002
2003
2004
2005
2006
2007
2008
Year
Priv
ate
Shar
e (%
Kindergarten
Grade 1 t0 4
Grade 5 to 8
Grade 9 to 12
Data Source: Steven Ruggles, J. Trent Alexander, Katie Genadek, Ronald Goeken, Matthew B. Schroeder, and Matthew Sobek. Integrated Public Use Microdata Series: Version 5.0 [Machine-readable database]. Minneapolis: University of Minnesota, 2010.

Bruce D
. Baker ©
2010
Myths & Realities about Private School “Costs” in NJ

Bruce D
. Baker ©
2010
Current Operating Expenditures per Pupil in New Jersey
$14,5
24
$12,2
47
$10,4
81
$10,5
20
$11,0
68
$11,8
94
$11,8
26
$12,1
79
$10,4
88
$21,9
29
$17,1
30
$5,90
2
$0
$5,000
$10,000
$15,000
$20,000
$25,000
A B CD DE FG GH I J
Charte
r (ex
cl. pr
iv.)
Indepen
dent P
rivate
Hebrew
/Jewish
Day
Sch.
Christ
ian (A
ACS, ACIS)
District Factor Group (Wealth/Income Low to High)
Expe
nd p
er P
upil
(AD
E)
Based on a sample of 45 private day schools, serving over 18,600 children (2006-07). Includes “program expenditures” and “administrative expenditures” as reported on form IRS 990 (www.guidestar.org). By comparison, Charter schools served approximately 13,000 and DFG J districts approximately 50,000.
Public School Districts

Bruce D
. Baker ©
2010
Expenditures per Pupil in New Jersey Private Schools by Affiliation
$21,9
29
$17,1
30
$5,90
2
0
5000
10000
15000
20000
25000
Independent Private Hebrew/Jewish Day Sch. Christian (AACS, ACIS)
Expe
nd p
er P
upil
Based on a sample of 45 private day schools, serving over 18,600 children (2006-07). Includes “program expenditures” and “administrative expenditures” as reported on form IRS 990 (www.guidestar.org).

Bruce D
. Baker ©
2010
Where the Private School Students are in NJ
Catholic Schools , 100,562, 67%
Other Schools, 17,453, 12%
Jewish/Hebrew Schools, 4,996, 3%
Christian Schools, 11,939, 8%
Special Emphasis, 5249, 3%
Independent Schools, 9,598, 6%
Friends Schools, 1,480, 1%
Data Source: NCES Private School Universe Survey. Note that there appears to be substantial under-reporting of private independent schools in this survey.

Bruce D
. Baker ©
2010
Executive Compensation in Private and Public Schoolsin New Jersey (2006-07)
$0
$50,000
$100,000
$150,000
$200,000
$250,000
$300,000
Dwight/Englew
ood
FHCDS/Somerset
Hills
PDS/Prince
ton Twp.
Frisch
/Paramus
MBS/Morri
s
SRDS/Upper
Saddle R
iverMorro
w
Pingry/B
ernard
s Twp
MKA/Montcl
air
Ranney/Tinton Fall
s
RPS/Frankli
n Twp.
Oak H
ill/Middle
town
RCDS/Rumson-F
HPec
k/Morri
s
GSB/Som
erset
Hills
Newark A
cad/Livi
ngston
Chapin/Prince
ton Twp.
MFS/Moores
town
Wardlaw
/Edison
Far Bro
ok/Milb
urn
Big City
Supts.
Headmaste
r Mea
n
Host Supt. M
ean
Headmaster Comp. Local Supt. Comp.
Note: Private school headmaster compensation from Guidestar.org, IRS 990 for 2006. Local Superintendent compensation for district that is geographic home to private school. Supt. Comp based on 2006-07 (1 yr later than Headmaster Comp.). Headmaster and Supt. Comp. include salary and cash-basis benefits (not health-care, retirement contributions, etc.). Big City Supts. Includes Newark, Camden, Jersey City, Paterson and Trenton.

Bruce D
. Baker ©
2010
Private School Spending (North East)
$0
$5,000
$10,000
$15,000
$20,000
$25,000
$30,000
$35,000
CT MA NJ NY (metroonly)
PA
Christian (non-Catholic)Hebrew/JewishIndependentAll TypesPublic State Mean (Total)

Bruce D
. Baker ©
2010
9.87
10.1
4 16.8
3
16.5
9
13.5
3
34.3
6
24.1
4
8.17 8.53
3.42
$20,131
$17,008
$10,140 $10,135
$7,118
0
5
10
15
20
25
30
35
IndependentHebrew/Jewish Public Catholic ChristianAssociation
School Type
Pup/
Tch
or %
Com
petit
ive
$0
$5,000
$10,000
$15,000
$20,000
$25,000
Expe
nd p
er P
upil
Pupil to Teacher Ratio% Teachers from Competitive CollegeExpenditure per Pupil
Source: Adapted from Baker, B. (2009). Private schooling in the U.S.: Expenditures, supply, and policy implications.Boulder and Tempe: Education and the Public Interest Center & Education Policy ResearchUnit. Retrieved [date] from http://epicpolicy.org/publication/private-schooling-US

Bruce D
. Baker ©
2010
NJOSA and the Lakewood Distortion

Bruce D
. Baker ©
2010
0
5,000
10,000
15,000
20,000
25,000
30,000
35,000
40,000
45,000
Atlantic
City, NJ
Monmouth-Ocea
n, NJ
Bergen-
Passaic
, NJ
Jersey
City, NJ
Middlesex
-Somers
et-Hu
Newark
, NJ
Philadelp
hia, P
A/NJTren
ton, NJ
Vineland-Milvi
lle-Bri
# of
Sch
ool A
ged
Child
ren
Non-PoorPoor (<250% Pov)
Data Source: U.S. Census, American Community Survey 2008 (www.ipums.org)
Figure 1. Poor (<250% Poverty Level) and Non-poor Children in Private Schools in NJ (2008)
Large numbers of “poor”private schooled children
(about 13,000)

Bruce D
. Baker ©
2010
RANKPUMA (area)
Not in School
Public School
Private School Total % Private
Not in School
Public School
Private School Total % Private
% under 250%
1 1203 1,088 8,744 10,470 20,302 51.6% 1,673 18,438 17,269 37,380 46.2% 61%2 502 681 8,268 1,458 10,407 14.0% 860 33,127 6,523 40,510 16.1% 22%3 305 318 3,693 727 4,738 15.3% 762 30,171 6,215 37,148 16.7% 12%4 501 1,207 14,501 1,619 17,327 9.3% 1,296 20,010 6,155 27,461 22.4% 26%5 2302 75 5,467 1,318 6,860 19.2% 157 24,520 6,066 30,743 19.7% 22%6 301 158 1,212 1,115 2,485 44.9% 421 7,153 5,734 13,308 43.1% 19%7 2202 126 12,879 1,395 14,400 9.7% 764 36,972 5,622 43,358 13.0% 25%8 2103 333 9,204 1,276 10,813 11.8% 1,465 22,520 5,518 29,503 18.7% 23%9 1404 352 6,123 1,116 7,591 14.7% 917 21,296 4,683 26,896 17.4% 24%
10 306 179 3,373 344 3,896 8.8% 504 28,895 4,536 33,935 13.4% 8%11 1001 316 4,141 381 4,838 7.9% 633 26,924 4,463 32,020 13.9% 9%12 1504 268 1,547 479 2,294 20.9% 440 15,931 4,304 20,675 20.8% 11%13 1403 0 2,419 79 2,498 3.2% 554 22,751 4,090 27,395 14.9% 2%14 2301 548 15,484 994 17,026 5.8% 1,390 31,443 3,910 36,743 10.6% 25%15 2101 941 17,084 1,368 19,393 7.1% 1,478 22,593 3,868 27,939 13.8% 35%16 304 486 6,046 415 6,947 6.0% 1,636 32,527 3,816 37,979 10.0% 11%17 1901 0 10,809 881 11,690 7.5% 635 27,638 3,804 32,077 11.9% 23%18 1501 0 4,921 339 5,260 6.4% 214 22,325 3,772 26,311 14.3% 9%19 1600 550 7,284 998 8,832 11.3% 1,306 23,979 3,708 28,993 12.8% 27%20 102 523 11,160 1,114 12,797 8.7% 560 25,718 3,698 29,976 12.3% 30%
Children in Families below 250% Poverty Level All Children 5 to 18
Figure 2. New Jersey Public Use Micro Data Areas Ranked by Highest Total Enrolled Children in Private Schools in 2008
Lakewood51.6% of low income
children are in private schools
For a map of PUMA designations in NJ, see http://www2.census.gov/geo/maps/puma/puma2k/nj_puma5.pdfData Source: U.S. Census, American Community Survey 2008 (www.ipums.org)

Bruce D
. Baker ©
2010
Over 10,000 “poor”private schooled
children (over 20% of state total)
Over 17,000 “poor”private schooled
children (about 8% of state total)
Density of Private School Students (<250% Pov. Inc.)Density of Private School Students (All)
Figure 3. Density & Income Status of Private Schooled Children in New Jersey
Data Source: U.S. Census, American Community Survey 2008 (www.ipums.org)
Bruce D
. Baker ©
2010
0
1,000
2,000
3,000
4,000
5,000
6,000
Kindergart
en
Grade 1
to 4
Grade 5
to 8
Grade 9
to 12
Grade Enrolled
# En
rolle
d
PublicPrivate
Data Source: U.S. Census, American Community Survey 2008http://nces.ed.gov/surveys/sdds/acs08/acsdownload.aspx
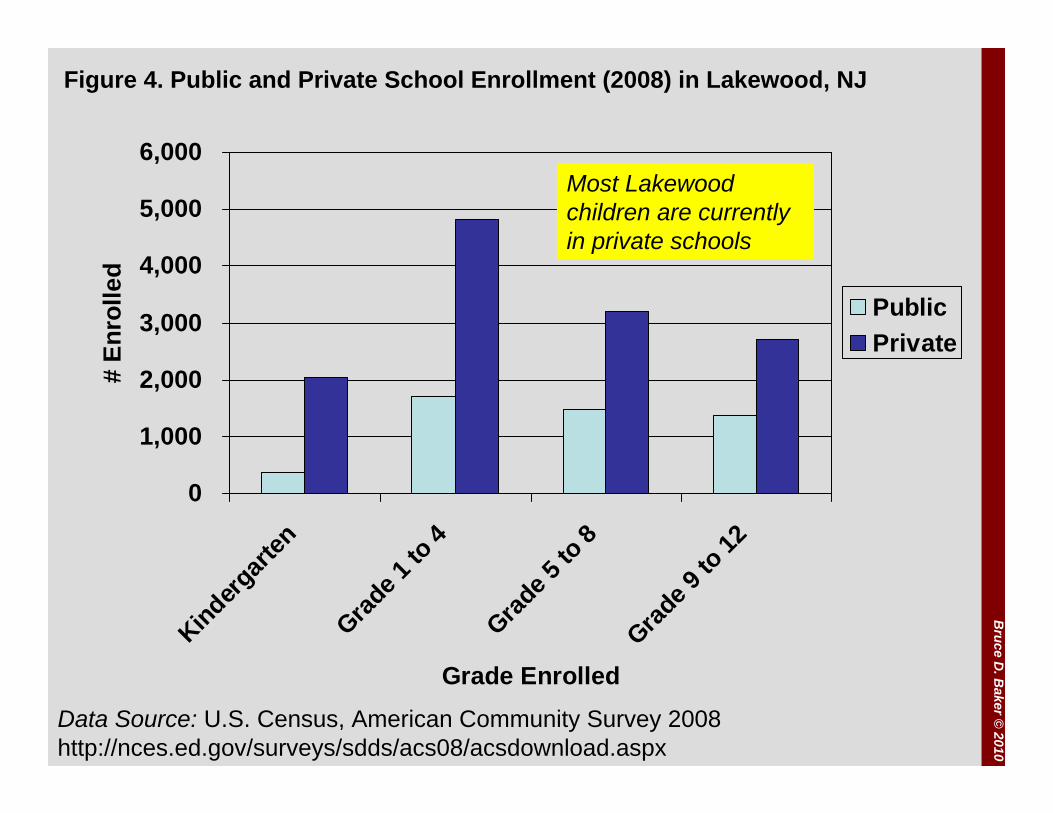
Figure 4. Public and Private School Enrollment (2008) in Lakewood, NJ
Most Lakewood children are currently in private schools

Bruce D
. Baker ©
2010
Pct. 2000 2007 2000 2007White 1,569 717 30% 13%Black 1,909 1,749 37% 32%Hispanic 1,618 2,897 31% 53%Native Am. 33 31 1% 1%Asian 58 58 1% 1%TOTAL 5,186 5,452 Pct. Poor 55% 60% Diversity* 68 60
Data Source: http://www.nj.com/news/bythenumbers/
Figure 5. Lakewood Public Schools Demographics
The public school district in Lakewood is minority white (13% by 2007)!

Bruce D
. Baker ©
2010
PSS_INST PSS_ENROLL_TK12 PSS_WHITE_PCTALPHA SCHOOL 55 78.18LAKEWOOD CHEDER SCHOOL BOYS 3373 99.58BAIS TOVA INC 520 100BNOS YAAKON ELEMENTARY SCHOOL 462 100BAIS FAIGA PARK AVENUE CAMPUS 430 100BAIS SHAINDEL HIGH SCHOOL FOR GIRLS 428 100TALMUD TORAH BAIS AVROHOM 427 100YESHIVA TIFERES TORAH 424 99.06BAIS YAAKOV HIGH SCHOOL OF LAKEWOOD 412 100YESHIVA ORCHOS CHAIM 410BAIS ROCHEL 391 100TORAH INSTITUTE OF LAKEWOOD / YESHIVA BAIS HATORAH 325 100CALVARY ACADEMY 292 67.81BAIS YAAKOV BNOS RIVKA 273BAIS REUVAIN KAMINETZ OF LAKEWOOD 226TASHBAR OF LAKEWOOD 225 100HOLY FAMILY SCHOOL 395 80.25KIDDIE UNIVERSITY 22UNITED TALMUDICAL ACADEMY 225LEHMANN SCHOOL & TECH ED CENTER 37 70.27YESHIVA MASORAS AVOS 193 95.85YESHIVA NESIVOS OHR 175 100NEW ROAD SCHOOL 50OCEAN DAY SCHOOL 31 67.74SCHOOL FOR CHILDREN W/ HIDDEN INTELLIGENCE 104 100BNOS BINA GIRLS SCHOOL 173 100NEW JERSEY CENTER FOR JUDAIC STUDY 165 98.79YESHIVA KETER TORAH 161 100BNOS BROCHA 147BNOS MELECH 144 100CHEDER BNAI TORAH 124 100TALMUD TORAH OHR ELCHONON 121 100YESHIVA KEREN HATORAH 113 100YESHIVA TOPRAS EMES 99 100YESHIVA TORAS EMES 98 100YESHIVAS OHR YISSOCHOR 68 100CHINUCH L'BANOS 67 100MESIVTA KESER TORAH 67 97.01BAIS YAAKOV ELEMENTARY SCHOOL 59 100
Data Source: NCES Private School Survey
Figure 6. All Private Schools in Lakewood, Enrollment & % White Enrollment
In this predominantly minority public school district, Jewish schools in Lakewood are almost entirely homogeneous, and most private schooled children in Lakewood are in these schools!

Bruce D
. Baker ©
2010
PSS_INST LoGrade HiGrade K-8 Enrollment 9 - 12 Enrollment K-8 Vouchers 9 - 12 VouchersBAIS FAIGA PARK AVENUE CAMPUS 2 7 430 0 2,580,000$ -$ BAIS REUVAIN KAMINETZ OF LAKEWOOD 3 13 226 0 1,356,000$ -$ BAIS ROCHEL 2 13 391 0 2,346,000$ -$ BAIS SHAINDEL HIGH SCHOOL FOR GIRLS 14 17 0 428 -$ 3,852,000$ BAIS TOVA INC 3 12 520 0 3,120,000$ -$ BAIS YAAKOV BNOS RIVKA 2 10 272 0 1,632,000$ -$ BAIS YAAKOV ELEMENTARY SCHOOL 3 13 59 0 354,000$ -$ BAIS YAAKOV HIGH SCHOOL OF LAKEWOOD 14 17 0 412 -$ 3,708,000$ BNOS BINA GIRLS SCHOOL 2 13 173 0 1,038,000$ -$ BNOS BROCHA 2 8 147 0 882,000$ -$ BNOS MELECH 3 8 144 0 864,000$ -$ BNOS YAAKON ELEMENTARY SCHOOL 5 13 462 0 2,772,000$ -$ CHEDER BNAI TORAH 6 9 124 0 744,000$ -$ CHINUCH L'BANOS 3 8 67 0 402,000$ -$ LAKEWOOD CHEDER SCHOOL BOYS 3 13 3373 0 20,238,000$ -$ MESIVTA KESER TORAH 14 17 0 67 -$ 603,000$ NEW JERSEY CENTER FOR JUDAIC STUDY 13 17 13 152 78,000$ 1,368,000$ TALMUD TORAH BAIS AVROHOM 3 13 427 0 2,562,000$ -$ TALMUD TORAH OHR ELCHONON 3 10 121 0 726,000$ -$ TASHBAR OF LAKEWOOD 3 13 225 0 1,350,000$ -$ TORAH INSTITUTE OF LAKEWOOD / YESHIVA BAIS HATORAH 3 13 325 0 1,950,000$ -$ UNITED TALMUDICAL ACADEMY 3 13 225 0 1,350,000$ -$ YESHIVA KEREN HATORAH 14 17 0 113 -$ 1,017,000$ YESHIVA KETER TORAH 3 15 139 22 834,000$ 198,000$ YESHIVA MASORAS AVOS 2 13 193 0 1,158,000$ -$ YESHIVA NESIVOS OHR 3 11 175 0 1,050,000$ -$ YESHIVA ORCHOS CHAIM 3 13 410 0 2,460,000$ -$ YESHIVA TIFERES TORAH 3 13 424 0 2,544,000$ -$ YESHIVA TOPRAS EMES 3 9 99 0 594,000$ -$ YESHIVA TORAS EMES 5 9 98 0 588,000$ -$ YESHIVAS OHR YISSOCHOR 14 17 0 68 -$ 612,000$
TOTAL 55,572,000$ 11,358,000$ 66,930,000$
Data Source: NCES Private School Survey
Figure 7. Estimated Maximum Private School Voucher Allocation to Lakewood Jewish Schools (assuming 100% already enrolled qualify)
A $67 million payout!

Bruce D
. Baker ©
2010
Figure 8.Low Estimate of Private School Voucher Allocation to Lakewood Private Schools(assuming only those below 100% poverty threshold qualify)
Data Source: US Census, School District Demographics System (ACS 2008)http://nces.ed.gov/surveys/sdds/acs08/acsdownload.aspx
Public Only All Private VouchersTotal: 5310 19670 14360Income in the past 12 months below the poverty level: 1585 6900 5315Enrolled in school: 1585 6900 5315Enrolled in nursery school, preschool 130 755 625Enrolled in kindergarten 85 1015 930 5,580,000$ Enrolled in grade 1 to grade 4 480 2325 1845 11,070,000$ Enrolled in grade 5 to grade 8 415 1555 1140 6,840,000$ Enrolled in grade 9 to grade 12 475 1250 775 6,975,000$ Enrolled in college undergraduate years 0 0 0Enrolled in graduate or professional school 0 0 0Not enrolled in school 0 0 0Income in the past 12 months at or above the poverty level: 3725 12770 9045Enrolled in school: 3725 12770 9045Enrolled in nursery school, preschool 260 1215 955Enrolled in kindergarten 285 1400 1115Enrolled in grade 1 to grade 4 1190 4180 2990Enrolled in grade 5 to grade 8 1050 3105 2055Enrolled in grade 9 to grade 12 915 2855 1940Enrolled in college undergraduate years 15 15 0Enrolled in graduate or professional school 0 0 0Not enrolled in school 0 0 0
TOTAL 30,465,000$
A $30 million payout!


