

PerformanceReview
Metropolitan St. Louis SewerDistrict Pension Plan
3rd Quarter 2014
Pavilion Advisory Group Inc.227 W. Monroe Street, Suite 2020Chicago, IL 60606Phone: 312-798-3200Fax: 312-902-1984www.pavilioncorp.com

1 Performance Summary 1
2 Asset Class Diversification 18
3 Manager Evaluation 24
4 Calendar Year Performance 64
5 Capital Markets Review 66
6 Appendix 74
Table of Contents

Performance Summary
1

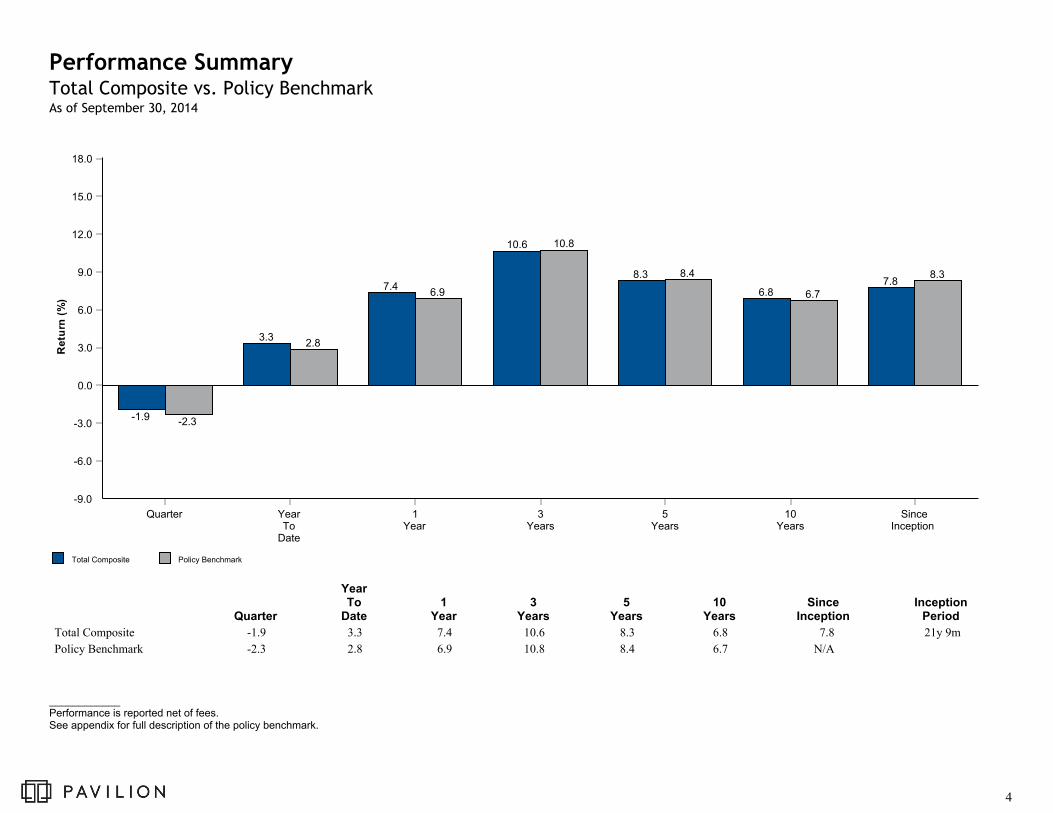
Performance Summary - September 2014During the third quarter, the Metropolitan St. Louis Sewer District declined -1.9%, outperforming the Policy Benchmark return of -2.3%. On a trailing one-year basis, the Plan returned7.4%, outpacing the Policy Benchmark by 50 basis points.
Asset Class DiversificationThe Finance Committee approved new asset allocation policy targets and allowable asset class ranges at the February 2014 meeting. Current asset allocation was within investment policyranges and very close to targets.
Manager EvaluationDuring the third quarter, the following managers notably outperformed their respective benchmarks: T. Rowe Price Institutional Large-Cap Growth, Kennedy Mid Cap Value,TimesSquare Small Cap Growth Fund, Morgan Stanley International Equity Fund, Brandywine Global Opportunistic Fixed Income, and UBS Trumbull Property Fund. Third quarterperformance was negatively impacted by the following managers as they underperformed their respective benchmarks: Holland Large Cap Growth, Penn Capital, GMO Asset AllocationFund, and PIMCO All Asset Fund.
Capital Markets ReviewIt was a difficult quarter in the capital markets. U.S. large cap equities posted modest gains while small cap equities severely underperformed. International equity declined across foreignmarkets, with developed markets underperforming emerging markets. Fixed income volatility returned to the market highlighted by a flight to quality in long term rates. Local currencyinternational debt performed the poorly due to a strengthening U.S. dollar. An expansion of Russia’s invasion of Ukraine, Israel’s military actions to clear Gaza of missiles and tunnelsused by attackers, and ISIS conquering territory across Iraq caused investors to pull monies out of Europe and Asia for the perceived safety of the U.S. dollar and Treasury bonds.
The rapid ascent of the U.S. dollar sent foreign investment values sharply lower versus their local-currency returns. A wave of economic weakness enveloped Europe, Japan, Brazil, Chinaand many smaller countries. The European Central Bank (ECB) inched closer toward purchasing asset-backed bonds, while further lowering its deposit rate to -0.2%. With the Germaneconomy near a zero-growth rate and countries such as Greece and Spain pleading for an end to austerity, the Eurozone economy offered little near-term outlook for growth. Hopes turnedto the ECB to offer a Federal Reserve style bailout and inflate the flagging economy, though the bank has been reluctant to put plans into action based on German leaders’ protests. Theimpending culmination of the Federal Reserve’s asset purchases was a late-quarter headwind for stocks.
The U.S. economy faced a perplexing mix of economic readings. The unemployment rate fell to 5.9%, though the number of workers leaving the workforce remained dauntingly high.Retail sales were choppy, yet on an upward trend. A steep drop in oil prices, brought on by increased U.S. production, will be a negative for upcoming energy spending, due to fallinggasoline prices, but will be a broader benefit for the economy.
Recommendations or Action ItemsPavilion downgraded PIMCO’s manager rating status from “negative watch” to “sell.” Pavilion initially downgraded PIMCO to “negative watch” in January following the departure of co-CIO Mohamed El-Erian, and noted we would closely monitor the firm for organizational stability, asset flows, and performance. PIMCO has not made clear improvements in these areas,and the departure of Bill Gross creates a multitude of future unknowns for the firm. Pavilion recommends termination of the PIMCO All Asset Fund in the Pension Plan due to poorperformance and organizational issues and instability. The fund has approximately $10.1 million invested as of September 30, 2014.
Pavilion is conducting a hedge fund of funds manager search for two managers. The hedged equity manager search is complete and Pavilion recommends hiring the Lighthouse GlobalLong/Short Equity Fund to replace the PIMCO All Asset fund. The multi-strategy hedge fund of funds is still in progress with additional managers requiring analysis and further duediligence. Pavilion will bring a second recommendation to the Committee when the work is complete and the Secretary-Treasurer has conducted the appropriate due diligence on managersearch projects.
Pension Plan Executive Summary
2
Pension Plan Executive SummaryManager Search - Hedge Fund of FundsPavilion commenced a hedge fund of funds search during the third quarter 2014 to populate the hedge fund allocation in the approved investment policy. We initiated our search processby screening over 300 managers based upon the criteria below:
· Organizational structure and ownership (corporate, employee owned, MWBE, etc.)
· Firm assets under management exceed $1 billion
· Strategy assets exceed $1 billion
· Investment process, philosophy, sector strategy and geographic allocations
· Personnel, resources, due diligence, alignment of interests with clients
· Risk management and “fit” with current policy and approved manager roster
· Number of managers in the fund of funds structure
· Key partnership terms including liquidity, contributions/withdrawals, fees/incentives
· Transparency policy
· Performance, net of fees and incentives
The search process identified seven candidates presented by Pavilion to the St. Louis Metropolitan Sewer District. Three equity long/short specialists and four multi-strategy specialists:
Equity Long/Short Hedge Fund of Funds Finalists1. ABS Global Portfolio2. Lighthouse Global Long/Short Ltd.3. Pointer Offshore, Ltd.
Additional due diligence discovered Pointer Offshore Ltd will be closed to new clients in the fourth quarter, disqualifying them from further consideration. Based upon Pavilion’s analysisand St. Louis Metropolitan Sewer District’s additional due diligence, Lighthouse Global Long/Short Ltd is the recommended manager.
Multi-strategy Hedge Fund of Fund Finalists1. Entrust Capital Diversified Fund Ltd.2. Grosvenor Institutional Partners, Ltd.3. Ironwood International Ltd.4. TeamCo Select Tax-Exempt Partners Fund. Ltd.
Additional due diligence and analysis is continuing on the multi-strategy hedge fund of funds finalists. A recommendation will be presented at a future Finance Committee meeting date.
3
Total Composite Policy Benchmark
0.0
3.0
6.0
9.0
12.0
15.0
18.0
-3.0
-6.0
-9.0
Re
turn
(%)
Quarter YearTo
Date
1Year
3Years
5Years
10Years
SinceInception
-2.3
2.8
6.9
10.8
8.4
6.7
8.3
-1.9
3.3
7.4
10.6
8.3
6.87.8
Quarter
YearTo
Date1
Year3
Years5
Years10
YearsSince
InceptionInception
Period
Total Composite -1.9 3.3 7.4 10.6 8.3 6.8 7.8 21y 9m
Policy Benchmark -2.3 2.8 6.9 10.8 8.4 6.7 N/A
Performance SummaryTotal Composite vs. Policy BenchmarkAs of September 30, 2014
____________Performance is reported net of fees.See appendix for full description of the policy benchmark.
4

-12.0
-8.0
-4.0
0.0
4.0
8.0
12.0
16.0
20.0
24.0R
etu
rn
Quarter
YearTo
Date1
Year3
Years5
Years7
Years10
Years
Total Composite -1.9 (89) 3.3 (79) 7.4 (94) 10.6 (94) 8.3 (95) 4.9 (60) 6.8 (46)¢£
5th Percentile 0.2 6.2 13.0 15.8 11.5 6.3 8.0
1st Quartile -0.7 4.9 11.4 14.5 10.6 5.7 7.4
Median -1.1 4.2 10.2 13.6 10.0 5.2 6.8
3rd Quartile -1.5 3.4 9.0 12.6 9.4 4.6 6.4
95th Percentile -2.2 2.2 7.1 10.2 8.2 3.4 5.9
Performance ComparisonAll Public Plans <= $500 milAs of September 30, 2014
_________________________Performance is reported net of fees.Parentheses contain percentile rankings.Calculation based on monthly periodicity.
5
-12.0
-8.0
-4.0
0.0
4.0
8.0
12.0
16.0
20.0
24.0R
etu
rn
Quarter
YearTo
Date1
Year3
Years5
Years7
Years10
Years
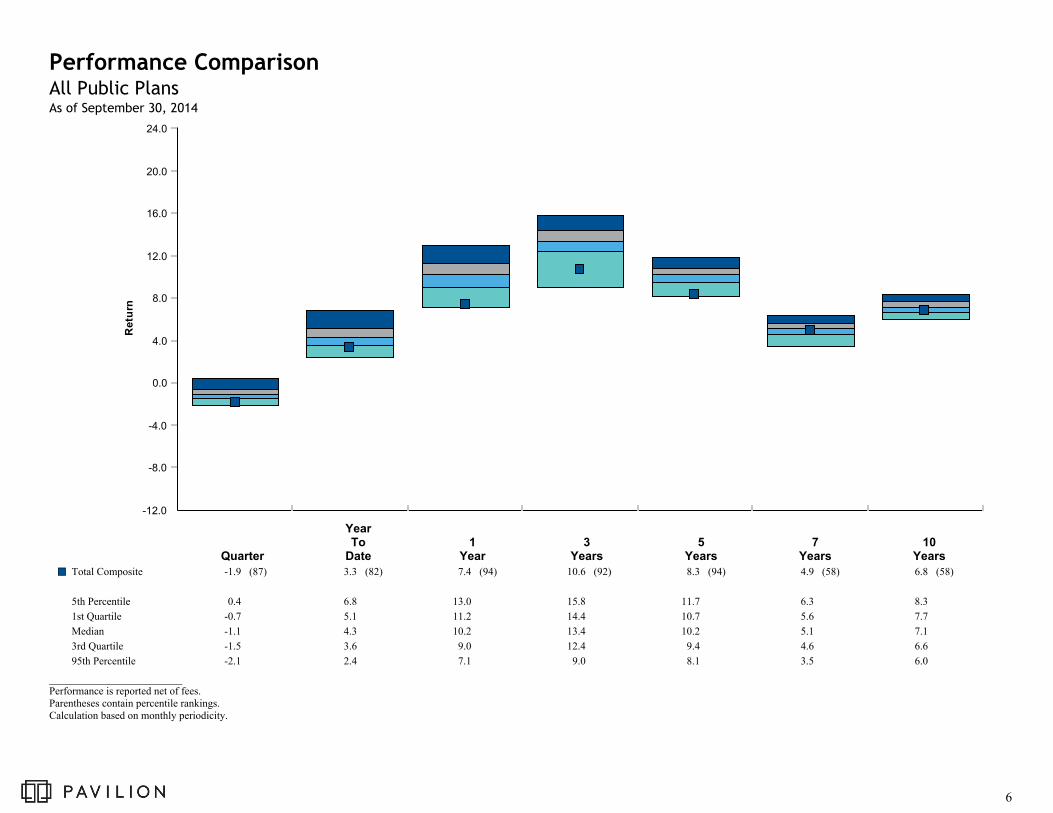
Total Composite -1.9 (87) 3.3 (82) 7.4 (94) 10.6 (92) 8.3 (94) 4.9 (58) 6.8 (58)¢£
5th Percentile 0.4 6.8 13.0 15.8 11.7 6.3 8.3
1st Quartile -0.7 5.1 11.2 14.4 10.7 5.6 7.7
Median -1.1 4.3 10.2 13.4 10.2 5.1 7.1
3rd Quartile -1.5 3.6 9.0 12.4 9.4 4.6 6.6
95th Percentile -2.1 2.4 7.1 9.0 8.1 3.5 6.0
Performance ComparisonAll Public PlansAs of September 30, 2014
_________________________Performance is reported net of fees.Parentheses contain percentile rankings.Calculation based on monthly periodicity.
6

3 Years 5 Years
5.0
7.0
9.0
11.0
13.0
14.0
Retu
rn (%
)
5.0 5.7 6.4 7.1 7.8 8.5 9.0
Risk (Standard Deviation %)
Policy Benchmark(7.7 , 8.4)
Total Composite(7.8 , 8.3)
5.0
7.0
9.0
11.0
13.0
14.0
Retu
rn (%
)
5.0 5.7 6.4 7.1 7.8 8.5 9.0
Risk (Standard Deviation %)
Policy Benchmark(6.7 , 10.8)
Total Composite(6.9 , 10.6)
Performance SummaryRisk and Return SummaryAs of September 30, 2014
7

Allocation
MarketValue
($) %
Performance(%)
Quarter
YearTo
Date1
Year3
Years5
Years10
YearsSince
InceptionInception
Period
Total Composite 250,168,126 100.0 -1.9 3.3 7.4 10.6 8.3 6.8 7.8 21y 9m
Policy Benchmark -2.3 2.8 6.9 10.8 8.4 6.7 N/A
Total Equity Composite 102,579,206 41.0 -1.7 3.5 12.1 N/A N/A N/A 16.2 1y 1m
MSCI AC World IMI -2.7 3.6 11.3 17.4 10.9 8.1 15.9
Domestic Equity Composite 68,026,916 27.2 -0.1 (13) 5.4 (19) 16.1 (15) N/A N/A N/A 19.3 (N/A) 1y 1m
Russell 3000 Index 0.0 (11) 7.0 (8) 17.8 (9) 23.1 (14) 15.8 (12) 8.4 (33) 20.3 (N/A)
Broad Equity Peer Group Median -1.4 3.9 13.6 20.9 14.0 8.0 N/A
Large-Cap Equity Composite 53,317,156 21.3 1.0 (28) 6.7 (40) 18.0 (33) 21.6 (49) 14.3 (49) 8.1 (42) 8.7 (N/A) 11y 4m
Russell 1000 Index 0.7 (35) 8.0 (19) 19.0 (22) 23.2 (26) 15.9 (20) 8.5 (33) 9.1 (N/A)
Large-Cap Equity Peer Group Median 0.1 6.0 16.4 21.5 14.3 7.8 N/A
Small-Cap Equity Composite 14,709,760 5.9 -3.8 (8) 1.0 (7) 9.6 (10) 22.9 (27) 17.1 (11) 11.1 (5) 11.9 (N/A) 11y 4m
Russell 2000 Index -7.4 (65) -4.4 (50) 3.9 (53) 21.3 (47) 14.3 (51) 8.2 (44) 9.8 (N/A)
Small-Cap Equity Peer Group Median -6.6 -4.4 4.2 20.8 14.3 8.0 N/A
International Equity Composite 34,552,290 13.8 -4.7 (31) -0.2 (39) 4.5 (46) N/A N/A N/A 10.2 (N/A) 1y 1m
MSCI AC World ex USA Index -5.3 (52) 0.0 (36) 4.8 (41) 11.8 (60) 6.0 (57) 7.1 (63) 11.1 (N/A)
International Equity Peer Group Median -5.2 -0.8 4.3 12.2 6.3 7.4 N/A
Developed International Equity Composite 27,171,164 10.9 -5.0 (27) -0.7 (34) 4.9 (40) 14.5 (32) 7.4 (38) 6.3 (59) 5.2 (N/A) 15y 5m
MSCI EAFE Index -5.9 (53) -1.4 (44) 4.3 (52) 13.6 (48) 6.6 (55) 6.3 (58) 4.0 (N/A)
Developed International Equity Peer Group Median -5.8 -1.7 4.3 13.6 6.8 6.6 N/A
Emerging International Equity Composite 7,381,126 3.0 -3.5 (44) 1.9 (57) 3.6 (62) 7.7 (60) 4.8 (46) N/A 8.9 (46) 9y 6m
MSCI Emerging Markets Index -3.5 (44) 2.4 (47) 4.3 (52) 7.2 (66) 4.4 (52) 10.7 (37) 9.2 (34)
Emerging Markets Equity Peer Group Median -3.7 2.2 4.4 8.1 4.5 10.0 8.5
Fixed Income Composite 87,074,484 34.8 -1.7 (100) 3.0 (43) 3.3 (45) 4.4 (21) 5.2 (29) 5.4 (10) 5.1 (14) 11y 3m
Barclays Intermediate U.S. Government/Credit 0.0 (37) 2.2 (73) 2.2 (73) 2.0 (82) 3.4 (77) 4.0 (74) 3.8 (74)
Intermediate Duration Fixed Income Peer Group Median -0.1 2.6 3.0 2.9 4.5 4.6 4.4
Performance SummaryTotal Pension Fund Asset Allocation and PerformanceAs of September 30, 2014
_________________________Performance is reported net of fees.
8

Performance SummaryTotal Pension Fund Asset Allocation and PerformanceAs of September 30, 2014
Allocation
MarketValue
($) %
Performance(%)
Quarter
YearTo
Date1
Year3
Years5
Years10
YearsSince
InceptionInception
Period
Tactical Asset Allocation Composite 25,034,719 10.0 -2.8 2.5 6.9 9.8 7.7 6.7 6.4 11y 4m
65% MSCI World (Net) / 35% BC Aggregate -1.3 4.0 9.3 12.4 8.7 6.6 7.3
Alternatives Composite 10,088,586 4.0 -2.9 4.5 4.8 N/A N/A N/A 6.0 1y 1m
3 Month T-Bills + 3% 0.8 2.3 3.0 3.1 3.1 4.6 3.0
Real Estate Composite 13,188,272 5.3 2.9 7.5 9.6 9.3 10.0 6.7 4.9 8y 4m
NCREIF Fund Index-Open End Diversified Core Equity 0.0 5.4 8.6 10.9 11.3 6.4 4.5
Real Assets Composite 10,896,322 4.4 -8.0 -0.3 2.4 1.9 N/A N/A 1.8 4y 6m
Wellington DIH Multi-Asset Inflation Index -8.1 -1.1 0.4 1.5 2.3 4.9 1.0
Cash Account 1,306,537 0.5 0.0 0.0 0.1 0.1 -0.3 1.5 1.4 11y 4m
BofA Merrill Lynch 3 Month U.S. T-Bill 0.0 0.0 0.0 0.1 0.1 1.6 1.5
_________________________Performance is reported net of fees.
9

Allocation
MarketValue
($) %
Performance(%)
Quarter
YearTo
Date1
Year3
Years5
Years10
YearsSince
InceptionInception
Period
Domestic Large-Cap Equity Managers
Vanguard Windsor II 14,123,604 5.6 -0.2 (47) 7.4 (26) 17.7 (34) 22.8 (36) 14.8 (33) 8.0 (39) 6.6 (N/A) 13y 5m
Russell 1000 Value Index -0.2 (47) 8.1 (17) 18.9 (22) 23.9 (22) 15.3 (24) 7.8 (42) 6.6 (N/A)
Large-Cap Value Equity Peer Group Median -0.3 6.1 16.2 21.8 14.0 7.5 N/A
Vanguard Institutional Index Fund 12,433,727 5.0 1.1 (25) 8.3 (15) 19.7 (17) 23.0 (30) 15.7 (24) 8.1 (42) 4.9 (64) 15y
S&P 500 1.1 (25) 8.3 (15) 19.7 (16) 23.0 (29) 15.7 (24) 8.1 (42) 4.9 (65)
Large-Cap Equity Peer Group Median 0.1 6.0 16.4 21.5 14.3 7.8 5.6
T. Rowe Price Inst. Large-Cap Core Growth 13,819,925 5.5 1.8 (29) 4.8 (62) 18.2 (33) 24.6 (11) 17.4 (15) 9.0 (40) 23.9 (N/A) 1y 7m
Russell 1000 Growth Index 1.5 (38) 7.9 (21) 19.1 (24) 22.4 (36) 16.5 (24) 8.9 (42) 21.7 (N/A)
Large-Cap Growth Equity Peer Group Median 1.1 5.5 16.7 21.5 15.1 8.5 N/A
Holland Large Cap Growth 12,939,900 5.2 1.2 (47) 5.2 (55) 15.7 (62) 19.5 (76) 15.1 (51) 8.1 (60) 17.2 (N/A) 1y 7m
Russell 1000 Growth Index 1.5 (38) 7.9 (21) 19.1 (24) 22.4 (36) 16.5 (24) 8.9 (42) 21.7 (N/A)
Large-Cap Growth Equity Peer Group Median 1.1 5.5 16.7 21.5 15.1 8.5 N/A
Domestic Small-Cap Equity Managers
Kennedy Mid Cap Value 8,384,999 3.4 -2.3 (21) 11.9 (1) 20.9 (1) 24.8 (14) 17.7 (7) N/A 11.6 (1) 6y 9m
Russell Midcap Value Index -2.6 (28) 8.2 (7) 17.5 (6) 24.7 (15) 17.2 (10) 10.2 (16) 8.5 (24)
Mid-Cap Value Equity Peer Group Median -4.1 1.6 10.0 21.4 14.6 8.9 7.4
TimesSquare Small Cap Growth Fund 6,324,761 2.5 -5.7 (46) -11.1 (89) -2.9 (88) 20.0 (52) 15.9 (28) 11.6 (6) 9.9 (N/A) 12y 8m
Russell 2000 Growth Index -6.1 (56) -4.0 (33) 3.8 (30) 21.9 (38) 15.5 (34) 9.0 (30) 7.6 (N/A)
Small-Cap Growth Equity Peer Group Median -5.8 -5.5 1.9 20.1 14.7 8.0 N/A
Developed International Equity Manager
Morgan Stanley International Equity Fund I 27,171,164 10.9 -5.0 (27) -0.8 (36) 4.7 (43) 14.5 (33) 7.4 (38) 6.5 (55) 5.2 (57) 9y 6m
MSCI EAFE Index -5.9 (53) -1.4 (44) 4.3 (52) 13.6 (48) 6.6 (55) 6.3 (58) 5.1 (62)
International Equity Peer Group Median -5.8 -1.7 4.3 13.6 6.8 6.6 5.4
Emerging Markets Equity Manager
Morgan Stanley Emerging Markets Fund I 7,381,126 3.0 -3.5 (44) 1.9 (57) 3.7 (61) 7.7 (59) 4.8 (45) 10.4 (42) 8.9 (45) 9y 6m
MSCI Emerging Markets Index -3.5 (44) 2.4 (47) 4.3 (52) 7.2 (66) 4.4 (52) 10.7 (37) 9.2 (34)
Emerging Markets Equity Peer Group Median -3.7 2.2 4.4 8.1 4.5 10.0 8.5
Performance SummaryManager Asset Allocation and PerformanceAs of September 30, 2014
_________________________Performance is reported net of fees.
10
Performance SummaryManager Asset Allocation and PerformanceAs of September 30, 2014
Allocation
MarketValue
($) %
Performance(%)
Quarter
YearTo
Date1
Year3
Years5
Years10
YearsSince
InceptionInception
Period
Fixed Income Managers
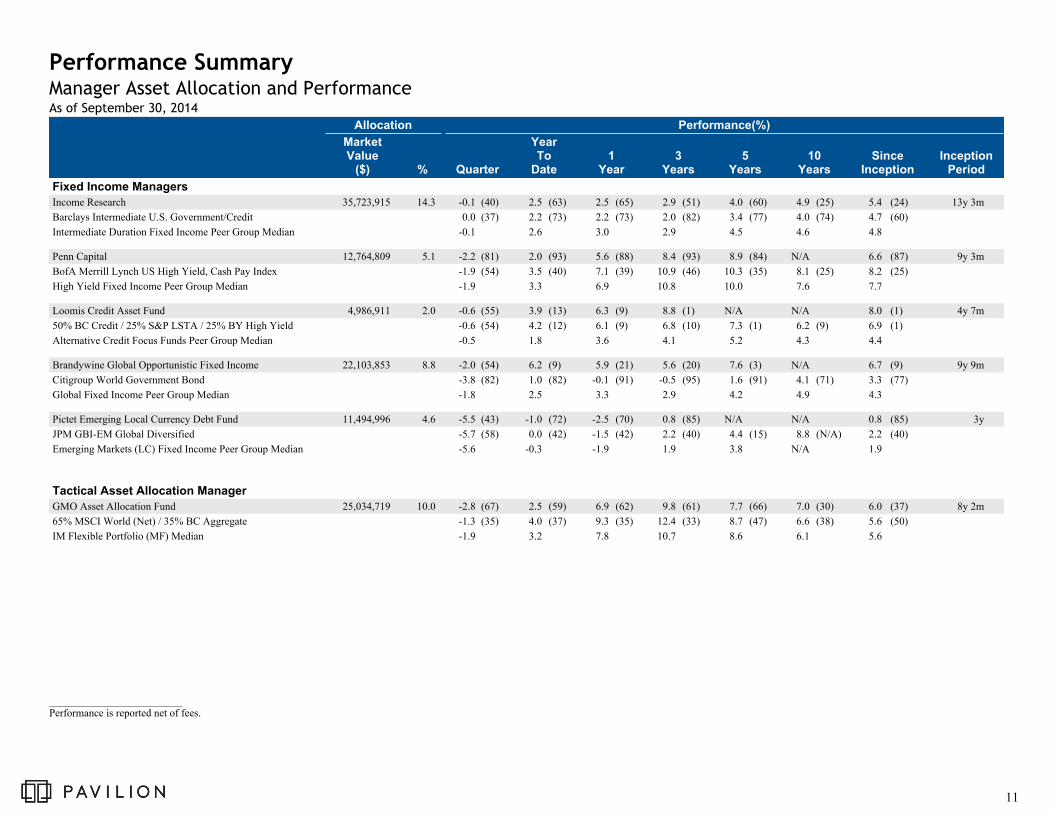
Income Research 35,723,915 14.3 -0.1 (40) 2.5 (63) 2.5 (65) 2.9 (51) 4.0 (60) 4.9 (25) 5.4 (24) 13y 3m
Barclays Intermediate U.S. Government/Credit 0.0 (37) 2.2 (73) 2.2 (73) 2.0 (82) 3.4 (77) 4.0 (74) 4.7 (60)
Intermediate Duration Fixed Income Peer Group Median -0.1 2.6 3.0 2.9 4.5 4.6 4.8
Penn Capital 12,764,809 5.1 -2.2 (81) 2.0 (93) 5.6 (88) 8.4 (93) 8.9 (84) N/A 6.6 (87) 9y 3m
BofA Merrill Lynch US High Yield, Cash Pay Index -1.9 (54) 3.5 (40) 7.1 (39) 10.9 (46) 10.3 (35) 8.1 (25) 8.2 (25)
High Yield Fixed Income Peer Group Median -1.9 3.3 6.9 10.8 10.0 7.6 7.7
Loomis Credit Asset Fund 4,986,911 2.0 -0.6 (55) 3.9 (13) 6.3 (9) 8.8 (1) N/A N/A 8.0 (1) 4y 7m
50% BC Credit / 25% S&P LSTA / 25% BY High Yield -0.6 (54) 4.2 (12) 6.1 (9) 6.8 (10) 7.3 (1) 6.2 (9) 6.9 (1)
Alternative Credit Focus Funds Peer Group Median -0.5 1.8 3.6 4.1 5.2 4.3 4.4
Brandywine Global Opportunistic Fixed Income 22,103,853 8.8 -2.0 (54) 6.2 (9) 5.9 (21) 5.6 (20) 7.6 (3) N/A 6.7 (9) 9y 9m
Citigroup World Government Bond -3.8 (82) 1.0 (82) -0.1 (91) -0.5 (95) 1.6 (91) 4.1 (71) 3.3 (77)
Global Fixed Income Peer Group Median -1.8 2.5 3.3 2.9 4.2 4.9 4.3
Pictet Emerging Local Currency Debt Fund 11,494,996 4.6 -5.5 (43) -1.0 (72) -2.5 (70) 0.8 (85) N/A N/A 0.8 (85) 3y
JPM GBI-EM Global Diversified -5.7 (58) 0.0 (42) -1.5 (42) 2.2 (40) 4.4 (15) 8.8 (N/A) 2.2 (40)
Emerging Markets (LC) Fixed Income Peer Group Median -5.6 -0.3 -1.9 1.9 3.8 N/A 1.9
Tactical Asset Allocation Manager
GMO Asset Allocation Fund 25,034,719 10.0 -2.8 (67) 2.5 (59) 6.9 (62) 9.8 (61) 7.7 (66) 7.0 (30) 6.0 (37) 8y 2m
65% MSCI World (Net) / 35% BC Aggregate -1.3 (35) 4.0 (37) 9.3 (35) 12.4 (33) 8.7 (47) 6.6 (38) 5.6 (50)
IM Flexible Portfolio (MF) Median -1.9 3.2 7.8 10.7 8.6 6.1 5.6
_________________________Performance is reported net of fees.
11

Performance SummaryManager Asset Allocation and PerformanceAs of September 30, 2014
Allocation
MarketValue
($) %
Performance(%)
Quarter
YearTo
Date1
Year3
Years5
Years10
YearsSince
InceptionInception
Period
Alternatives Manager
PIMCO All Asset Fund I 10,088,586 4.0 -2.9 3.8 5.2 8.0 7.5 6.4 6.1 8y 9m
Barclays U.S. Treasury Inflation Notes: 1-10 Year -2.0 1.9 0.6 0.9 3.4 4.0 4.2
Real Estate Manager
UBS Trumbull Property Fund 13,188,272 5.3 2.9 7.5 9.6 9.3 10.0 6.7 4.9 8y 4m
NCREIF Fund Index-Open End Diversified Core Equity 0.0 5.4 8.6 10.9 11.3 6.4 4.5
Real Asset Manager
Wellington Diversified Inflation Hedges 10,896,322 4.4 -8.0 -0.3 2.4 1.9 N/A N/A 1.8 4y 6m
Wellington DIH Multi-Asset Inflation Index -8.1 -1.1 0.4 1.5 2.3 4.9 1.0
Cash Account 1,306,537 0.5 0.0 0.0 0.1 0.1 -0.3 1.5 1.4 11y 4m
BofA Merrill Lynch 3 Month U.S. T-Bill 0.0 0.0 0.0 0.1 0.1 1.6 1.5
Total Composite 250,168,126 100.0 -1.9 3.3 7.4 10.6 8.3 6.8 7.8 21y 9m
_________________________Performance is reported net of fees.
12

12.0
14.0
16.0
18.0
20.0
22.0
24.0
26.0
28.0
Retu
rn (%
)
12.0 13.0 14.0 15.0 16.0 17.0 18.0 19.0 20.0 21.0 22.0
Risk (Standard Deviation %)
Russell 2000 Growth
Russell Midcap Value
Russell 1000 Growth
S&P 500 Russell 1000 Value
Holland Large Cap Growth
Kennedy Mid Cap Value
TimesSquare Small Cap Growth
Vanguard Windsor II Fund
Vanguard Institutional Index Fund
T. Rowe Price Inst. Large-Cap Core Growth
Performance SummaryRisk and Return Summary - Equity Managers5 Years Ending September 30, 2014
13

0.0
1.5
3.0
4.5
6.0
7.5
9.0
10.5
12.0
Re
turn
(%)
0.0 1.5 3.0 4.5 6.0 7.5 9.0 10.5 12.0 13.5
Risk (Standard Deviation %)
50% BC Credit / 25% S&P LSTA / 25% BY High Yield
JPM GBI-EM Global Diversified
Citigroup World Government Bond
BofA Merrill Lynch US High Yield, Cash Pay Index
BC Intermediate U.S. Government/Credit
Penn Capital
Income Research
Brandywine Global
Performance SummaryRisk and Return Summary - Fixed Income Managers5 Years Ending September 30, 2014
14

-2.0
0.0
2.0
4.0
6.0
8.0
10.0
12.0
14.0
Re
turn
(%)
-4.0 -2.0 0.0 2.0 4.0 6.0 8.0 10.0 12.0 14.0 16.0
Risk (Standard Deviation %)
90 Day U.S. Treasury Bill
Barclays U.S. Treasury Inflation Notes: 1-10 Year
NCREIF Fund Index-Open End Diversified Core Equity
Wellington DIH Multi-Asset Inflation Index
65% MSCI World (Net) / 35% BC Aggregate
UBS TPF
PIMCO All AssetGMO
Performance SummaryRisk and Return Summary - Alternative Managers5 Years Ending September 30, 2014
15

Manager Compliance ChecklistThird Quarter 2014
Managers
Vanguard
Windsor
Vanguard
Institutional
T. Rowe
Price Holland Kennedy TimesSquare
Morgan
Stanley Int'l
Morgan
Stanley EM
Organizational/Product Issues
No material changes to investment team + + + + + + - +No material organizational changes + + + + + + + +
Accounting or regulatory concerns + + + + + + + +
Currently in adherence to guidelines + + + + + + + +
Portfolio characteristics meet stylistic expectations + + + + + + + +
Relative Performance 1
Three-year return better than benchmark - N/A + - + - + +Three-year ranking better than peer group median + + + - + - + -
Five year return better than benchmark - N/A + - + + + +
1 Manager performance is evaluated net of investment management fees.
+ + + + +
Five year ranking better than peer group median + + + - + + + +
Performance status + + + + + + + +
Date performance status changed
Summary status Sell + + + + + + Sell
Date summary status changed 4Q13 4Q13
16

Manager Compliance ChecklistThird Quarter 2014
Managers
Income
Research Penn Loomis
Brandywine
Global Pictet GMO PIMCO UBS Wellington
Organizational/Product Issues
No material changes to investment team + + + - + + - + +No material organizational changes + + + + + + + + +
Accounting or regulatory concerns + + + + + + + + +
Currently in adherence to guidelines + + + + + + + + +
Portfolio characteristics meet stylistic expectations + + + + + + + + +
Relative Performance 1
Three-year return better than benchmark + - + + - - + - +
Three-year ranking better than peer group median - - + + - - N/A N/A N/A
Five year return better than benchmark + - N/A + N/A - + - N/A
1 Manager performance is evaluated net of investment management fees.
Five year return better than benchmark + - N/A + N/A - + - N/A
Five year ranking better than peer group median - - N/A + N/A - N/A N/A N/A
Performance status + - + + - - + + +
Date performance status changed 4Q13 4Q13 3Q14
Summary status + Sell Sell + Sell Sell Sell + +
Date summary status changed 4Q13 4Q13 4Q13 4Q13 4Q13
17

Asset Class Diversification
18

September 30, 2014 : $250,168,126
Target Allocation Actual Allocation Allocation Differences
0.0% 6.0% 12.0% 18.0% 24.0% 30.0% 36.0% 42.0%-6.0 %-12.0 %
Cash Account$1,306,537
Real Asset Composite$10,896,322
Real Estate Composite$13,188,272
Alternatives Composite$10,088,586
Tactical Asset Allocation Composite$25,034,719
Fixed Income Composite$87,074,484
Emerging International Equity Composite$7,381,126
Developed International Equity Composite$27,171,164
Small-Cap Equity Composite$14,709,760
Large-Cap Equity Composite$53,317,156
0.0%
5.0%
5.0%
4.0%
10.0%
35.0%
3.0%
11.0%
6.0%
21.0%
0.5%
4.4%
5.3%
4.0%
10.0%
34.8%
3.0%
10.9%
5.9%
21.3%
0.5%
-0.6 %
0.3%
0.0%
0.0%
-0.2 %
0.0%
-0.1 %
-0.1 %
0.3%
Asset Class DiversificationInvestment Policy AllocationAs of September 30, 2014
19

Asset Class/Type Manager
Total Assets
($, mil.) as of
9/30/2014
Percent of
Total
Target
Allocation
Weighting
Relative to
Target
Allowable
Range
Total Assets
($, mil.) as of
7/1/2014
Large-Cap Equity $53.3 21.3% 21.0% + 0.3% 15 - 25% $55.9
Core Vanguard Institutional $12.4 5.0% 6.0% - 1.0% $12.3
Value Vanguard Windsor $14.1 5.6% 5.0% + 0.6% $16.0
Growth T. Rowe Price $13.8 5.5% 5.0% + 0.5% $13.6
Growth Holland $12.9 5.2% 5.0% + 0.2% $14.0
Small-Cap Equity $14.7 5.9% 6.0% - 0.1% 2 - 8% $15.6
Value Kennedy $8.4 3.4% 3.0% + 0.4% $8.9
Growth TimesSquare $6.3 2.5% 3.0% - 0.5% $6.7
International Equity $34.6 13.8% 14.0% - 0.2% $36.3
Developed Morgan Stanley $27.2 10.9% 11.0% - 0.1% 5 - 15% $28.6
Emerging Markets Morgan Stanley $7.4 3.0% 3.0% - 0.0% 2 - 8% $7.6
Fixed Income $87.1 34.8% 35.0% - 0.2% $88.5
Asset Class DiversificationInvestment Program StructureAs of September 30, 2014
Fixed Income $87.1 34.8% 35.0% - 0.2% $88.5
Domestic Core Income Research $35.7 14.3% 14.0% + 0.3% 10 - 20% $35.7
High Yield Penn Capital $12.8 5.1% 5.0% + 0.1% 0 - 7% $13.0
Opportunistic Credit Loomis $5.0 2.0% 2.0% - 0.0% 0 - 5% $5.0
Global Brandywine Global $22.1 8.8% 9.0% - 0.2% 4 - 14% $22.5
Emerging Markets Debt Pictet $11.5 4.6% 5.0% - 0.4% 0 - 7% $12.2
Tactical $25.0 10.0% 10.0% + 0.0% $25.8
Balanced GMO $25.0 10.0% 10.0% + 0.0% 0 - 12% $25.8
Alternatives $10.1 4.0% 4.0% + 0.0% $10.4
Absolute Return PIMCO $10.1 4.0% 4.0% + 0.0% 0 - 7% $10.4
Hedge Funds TBD $0.0 0.0% -- -- 0 - 20% $0.0
Real Estate $13.2 5.3% 5.0% + 0.3% $12.8
Real Estate UBS Trumbull $13.2 5.3% 5.0% + 0.3% 0 - 10% $12.8
Real Asset $10.9 4.4% 5.0% - 0.6% $11.8
Real Asset Wellington $10.9 4.4% 5.0% - 0.6% 0 - 10% $11.8
Cash $1.3 0.5% 0.0% + 0.5% $1.3
Cash Account Cash Account $1.3 0.5% 0.0% + 0.5% $1.3
Total $250.2 100.0% 100.0% + 0.0% $258.4
*Totals may not add to exactly 100.0% due to rounding.
20

Top Ten Equity Holdings
PortfolioWeight
(%)
BenchmarkWeight
(%)
ActiveWeight
(%)
QuarterlyReturn
(%)
British American Tobacco PLC 1.2 0.3 1.0 -3.8
Reckitt Benckiser Group PLC 1.2 0.1 1.1 0.6
Sanofi 1.2 0.3 0.9 6.5
Apple Inc 1.2 1.4 -0.2 9.0
Nestle SA, Cham Und Vevey 1.2 0.6 0.6 -5.1
Unilever NV 1.2 0.2 1.0 -8.1
Gilead Sciences Inc 1.1 0.4 0.7 28.4
Amazon.com Inc 1.1 0.3 0.8 -0.7
Google Inc (Class C) 1.0 0.4 0.6 0.4
Novartis AG 1.0 0.5 0.5 4.2
% of Portfolio 11.4 4.4
Portfolio Characteristics
Portfolio Benchmark
Wtd. Avg. Mkt. Cap ($M) 78,402 78,388
Median Mkt. Cap ($M) 12,427 1,393
Price/Earnings ratio 19.2 16.7
Price/Book ratio 3.0 2.5
5 Yr. EPS Growth Rate (%) 14.1 14.4
Current Yield (%) 1.9 2.5
Debt to Equity 1.7 1.0
Number of Stocks 960 8,511
Beta - 1.00
Consistency - -
Sharpe Ratio - -
Information Ratio - -
Up Market Capture - -
Down Market Capture - -
Sector Weights (%)
Total Equity Composite MSCI AC World IMI
0.0 5.0 10.0 15.0 20.0 25.0 30.0
Other
Cash
Utilities
Telecommunication Services
Materials
Information Technology
Industrials
Health Care
Financials
Energy
Consumer Staples
Consumer Discretionary
0.0
2.0
1.6
1.8
4.2
17.1
10.6
13.9
15.9
7.7
11.4
13.6
0.0
0.0
3.2
3.5
6.1
13.4
11.4
11.0
21.6
8.9
8.9
12.0
Distribution of Market Capitalization (%)
Total Equity Composite MSCI AC World IMI
0.0
10.0
20.0
30.0
40.0
>$75 Bil $20 Bil - $75 Bil
$5 Bil - $20 Bil
$0 - $5 Bil
Cash
31.1 31.3
22.8
14.8
0.0
31.830.9
25.2
10.2
2.0
Equity Portfolio - CharacteristicsTotal Equity Composite vs. MSCI AC World IMIAs of September 30, 2014
21
Total EquityComposite MSCI AC World IMI
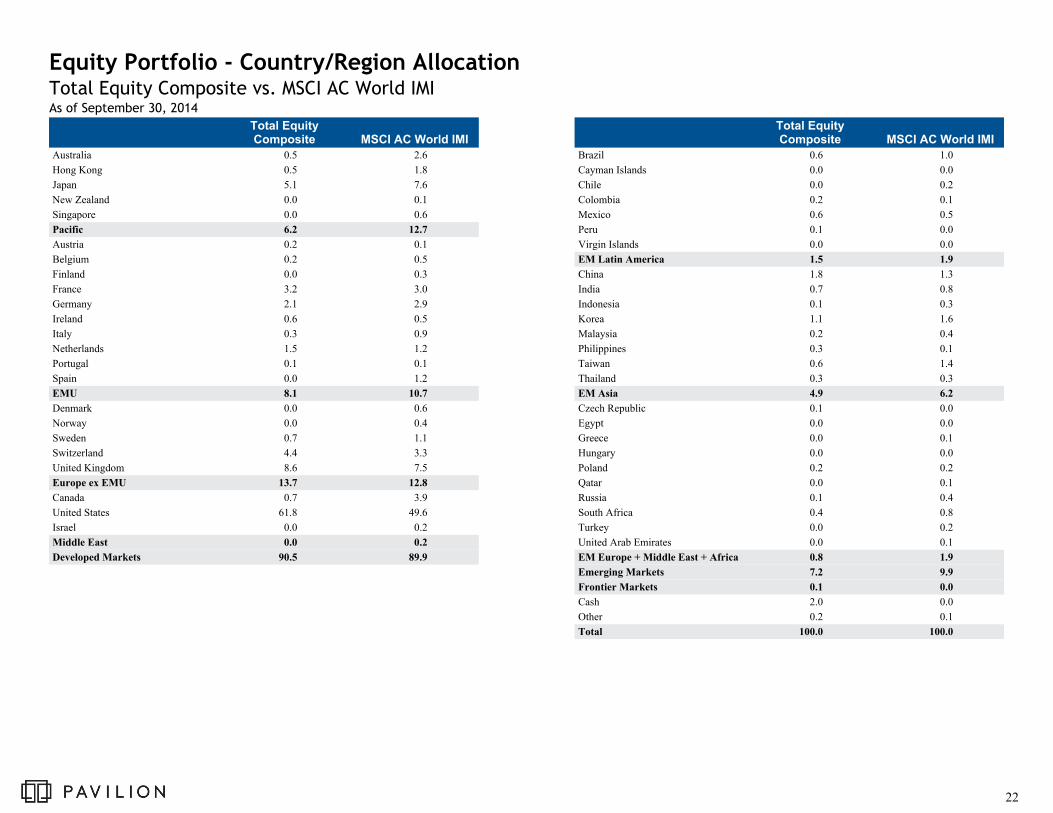
Australia 0.5 2.6
Hong Kong 0.5 1.8
Japan 5.1 7.6
New Zealand 0.0 0.1
Singapore 0.0 0.6
Pacific 6.2 12.7
Austria 0.2 0.1
Belgium 0.2 0.5
Finland 0.0 0.3
France 3.2 3.0
Germany 2.1 2.9
Ireland 0.6 0.5
Italy 0.3 0.9
Netherlands 1.5 1.2
Portugal 0.1 0.1
Spain 0.0 1.2
EMU 8.1 10.7
Denmark 0.0 0.6
Norway 0.0 0.4
Sweden 0.7 1.1
Switzerland 4.4 3.3
United Kingdom 8.6 7.5
Europe ex EMU 13.7 12.8
Canada 0.7 3.9
United States 61.8 49.6
Israel 0.0 0.2
Middle East 0.0 0.2
Developed Markets 90.5 89.9
Total EquityComposite MSCI AC World IMI
Brazil 0.6 1.0
Cayman Islands 0.0 0.0
Chile 0.0 0.2
Colombia 0.2 0.1
Mexico 0.6 0.5
Peru 0.1 0.0
Virgin Islands 0.0 0.0
EM Latin America 1.5 1.9
China 1.8 1.3
India 0.7 0.8
Indonesia 0.1 0.3
Korea 1.1 1.6
Malaysia 0.2 0.4
Philippines 0.3 0.1
Taiwan 0.6 1.4
Thailand 0.3 0.3
EM Asia 4.9 6.2
Czech Republic 0.1 0.0
Egypt 0.0 0.0
Greece 0.0 0.1
Hungary 0.0 0.0
Poland 0.2 0.2
Qatar 0.0 0.1
Russia 0.1 0.4
South Africa 0.4 0.8
Turkey 0.0 0.2
United Arab Emirates 0.0 0.1
EM Europe + Middle East + Africa 0.8 1.9
Emerging Markets 7.2 9.9
Frontier Markets 0.1 0.0
Cash 2.0 0.0
Other 0.2 0.1
Total 100.0 100.0
Equity Portfolio - Country/Region AllocationTotal Equity Composite vs. MSCI AC World IMIAs of September 30, 2014
22

Portfolio Characteristics
Maturity Distribution (%)
Credit Quality Distribution (%)
Risk Characteristics - 3 Years
Sector Distribution (%)
Total Fixed Income Composite
Barclays Intermediate U.S. Government/Credit
0.0
25.0
50.0
75.0
100.0
AAA AA ABBB BB B
CCC NR
64.9
6.6
14.3 14.2
0.0 0.0 0.0 0.0
26.4
9.9
18.621.5
10.3 11.1
0.6 1.6
Portfolio Benchmark
Effective Duration 4.6 3.9
Avg. Maturity 7.4 4.2
Avg. Quality A+ AA
Yield To Maturity (%) 3.8 1.7
ConsistencySharpeRatio
InformationRatio
UpMarket
Capture
DownMarket
Capture
Total Fixed Income Composite 63.9 1.0 0.7 185.6
Barclays Intermediate U.S. Government/Credit 0.0 1.0 N/A 100.0
90 Day U.S. Treasury Bill 38.9 N/A -1.0 1.0
Total Fixed Income Composite
Barclays Intermediate U.S. Government/Credit
0.0
25.0
50.0
75.0
100.0
Treasu
ries
TIPS
Agenc
ies
Credi
t
Hig
h Yie
ldM
BSABS
Non-U
S
Emer
ging
Munic
ipal
s
Cas
h
Oth
er
CMBS
56.4
0.06.0
24.5
0.0 0.0 0.0
10.6
2.4 0.0 0.0 0.0 0.0
24.6
0.0 0.3
17.9 15.4
2.7 3.3
14.8
3.8 1.2 4.0 5.8 6.2
Total Fixed Income Composite
Barclays Intermediate U.S. Government/Credit
0.0
15.0
30.0
45.0
60.0
< 1 Yr
1 < 3 Yrs
3 < 5 Yrs
5 <
10 Yrs
10 <
20 Yrs
> 20
Yrs
0.0
41.7
26.4
31.9
0.0 0.03.9
22.420.3
39.5
6.5 7.4
Fixed Income Portfolio - CharacteristicsTotal Fixed Income Composite vs. Barclays Intermediate U.S. Government/CreditAs of September 30, 2014
23

Manager Evaluation
24

Historical Performance
Buy and Hold Attribution
Risk and Return (Oct - 2009 - Sep - 2014)Three Year Rolling Percentile Ranking
Quarter
YearTo
Date1
Year3
Years5
Years10
Years 2013 2012 2011 2010 2009 2008 2007 2006 2005 2004
Vanguard Windsor II -0.2 7.4 17.7 22.8 14.8 8.0 30.8 16.8 2.8 10.7 27.2 -36.6 2.3 18.4 7.2 18.4
Russell 1000 Value Index -0.2 8.1 18.9 23.9 15.3 7.8 32.5 17.5 0.4 15.5 19.7 -36.8 -0.2 22.2 7.1 16.5
Large-Cap Value Equity Peer Group Median -0.3 6.1 16.2 21.8 14.0 7.5 31.7 15.0 -1.5 13.5 25.4 -37.3 2.9 16.6 6.1 12.5
Vanguard Windsor II Rank 47 26 34 36 33 39 61 28 17 86 41 44 55 35 36 6
14.0
14.5
15.0
15.5
16.0
Re
turn
(%)
14.5 14.6 14.7Risk (Standard Deviation %)
Russell 1000 Value Index
Vanguard Windsor II
Vanguard Windsor II Russell 1000 Value Index
0
25
50
75
100
Re
turn
Pe
rce
nti
le R
an
k
12/04 12/05 12/06 12/07 12/08 12/09 12/10 12/11 12/12 9/14
Average Active Weight
0.0 8.0 16.0-8.0-16.0
UtilitiesTelecommunication Services
OtherMaterials
Information TechnologyIndustrials
Health CareFinancials
EnergyConsumer Staples
Consumer DiscretionaryCash
-1.90.40.3
-1.81.7
-1.24.3
-8.0-1.6
3.11.82.9
Allocation(Total: 0.4)
0.0 0.2 0.4-0.2-0.4
0.10.00.00.0
0.10.0
0.1-0.2
0.10.1
0.00.0
Stock(Total: -0.1)
0.0 0.4 0.8-0.4-0.8
-0.10.00.00.00.0
0.40.3
-0.1-0.3-0.3
-0.20.0
Vanguard Windsor II
0.0 0.3 0.6 0.9-0.3-0.6
0.00.0
0.00.1
0.10.40.4
-0.2-0.2-0.2
-0.20.0
Manager EvaluationVanguard Windsor II vs. Russell 1000 Value IndexAs of September 30, 2014
Differences between the manager return and the attribution return are due primarily to the effects of fees and portfolio trading.
25

Top Ten Equity Holdings
PortfolioWeight
(%)
BenchmarkWeight
(%)
ActiveWeight
(%)
QuarterlyReturn
(%)
Microsoft Corp 3.0 1.4 1.7 11.9
JPMorgan Chase & Co 2.7 2.3 0.4 5.3
Pfizer Inc 2.6 1.9 0.7 0.5
Intel Corp 2.6 1.6 1.0 13.5
Wells Fargo & Co 2.5 2.5 0.0 -0.6
Johnson & Johnson 2.3 2.6 -0.3 2.6
Medtronic Inc 2.3 0.6 1.6 -2.4
Citigroup Inc 2.3 1.6 0.7 10.0
WellPoint Inc 2.2 0.3 1.9 11.6
Philip Morris International Inc 2.2 0.6 1.6 0.1
% of Portfolio 24.6 15.3
Portfolio Characteristics
Portfolio Benchmark
Wtd. Avg. Mkt. Cap ($M) 109,816 112,109
Median Mkt. Cap ($M) 22,184 6,878
Price/Earnings ratio 15.7 16.5
Price/Book ratio 2.2 2.0
5 Yr. EPS Growth Rate (%) 16.0 11.2
Current Yield (%) 2.7 2.4
Debt to Equity 1.2 0.9
Number of Stocks 258 690
Beta (5 Years, Monthly) 0.97 1.00
Consistency (5 Years, Monthly) 43.33 1.00
Sharpe Ratio (5 Years, Monthly) 1.10 1.11
Information Ratio (5 Years, Monthly) -0.20 -
Up Market Capture (5 Years, Monthly) 96.40 -
Down Market Capture (5 Years, Monthly) 95.70 -
Sector Weights (%)
Vanguard Windsor II Russell 1000 Value Index
0.0 8.0 16.0 24.0 32.0 40.0
Other
Cash
Utilities
Telecommunication Services
Materials
Information Technology
Industrials
Health Care
Financials
Energy
Consumer Staples
Consumer Discretionary
0.3
2.3
3.8
2.7
1.6
13.3
8.5
17.3
21.4
10.6
9.4
8.9
0.0
0.0
6.0
2.3
3.3
9.4
10.2
13.5
29.2
12.9
7.1
6.2
Distribution of Market Capitalization (%)
Vanguard Windsor II Russell 1000 Value Index
0.0
15.0
30.0
45.0
60.0
>$75 Bil $20 Bil - $75 Bil
$5 Bil - $20 Bil
$0 - $5 Bil
Cash
42.4
31.3
20.1
6.2
0.0
45.4
35.1
15.6
1.7 2.3
Manager EvaluationVanguard Windsor II vs. Russell 1000 Value IndexAs of September 30, 2014
*Portfolio characteristics as of 12/31/2013.
26

Historical Performance
Three Year Rolling Percentile Ranking Relative Performance
Historical Statistics (Oct-2009 - Sep-2014)
Quarter
YearTo
Date1
Year3
Years5
Years10
Years 2013 2012 2011 2010 2009 2008 2007 2006 2005 2004
Vanguard Institutional Index 1.1 8.3 19.7 23.0 15.7 8.1 32.3 16.0 2.1 15.0 26.6 -37.0 5.5 15.8 4.9 10.9
S&P 500 Index 1.1 8.3 19.7 23.0 15.7 8.1 32.4 16.0 2.1 15.1 26.5 -37.0 5.5 15.8 4.9 10.9
Large-Cap Equity Peer Group Median 0.1 6.0 16.4 21.5 14.3 7.8 32.4 14.6 -1.0 14.0 27.8 -37.5 6.2 13.3 5.9 10.2
Vanguard Institutional Index Rank 25 15 17 30 24 42 51 36 22 38 56 45 55 32 62 44
Cumulative Annualized Over/Under Relative Performance
Over/Under Performance
0.0
0.1
0.2
-0.1
-0.2
Re
turn
(%)
12/04 12/05 12/06 12/07 12/08 12/09 12/10 12/11 12/12 9/14
Vanguard Institutional Index S&P 500 Index
0
25
50
75
100
Re
turn
Pe
rce
nti
le R
an
k
12/04 12/05 12/06 12/07 12/08 12/09 12/10 12/11 12/12 9/14
ReturnStandardDeviation
ExcessReturn Alpha Beta
SharpeRatio
TrackingError
InformationRatio
DownsideRisk Consistency
InceptionDate
Vanguard Institutional Index 15.7 14.1 15.8 0.0 1.0 1.1 0.0 -1.3 8.1 15.0 15y
S&P 500 Index 15.7 14.1 15.8 0.0 1.0 1.1 0.0 N/A 8.1 0.0 15y
90 Day U.S. Treasury Bill 0.1 0.0 0.0 0.1 0.0 N/A 14.1 -1.1 0.0 20.0 15y
Manager EvaluationVanguard Institutional Index vs. S&P 500 IndexAs of September 30, 2014
27

Top Ten Equity Holdings
PortfolioWeight
(%)
BenchmarkWeight
(%)
ActiveWeight
(%)
QuarterlyReturn
(%)
Apple Inc 3.4 3.4 0.0 9.0
Exxon Mobil Corp 2.3 2.3 0.0 -5.9
Microsoft Corp 2.2 2.2 0.0 11.9
Johnson & Johnson 1.7 1.7 0.0 2.6
General Electric Co 1.5 1.5 0.0 -1.7
Wells Fargo & Co 1.4 1.4 0.0 -0.6
Berkshire Hathaway Inc 1.3 1.4 -0.1 9.1
Procter & Gamble Co (The) 1.3 1.3 0.0 7.4
JPMorgan Chase & Co 1.3 1.3 0.0 5.3
Chevron Corp 1.3 1.3 0.0 -7.8
% of Portfolio 17.7 17.8
Portfolio Characteristics
Portfolio Benchmark
Wtd. Avg. Mkt. Cap ($M) 129,536 129,536
Median Mkt. Cap ($M) 17,195 17,148
Price/Earnings ratio 18.6 18.6
Price/Book ratio 2.9 2.9
5 Yr. EPS Growth Rate (%) 14.6 14.5
Current Yield (%) 2.0 2.0
Debt to Equity 1.2 1.2
Number of Stocks 504 502
Beta (5 Years, Monthly) 1.00 1.00
Consistency (5 Years, Monthly) 28.33 1.00
Sharpe Ratio (5 Years, Monthly) 1.18 1.18
Information Ratio (5 Years, Monthly) -1.11 -
Up Market Capture (5 Years, Monthly) 99.95 -
Down Market Capture (5 Years, Monthly) 100.05 -
Sector Weights (%)
Vanguard Institutional Index S&P 500 Index
0.0 5.0 10.0 15.0 20.0 25.0
Utilities
Telecommunication Services
Materials
Information Technology
Industrials
Health Care
Financials
Energy
Consumer Staples
Consumer Discretionary
3.0
2.4
3.5
19.7
10.3
13.9
16.3
9.7
9.5
11.7
3.0
2.4
3.5
19.7
10.3
13.9
16.3
9.7
9.5
11.7
Distribution of Market Capitalization (%)
Vanguard Institutional Index S&P 500 Index
0.0
15.0
30.0
45.0
60.0
>$75 Bil $20 Bil - $75 Bil
$5 Bil - $20 Bil
$0 - $5 Bil
48.7
34.7
16.1
0.5
48.7
34.7
16.1
0.5
Manager EvaluationVanguard Institutional Index vs. S&P 500 IndexAs of September 30, 2014
28

Historical Performance
Buy and Hold Attribution
Risk and Return (Oct - 2009 - Sep - 2014)Three Year Rolling Percentile Ranking
Quarter
YearTo
Date1
Year3
Years5
Years10
Years 2013 2012 2011 2010 2009 2008 2007 2006 2005 2004
T. Rowe Price LCC Growth 1.8 4.8 18.2 24.6 17.4 9.0 41.4 18.5 1.5 16.4 43.0 -42.6 13.0 9.1 4.0 7.3
Russell 1000 Growth Index 1.5 7.9 19.1 22.4 16.5 8.9 33.5 15.3 2.6 16.7 37.2 -38.4 11.8 9.1 5.3 6.3
Large-Cap Growth Peer Group Median 1.1 5.5 16.7 21.5 15.1 8.5 34.6 14.6 -0.8 15.3 33.4 -38.3 13.8 7.1 6.2 7.7
T. Rowe Price LCC Growth Rank 29 62 33 11 15 40 12 16 27 39 14 78 55 33 69 56
15.3
16.2
17.1
18.0
18.9
Re
turn
(%)
13.5 14.0 14.5 15.0 15.5 16.0 16.5 17.0Risk (Standard Deviation %)
Russell 1000 Growth Index
T. Rowe Price LCC Growth
T. Rowe Price LCC Growth Russell 1000 Growth Index
0
25
50
75
100
Re
turn
Pe
rce
nti
le R
an
k
12/04 12/05 12/06 12/07 12/08 12/09 12/10 12/11 12/12 9/14
Average Active Weight
0.0 15.0 30.0-15.0
Utilities
Telecommunication ServicesMaterials
Information Technology
Industrials
Health CareFinancials
Energy
Consumer StaplesConsumer Discretionary
Cash
-0.1
-1.9-0.4
-6.3
2.3
4.82.3
-1.2
-8.4
8.30.6
Allocation(Total: 0.1)
0.0 0.3 0.6-0.3-0.6
0.0
0.00.0
-0.2
-0.1
0.3-0.1
0.1
0.1
-0.10.0
Stock(Total: 0.2)
0.0 0.5 1.0-0.5-1.0
0.0
0.00.1
-0.1
0.0
0.50.4
-0.3
0.1
-0.40.0
T. Rowe Price LCC Growth
0.0 0.5 1.0 1.5-0.5-1.0
0.0
-0.10.1
-0.2
-0.1
0.80.3
-0.1
0.1
-0.40.0
Manager EvaluationT. Rowe Price Large-Cap Core Growth vs. Russell 1000 Growth IndexAs of September 30, 2014
Differences between the manager return and the attribution return are due primarily to the effects of fees and portfolio trading.
29

Top Ten Equity Holdings
PortfolioWeight
(%)
BenchmarkWeight
(%)
ActiveWeight
(%)
QuarterlyReturn
(%)
Amazon.com Inc 4.3 1.2 3.1 -0.7
Gilead Sciences Inc 4.0 1.6 2.4 28.4
Priceline.Com Inc 3.1 0.6 2.6 -3.7
Google Inc (Class C) 2.8 1.6 1.2 0.4
Google Inc 2.8 1.6 1.2 0.6
McKesson Corp 2.7 0.4 2.3 4.7
Biogen Idec Inc 2.6 0.8 1.8 4.9
Facebook Inc 2.5 1.5 1.0 17.5
Baidu Inc 2.4 0.0 2.4 16.8
Danaher Corp 2.4 0.1 2.2 -3.4
% of Portfolio 29.5 9.4
Portfolio Characteristics
Portfolio Benchmark
Wtd. Avg. Mkt. Cap ($M) 83,008 116,514
Median Mkt. Cap ($M) 26,144 8,528
Price/Earnings ratio 28.8 21.9
Price/Book ratio 5.3 4.9
5 Yr. EPS Growth Rate (%) 21.2 17.8
Current Yield (%) 0.6 1.5
Debt to Equity 6.2 1.4
Number of Stocks 137 674
Beta (5 Years, Monthly) 1.11 1.00
Consistency (5 Years, Monthly) 55.00 1.00
Sharpe Ratio (5 Years, Monthly) 1.12 1.20
Information Ratio (5 Years, Monthly) 0.29 -
Up Market Capture (5 Years, Monthly) 108.54 -
Down Market Capture (5 Years, Monthly) 111.19 -
Sector Weights (%)
T. Rowe Price Large-Cap Core Growth
Russell 1000 Growth Index
0.0 8.0 16.0 24.0 32.0 40.0
Cash
Utilities
Telecommunication Services
Materials
Information Technology
Industrials
Health Care
Financials
Energy
Consumer Staples
Consumer Discretionary
1.4
0.0
0.4
3.6
22.2
13.0
21.2
7.4
3.8
2.1
24.9
0.0
0.1
2.4
4.2
28.4
11.9
13.6
5.1
5.7
10.3
18.2
Distribution of Market Capitalization (%)
T. Rowe Price Large-Cap Core Growth
Russell 1000 Growth Index
0.0
15.0
30.0
45.0
60.0
>$75 Bil $20 Bil - $75 Bil
$5 Bil - $20 Bil
$0 - $5 Bil
Cash
43.0
31.4
21.3
4.2
0.0
34.7
44.4
19.6
0.01.4
Manager EvaluationT. Rowe Price Large-Cap Core Growth vs. Russell 1000 Growth IndexAs of September 30, 2014
30
Historical Performance
Buy and Hold Attribution
Risk and Return (Oct - 2009 - Sep - 2014)Three Year Rolling Percentile Ranking
Quarter
YearTo
Date1
Year3
Years5
Years10
Years 2013 2012 2011 2010 2009 2008 2007 2006 2005 2004
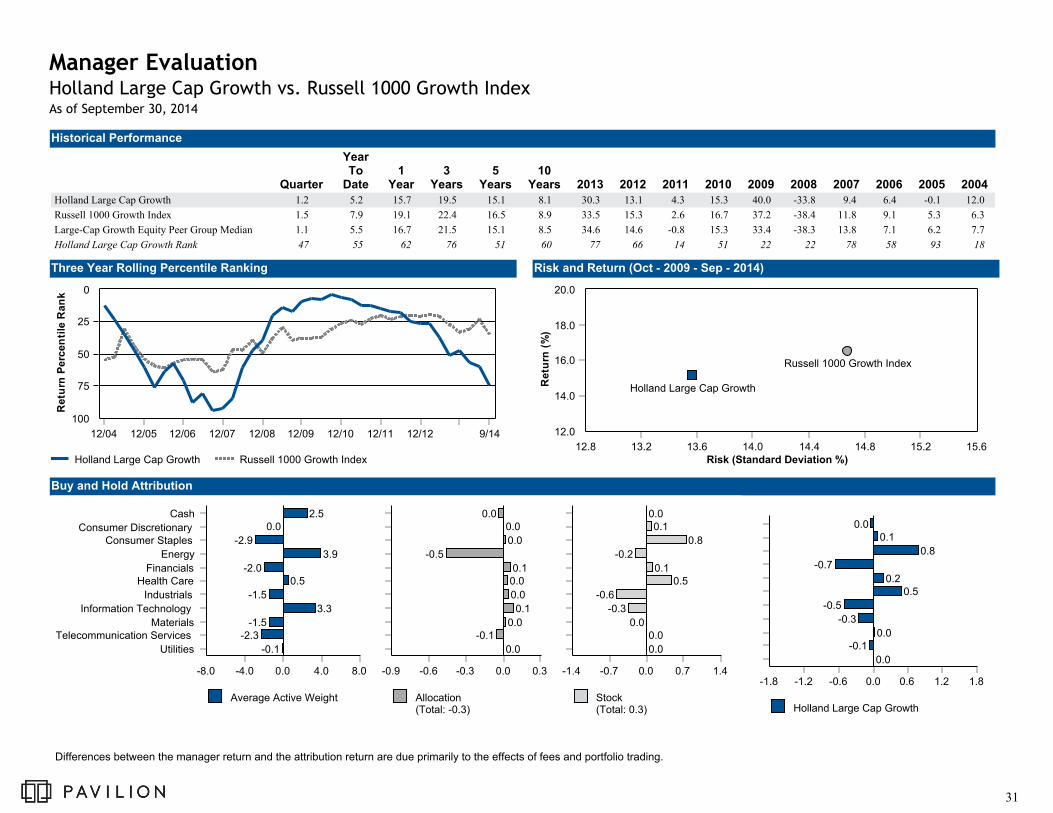
Holland Large Cap Growth 1.2 5.2 15.7 19.5 15.1 8.1 30.3 13.1 4.3 15.3 40.0 -33.8 9.4 6.4 -0.1 12.0
Russell 1000 Growth Index 1.5 7.9 19.1 22.4 16.5 8.9 33.5 15.3 2.6 16.7 37.2 -38.4 11.8 9.1 5.3 6.3
Large-Cap Growth Equity Peer Group Median 1.1 5.5 16.7 21.5 15.1 8.5 34.6 14.6 -0.8 15.3 33.4 -38.3 13.8 7.1 6.2 7.7
Holland Large Cap Growth Rank 47 55 62 76 51 60 77 66 14 51 22 22 78 58 93 18
12.0
14.0
16.0
18.0
20.0
Re
turn
(%)
12.8 13.2 13.6 14.0 14.4 14.8 15.2 15.6Risk (Standard Deviation %)
Russell 1000 Growth Index
Holland Large Cap Growth
Holland Large Cap Growth Russell 1000 Growth Index
0
25
50
75
100
Re
turn
Pe
rce
nti
le R
an
k
12/04 12/05 12/06 12/07 12/08 12/09 12/10 12/11 12/12 9/14
Average Active Weight
0.0 4.0 8.0-4.0-8.0
Utilities
Telecommunication ServicesMaterials
Information Technology
Industrials
Health CareFinancials
Energy
Consumer StaplesConsumer Discretionary
Cash
-0.1
-2.3-1.5
3.3
-1.5
0.5-2.0
3.9
-2.9
0.02.5
Allocation(Total: -0.3)
0.0 0.3-0.3-0.6-0.9
0.0
-0.10.0
0.1
0.0
0.00.1
-0.5
0.0
0.00.0
Stock(Total: 0.3)
0.0 0.7 1.4-0.7-1.4
0.0
0.00.0
-0.3
-0.6
0.50.1
-0.2
0.8
0.10.0
Holland Large Cap Growth
0.0 0.6 1.2 1.8-0.6-1.2-1.8
0.0
-0.10.0
-0.3
-0.5
0.50.2
-0.7
0.8
0.10.0
Manager EvaluationHolland Large Cap Growth vs. Russell 1000 Growth IndexAs of September 30, 2014
Differences between the manager return and the attribution return are due primarily to the effects of fees and portfolio trading.
31

Top Ten Equity Holdings
PortfolioWeight
(%)
BenchmarkWeight
(%)
ActiveWeight
(%)
QuarterlyReturn
(%)
Qualcomm Inc. 4.3 1.2 3.1 -5.1
Google Inc (Class C) 4.0 1.6 2.4 0.4
Visa Inc 3.9 1.1 2.9 1.5
Citrix Systems Inc. 3.8 0.1 3.7 14.1
Gilead Sciences Inc 3.7 1.6 2.1 28.4
Apple Inc 3.6 5.9 -2.3 9.0
Priceline.Com Inc 3.5 0.6 2.9 -3.7
Amazon.com Inc 3.4 1.2 2.2 -0.7
Adobe Systems Inc 3.3 0.3 2.9 -4.4
Range Resources Corp. 3.1 0.1 3.0 -22.0
% of Portfolio 36.4 13.7
Portfolio Characteristics
Portfolio Benchmark
Wtd. Avg. Mkt. Cap ($M) 94,418 116,514
Median Mkt. Cap ($M) 38,377 8,528
Price/Earnings ratio 24.5 21.9
Price/Book ratio 4.7 4.9
5 Yr. EPS Growth Rate (%) 16.1 17.8
Current Yield (%) 1.0 1.5
Debt to Equity 0.6 1.4
Number of Stocks 49 674
Beta (5 Years, Monthly) 0.94 1.00
Consistency (5 Years, Monthly) 48.33 1.00
Sharpe Ratio (5 Years, Monthly) 1.14 1.20
Information Ratio (5 Years, Monthly) -0.43 -
Up Market Capture (5 Years, Monthly) 93.80 -
Down Market Capture (5 Years, Monthly) 95.85 -
Sector Weights (%)
Holland Capital Management Russell 1000 Growth Index
0.0 8.0 16.0 24.0 32.0 40.0
Cash
Utilities
Telecommunication Services
Materials
Information Technology
Industrials
Health Care
Financials
Energy
Consumer Staples
Consumer Discretionary
2.9
0.0
0.0
3.1
31.0
10.4
12.9
3.7
8.7
8.8
18.5
0.0
0.1
2.4
4.2
28.4
11.9
13.6
5.1
5.7
10.3
18.2
Distribution of Market Capitalization (%)
Holland Capital Management Russell 1000 Growth Index
0.0
15.0
30.0
45.0
60.0
>$75 Bil $20 Bil - $75 Bil
$5 Bil - $20 Bil
$0 - $5 Bil
Cash
43.0
31.4
21.3
4.2
0.0
34.531.7
27.8
3.1 2.9
Manager EvaluationHolland Capital Management vs. Russell 1000 Growth IndexAs of September 30, 2014
32
Historical Performance
Buy and Hold Attribution
Risk and Return (Oct - 2009 - Sep - 2014)Three Year Rolling Percentile Ranking
Quarter
YearTo
Date1
Year3
Years5
Years10
Years 2013 2012 2011 2010 2009 2008 2007 2006 2005 2004
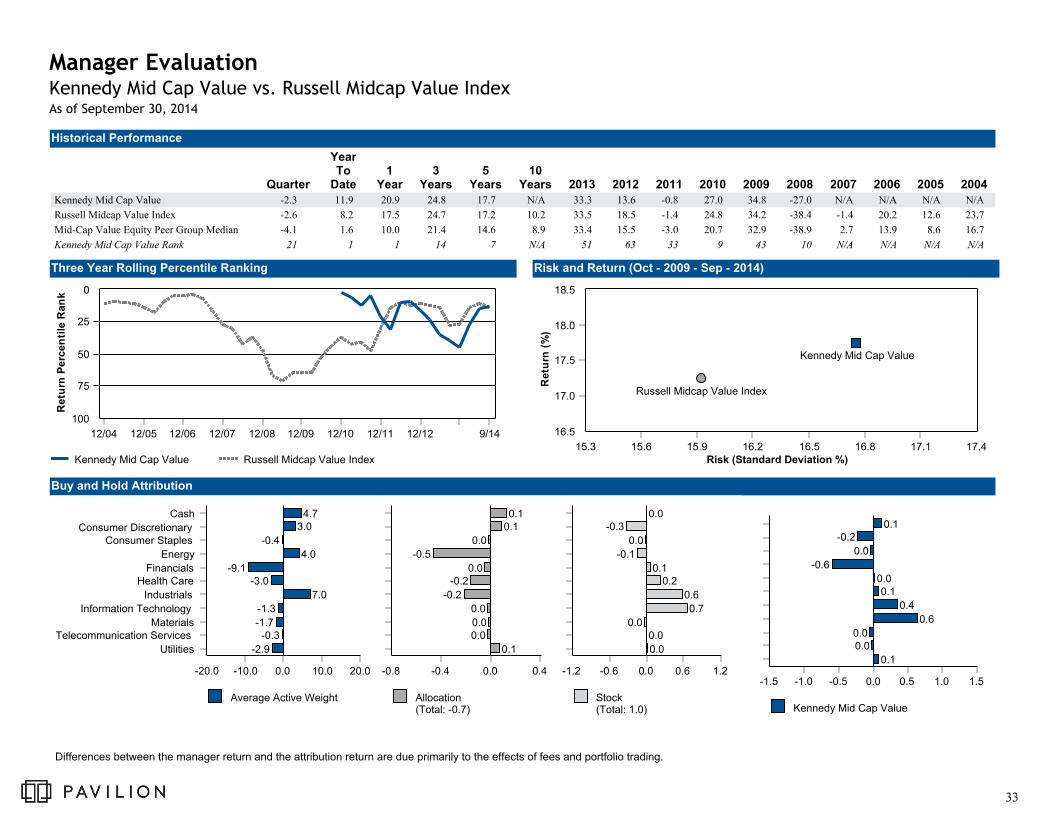
Kennedy Mid Cap Value -2.3 11.9 20.9 24.8 17.7 N/A 33.3 13.6 -0.8 27.0 34.8 -27.0 N/A N/A N/A N/A
Russell Midcap Value Index -2.6 8.2 17.5 24.7 17.2 10.2 33.5 18.5 -1.4 24.8 34.2 -38.4 -1.4 20.2 12.6 23.7
Mid-Cap Value Equity Peer Group Median -4.1 1.6 10.0 21.4 14.6 8.9 33.4 15.5 -3.0 20.7 32.9 -38.9 2.7 13.9 8.6 16.7
Kennedy Mid Cap Value Rank 21 1 1 14 7 N/A 51 63 33 9 43 10 N/A N/A N/A N/A
16.5
17.0
17.5
18.0
18.5
Re
turn
(%)
15.3 15.6 15.9 16.2 16.5 16.8 17.1 17.4Risk (Standard Deviation %)
Russell Midcap Value Index
Kennedy Mid Cap Value
Kennedy Mid Cap Value Russell Midcap Value Index
0
25
50
75
100
Re
turn
Pe
rce
nti
le R
an
k
12/04 12/05 12/06 12/07 12/08 12/09 12/10 12/11 12/12 9/14
Average Active Weight
0.0 10.0 20.0-10.0-20.0
Utilities
Telecommunication ServicesMaterials
Information Technology
Industrials
Health CareFinancials
Energy
Consumer StaplesConsumer Discretionary
Cash
-2.9
-0.3-1.7
-1.3
7.0
-3.0-9.1
4.0
-0.4
3.04.7
Allocation(Total: -0.7)
0.0 0.4-0.4-0.8
0.1
0.00.0
0.0
-0.2
-0.20.0
-0.5
0.0
0.10.1
Stock(Total: 1.0)
0.0 0.6 1.2-0.6-1.2
0.0
0.00.0
0.7
0.6
0.20.1
-0.1
0.0
-0.30.0
Kennedy Mid Cap Value
0.0 0.5 1.0 1.5-0.5-1.0-1.5
0.1
0.00.0
0.6
0.4
0.10.0
-0.6
0.0
-0.20.1
Manager EvaluationKennedy Mid Cap Value vs. Russell Midcap Value IndexAs of September 30, 2014
Differences between the manager return and the attribution return are due primarily to the effects of fees and portfolio trading.
33

Top Ten Equity Holdings
PortfolioWeight
(%)
BenchmarkWeight
(%)
ActiveWeight
(%)
QuarterlyReturn
(%)
Hospira Inc 2.5 0.3 2.2 1.3
Cadence Design Systems Inc 2.3 0.0 2.3 -1.6
Trinity Industries Inc. 2.3 0.1 2.2 7.1
Foot Locker Inc. 2.3 0.2 2.0 10.2
Reinsurance Group of America Inc. 2.2 0.1 2.1 2.0
Community Health Systems Inc 2.2 0.2 2.0 20.8
NetApp Inc 2.2 0.3 1.8 18.2
Helmerich & Payne Inc. 2.1 0.1 2.0 -15.1
Lincoln National Corp 2.1 0.5 1.6 4.5
UGI Corp 2.1 0.2 1.9 1.9
% of Portfolio 22.3 2.0
Portfolio Characteristics
Portfolio Benchmark
Wtd. Avg. Mkt. Cap ($M) 8,272 11,123
Median Mkt. Cap ($M) 6,684 5,613
Price/Earnings ratio 18.6 18.5
Price/Book ratio 2.2 1.9
5 Yr. EPS Growth Rate (%) 13.0 11.2
Current Yield (%) 1.7 2.2
Debt to Equity 0.5 0.9
Number of Stocks 57 566
Beta (5 Years, Monthly) 1.02 1.00
Consistency (5 Years, Monthly) 58.33 1.00
Sharpe Ratio (5 Years, Monthly) 1.14 1.14
Information Ratio (5 Years, Monthly) 0.16 -
Up Market Capture (5 Years, Monthly) 101.16 -
Down Market Capture (5 Years, Monthly) 98.85 -
Sector Weights (%)
Kennedy Capital Management Russell Midcap Value Index
0.0 8.0 16.0 24.0 32.0 40.0
Cash
Utilities
Telecommunication Services
Materials
Information Technology
Industrials
Health Care
Financials
Energy
Consumer Staples
Consumer Discretionary
3.5
8.7
0.0
3.8
12.8
15.6
6.1
23.8
8.0
2.0
15.8
0.0
11.9
0.3
7.1
10.8
9.5
9.3
32.2
5.4
3.4
10.0
Distribution of Market Capitalization (%)
Kennedy Capital Management Russell Midcap Value Index
0.0
25.0
50.0
75.0
100.0
$20 Bil - $75 Bil
$5 Bil - $20 Bil
$0 - $5 Bil
Cash
12.1
67.3
20.6
0.01.6
67.9
27.0
3.5
Manager EvaluationKennedy Capital Management vs. Russell Midcap Value IndexAs of September 30, 2014
34

Historical Performance
Buy and Hold Attribution
Risk and Return (Oct - 2009 - Sep - 2014)Three Year Rolling Percentile Ranking
Quarter
YearTo
Date1
Year3
Years5
Years10
Years 2013 2012 2011 2010 2009 2008 2007 2006 2005 2004
TimesSquare Small Cap Growth -5.7 -11.1 -2.9 20.0 15.9 11.6 47.7 13.1 2.6 27.3 35.7 -32.3 10.0 16.5 13.4 11.1
Russell 2000 Growth Index -6.1 -4.0 3.8 21.9 15.5 9.0 43.3 14.6 -2.9 29.1 34.5 -38.5 7.0 13.3 4.2 14.3
Small-Cap Growth Equity Peer Group Median -5.8 -5.5 1.9 20.1 14.7 8.0 44.7 12.7 -2.7 27.7 34.5 -40.6 9.9 9.9 5.8 11.3
TimesSquare Small Cap Growth Rank 46 89 88 52 28 6 31 47 14 53 46 11 49 14 10 53
14.8
15.2
15.6
16.0
16.4
16.8
Re
turn
(%)
17.8 18.0 18.2 18.4 18.6 18.8 19.0 19.2Risk (Standard Deviation %)
Russell 2000 Growth Index
TimesSquare Small Cap Growth
TimesSquare Small Cap Growth Russell 2000 Growth Index
0
25
50
75
100
Re
turn
Pe
rce
nti
le R
an
k
12/04 12/05 12/06 12/07 12/08 12/09 12/10 12/11 12/12 9/14
Average Active Weight
0.0 15.0 30.0-15.0-30.0
Utilities
Telecommunication ServicesMaterials
Information Technology
Industrials
Health CareFinancials
Energy
Consumer StaplesConsumer Discretionary
Cash
-0.2
-0.7-3.7
6.6
9.2
-10.1-0.1
-0.5
-0.1
-3.93.5
Allocation(Total: -0.1)
0.0 0.4 0.8-0.4-0.8
0.0
0.00.0
0.1
-0.2
-0.30.0
0.1
0.0
0.10.2
Stock(Total: 0.3)
0.0 0.5 1.0 1.5-0.5-1.0
0.0
0.0-0.2
0.7
-0.1
0.5-0.2
-0.2
0.1
-0.20.0
TimesSquare Small Cap Growth
0.0 0.4 0.8 1.2-0.4-0.8
0.0
0.0-0.1
0.8
-0.3
0.2-0.2
-0.2
0.1
-0.10.2
Manager EvaluationTimesSquare Small Cap Growth vs. Russell 2000 Growth IndexAs of September 30, 2014
Differences between the manager return and the attribution return are due primarily to the effects of fees and portfolio trading.
35

Top Ten Equity Holdings
PortfolioWeight
(%)
BenchmarkWeight
(%)
ActiveWeight
(%)
QuarterlyReturn
(%)
Solera Holdings Inc 2.1 0.0 2.1 -15.8
Albany International Corp. 1.9 0.0 1.9 -9.9
WEX Inc 1.9 0.5 1.4 5.1
On Assignment Inc 1.9 0.2 1.7 -24.5
Ultimate Software Group Inc 1.9 0.5 1.4 2.4
Air Methods Corp 1.8 0.3 1.5 7.5
j2 Global Inc 1.7 0.3 1.4 -2.4
Henry (Jack) & Associates Inc. 1.6 0.0 1.6 -6.0
CoStar Group Inc 1.6 0.0 1.6 -1.7
Team Health Holdings Inc 1.6 0.5 1.1 16.1
% of Portfolio 18.0 2.3
Portfolio Characteristics
Portfolio Benchmark
Wtd. Avg. Mkt. Cap ($M) 2,093 1,847
Median Mkt. Cap ($M) 1,577 785
Price/Earnings ratio 25.1 24.2
Price/Book ratio 3.4 3.7
5 Yr. EPS Growth Rate (%) 13.7 17.4
Current Yield (%) 0.5 0.6
Debt to Equity 0.5 -5.5
Number of Stocks 107 1,151
Beta (5 Years, Monthly) 0.85 1.00
Consistency (5 Years, Monthly) 53.33 1.00
Sharpe Ratio (5 Years, Monthly) 0.97 0.86
Information Ratio (5 Years, Monthly) -0.01 -
Up Market Capture (5 Years, Monthly) 87.44 -
Down Market Capture (5 Years, Monthly) 77.39 -
Sector Weights (%)
TimesSquare Small Cap Growth Russell 2000 Growth Index
0.0 8.0 16.0 24.0 32.0 40.0
Cash
Utilities
Telecommunication Services
Materials
Information Technology
Industrials
Health Care
Financials
Energy
Consumer Staples
Consumer Discretionary
1.0
0.0
0.9
1.6
32.4
24.6
12.7
7.2
3.9
3.8
11.9
0.0
0.2
0.8
5.4
25.9
14.7
21.7
7.6
4.7
3.9
15.2
Distribution of Market Capitalization (%)
TimesSquare Small Cap Growth Russell 2000 Growth Index
0.0
50.0
100.0
150.0
$5 Bil - $20 Bil
$0 - $5 Bil
Cash
0.7
99.3
0.03.6
95.5
1.0
Manager EvaluationTimesSquare Small Cap Growth vs. Russell 2000 Growth IndexAs of September 30, 2014
36

Historical Performance
Buy and Hold Attribution
Risk and Return (Oct - 2009 - Sep - 2014)Three Year Rolling Percentile Ranking
Quarter
YearTo
Date1
Year3
Years5
Years10
Years 2013 2012 2011 2010 2009 2008 2007 2006 2005 2004
Morgan Stanley International Equity -5.0 -0.8 4.7 14.5 7.4 6.5 20.4 19.6 -7.6 6.1 21.6 -33.1 9.8 22.5 6.5 20.0
MSCI EAFE Index -5.9 -1.4 4.3 13.6 6.6 6.3 22.8 17.3 -12.1 7.8 31.8 -43.4 11.2 26.3 13.5 20.2
International Equity Peer Group Median -5.8 -1.7 4.3 13.6 6.8 6.6 20.8 18.4 -13.7 11.6 33.5 -44.4 11.9 25.2 15.0 18.5
Morgan Stanley International Equity Rank 27 36 43 33 38 55 54 35 10 88 92 1 66 76 100 38
5.6
6.4
7.2
8.0
8.8
Re
turn
(%)
13.2 13.8 14.4 15.0 15.6 16.2 16.8 17.4Risk (Standard Deviation %)
MSCI EAFE Index
Morgan Stanley International Equity
Morgan Stanley International Equity MSCI EAFE Index
0
25
50
75
100
Re
turn
Pe
rce
nti
le R
an
k
12/04 12/05 12/06 12/07 12/08 12/09 12/10 12/11 12/12 9/14
Average Active Weight
0.0 15.0 30.0-15.0
Utilities
Telecommunication ServicesMaterials
Information Technology
Industrials
Health CareFinancials
Energy
Consumer StaplesConsumer Discretionary
Cash
-3.9
-3.30.7
2.2
-5.6
3.7-7.1
0.8
13.6
-3.22.1
Allocation(Total: 0.3)
0.0 0.2 0.4-0.2-0.4
0.0
0.00.0
0.1
0.1
0.2-0.1
0.0
-0.2
0.10.1
Stock(Total: 0.6)
0.0 0.5 1.0-0.5-1.0
0.0
0.1-0.2
0.1
0.1
0.10.0
0.1
0.5
-0.10.0
Morgan Stanley International Equity
0.0 0.3 0.6 0.9-0.3-0.6
0.0
0.0-0.3
0.2
0.1
0.3-0.1
0.1
0.4
0.00.1
Manager EvaluationMorgan Stanley International Equity vs. MSCI EAFE IndexAs of September 30, 2014
Differences between the manager return and the attribution return are due primarily to the effects of fees and portfolio trading.
37

Total Attribution
0.0 0.1 0.2 0.3 0.4 0.5 0.6 0.7 0.8-0.1-0.2-0.3-0.4-0.5
Pacific
Other
North America
Middle East
Europe ex EMU
EMU
EM Asia
Cash
-0.2
0.0
-0.1
0.0
0.5
0.5
0.0
0.1
Performance Attribution
Average Active Weight
0.0 10.0 20.0-10.0-20.0
Pacific
Other
North America
Middle East
Europe ex EMU
EMU
EM Asia
Cash
-10.3
-0.3
1.5
-0.5
11.9
-5.6
1.4
2.1
Allocation(Total: 0.0)
0.0 0.2 0.4-0.2-0.4-0.6
-0.2
0.0
-0.1
0.0
0.0
0.2
0.0
0.1
Stock(Total: 0.9)
0.0 0.2 0.4 0.6 0.8
0.1
0.0
0.0
0.0
0.5
0.3
0.0
0.0
Manager EvaluationMorgan Stanley International Equity vs. MSCI EAFE Index1 Quarter Ending September 30, 2014
38

Top Ten Equity Holdings
PortfolioWeight
(%)
BenchmarkWeight
(%)
ActiveWeight
(%)
QuarterlyReturn
(%)
British American Tobacco PLC 4.7 0.8 3.9 -3.8
Reckitt Benckiser Group PLC 4.6 0.4 4.2 0.6
Nestle SA, Cham Und Vevey 4.5 1.8 2.7 -5.1
Sanofi 4.4 1.0 3.4 6.5
Unilever NV 4.4 0.5 3.9 -8.1
Novartis AG 3.6 1.7 1.9 4.2
Roche Holding AG 3.2 1.6 1.5 -0.7
Diageo PLC 2.8 0.6 2.2 -7.6
SAP AG Systeme Anwendungen 2.5 0.5 1.9 -6.6
Toyota Motor Corp 2.4 1.3 1.2 -0.9
% of Portfolio 37.0 10.3
Portfolio Characteristics
Portfolio Benchmark
Wtd. Avg. Mkt. Cap ($M) 79,836 64,782
Median Mkt. Cap ($M) 30,670 8,932
Price/Earnings ratio 17.5 15.5
Price/Book ratio 2.7 2.1
5 Yr. EPS Growth Rate (%) 7.1 13.5
Current Yield (%) 3.0 3.3
Debt to Equity 1.2 1.2
Number of Stocks 71 901
Beta (5 Years, Monthly) 0.89 1.00
Consistency (5 Years, Monthly) 48.33 1.00
Sharpe Ratio (5 Years, Monthly) 0.55 0.46
Information Ratio (5 Years, Monthly) 0.17 -
Up Market Capture (5 Years, Monthly) 93.77 -
Down Market Capture (5 Years, Monthly) 88.19 -
Sector Weights (%)
Morgan Stanley International Equity MSCI EAFE Index
0.0 6.0 12.0 18.0 24.0 30.0
Cash
Utilities
Telecommunication Services
Materials
Information Technology
Industrials
Health Care
Financials
Energy
Consumer Staples
Consumer Discretionary
2.4
0.0
1.6
7.7
7.0
6.9
14.7
18.5
7.6
24.4
9.1
0.0
3.9
4.9
7.7
4.7
12.5
11.2
25.7
6.9
10.9
11.6
Distribution of Market Capitalization (%)
Morgan Stanley International Equity MSCI EAFE Index
0.0
15.0
30.0
45.0
60.0
>$75 Bil $20 Bil - $75 Bil
$5 Bil - $20 Bil
$0 - $5 Bil
Cash
28.5
40.8
26.3
4.4
0.0
36.1 36.8
23.7
1.02.4
Manager EvaluationMorgan Stanley International Equity vs. MSCI EAFE IndexAs of September 30, 2014
39

Morgan StanleyInternational Equity MSCI EAFE Index
Australia 2.0 7.5
Hong Kong 0.6 2.9
Japan 18.9 21.0
New Zealand 0.0 0.1
Singapore 0.0 1.5
Pacific 21.5 33.1
Austria 0.0 0.2
Belgium 0.0 1.3
Finland 0.0 0.9
France 10.5 9.4
Germany 7.9 8.7
Ireland 0.9 0.3
Italy 1.0 2.4
Netherlands 5.3 3.0
Portugal 0.0 0.2
Spain 0.0 3.6
EMU 25.6 30.0
Denmark 0.0 1.6
Norway 0.0 0.8
Sweden 2.4 3.1
Switzerland 15.7 9.2
United Kingdom 29.8 21.4
Europe ex EMU 47.9 36.1
Canada 1.4 0.0
United States 0.0 0.0
Israel 0.0 0.6
Middle East 0.0 0.6
Developed Markets 96.3 99.7
Morgan StanleyInternational Equity MSCI EAFE Index
Brazil 0.0 0.0
Cayman Islands 0.0 0.0
Chile 0.0 0.0
Colombia 0.0 0.0
Mexico 0.0 0.0
Peru 0.0 0.0
Virgin Islands 0.0 0.0
EM Latin America 0.0 0.0
China 1.3 0.0
India 0.0 0.0
Indonesia 0.0 0.0
Korea 0.0 0.0
Malaysia 0.0 0.0
Philippines 0.0 0.0
Taiwan 0.0 0.0
Thailand 0.0 0.0
EM Asia 1.3 0.0
Czech Republic 0.0 0.0
Egypt 0.0 0.0
Greece 0.0 0.0
Hungary 0.0 0.0
Poland 0.0 0.0
Qatar 0.0 0.0
Russia 0.0 0.0
South Africa 0.0 0.0
Turkey 0.0 0.0
United Arab Emirates 0.0 0.0
EM Europe + Middle East + Africa 0.0 0.0
Emerging Markets 1.3 0.0
Frontier Markets 0.0 0.0
Cash 2.4 0.0
Other 0.0 0.3
Total 100.0 100.0
Manager EvaluationMorgan Stanley International Equity vs. MSCI EAFE IndexAs of September 30, 2014
40

Historical Performance
Buy and Hold Attribution
Risk and Return (Oct - 2009 - Sep - 2014)Three Year Rolling Percentile Ranking
Quarter
YearTo
Date1
Year3
Years5
Years10
Years 2013 2012 2011 2010 2009 2008 2007 2006 2005 2004
Morgan Stanley Emerging Markets -3.5 1.9 3.7 7.7 4.8 10.4 -0.8 20.2 -18.4 18.5 69.5 -56.4 41.6 38.0 34.5 24.1
MSCI Emerging Markets Index -3.5 2.4 4.3 7.2 4.4 10.7 -2.6 18.2 -18.4 18.9 78.5 -53.3 39.4 32.2 34.0 25.6
Emerging Markets Equity Peer Group Median -3.7 2.2 4.4 8.1 4.5 10.0 -1.1 19.5 -19.2 19.2 74.0 -54.5 37.4 32.3 32.9 24.9
Morgan Stanley Emerging Markets Rank 44 57 61 59 45 42 47 39 41 55 69 71 25 16 41 60
3.6
4.0
4.4
4.8
5.2
5.6
Re
turn
(%)
15.0 15.5 16.0 16.5 17.0 17.5 18.0 18.5Risk (Standard Deviation %)
MSCI Emerging Markets Index
Morgan Stanley Emerging Markets
Morgan Stanley Emerging Markets MSCI Emerging Markets Index
0
25
50
75
100
Re
turn
Pe
rce
nti
le R
an
k
12/04 12/05 12/06 12/07 12/08 12/09 12/10 12/11 12/12 9/14
Average Active Weight
0.0 4.0 8.0-4.0-8.0-12.0
Utilities
Telecommunication ServicesMaterials
Information Technology
Industrials
Health CareFinancials
Energy
Consumer StaplesConsumer Discretionary
Cash
-3.5
2.0-5.1
0.4
1.5
2.00.9
-4.4
1.3
2.52.3
Allocation(Total: 0.9)
0.0 0.2 0.4-0.2-0.4
0.0
0.20.2
0.0
0.0
0.30.0
0.2
0.0
-0.10.1
Stock(Total: -0.8)
0.0 0.5 1.0-0.5-1.0
0.0
-0.50.2
-0.6
0.2
-0.2-0.3
0.4
0.0
0.20.0
Morgan Stanley Emerging Markets
0.0 0.5 1.0 1.5-0.5-1.0-1.5
0.0
-0.40.4
-0.6
0.2
0.1-0.3
0.5
0.0
0.10.1
Manager EvaluationMorgan Stanley Emerging Markets vs. MSCI Emerging Markets IndexAs of September 30, 2014
Differences between the manager return and the attribution return are due primarily to the effects of fees and portfolio trading.
41

Total Attribution
0.0 0.3 0.6 0.9 1.2 1.5 1.8 2.1-0.3-0.6-0.9-1.2-1.5-1.8-2.1
Pacific
Other
North America
Frontier Markets
Europe ex EMU
EMU
EM Latin America
EM Europe + Middle East + Africa
EM Asia
Cash
-0.1
-0.1
-0.1
0.2
-0.1
-1.0
0.8
0.2
0.4
0.1
Performance Attribution
Average Active Weight
0.0 5.0 10.0 15.0-5.0-10.0-15.0
Pacific
Other
North America
Frontier Markets
Europe ex EMU
EMU
EM Latin America
EM Europe + Middle East + Africa
EM Asia
Cash
-2.4
1.7
1.3
1.3
2.0
5.3
-0.1
-6.4
-5.0
2.3
Allocation(Total: -0.9)
0.0 0.5 1.0-0.5-1.0-1.5-2.0
-0.2
-0.1
0.0
0.2
-0.1
-1.0
0.0
0.3
-0.1
0.1
Stock(Total: 1.1)
0.0 0.4 0.8 1.2 1.6-0.4-0.8
0.1
0.0
-0.2
0.0
0.0
0.0
0.8
-0.1
0.5
0.0
Manager EvaluationMorgan Stanley Emerging Markets vs. MSCI Emerging Markets Index1 Quarter Ending September 30, 2014
42

Top Ten Equity Holdings
PortfolioWeight
(%)
BenchmarkWeight
(%)
ActiveWeight
(%)
QuarterlyReturn
(%)
Tencent Holdings LTD 2.5 1.9 0.5 -2.5
Taiwan Semiconductor Manufacturing 2.3 2.5 -0.2 -4.7
BRF - Brasil Foods S.A. 2.2 0.4 1.9 -1.1
Bank of China Ltd 2.2 0.9 1.3 0.1
Samsung Electronics Co Ltd 1.8 3.1 -1.3 -14.3
Cemex SAB de CV 1.6 0.4 1.2 -1.4
America Movil SA De CV, Mexico 1.6 1.1 0.5 22.4
Alfa SAB De CV 1.5 0.3 1.3 23.6
Naspers Ltd 1.5 1.1 0.4 -6.1
China Mobile Ltd 1.5 1.8 -0.3 21.0
% of Portfolio 18.7 13.5
Portfolio Characteristics
Portfolio Benchmark
Wtd. Avg. Mkt. Cap ($M) 31,729 38,575
Median Mkt. Cap ($M) 9,106 5,444
Price/Earnings ratio 14.4 11.9
Price/Book ratio 2.6 2.1
5 Yr. EPS Growth Rate (%) 16.6 15.5
Current Yield (%) 2.2 2.8
Debt to Equity 1.0 0.9
Number of Stocks 155 834
Beta (5 Years, Monthly) 0.90 1.00
Consistency (5 Years, Monthly) 51.67 1.00
Sharpe Ratio (5 Years, Monthly) 0.36 0.32
Information Ratio (5 Years, Monthly) 0.03 -
Up Market Capture (5 Years, Monthly) 91.56 -
Down Market Capture (5 Years, Monthly) 88.50 -
Sector Weights (%)
Morgan Stanley Emerging Markets MSCI Emerging Markets Index
0.0 8.0 16.0 24.0 32.0 40.0
Cash
Utilities
Telecommunication Services
Materials
Information Technology
Industrials
Health Care
Financials
Energy
Consumer Staples
Consumer Discretionary
1.9
0.2
8.5
4.0
15.1
8.0
2.9
30.5
7.9
9.6
11.5
0.0
3.5
7.7
8.3
16.7
6.6
2.1
27.5
10.2
8.3
8.9
Distribution of Market Capitalization (%)
Morgan Stanley Emerging Markets MSCI Emerging Markets Index
0.0
15.0
30.0
45.0
60.0
>$75 Bil $20 Bil - $75 Bil
$5 Bil - $20 Bil
$0 - $5 Bil
Cash
17.5
28.0
38.6
15.8
0.0
13.4
26.5
38.9
19.2
1.9
Manager EvaluationMorgan Stanley Emerging Markets vs. MSCI Emerging Markets IndexAs of September 30, 2014
43

Morgan StanleyEmerging Markets
MSCI EmergingMarkets Index
Australia 0.0 0.0
Hong Kong 3.1 6.4
Japan 0.2 0.0
New Zealand 0.0 0.0
Singapore 0.5 0.1
Pacific 3.8 6.5
Austria 2.3 0.0
Belgium 0.0 0.0
Finland 0.0 0.0
France 0.0 0.0
Germany 0.0 0.0
Ireland 0.0 0.0
Italy 0.0 0.0
Netherlands 0.5 0.0
Portugal 0.8 0.0
Spain 0.0 0.0
EMU 3.5 0.0
Denmark 0.0 0.0
Norway 0.0 0.0
Sweden 0.0 0.0
Switzerland 1.1 0.0
United Kingdom 0.8 0.0
Europe ex EMU 1.9 0.0
Canada 0.0 0.0
United States 1.5 0.1
Israel 0.0 0.0
Middle East 0.0 0.0
Developed Markets 10.7 6.6
Morgan StanleyEmerging Markets
MSCI EmergingMarkets Index
Brazil 8.4 10.3
Cayman Islands 0.0 0.0
Chile 0.6 1.5
Colombia 2.8 1.0
Mexico 7.7 5.4
Peru 1.2 0.3
Virgin Islands 0.0 0.0
EM Latin America 20.7 18.5
China 10.1 12.7
India 9.1 7.1
Indonesia 1.2 2.7
Korea 14.5 15.0
Malaysia 2.4 3.9
Philippines 3.8 1.2
Taiwan 8.0 12.0
Thailand 3.6 2.4
EM Asia 52.7 56.9
Czech Republic 1.1 0.2
Egypt 0.0 0.3
Greece 0.0 0.7
Hungary 0.0 0.2
Poland 3.3 1.7
Qatar 0.5 0.6
Russia 1.0 4.6
South Africa 5.3 7.4
Turkey 0.0 1.6
United Arab Emirates 0.0 0.6
EM Europe + Middle East + Africa 11.0 17.9
Emerging Markets 84.4 93.4
Frontier Markets 1.3 0.0
Cash 1.9 0.0
Other 1.6 0.0
Total 100.0 100.0
Manager EvaluationMorgan Stanley Emerging Markets vs. MSCI Emerging Markets IndexAs of September 30, 2014
44

Historical Performance
Three Year Rolling Percentile Ranking Risk and Return (Oct-2009 - Sep-2014)
Historical Statistics (Oct-2009 - Sep-2014)
Quarter
YearTo
Date1
Year3
Years5
Years10
Years 2013 2012 2011 2010 2009 2008 2007 2006 2005 2004
Income Research -0.1 2.5 2.5 2.9 4.0 4.9 -0.9 5.9 5.6 6.2 14.4 0.8 7.4 4.5 2.8 3.7
Barclays Intermediate U.S. Government/Credit 0.0 2.2 2.2 2.0 3.4 4.0 -0.9 3.9 5.8 5.9 5.2 5.1 7.4 4.1 1.6 3.0
Intermediate Duration Fixed Income Peer Group Median -0.1 2.6 3.0 2.9 4.5 4.6 -0.6 5.1 4.6 6.1 9.8 -1.8 5.5 4.0 1.5 2.6
Income Research Rank 40 63 65 51 60 25 61 41 28 49 24 29 9 14 1 19
2.5
3.0
3.5
4.0
4.5
5.0
Re
turn
(%)
2.1 2.2 2.3 2.4 2.5Risk (Standard Deviation %)
Barclays Intermediate U.S. Government/Credit
Income Research
Income Research
Barclays Intermediate U.S. Government/Credit
0
25
50
75
100
Re
turn
Pe
rce
nti
le R
an
k
12/04 12/05 12/06 12/07 12/08 12/09 12/10 12/11 12/12 9/14
ReturnStandardDeviation
ExcessReturn Alpha Beta
SharpeRatio
TrackingError
InformationRatio
DownsideRisk Consistency
InceptionDate
Income Research 4.0 2.3 3.9 0.8 0.9 1.7 0.7 0.8 1.0 65.0 17y 8m
Barclays Intermediate U.S. Government/Credit 3.4 2.4 3.3 0.0 1.0 1.4 0.0 N/A 1.0 0.0 17y 8m
90 Day U.S. Treasury Bill 0.1 0.0 0.0 0.1 0.0 N/A 2.4 -1.4 0.0 20.0 17y 8m
Manager EvaluationIncome Research vs. Barclays Intermediate U.S. Government/CreditAs of September 30, 2014
45

Credit Quality Distribution (%)
Income Research
Barclays Intermediate U.S. Government/Credit
0.0
25.0
50.0
75.0
100.0
AAA AA ABBB BB B
Below
B
Not Rat
ed
64.9
6.6
14.3 14.2
0.0 0.0 0.0 0.0
51.4
9.5
17.720.9
0.0 0.0 0.0 0.6
Portfolio Characteristics
Portfolio Benchmark
Effective Duration 3.7 3.9
Avg. Maturity 4.3 4.2
Avg. Quality AA- AA
Yield To Maturity (%) 2.0 1.7
Sector Distribution (%)
Income Research
Barclays Intermediate U.S. Government/Credit
0.0
25.0
50.0
75.0
100.0
Treasu
ries
TIPS
Agenc
ies
Credi
t
Hig
h Yie
ldM
BSABS
Non-U
S
Emer
ging
Munic
ipal
s
Cas
h
Oth
er
CMBS
56.4
0.06.0
24.5
0.0 0.0 0.0
10.6
2.4 0.0 0.0 0.0 0.0
23.6
0.0 0.8
37.4
0.03.7
7.6
0.0 0.0 2.4 0.6
9.414.6
Maturity Distribution (%)
Income Research
Barclays Intermediate U.S. Government/Credit
0.0
15.0
30.0
45.0
60.0
< 1 Yr
1 < 3 Yrs
3 < 5 Yrs
5 <
10 Yrs
10 <
20 Yrs
> 20
Yrs
0.0
41.7
26.4
31.9
0.0 0.00.0
37.0
30.4 30.6
2.00.0
Manager EvaluationIncome Research vs. Barclays Intermediate U.S. Government/CreditAs of September 30, 2014
46

Historical Performance
Three Year Rolling Percentile Ranking Risk and Return (Oct-2009 - Sep-2014)
Historical Statistics (Oct-2009 - Sep-2014)
Quarter
YearTo
Date1
Year3
Years5
Years10
Years 2013 2012 2011 2010 2009 2008 2007 2006 2005 2004
Penn Capital -2.2 2.0 5.6 8.4 8.9 N/A 5.9 13.3 4.2 15.0 37.5 -21.0 1.8 8.9 N/A N/A
BofA Merrill Lynch US High Yield, Cash Pay Index -1.9 3.5 7.1 10.9 10.3 8.1 7.4 15.4 4.5 15.2 56.3 -26.2 2.2 11.6 2.8 10.8
High Yield Fixed Income Peer Group Median -1.9 3.3 6.9 10.8 10.0 7.6 7.4 15.3 4.0 14.7 47.3 -24.3 2.6 10.7 3.1 10.4
Penn Capital Rank 81 93 88 93 84 N/A 78 80 46 41 79 25 74 84 N/A N/A
6.0
8.0
10.0
12.0
14.0
Re
turn
(%)
4.5 4.8 5.1 5.4 5.7 6.0 6.3 6.6Risk (Standard Deviation %)
BofA Merrill Lynch US High Yield, Cash Pay Index
Penn Capital
Penn Capital
BofA Merrill Lynch US High Yield, Cash Pay Index
0
25
50
75
100
Re
turn
Pe
rce
nti
le R
an
k
12/04 12/05 12/06 12/07 12/08 12/09 12/10 12/11 12/12 9/14
ReturnStandardDeviation
ExcessReturn Alpha Beta
SharpeRatio
TrackingError
InformationRatio
DownsideRisk Consistency
InceptionDate
Penn Capital 8.9 5.2 8.7 0.3 0.8 1.7 1.5 -0.9 2.4 35.0 9y 3m
BofA Merrill Lynch US High Yield, Cash Pay Index 10.3 6.0 10.1 0.0 1.0 1.7 0.0 N/A 2.9 0.0 9y 3m
90 Day U.S. Treasury Bill 0.1 0.0 0.0 0.1 0.0 N/A 6.0 -1.7 0.0 20.0 9y 3m
Manager EvaluationPenn Capital vs. BofA Merrill Lynch US High Yield, Cash Pay IndexAs of September 30, 2014
47

Credit Quality Distribution (%)
Penn Capital
BofA Merrill Lynch US High Yield, Cash Pay Index
0.0
25.0
50.0
75.0
100.0
AAA AA ABBB BB B
Below
B
Not Rat
ed
0.0 0.0 0.0 0.0
41.8 41.0
17.0
0.20.0 0.0 0.0 0.7
35.0
64.2
0.0 0.0
Portfolio Characteristics
Portfolio Benchmark
Effective Duration 4.6 4.5
Avg. Maturity 6.6 6.6
Avg. Quality B B+
Yield To Maturity (%) 6.4 6.2
Sector Distribution (%)
Penn Capital
BofA Merrill Lynch US High Yield, Cash Pay Index
0.0
50.0
100.0
150.0
Treasu
ries
TIPS
Agenc
ies
Credi
t
Hig
h Yie
ldM
BSABS
Non-U
S
Emer
ging
Munic
ipal
s
Cas
h
Oth
er
CMBS
0.0 0.0 0.0 0.0
100.0
0.0 0.0 0.0 0.0 0.0 0.0 0.0 0.00.0 0.0 0.0 0.0
96.6
0.0 0.0 0.0 0.0 0.0 3.3 0.1 0.0
Maturity Distribution (%)
Penn Capital
BofA Merrill Lynch US High Yield, Cash Pay Index
0.0
50.0
100.0
150.0
< 1 Yr
1 < 3 Yrs
3 < 5 Yrs
5 <
10 Yrs
10 <
20 Yrs
> 20
Yrs
0.08.5
24.2
61.3
4.1 1.93.5 1.8
15.8
76.0
2.9 0.0
Manager EvaluationPenn Capital vs. BofA Merrill Lynch US High Yield, Cash Pay IndexAs of September 30, 2014
48

Historical Performance
Three Year Rolling Percentile Ranking Risk and Return (Apr-2010 - Sep-2014)
Historical Statistics (Apr-2010 - Sep-2014)
Quarter
YearTo
Date1
Year3
Years5
Years10
Years 2013 2012 2011 2010 2009 2008 2007 2006 2005 2004
Loomis Credit Asset Fund -0.6 3.9 6.3 8.8 N/A N/A 4.4 14.2 3.3 N/A N/A N/A N/A N/A N/A N/A
50% BC Credit / 25% S&P LSTA / 25% BY High Yield -0.6 4.2 6.1 6.8 7.3 6.2 2.1 11.0 5.8 10.6 34.3 -15.9 3.6 6.8 3.0 6.7
Alternative Credit Focus Funds Peer Group Median -0.5 1.8 3.6 4.1 5.2 4.3 0.9 8.6 1.3 8.1 21.9 -12.7 4.6 5.1 1.4 6.1
Loomis Credit Asset Fund Rank 55 13 9 1 N/A N/A 15 6 22 N/A N/A N/A N/A N/A N/A N/A
5.4
6.3
7.2
8.1
9.0
Re
turn
(%)
2.4 2.7 3.0 3.3 3.6 3.9 4.2 4.5 4.8 5.1Risk (Standard Deviation %)
50% BC Credit / 25% S&P LSTA / 25% BY High Yield
Loomis Credit Asset Fund
Loomis Credit Asset Fund
50% BC Credit / 25% S&P LSTA / 25% BY High Yield
0
25
50
75
100
Re
turn
Pe
rce
nti
le R
an
k
12/04 12/05 12/06 12/07 12/08 12/09 12/10 12/11 12/12 9/14
ReturnStandardDeviation
ExcessReturn Alpha Beta
SharpeRatio
TrackingError
InformationRatio
DownsideRisk Consistency
InceptionDate
Loomis Credit Asset Fund 7.6 4.3 7.4 -0.4 1.2 1.7 1.8 0.5 1.7 66.7 4y 6m
50% BC Credit / 25% S&P LSTA / 25% BY High Yield 6.7 3.3 6.5 0.0 1.0 2.0 0.0 N/A 1.1 0.0 4y 6m
90 Day U.S. Treasury Bill 0.1 0.0 0.0 0.1 0.0 N/A 3.3 -2.0 0.0 16.7 4y 6m
Manager EvaluationLoomis Credit Asset Fund vs. 50% BC Credit / 25% S&P LSTA / 25% BY High YieldAs of September 30, 2014
49

Credit Quality Distribution (%)
Loomis Credit Asset Fund
0.0
8.0
16.0
24.0
32.0
AAA AA ABBB BB B
Below
B
Not Rat
ed
11.2
2.5
14.1
23.023.9
22.1
3.2
0.0
Portfolio Characteristics
Portfolio
Effective Duration 4.2
Avg. Maturity 9.8
Avg. Quality BBB-
Yield To Maturity (%) 4.6
Sector Distribution (%)
Loomis Credit Asset Fund
0.0
15.0
30.0
45.0
Treasu
ries
TIPS
Agenc
ies
Credi
t
Hig
h Yie
ldM
BSABS
Non-U
S
Emer
ging
Munic
ipal
s
Cas
h
Oth
er
CMBS
2.30.0 0.1
21.422.7
4.2 4.1
0.0 0.0 0.0
10.8
30.7
3.7
Maturity Distribution (%)
Loomis Credit Asset Fund
0.0
15.0
30.0
45.0
60.0
< 1 Yr
1 < 3 Yrs
3 < 5 Yrs
5 <
10 Yrs
10 <
20 Yrs
> 20
Yrs
13.8 13.8
21.0
44.0
7.4
0.0
Manager EvaluationLoomis Credit Asset FundAs of September 30, 2014
50

Historical Performance
Three Year Rolling Percentile Ranking Risk and Return (Oct-2009 - Sep-2014)
Historical Statistics (Oct-2009 - Sep-2014)
Quarter
YearTo
Date1
Year3
Years5
Years10
Years 2013 2012 2011 2010 2009 2008 2007 2006 2005 2004
Brandywine Global Opportunistic Fixed Income -2.0 6.2 5.9 5.6 7.6 N/A -3.5 14.1 8.0 13.9 20.5 -8.5 10.6 8.4 -0.9 N/A
Citigroup World Government Bond -3.8 1.0 -0.1 -0.5 1.6 4.1 -4.0 1.6 6.4 5.2 2.6 10.9 11.0 6.1 -6.9 10.3
Global Fixed Income Peer Group Median -1.8 2.5 3.3 2.9 4.2 4.9 -1.7 7.5 3.7 6.1 12.0 -2.1 7.7 5.7 0.7 9.5
Brandywine Global Opportunistic Fixed Income Rank 54 9 21 20 3 N/A 69 15 12 10 25 74 18 21 55 N/A
-6.0
0.0
6.0
12.0
18.0
Re
turn
(%)
5.5 5.6 5.7 5.8Risk (Standard Deviation %)
Citigroup World Government Bond
Brandywine Global Opportunistic Fixed Income
Brandywine Global Opportunistic Fixed Income
Citigroup World Government Bond
0
25
50
75
100
Re
turn
Pe
rce
nti
le R
an
k
12/04 12/05 12/06 12/07 12/08 12/09 12/10 12/11 12/12 9/14
ReturnStandardDeviation
ExcessReturn Alpha Beta
SharpeRatio
TrackingError
InformationRatio
DownsideRisk Consistency
InceptionDate
Brandywine Global Opportunistic Fixed Income 7.6 5.7 7.5 6.2 0.8 1.3 3.3 1.8 1.8 80.0 9y 9m
Citigroup World Government Bond 1.6 5.6 1.6 0.0 1.0 0.3 0.0 N/A 3.0 0.0 9y 9m
90 Day U.S. Treasury Bill 0.1 0.0 0.0 0.1 0.0 N/A 5.6 -0.3 0.0 50.0 9y 9m
Manager EvaluationBrandywine Global Opportunistic Fixed Income vs. Citigroup World Government BondAs of September 30, 2014
51

Credit Quality Distribution (%)
Brandywine Global Opportunistic Fixed Income
Citigroup World Government Bond
0.0
25.0
50.0
75.0
100.0
AAA AA ABBB BB B
Below
B
Not Rat
ed
18.1
67.1
2.5
12.5
0.0 0.0 0.0 0.0
18.723.4
27.7
19.2
8.01.7 1.1 0.2
Portfolio Characteristics
Portfolio Benchmark
Effective Duration 5.7 7.1
Avg. Maturity 12.2 8.4
Avg. Quality A AA
Yield To Maturity (%) 3.8 1.3
Sector Distribution (%)
Brandywine Global Opportunistic Fixed Income
Citigroup World Government Bond
0.0
25.0
50.0
75.0
100.0
Treasu
ries
TIPS
Agenc
ies
Credi
t
Hig
h Yie
ldM
BSABS
Non-U
S
Emer
ging
Munic
ipal
s
Cas
h
Oth
er
CMBS
29.7
0.0 0.0 0.0 0.0 0.0 0.0
70.3
0.0 0.0 0.0 0.0 0.0
10.1
0.0 0.06.0
0.13.8
0.0
58.7
15.1
0.84.6
0.9 0.0
Maturity Distribution (%)
Brandywine Global Opportunistic Fixed Income
Citigroup World Government Bond
0.0
15.0
30.0
45.0
< 1 Yr
1 < 3 Yrs
3 < 5 Yrs
5 <
10 Yrs
10 <
20 Yrs
> 20
Yrs
0.0
27.5
19.0
27.426.2
0.0
5.8
18.8
7.6
31.3
7.3
29.3
Manager EvaluationBrandywine Global Opportunistic Fixed Income vs. Citigroup World Government BondAs of September 30, 2014
52

Historical Performance
Three Year Rolling Percentile Ranking Risk and Return (Jul-2010 - Sep-2014)
Historical Statistics (Jul-2010 - Sep-2014)
Quarter
YearTo
Date1
Year3
Years5
Years10
Years 2013 2012 2011 2010 2009 2008 2007 2006 2005 2004
Pictet Emerging Local Currency Debt Fund -5.5 -1.0 -2.5 0.8 N/A N/A -10.3 15.3 -2.3 N/A N/A N/A N/A N/A N/A N/A
JPM GBI-EM Global Diversified -5.7 0.0 -1.5 2.2 4.4 8.8 -9.0 16.8 -1.8 15.7 22.0 -5.2 18.1 15.2 6.3 23.0
Emerging Markets LC Peer Group Median -5.6 -0.3 -1.9 1.9 3.8 N/A -10.4 16.7 -3.3 14.3 24.1 N/A N/A N/A N/A N/A
Pictet Emerging Local Currency Debt Fund Rank 43 72 70 85 N/A N/A 49 70 38 N/A N/A N/A N/A N/A N/A N/A
0.0
1.5
3.0
4.5
6.0
Re
turn
(%)
9.2 9.4 9.6 9.8 10.0 10.2 10.4 10.6Risk (Standard Deviation %)
JPM GBI-EM Global Diversified
Pictet Emerging Local Currency Debt Fund
Pictet Emerging Local Currency Debt Fund
JPM GBI-EM Global Diversified
0
25
50
75
100
Re
turn
Pe
rce
nti
le R
an
k
12/04 12/05 12/06 12/07 12/08 12/09 12/10 12/11 12/12 9/14
ReturnStandardDeviation
ExcessReturn Alpha Beta
SharpeRatio
TrackingError
InformationRatio
DownsideRisk Consistency
InceptionDate
Pictet Emerging Local Currency Debt Fund 2.1 9.6 2.5 -1.3 0.9 0.3 1.0 -1.7 6.0 11.8 4y 3m
JPM GBI-EM Global Diversified 3.7 10.2 4.1 0.0 1.0 0.4 0.0 N/A 6.1 0.0 4y 3m
90 Day U.S. Treasury Bill 0.1 0.0 0.0 0.1 0.0 N/A 10.2 -0.4 0.0 47.1 4y 3m
Manager EvaluationPictet Emerging Local Currency Debt Fund vs. JPM GBI-EM Global DiversifiedAs of September 30, 2014
53

Credit Quality Distribution (%)
Pictet Emerging Local Currency Debt Fund
JPM GBI-EM Global Diversified
0.0
20.0
40.0
60.0
80.0
AAA AA ABBB BB B
Below
B
Not Rat
ed
0.0 0.1
31.2
53.0
15.7
0.0 0.0 0.00.2 0.1
26.2
49.3
13.5
0.0 0.8
9.9
Portfolio Characteristics
Portfolio Benchmark
Effective Duration 5.2 4.8
Avg. Maturity 7.7 7.0
Avg. Quality BBB BBB+
Yield To Maturity (%) 6.6 6.7
Country/Region Distribution (%)
Pictet Emerging Local Currency Debt Fund
JPM GBI-EM Global Diversified
0.0
15.0
30.0
45.0
60.0
Asia
Eastern
Europe
Latin
Americ
a
Africa
Oth
ers
24.7
34.1
29.3
11.9
0.0
23.3
30.5
24.2
12.010.0
Sector Distribution (%)
Pictet Emerging Local Currency Debt Fund
JPM GBI-EM Global Diversified
0.0
50.0
100.0
150.0
-50.0
Treasu
ries
Credi
t
Cas
h
100.0
0.0 0.0
90.1
-0.9
10.8
Manager EvaluationPictet Emerging Local Currency Debt Fund vs. JPM GBI-EM Global DiversifiedAs of September 30, 2014
54
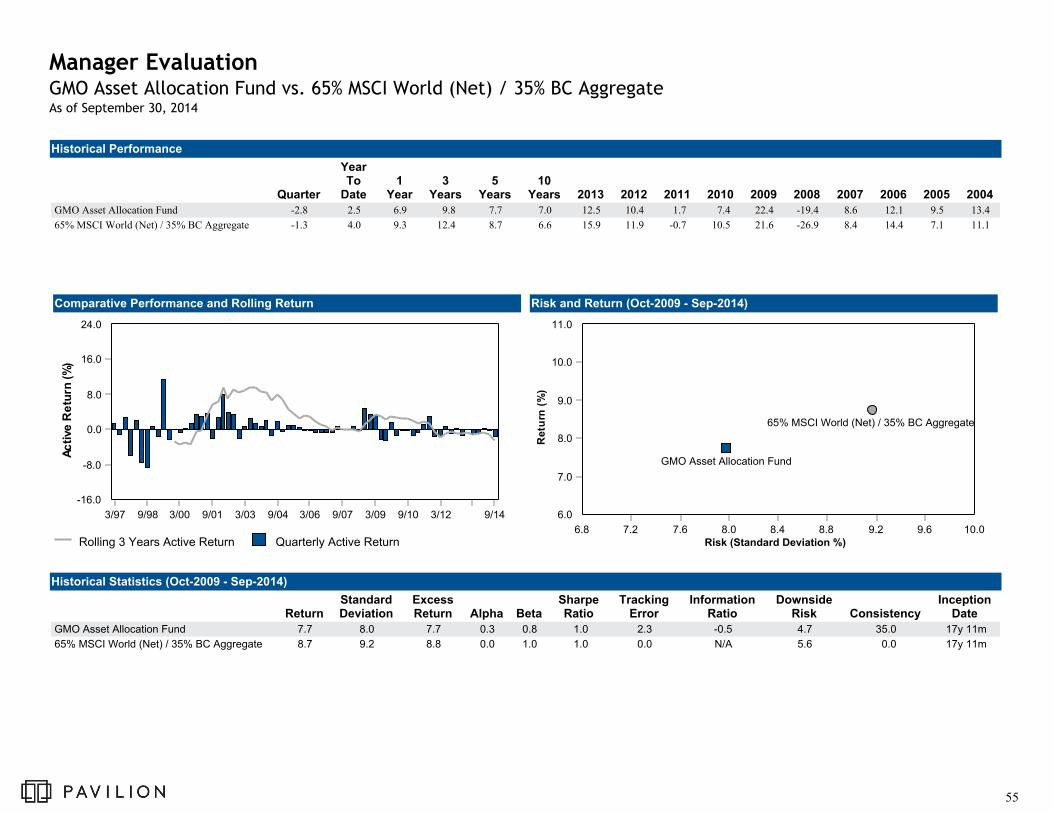
Historical Performance
Comparative Performance and Rolling Return Risk and Return (Oct-2009 - Sep-2014)
Historical Statistics (Oct-2009 - Sep-2014)
Quarter
YearTo
Date1
Year3
Years5
Years10
Years 2013 2012 2011 2010 2009 2008 2007 2006 2005 2004
GMO Asset Allocation Fund -2.8 2.5 6.9 9.8 7.7 7.0 12.5 10.4 1.7 7.4 22.4 -19.4 8.6 12.1 9.5 13.4
65% MSCI World (Net) / 35% BC Aggregate -1.3 4.0 9.3 12.4 8.7 6.6 15.9 11.9 -0.7 10.5 21.6 -26.9 8.4 14.4 7.1 11.1
6.0
7.0
8.0
9.0
10.0
11.0
Re
turn
(%)
6.8 7.2 7.6 8.0 8.4 8.8 9.2 9.6 10.0Risk (Standard Deviation %)
65% MSCI World (Net) / 35% BC Aggregate
GMO Asset Allocation Fund
Rolling 3 Years Active Return Quarterly Active Return
0.0
8.0
16.0
24.0
-8.0
-16.0
Ac
tive
Re
turn
(%)
3/97 9/98 3/00 9/01 3/03 9/04 3/06 9/07 3/09 9/10 3/12 9/14
ReturnStandardDeviation
ExcessReturn Alpha Beta
SharpeRatio
TrackingError
InformationRatio
DownsideRisk Consistency
InceptionDate
GMO Asset Allocation Fund 7.7 8.0 7.7 0.3 0.8 1.0 2.3 -0.5 4.7 35.0 17y 11m
65% MSCI World (Net) / 35% BC Aggregate 8.7 9.2 8.8 0.0 1.0 1.0 0.0 N/A 5.6 0.0 17y 11m
90 Day U.S. Treasury Bill 0.1 0.0 0.0 0.1 0.0 N/A 9.2 -1.0 0.0 25.0 17y 11m
Manager EvaluationGMO Asset Allocation Fund vs. 65% MSCI World (Net) / 35% BC AggregateAs of September 30, 2014
55

US Quality12.7%
US Opportunistic Value4.6%
Asset Backed Securities
Emerging Country Debt3.6%
Alpha Only11.8%
Cash and Cash Equivalents
4.7%
Manager EvaluationGMO Asset Allocation FundAs of September 30, 2014
17.3%
25.9%
8.0%6.2%
26.0%
16.5%
10.0%
15.0%
20.0%
25.0%
30.0%
Fund Composition Asset Class Weights
Europe Value20.0%
Other International Opportunistic Value
1.2%Japan4.7%Emerging Markets
8.0%Systematic Global Macro3.7%
Risk Premium2.5%
Developed Rates17.7%
Securities4.7%
6.2%
0.0%
5.0%
56

Historical Performance
Comparative Performance and Rolling Return Risk and Return (Oct-2009 - Sep-2014)
Historical Statistics (Oct-2009 - Sep-2014)
Quarter
YearTo
Date1
Year3
Years5
Years10
Years 2013 2012 2011 2010 2009 2008 2007 2006 2005 2004
PIMCO All Asset Fund I -2.9 3.8 5.2 8.0 7.5 6.4 0.8 15.4 2.4 13.7 23.0 -15.5 8.7 5.3 6.5 11.8
Barclays U.S. Treasury Inflation Notes: 1-10 Year -2.0 1.9 0.6 0.9 3.4 4.0 -5.6 5.0 8.9 5.2 12.0 -2.4 11.4 1.6 1.9 7.1
-4.0
0.0
4.0
8.0
12.0
16.0
Re
turn
(%)
2.1 2.8 3.5 4.2 4.9 5.6 6.3 7.0 7.7 8.4Risk (Standard Deviation %)
Barclays U.S. Treasury Inflation Notes: 1-10 Year
PIMCO All Asset Fund I
Rolling 3 Years Active Return Quarterly Active Return
0.0
8.0
16.0
24.0
-8.0
-16.0
Ac
tive
Re
turn
(%)
12/02 12/03 12/04 12/05 12/06 12/07 12/08 12/09 12/10 12/11 12/12 9/14
ReturnStandardDeviation
ExcessReturn Alpha Beta
SharpeRatio
TrackingError
InformationRatio
DownsideRisk Consistency
InceptionDate
PIMCO All Asset Fund I 7.5 6.6 7.5 4.4 0.9 1.1 5.6 0.7 3.7 80.0 12y 2m
Barclays U.S. Treasury Inflation Notes: 1-10 Year 3.4 3.8 3.4 0.0 1.0 0.9 0.0 N/A 2.7 0.0 12y 2m
90 Day U.S. Treasury Bill 0.1 0.0 0.0 0.1 0.0 N/A 3.8 -0.9 0.0 15.0 12y 2m
Manager EvaluationPIMCO All Asset Fund I vs. Barclays U.S. Treasury Inflation Notes: 1-10 YearAs of September 30, 2014
57

Manager EvaluationPIMCO All Asset Fund I Sector AllocationsAs of September 30, 2014
U.S. Equity Strategies
2.4%
Global Equity Strategies
24.0%
Inflation Related Strategies
10.9%
Alternative Strategies
14.9%
U.S. Core & Long Maturity Bond
Strategies15.3%
Credit Strategies11.5%
EM & Global Bond Strategies
20.8%
Short-Term Strategies
0.3%
58

Historical Performance
Comparative Performance and Rolling Return Risk and Return (Oct-2009 - Sep-2014)
Historical Statistics (Oct-2009 - Sep-2014)
Quarter
YearTo
Date1
Year3
Years5
Years10
Years 2013 2012 2011 2010 2009 2008 2007 2006 2005 2004
UBS Trumbull Property Fund 2.9 7.5 9.6 9.3 10.0 6.7 9.2 9.0 12.1 15.9 -22.9 -8.3 12.8 15.6 20.1 13.5
NCREIF Fund Index-Open End Diversified Core Equity 0.0 5.4 8.6 10.9 11.3 6.4 13.3 11.0 16.0 16.1 -30.7 -10.4 16.1 16.1 20.2 12.6
8.0
10.0
12.0
14.0
Re
turn
(%)
2.7 3.0 3.3 3.6 3.9 4.2 4.5 4.8Risk (Standard Deviation %)
NCREIF Fund Index-Open End Diversified Core Equity
UBS Trumbull Property Fund
Rolling 3 Years Active Return Quarterly Active Return
0.0
4.0
8.0
-4.0
-8.0
-12.0
Ac
tive
Re
turn
(%)
3/78 6/81 9/84 12/87 3/91 6/94 9/97 12/00 3/04 6/07 9/10 9/14
ReturnStandardDeviation
ExcessReturn Alpha Beta
SharpeRatio
TrackingError
InformationRatio
DownsideRisk Consistency
InceptionDate
UBS Trumbull Property Fund 10.0 3.2 9.6 2.1 0.7 3.0 2.0 -0.6 1.4 20.0 36y 9m
NCREIF Fund Index-Open End Diversified Core Equity 11.3 4.0 10.9 0.0 1.0 2.7 0.0 N/A 1.9 0.0 36y 9m
90 Day U.S. Treasury Bill 0.1 0.0 0.0 0.1 0.0 N/A 4.0 -2.7 0.0 10.0 36y 9m
Manager EvaluationUBS Trumbull Property Fund vs. NCREIF Fund Index-Open End Diversified Core EquityAs of September 30, 2014
59

Property Type
UBS Trumbull Property Fund NCREIF Property Index
0.0
15.0
30.0
45.0
60.0
Offi
ce
Apartm
ent
Ret
ail
Indus
trial
Oth
er
Hot
el
36.6
24.7 23.3
13.7
0.0 1.7
31.033.0
22.0
9.0
0.0
5.0
Portfolio Characteristics
Portfolio Benchmark
# Properties 198 7,170
# Investors 411 N/A
Total Fund Assets 15,400 395,434
Property Location
UBS Trumbull Property Fund NCREIF Property Index
0.0
15.0
30.0
45.0
60.0
East
Wes
t
South
Mid
wes
t
34.3 35.4
20.8
9.5
40.4
23.0
14.3
22.3
Manager EvaluationUBS Trumbull Property Fund vs. NCREIF Property IndexAs of September 30, 2014
60

Type City
Acquisition
Date
%
Occupancy Cost ($000)
Fair Market
Value ($000)
Office New York Jun-06 100% 664,900$ 664,900$
Office Boston Dec-11 89% 657,691$ 657,691$
Retail Cambridge May-89 96% 559,300$ 561,377$
Retail Dallas Dec-02 90% 505,000$ 505,000$
Apartments New York Jul-11 95% 463,000$ 463,000$
Office New York Jul-11 97% 275,213$ 457,308$
Retail Chicago Nov-13 95% 249,108$ 444,227$
Office New York Sep-14 92% 273,599$ 443,349$
Office Chicago Dec-11 100% 435,000$ 435,768$
As of September 30, 2014
20 Largest Investments
Manager EvaluationUBS Trumbull Property FundAs of September 30, 2014
Office Chicago Dec-11 100% 435,000$ 435,768$
Retail Emeryville Aug-14 99% 305,442$ 305,442$
Retail Montebello Dec-88 97% 281,000$ 281,000$
Office Washington May-06 80% 262,000$ 262,000$
Office Denver Jun-06 94% 250,000$ 250,000$
Office Seattle Oct-84 80% 250,000$ 250,000$
Apartments Brooklyn Dec-07 95% 240,000$ 240,000$
Office San Francisco Dec-85 89% 214,000$ 216,504$
Office Denver Apr-82 91% 213,000$ 213,000$
Office Pasadena May-84 97% 209,000$ 209,000$
Retail Millbury Sep-04 97% 190,800$ 190,800$
Apartments Arlington Mar-13 94% 66,628$ 188,953$
All other investments -- -- 10,688,765$ 10,692,363$
Total Properties 17,253,446$ 17,931,682$
61

Historical Performance
Comparative Performance and Rolling Return Risk and Return (Apr-2010 - Sep-2014)
Historical Statistics (Apr-2010 - Sep-2014)
Quarter
YearTo
Date1
Year3
Years5
Years10
Years 2013 2012 2011 2010 2009 2008 2007 2006 2005 2004
Wellington Diversified Inflation Hedges -8.0 -0.3 2.4 1.9 N/A N/A -3.9 5.2 -8.6 N/A N/A N/A N/A N/A N/A N/A
Wellington DIH Multi-Asset Inflation Index -8.1 -1.1 0.4 1.5 2.3 4.9 -2.1 2.3 -7.0 12.7 30.0 -32.7 25.8 14.1 19.7 16.0
0.0
0.8
1.6
2.4
3.2
Re
turn
(%)
13.2 13.8 14.4 15.0 15.6 16.2 16.8Risk (Standard Deviation %)
Wellington DIH Multi-Asset Inflation Index
Wellington Diversified Inflation Hedges
Rolling 3 Years Active Return Quarterly Active Return
0.0
2.0
4.0
-2.0
-4.0
Ac
tive
Re
turn
(%)
6/10 12/10 6/11 12/11 6/12 12/12 6/13 12/13 9/14
ReturnStandardDeviation
ExcessReturn Alpha Beta
SharpeRatio
TrackingError
InformationRatio
DownsideRisk Consistency
InceptionDate
Wellington Diversified Inflation Hedges 1.8 15.8 3.0 0.8 1.1 0.2 2.3 0.4 10.8 61.1 4y 6m
Wellington DIH Multi-Asset Inflation Index 1.0 14.2 2.0 0.0 1.0 0.1 0.0 N/A 9.9 0.0 4y 6m
90 Day U.S. Treasury Bill 0.1 0.0 0.0 0.1 0.0 N/A 14.2 -0.1 0.0 44.4 4y 6m
Manager EvaluationWellington Diversified Inflation Hedges vs. Wellington DIH Multi-Asset Inflation IndexAs of September 30, 2014
62

Manager EvaluationWellington Diversified Inflation Hedges Sector AllocationAs of September 30, 2014
Energy28.7%
TIPS8.1%
Emerging Markets
Inflation-Linked Bonds5.7%
Cash6.7%
3.9%5.3%
0.7%
0.0%
5.0%
10.0%
15.0%
20.0%
Fund Composition Fund Weights Relative to Benchmark
Energy29.6%
TIPS12.0%
Emerging Markets
Inflation-Linked Bonds3.1%
Cash0.7%
Metals & Mining3.0%
Agriculture5.1%
Enduring Assets11.7%
Precious Metals8.7%
Commodities22.4%
Global Inflation-Sensitive Equities
Commodities
Fixed Income & Cash
-9.9%
-20.0%
-15.0%
-10.0%
-5.0%
0.0%
Equities Fixed Income Commodities Cash
Metals & Mining7.3%
Agriculture4.7%
Enduring Assets5.2%
Precious Metals2.0%
Inflation Opportunities
5.1%
Commodities30.3%
63

Calendar Year Performance
64

YearTo
Date 2013 2012 2011 2010 2009 2008 2007 2006 2005
Total Composite 3.3 10.9 12.1 1.2 11.2 20.2 -20.2 10.7 11.8 5.6
Policy Benchmark 2.8 12.5 11.6 1.1 11.5 19.5 -20.6 8.3 13.0 5.7
Total Equity Composite 3.5 N/A N/A N/A N/A N/A N/A N/A N/A N/A
MSCI AC World Index 3.7 22.8 16.1 -7.3 12.7 34.6 -42.2 11.7 21.0 10.8
Domestic Equity Composite 5.4 (19) N/A N/A N/A N/A N/A N/A N/A N/A N/A
Russell 3000 Index 7.0 (8) 33.6 (40) 16.4 (26) 1.0 (16) 16.9 (39) 28.3 (59) -37.3 (38) 5.1 (62) 15.7 (31) 6.1 (63)
Broad Equity Peer Group Median 3.9 32.5 14.6 -2.1 16.2 29.6 -38.4 6.5 13.6 7.0
International Equity Composite -0.2 (39) N/A N/A N/A N/A N/A N/A N/A N/A N/A
MSCI AC World ex USA Index 0.0 (36) 15.3 (54) 16.8 (72) -13.7 (32) 11.2 (74) 41.4 (64) -45.5 (36) 16.7 (66) 26.7 (55) 16.6 (86)
International Equity Peer Group Median -0.8 15.6 18.5 -15.2 13.6 44.1 -47.0 18.3 27.0 19.7
Fixed Income Composite 3.0 (43) -1.7 (82) 10.9 (1) 3.8 (72) 8.7 (10) 18.9 (8) -3.4 (70) 6.4 (26) 5.6 (8) 2.8 (1)
Barclays Intermediate U.S. Government/Credit 2.2 (73) -0.9 (55) 3.9 (70) 5.8 (22) 5.9 (54) 5.2 (100) 5.1 (13) 7.4 (9) 4.1 (42) 1.6 (46)
Intermediate Duration Fixed Income Peer Group Median 2.6 -0.6 5.1 4.6 6.1 9.8 -1.8 5.5 4.0 1.5
Tactical Asset Allocation Composite 2.5 12.5 10.4 1.7 7.4 22.4 -19.4 8.6 12.3 5.0
60% World / 40% Agg 4.0 14.5 11.3 0.0 10.2 20.4 -24.7 8.3 13.6 6.7
Alternatives Composite 4.5 N/A N/A N/A N/A N/A N/A N/A N/A N/A
3 Month T-Bills + 3% 2.3 3.1 3.1 3.1 3.1 3.2 5.1 8.2 8.0 6.2
Calendar Year PerformanceComposite PerformanceAs of September 30, 2014
_________________________See appendix for a description of the benchmarks and universe. Performance is reported net of fees.
65

Capital Markets Review
66

-16
-14
-12
-10
-8
-6
-4
-2
0
2
4
Perc
en
t
Yen Yuan Real Ruble Euro
Capital Markets ReviewEconomy
Currencies Fall vs. U.S. Dollar Retail Sales and Unemployment
Source: BloombergSource: Trading Economics
-10
-5
0
5
10
15
Perc
en
t
Retail Sales, QuarterlyRate of Change
Unemployment Rate
Source: Economy.com
Foreign Growth Weakens, U.S. Dollar Becomes Safe Haven
• An expansion of Russia’s invasion of Ukraine, Israel’s military actions to clearGaza of missiles and tunnels used by attackers, and ISIS conquering territoryacross Iraq caused investors to pull monies out of Europe and Asia for theperceived safety of the U.S. dollar and Treasury bonds. The rapid ascent of theU.S. dollar sent foreign investment values sharply lower versus their local-currencyreturns.
• A wave of economic weakness enveloped Europe, Japan, Brazil, China and manysmaller countries. The European Central Bank (ECB) inched closer towardpurchasing asset-backed bonds, while further lowering its deposit rate to -0.2%.With the German economy near a zero-growth rate and countries such as Greeceand Spain pleading for an end to austerity, the Eurozone economy offered littlenear-term outlook for growth. Hopes turned to the ECB to offer a Federal Reserve-style bailout and inflate the flagging economy, though the bank has been reluctantto put plans into action based on German leaders’ protests. The impendingculmination of the Federal Reserve’s asset purchases was a late-quarter headwindfor stocks.
• The U.S. economy faced a perplexing mix of economic readings. Theunemployment rate fell to 5.9%, though the number of workers leaving theworkforce remained dauntingly high. Retail sales were choppy, yet on an upwardtrend. A steep drop in oil prices, brought on by increased U.S. production, will be anegative for upcoming energy spending, due to falling gasoline prices, but will be abroader benefit for the economy.
Central Bank Interest Rates
Source: Bloomberg
-1
0
1
2
3
4
5
6
Perc
en
t
Central Bank Interest Rates
ECB Deposit Rate
Federal Reserve Target Rate
China 1-Year Deposit Rate
67

Third Quarter and YTD 2014 Sector Returns
Capital Markets ReviewEquities
Third Quarter 2014 World Equity Returns (USD)
3.6%
12.3%
1.0%
6.6%
0.3%
7.0%
6.1%
6.9%
6.6%
11.8%
15.2%
-9.1%
-4.9%
-2.9%
-1.6%
-0.7%
0.0%
0.8%
1.5%
2.2%
3.6%
4.5%
-12.0% -7.0% -2.0% 3.0% 8.0% 13.0% 18.0%
Energy
Utilities
Industrials
Materials
Cons. Disc.
Russell 3000
Financials
Cons. Staples
Telecom
Info Tech
Health Care 3Q14
YTD
-16.0%
-12.0%
-8.0%
-4.0%
0.0%
4.0%
8.0%
12.0%
-5.3%
1.1%
-3.6%-4.5%
-5.9%-7.0%
-8.7%
-1.6%-3.5%
-5.5%
-8.0%
-12.4%
Developed Markets Emerging Markets
Russell 1000 Index vs. Russell 2000 Index Equity Markets Cool Off as Strengthening USD Impact Felt
• The Russell 3000 Index advanced for a seventh consecutive quarter, albeit avery modest gain in comparison to recent quarters. After setting a number ofnew all-time highs during the quarter, major domestic equity indices retreated inthe latter half of September as a result of heightened geopolitical worries anddisappointing economic data internationally. Sector performance varied widelyduring the quarter. Health care and information technology were the bestperforming sectors, boosted by M&A activity, while the energy and utilitiessectors struggled as the price of oil and other commodities plummeted.
• Small-cap stocks severely underperformed their large-cap counterparts andexperienced their worst quarterly decline since September 2011. The quarterlyunderperformance versus large-caps was the largest since March 1999.Increased geopolitical tensions and concerns over future interest rate hikesdecreased investor risk appetite for small-cap companies.
• Emerging markets, though outperforming developed international markets,declined 3.5% due to falling commodity prices, currency weakness, and poorChinese economic data. Developed international markets fell 5.9%. Economicdata out of Europe was particularly poor, calling into question the region’s futuregrowth prospects. Additionally, the strengthening U.S. dollar negatively impacteddeveloped markets as the dollar appreciated versus all major currencies.
0.7%
-7.4%
-0.2%
-8.6%
1.5%
-6.1%
8.0%
-4.4%
8.1%
-4.7%
7.9%
-4.0%
-10.0%
-8.0%
-6.0%
-4.0%
-2.0%
0.0%
2.0%
4.0%
6.0%
8.0%
10.0%
Russell1000Index
Russell2000Index
Russell1000Value
Russell2000Value
Russell1000
Growth
Russell2000
Growth
3Q14
YTD
Broad Value Growth
68

-1.0%
0.0%
1.0%
2.0%
3.0%
4.0%
5.0%
6.0%
7.0%
8.0%
9.0%
10.0%
YT
D T
ota
l Re
turn
Date
US Agg US Credit High Yield
Global Agg EMD MBS
Source: Barclays
Source: Barclays
Duration-adjusted Excess Returns to Treasuries (bps) Cumulative Year-to-Date Total Returns
Capital Markets ReviewFixed Income
Best Period Second Best Period Worst Period Second Worst Period
2007 2008 2009 2010 2011 2012 2013 1Q14 2Q14 3Q14
Aggregate -206 -710 746 171 -114 226 93 16 52 -28
Agency -56 -110 288 77 -25 166 1 30 50 -11
MBS -177 -232 495 225 -106 91 98 -24 90 -27
ABS -634 -2223 2496 169 52 246 24 19 30 -5
CMBS -435 -3274 2960 1501 47 841 97 65 55 -36
Credit -464 -1786 1990 192 -322 693 226 75 81 -67
High Yield -777 -3832 5955 974 -240 1394 923 199 137 -205
Emerging -457 -2842 3797 508 -537 1503 -32 127 282 -112
Source: Barclays
US Treasury Yield Curve Change by Maturity
Source: US Dept of The Treasury
Spreads Reverse Course in Q3
• Bond market volatility picked up during the third quarter, highlighted by a flight-to-quality in long term rates and wider spreads across corporate andsecuritized credit markets. TIPS produced negative total returns as inflationarypressures eased amid plunging commodity prices and a strengthening dollar.
• The yield curve flattened during the quarter. Ongoing geopolitical tensions anda rally in European government rates contributed to strong demand for longerterm U.S. Treasuries, while continued tapering and a more hawkish tone fromthe Fed caused shorter maturity yields to rise. The spreads between five- and30-year Treasuries continued to decrease and reached the lowest level sinceJanuary 2009.
• Corporate credit returns suffered during the quarter as safe-haven demandincreased and supportive technical factors faded. High yield credit wasparticularly vulnerable during the quarter due to heavy new issuance coupledwith asset outflows. Despite selling pressure in the third quarter, spread sectortotal returns remain positive year-to-date.
-1.0%
-0.8%
-0.6%
-0.4%
-0.2%
0.0%
0.2%
0.4%
Ch
an
ge
in
Yie
ld
Maturity (Years)
3Q14
YTD Ending 3Q14
69

Capital Markets ReviewHedge Funds
HFRI Index Performance – Third Quarter and YTD 2014
Growth of Assets in Hedge Funds
Hedge Fund Return Capture RatioAll Funds Median Net Return/MSCI AC World, %
4.1%
3.7%
2.4%
3.1%
1.7%
3.8%
2.8%
2.1%
1.9%
2.4%
2.2%
0.2%
-2.3%
0.3%
-0.1%
-0.2%
2.7%
-1.5%
0.4%
-1.3%
-2.9%
-1.2%
-4% -2% 0% 2% 4% 6%
BC Aggregate Bond Index
MSCI All-Country World Index
Fund of Funds
Hedge Fund Composite
Merger Arbitrage
Global Macro
EventDriven
Equity Market Neutral
Equity Hedge
Distressed Securities
Convertible Arbitrage
Q3
YTD
27%
46%
62%
33%
44% 45%
31%
52%
0%
10%
20%
30%
40%
50%
60%
70%
80%
2008 2009 2010 2011 2012 2013 Aug '14 YTD
Sep '14 YTD
% Downside in Down Years % Upside in Up YearsSource: Morgan Stanley Prime Brokerage
-$500,000
$0
$500,000
$1,000,000
$1,500,000
$2,000,000
$2,500,000
$3,000,000
1990
1991
1992
1993
1994
1995
1996
1997
1998
1999
2000
2001
2002
2003
2004
2005
2006
2007
2008
2009
2010
2011
2012
2013
Q12014
Q2014
Q32014
Assets
($M
M)
Net Asset Flow Estimated Assets
Source: HFR Inc.
Largest U.S. Public Pension Plan Exits Hedge Funds
• Hedge fund manager performance was generally negative across strategies during thethird quarter. With the exception of distressed securities managers, however, hedge fundsgenerally outpaced the MSCI All-Country World Index during the quarter. Global macrowas the top performing strategy for the quarter (+2.7%) and consequently one of the bestperforming strategies year-to-date.
• The median hedge fund manager tends to lag global equities during strong up markets,but fares better during down months such as September. The median hedge fund trailedequities significantly year-to-date through August. Following September's decline, themedian hedge fund manager has captured just over half of this year’s equity marketreturn, according to Morgan Stanley Prime Brokerage.
• California Public Employees’ Retirement System (CalPERS), the largest public pensionplan in the U.S., announced that it will exit its $4 billion hedge fund program over the nextyear, in an effort simplify its strategy and reduce costs. The Plan’s large asset size ($298billion in total assets) and desire to hire managers willing to provide fee concessionslimited the universe of managers from which it could select, and likely inhibited theperformance of its hedge fund allocation.
• The hedge-fund industry saw inflows of $15.8 billion during the third quarter according toHedge Fund Research. Event driven and relative value managers attracted $11.4 and$11.1 billion, respectively, while macro hedge funds saw a withdrawal of $11.1 billionduring the quarter.
Hedge Fund Assets and Flows
70

-11.8%
-5.6%-6.6%
-5.3%
-1.4% -1.0%
14%
12%
10%
-8%
-6%
-4%
-2%
0%
QTD YTD 1 Year 3 Years 5 Years 10 Years
Capital Markets ReviewReal Assets
Returns as of September 30, 2014
Source: Bloomberg
Bloomberg Commodity Index Returns for Periods Ended September 30, 2014
NCREIF 3 Mon. YTD 1 Yr. 3 Yrs. 5 Yrs. 10 Yrs.
NCREIF 2.9% 5.7% 11.2% 11.3% 9.7% 8.6%
Apartments 2.4% 4.7% 9.9% 11.3% 10.8% 8.3%
Industrials 3.3% 6.1% 12.6% 11.9% 9.1% 8.2%
Office 2.9% 5.2% 10.3% 10.1% 8.6% 8.3%
Retail 3.2% 7.7% 13.5% 13.2% 10.8% 10.0%
Hotel 2.6% 3.4% 8.0% 7.9% 6.2% 6.8%
East 2.3% 4.4% 9.0% 9.7% 9.3% 8.5%
Midwest 2.8% 5.4% 10.5% 10.7% 8.7% 7.2%
South 3.2% 6.7% 13.1% 12.4% 10.0% 8.7%
West 3.4% 6.5% 12.5% 12.5% 10.2% 9.3%Source: NACREIF
Equity REIT Yields Are Low, Although They Provide A Premium to Treasuries; Mortgage REIT Yields Remain Elevated
Real Estate Fundamentals Remain Strong; Commodities Tank
• Equity REITs declined 2.5% during the third quarter, bringing the year-to-date returnto 13.4%. Strong property fundamentals and a continued search for yield were offsetby the possibility of rising U.S. interest rates. Since quarter end, concerns haveshifted to slower economic growth and interest rates have fallen, making the 3.8%yield on U.S. equity REITs look fairly attractive. Foreign REITs have underperformedthe U.S. market with Asia Pacific and Europe returning 0.0% and 5.6%, year to date.
• Private real estate continued to perform well, returning 2.9% during the secondquarter and 5.7% for the first half of 2014. Strong fundamentals (net operatingincome growth and transaction volume), along with low interest rates, contributed to afurther decline in capitalization rates, now at 6.8% according to Real CapitalAnalytics. The cap rate remains well below the long term trend rate, but relative toTreasuries, cap rates remain around average levels since the 1990s. Income returnsare averaging around 5.0%, also below historical levels but favorable relative toTreasury yields.
• Commodity prices declined dramatically during the third quarter, bringing year-to-dateand returns out to ten years into negative territory. The IEA’s forecast of weakerdemand growth for oil, along with favorable supply dynamics, and a strengtheningU.S. dollar, drove oil prices lower. An abundant harvest led to lower grain prices,while industrial metals prices suffered from weaker global demand, especially out ofChina. A strong U.S. dollar with little sign of inflation led to weaker gold demand andprices.
Source: NAREIT
0
5
10
15
20
25
30
Se
p-1
97
4
Se
p-1
97
6
Se
p-1
97
8
Se
p-1
98
0
Se
p-1
98
2
Se
p-1
98
4
Se
p-1
98
6
Se
p-1
98
8
Se
p-1
99
0
Se
p-1
99
2
Se
p-1
99
4
Se
p-1
99
6
Se
p-1
99
8
Se
p-2
00
0
Se
p-2
00
2
Se
p-2
00
4
Se
p-2
00
6
Se
p-2
00
8
Se
p-2
01
0
Se
p-2
01
2
Se
p-2
01
4
Perc
ent
Equity REITs
Mortgage REITs
10-Year Treasury
71

0
2
4
6
8
10
12
14
16
18
20
0
5
10
15
20
25
30
35
40
Agg. V
alu
e ($
,Billio
ns
)
# o
f D
ea
ls
Venture-Backed IPOs # Venture-Backed IPOs $ Value
Venture-Backed IPO ActivityInvestment Horizon Pooled IRR as of 03/31/14
Fund Type 3 Months 1 Year 3 Years 5 Years 10 Years 20 Years
Early Stage VC 5.3% 31.5% 15.7% 14.6% 9.2% 44.1%
Late/Expansion Stage VC 3.5% 32.6% 14.4% 18.6% 12.3% 11.0%
Multi-Stage VC 5.3% 28.3% 13.4% 12.2% 10.2% 12.3%
All Venture Capital 5.1% 30.5% 14.8% 14.2% 9.8% 26.1%
Small Buyouts 1.8% 12.3% 11.6% 16.8% 19.6% 14.5%
Medium Buyouts 1.9% 15.3% 10.2% 14.3% 17.1% 15.8%
Large Buyouts 3.2% 18.8% 11.9% 16.7% 15.5% 16.1%
Mega Buyouts 3.4% 22.2% 13.9% 18.8% 12.3% 10.9%
All Buyouts 3.1% 19.9% 12.7% 17.4% 14.3% 13.4%
Mezzanine/Sub Debt 2.6% 11.8% 11.4% 12.9% 9.8% 9.7%
Distressed 2.8% 16.2% 10.9% 20.0% 11.6% 11.9%
All Private Equity 3.3% 19.9% 12.4% 16.8% 13.1% 14.6%
S&P 500 1.8% 21.8% 14.4% 20.6% 8.5% 8.7%
Capital Markets ReviewPrivate Equity
Venture-Backed IPOs # Venture-Backed IPOs $ Value
$0
$20
$40
$60
$80
$100
$120
$,B
illions
VC Buyout Real Assets Secondary Funds Distressed/SS
Fundraising, IPO Activity Remain Strong Despite Modest Declines
• Private equity market performance data through June 30, 2014 was not yetavailable at the time of report production. During 1Q14, private equity fundsoutperformed their public market counterparts with venture capital and buyoutfunds producing pooled quarterly IRRs of 5.1% and 3.1%, respectively,compared to a 1.8% return for the S&P 500. Early stage venture funds were thestrongest performers while small- and mid-cap buyout funds lagged.
• During 3Q14, private equity fundraising saw a modest decline from the post-crisis high seen in 2Q14. However, the $97 billion raised by private equity fundsin 3Q14 was in line with the quarterly average seen since early 2013 when thepace of fundraising picked up considerably. Venture capital and secondaryfunds saw the biggest percentage declines during the third quarter whiledistressed/special situations funds saw an increase in commitments.
• Venture-backed IPO activity slowed during 3Q14 as 23 venture-backed IPOsraised an aggregate $2.6 billion compared to 2Q14 when 28 IPOs raised $4.9billion. However, it was the sixth consecutive quarter with more than 20venture-backed IPOs after that mark was exceeded in only one other quartersince the beginning of 2008. Biotechnology companies dominated IPO activityduring 3Q14, representing 18 of the 23 IPOs that occurred during the quarter.
Source: ThomsonOne/Cambridge Associates database, October 2014.Note: Data is continuously updated and is therefore subject to change.
S&P 500 1.8% 21.8% 14.4% 20.6% 8.5% 8.7%
Source: Thomson Reuters, ThomsonOne database, October 2014.
Source: Thomson Reuters, ThomsonOne database, October 2014.
Global Fundraising
72

Quarter
YearTo
Date1
Year2
Years3
Years5
Years7
Years10
Years
Domestic Equity Indices
Dow Jones Wilshire 5000 0.0 6.9 17.7 19.8 23.0 15.9 6.5 8.7
S&P 500 1.1 8.3 19.7 19.5 23.0 15.7 6.0 8.1
Russell 1000 Index 0.7 8.0 19.0 20.0 23.2 15.9 6.3 8.5
Russell 1000 Growth Index 1.5 7.9 19.1 19.2 22.4 16.5 7.6 8.9
Russell 1000 Value Index -0.2 8.1 18.9 20.6 23.9 15.3 4.8 7.8
Russell Midcap Index -1.7 6.9 15.8 21.7 23.8 17.2 7.5 10.3
Russell Midcap Growth Index -0.7 5.7 14.4 20.8 22.7 17.1 7.5 10.2
Russell Midcap Value Index -2.6 8.2 17.5 22.5 24.7 17.2 7.3 10.2
Russell 2000 Index -7.4 -4.4 3.9 16.3 21.3 14.3 6.0 8.2
Russell 2000 Growth Index -6.1 -4.0 3.8 17.5 21.9 15.5 6.9 9.0
Russell 2000 Value Index -8.6 -4.7 4.1 15.0 20.6 13.0 5.1 7.3
International Equity Indices
MSCI EAFE -5.9 -1.4 4.3 13.6 13.6 6.6 -0.2 6.3
MSCI EAFE Growth Index -5.5 -2.2 2.9 12.6 13.3 7.6 0.3 6.6
MSCI EAFE Value Index -6.2 -0.6 5.7 14.6 13.9 5.5 -0.8 5.9
MSCI EAFE Small Cap -7.8 -2.7 3.0 15.5 14.5 8.9 2.0 8.1
MSCI AC World Index -2.3 3.7 11.3 14.5 16.6 10.1 2.4 7.3
MSCI AC World ex US -5.3 0.0 4.8 10.5 11.8 6.0 -0.2 7.1
MSCI Emerging Markets Index -3.4 2.7 4.7 3.0 7.6 4.8 0.1 11.0
Fixed Income Indices
Barclays U.S. Aggregate 0.2 4.1 4.0 1.1 2.4 4.1 4.9 4.6
Barcap Intermediate U.S. Government/Credit 0.0 2.2 2.2 0.8 2.0 3.4 4.3 4.0
Barclays U.S. Long Government/Credit 1.0 13.0 12.9 1.7 4.7 8.0 8.2 7.0
Barclays US Corp: High Yield -1.9 3.5 7.2 7.2 11.1 10.6 8.7 8.3
BofA Merrill Lynch 3 Month U.S. T-Bill 0.0 0.0 0.0 0.1 0.1 0.1 0.5 1.6
Barclays U.S. Treasury: U.S. TIPS -2.0 3.7 1.6 -2.3 1.3 4.5 4.9 4.6
Citigroup Non-U.S. World Government Bond -5.4 0.2 -1.0 -3.3 -1.1 1.0 3.6 4.0
JPM EMBI Global Diversified (external currency) -0.6 8.0 9.7 2.6 8.0 8.0 7.9 8.3
JPM GBI-EM Global Diversified (local currency) -5.7 0.0 -1.5 -2.6 2.2 4.4 5.4 8.8
Real Asset Indices
Dow Jones - UBS Commodity -11.8 -5.6 -6.6 -10.5 -5.3 -1.4 -5.2 -1.0
Dow Jones Wilshire REIT -3.1 14.5 13.5 9.3 16.5 16.0 3.8 8.3
Capital Markets ReviewIndex ReturnsAs of September 30, 2014
(Percentage Return)
_________________________Returns for periods greater than one year are annualized.
73

Appendix
74

2013 Action
September • The Metropolitan St. Louis Sewer District hired Pavilion Advisory Group as their investment consultant.
2014 Action
February • Pavilion presented an asset allocation and investment and manager structure review to the Finance Committee. Pavilion recommended the
adoption of new asset allocation targets and allowable ranges that would permit the elimination of the tactical asset allocation and market neutral
strategies, the addition of hedge fund strategies through hedge fund of funds, and the reduction of the number of managers and exposure to high
yield and non-US debt in the fixed income portfolio. The following asset allocation structure was proposed:
40% Equity
35% Fixed Income
25% Alternatives
AppendixHistory of Investment Decisions
Given Pyramis' poor performance and rapidly declining assets in the strategy, Pavilion further recommended the manager be terminated
immediately. The Committee approved these recommendations.
September • Pavilion downgraded PIMCO’s manager rating status from “negative watch” to “sell.” Pavilion initially downgraded PIMCO to “negative watch”
in January following the departure of co-CIO Mohamed El-Erian, and noted we would closely monitor the firm for organizational stability, asset
flows, and performance. PIMCO has not made clear improvements in these areas, and the departure of Bill Gross creates a multitude of future
unknowns for the firm.
75
All Total Composite, asset class composite and manager returns in this report are shown net of fees as of September 1, 2013.
Total Composite returns prior to September 1, 2013 were provided by New England Pension Consultants.
Separate account manager returns prior to September 1, 2013 were provided by the investment managers and are displayed net of fees.
Benchmark ComparisonOne relative comparison for a fund is with a market index or blend of indices. We call this a benchmark comparison. The benchmark should be predefined as an objective. This passive investment alternative is one measure for evaluating relative performance success.
Universe ComparisonA performance measurement universe is created by arraying the results of a large number of professional investment managers from the best to worst. Results are grouped in percentiles. The first percentile represents the top performing 1% of the managers; the 99th percentile represents the bottom performing 1% of managers.
Performance measurement universes are differentiated by time period and asset classes. Investment manager rankings within these broad
AppendixBenchmark and Universe Descriptions
Performance measurement universes are differentiated by time period and asset classes. Investment manager rankings within these broad universes will vary throughout market cycle depending on the manager's investment style or philosophy. Over longer time periods (7 to 10 years or more), a manager ranking in the top quartile (top 25%) of these broad universes would be perceived as performing well.
Policy BenchmarkAs of April 1, 2014, The Policy Benchmark consists of 21% Russell 1000 Index, 6% Russell 2000 Index, 11% MSCI EAFE Index, 3% MSCI Emerging Markets Index, 10% 65% MSCI World/35% BC Aggregate Blend Index, 2% 50% BC Credit/25% S&P LSTA/25% BC High Yield Blend Index,14% BC Intermediate Gov/Credit Index, 9% Citigroup World Government Bond Index, 5% BofA Merrill Lynch US High Yield Cash Pay Index, 4% CPI+5%, 5% Wellington DIH Benchmark, 5% JPMorgan GBI-EM Diversified and 5% NCREIF Fund Index-OEDCE.
Prior to April 1, 2014, the Policy Benchmark is comprised of 20% Russell 1000 Index, 5% Russell 2000 Index, 10% MSCI EAFE Index, 3% MSCI Emerging Markets Index, 10% 65% MSCI World/35% BC Aggregate Blend Index, 2% 50% BC Credit/25% S&P LSTA/25% BC High Yield Blend Index, 13% BC Intermediate Gov/Credit Index, , 8% Citigroup World Government Bond Index, 5% BofA Merrill Lynch US High Yield, Cash Pay Index, 5% 3 Month T-Bills + 3%, 4% CPI + 5%, 5% Wellington DIH Multi-Asset Inflation Index, 5% JPM GBI-EM GlobalDiversified Index, and 5% NCREIF Fund Index-OEDCE.
Note: Wellington DIH Multi-Asset Inflation Index consists of 50% MSCI ACW Commodity Producers Index, 25% DJ AIG Commodity Total Return Index and 25% BC US Treasury Inflation Notes: 1-10 Year.
76


