

The Journal of Writing Analytics Vol. 4 | 2020 | DOI: https://doi.org/10.37514/JWA-J.2020.4.1.04 55
Research Article
Peer Review Practice, Student Identity,
and Success in a First-Year Writing
Pilot Curriculum: An Equity-Minded
Analysis
Brian Gogan, Western Michigan University
Samantha Atkins, Western Michigan University
Structured Abstract
• Background: This article applies an equity-minded approach (McNair et al.,
2020) to examine the feedback practices of first-year writing students enrolled
in a pilot curriculum that used the Eli Review software application to facilitate
peer review learning.
• Literature Review: Drawing upon extant research in writing analytics, peer
review pedagogies in writing instruction, and equity and opportunity in higher
education, this study responds to calls for writing program administrators to
connect data with identity markers such as gender, ethnicity, or race, so as to
improve upon the writing programs that they lead (Reese et al., 2018).
• Research Questions: This study pursues four main categories of research
questions. The first three research question categories examine one pairwise
relationship among the constructs of practice, success, and identity: (1) Is
there a relationship between the amount of practice student writers exercise in
peer review and their success in a first-year writing course? (2) Is there a
relationship between the amount of practice student writers exercise in peer
review and their various identity markers? (3) Is there a relationship between
the success of student writers in a first-year writing course and their various
identity markers? The fourth research question category investigates the
Peer Review Practice, Student Identity, and Success in a First-Year Writing Pilot Curriculum
The Journal of Writing Analytics Vol. 4 | 2020 56
interaction among practice, success, and identity variables, asking: (4) Is there
a linear regression model that can strongly account for the influence of
practice and identity on success in the pilot curriculum?
• Methodology: To answer this study’s four categories of research questions,
peer feedback word count data and student record information were obtained
and linked. Data for 753 students were connected, consolidated, filtered, and
de-identified before being cleaned and coded for analysis. A range of
statistical analyses were used on the data sets, including tests for correlation
(bivariate nonparametric tests), tests for significant difference (independent
samples t tests and one-way analysis of variance tests), tests for independence
(chi-square tests), and tests for prediction (hierarchical multiple linear
regressions).
• Results: Significant results were obtained in each of the four research
question categories. A positive correlation was identified between student
practice (indicated by a word count total for feedback given on Eli Review)
and success (indicated by a numerical value for final course grade). As the
total word count in feedback given on Eli Review increased, so too did
students’ grades. Significant difference between practice and identity was
revealed as occurring between female and male students as well as between
White and non-White students. Results indicate that the average word count
total for feedback given on Eli Review for the first identity-based grouping in
each of the aforementioned pairs was significantly greater than that of the
second identity-based grouping. Significant variance was also suggested when
the seven identity-based variables in the ethnicity or racial identity category
were disaggregated. Two ethnic or racial groups could be understood as
practicing at a significantly higher average amount than a third group.
Significant association was further revealed between gender identity and final
course grade distribution, meaning that different gender identities received
certain final course grades in a frequency more likely than would otherwise be
expected. Finally, various linear regression models were constructed in an
attempt to explain final course grade in terms of students’ total word count
given in feedback on Eli Review and in terms of students’ demographic
information. In the model with the most explanatory power, the word count
total possessed significance as a predictor variable, while various identity
variables did not.
• Discussion: By examining the relationships among the three constructs, this
study suggests three important findings. First, with respect to gender identity,
all three constructs are tightly constellated when examined pairwise, and the
correlation between practice and success seems to manifest itself in the final
Gogan and Atkins
The Journal of Writing Analytics Vol. 4 | 2020 57
course grade distribution: When compared to students who identify as male,
students who identify as female write more words in peer feedback and were
more likely to earn an A final course grade than would otherwise be expected.
Second, with respect to ethnicity or racial identity, the pairwise correlation
does not manifest in a statistically significant relationship between identity
variable and course final grade—despite the fact that there were statistically
significant differences and variance between and among ethnicity and racial
identity grouping for average word count. Third, when the variables of
identity and practice are examined together and alongside the confounding
variable of student cumulative grade point average, the variable of identity—
whether understood as gender identity, racial identity, nationality, or student
population identity—does not possess a statistically significant ability to
explain final course grade in the pilot curriculum. However, in this same
multivariate model, the variable that describes the quantity of student practice
does retain statistical significance and, therefore, retains some ability to
explain variance in students’ final course grades in the pilot curriculum. These
three findings suggest the importance of peer review feedback to student
success and also the need for further research that examines the quantity of
peer feedback in terms of the quality of that feedback.
• Conclusions: This study connects extant research on two types of gaps—the
first gap emerging from identity-based differences in post-secondary student
performance and the second gap emerging from practice-based differences in
student writing performance. By linking these two lines of inquiry, this study
suggests the presence of text-equity gaps that (1) occur in low-stakes,
practice-based conditions and (2) are differentiated by student identity
groupings. Because of their connections to student success, these text gaps
require redress: Writing instructors, writing program administrators, and
writing analytics researchers need to identify ways to intervene in and
improve upon students’ writing practice to increase student learning and
improve student writing.
Keywords: equity, first-year writing, identity, peer review, practice, success, writing analytics
1.0 Background
In the context of post-secondary education, the term success can be slippery—one that elides
easy, straightforward definition, but one that appears ubiquitously in discussions about student
outcomes and opportunities, performance and persistence, access and retention. And, as Powell
(2013) elucidates, the discourses of access and retention, performance and persistence, and
outcomes and opportunities impact the first-year writing classroom—its students, its teachers, its
Peer Review Practice, Student Identity, and Success in a First-Year Writing Pilot Curriculum
The Journal of Writing Analytics Vol. 4 | 2020 58
researchers, and its administrators. Acknowledging that these discourses can be exclusionary to
the point of extinguishing opportunities for students who identify with non-dominant cultures,
races, or language practices (Powell, 2009, 2013), Powell encourages writing teachers to seek
“opportunities of the moment” (2013, p. 13) in their classrooms. The pedagogy that Powell
endorses is a pedagogy of the “here-and-now” (Kahn, 2014; cf. Powell, 2013, p. 118), and it is
one that positions the writing teacher, first, as responsible for all students’ learning in the first-
year writing classroom and, second, as committed “to working toward a writing pedagogy
informed by best practices in composition studies, including those practices that remove
unnecessary barriers to success” (Powell, 2013, p. 18). As Powell’s remarks make clear, the
work of the writing teacher involves a commitment to student success: Helping students succeed
is part of the work of teaching writing. To remove the barriers to student success and help
students succeed, writing teachers, writing researchers, and writing program administrators
(WPAs) need to exercise an equity-minded perspective—that is, they must consider the ways in
which privilege, power, and policy advantage certain students and disadvantage other students;
they must also carry out their work in a way that prioritizes fair treatment and just action.
Equity should thus be prioritized in writing program administration, and, as a number of
recent pieces of scholarship emphasize, equity should also be prioritized in writing analytics
research. Cushman (2019) and Gere (2019) both observe that writing analytics research can help
strive for fairness and justice by revealing patterns of inequities that may then be dismantled to
bring about increased opportunity for student learning. Writing analytics research possesses a
revelatory potential, and it does so because of its focus on making sense of large-scale data. Duin
and Tham (2020) translate this potential for change into an imperative for change, writing that
“WPAs and instructors must learn to use available data to better understand student engagement
and not penalize those who are disadvantaged” (p. 19). This imperative echoes the conclusion by
Reese et al. (2018) that “inclusion of diverse perspectives in information interpretation and use is
critical to the planning work of WPAs as they engage digital platforms” (p. 130). The notion,
here, is that, in order to bring about more fair and more just student learning opportunities,
writing program administrators should undertake large-scale, data-driven research on their
programs and on their programs’ use of digital platforms. This research should further approach
programmatic data in a way that is equity mined, or sensitive to the operation of unearned
advantage. Indeed, as McNair et al. (2020) show, “data can be an indispensable tool to uncover
where equity gaps exist and inform the specific steps that can be taken to close them” (p. 54).
The keys to using data to redress inequity and increase opportunity to learn are an openness to
disaggregating data and a willingness to use an understanding of data to transform educational
practice (McNair et al., 2020). Data derived from writing analytics research can thus be used to
change writing program practice and increase opportunity for writing students.
Thus, this study can be understood alongside recent calls for writing program administrators
to use equity-minded approaches to analyzing data. Crucially important to an understanding of
the equity-minded approach adopted in this study is the context from which this study emerges.
Gogan and Atkins
The Journal of Writing Analytics Vol. 4 | 2020 59
As such, background specific to the co-authors’ institution and the peer review software product
that their first-year writing program uses is presented in the remainder of this section.
1.1 Institutional Background
Located in Kalamazoo, Michigan, United States, Western Michigan University is a public,
doctoral-granting university that enrolls just under 22,000 students and is classified by the
Carnegie Foundation for the Advancement of Teaching as having high research activity and a
commitment to community engagement.
Enrollment data from the 2019-2020 academic year describes an admissions policy that
yields a first-time, first-year cohort of students who enter college with solid academic
performances. The cohort displays parity with respect to gender, but is predominantly White. For
the 2019-2020 academic year, Western Michigan University accepted 79.9 percent of students
who applied for admission to the university and welcomed 2,919 first-time, first-year students.
These students maintained an average GPA of 3.47 in high school and reported an average SAT
composite score of 1106.5 (N = 2,379) and an average ACT composite score of 22.5 (N = 833).
Of these students, 50.3 percent (N = 1,467) identified as male and 48.9 percent (N = 1,426)
identified as female. A total of 72.1 percent (N = 2,106) of first-time, first-year students
identified as White non-Hispanic, 8.7 percent (N = 253) of students identified as Black or
African American, 7.1 percent (N = 207) of students identified as Hispanic/Latino, 4.9 percent (N
= 144) of students identified as two or more races, non-Hispanic, 4.2 percent (N = 122) of
students identified as nonresident aliens, and 1.7 percent (N = 50) of students identified as Asian.
Less than one percent of first-time, first-year students identified as American Indian or Alaska
Native, Native Hawaiian or other Pacific Islander, or indicated that their race and/or ethnicity
was unknown. This enrollment information about Western Michigan University’s 2019-2020
first-year student cohort offers context for understanding this study, which emerged from a pilot
of a significantly revised first-year writing curriculum in the same academic year.
Western Michigan University has historically offered one first-year writing course that
fulfilled a general education proficiency area requirement in college-level writing for its
students. Approximately 70 percent of Western Michigan University’s first-year students enroll
in a section of this first-year writing course. Each course section enrolls 21 students, and about
100 sections of the course, divided between fall and spring semesters, are offered each year.
These sections are predominantly staffed by graduate teaching assistants studying literature and
language, creative writing, and English education and by part-time instructors, most of whom
possess significant classroom teaching experience. Only a small portion of these courses (N = 6)
are typically offered in hybrid or online formats per year. In addition to the 100 sections of the
semester-long first-year writing course, Western Michigan University’s first-year writing
program also offers a small number (N = 6) of intensive course sections (cf. Perryman-Clark,
2016, 2018; Redding et al., 2016, 2019) and about a dozen sections of a basic writing course.
The 2018-2019 academic year brought intense, campus-wide planning for a major revision to
Western Michigan University’s general education curriculum and, in turn, a re-envisioning of the

Peer Review Practice, Student Identity, and Success in a First-Year Writing Pilot Curriculum
The Journal of Writing Analytics Vol. 4 | 2020 60
first-year writing course. The course’s structure, title, outcomes, and pedagogical approach were
all substantially redesigned, and a version of the redesigned course was piloted in the 2019-2020
academic year. The pilot curriculum emerged from the recommendations of 15 program staff
members who served on curriculum redesign task force teams. These task force teams developed
recommendations for the adoption of new course materials as well as assessments of previously
adopted course materials, including the Eli Review peer review and feedback software
application. The present study seeks to analyze this digital peer review platform’s use by
students and its impact on their success in their first-year writing course.
1.2 Product Background
Eli Review is a subscription-based digital platform designed to facilitate peer learning by
managing writing, reviewing, and revising tasks and by providing instructors with real time data
about their students’ peer review practices (Hart-Davidson et al., 2010). Developed by Hart-
Davidson, Grabill, and McLeod, Eli Review subscriptions can be purchased at three-month, six-
month, or twelve-month access increments by either students or institutions at tiered rates (Eli
Review, 2020). The platform, as Ching and Wittstock (2019) describe it, “foregrounds formative
assessment, the role of feedback in revision, and specific forms of teacher intervention in the
process” (p. 179).
Eli Review allows for the creation and sequence of three types of tasks: (1) writing tasks, (2)
review tasks, and (3) revision tasks. Each task must be assigned to students by an instructor, and
each task type typically occurs in sequence (cf. Ching & Wittstock, 2019, pp. 167-170). Writing
tasks can be thought of as prompts or assignments that prod students to produce text. Review
tasks enable the writer’s peers to respond to the text created during a writing task. Review tasks
must occur after and be linked to specific writing tasks. Finally, revision tasks provide the
original writer with the chance to take in the feedback received from peers during a review task
and to plan revisions based upon this feedback. Revision tasks usually occur after and are linked
to one or more review tasks for a single writing task.
The focus of this study is feedback from reviews. Each review task can be structured
differently, depending upon instructional aims. Review tasks may be assigned to individuals,
where pairs of students review each other’s writing, or to groups, where multiple individuals
review the writing of two or more peers each. Review groups can be matched deliberately or
assigned randomly. Settings allow instructors to decide whether or not the review will occur
anonymously and to determine what feedback features will be enabled. Eli Review allows peer
reviewers to provide feedback to writers using contextual comments, which are inserted into the
text at specific locations; final comments, which are offered in a summative fashion at the end of
the piece; trait identifications, which are featured as a checklist; and scaled responses, which are
presented as Likert-style rating items. Eli Review stores this feedback and offers data about this
feedback to both instructors and students, so that engagement and activity can be analyzed (cf.
Ching & Wittstock, 2019, p. 169). Importantly, the first two feedback features encourage
Gogan and Atkins
The Journal of Writing Analytics Vol. 4 | 2020 61
reviewers to deliver their feedback to their peers through written commentary, enabling
instructors and students to study and learn from patterns of written feedback.
Western Michigan University’s first-year writing course was, in 2014, an early adopter of Eli
Review. However, the revision to the first-year writing course, precipitated by the revisions to
the general education curriculum, resulted in the need for much more consistent use of Eli
Review across first-year writing course sections. The co-authors along with other members of the
first-year writing leadership team developed a sequence of 16 writing tasks that corresponded to
the pilot curriculum. These tasks were accompanied by a uniform set of review task prompts.
While the writing task prompts provided students with a target word count or length for their
writing (e.g., 3 sentences, 400-600 words, or 4 pages), the review task prompts suggested a
minimum number of comments (e.g., 4 comments total = 3 contextual comments + 1 final
comment). In this way, the Eli Review prompts for review tasks did not recommend a target
word count for the feedback student reviewers provided to student writers.
The 2019-2020 pilot of the new course curriculum and the uniform set of Eli Review writing
and review tasks encouraged an evaluation of the peer review practice as facilitated by Eli
Review and its relationship to student identity and student success. As such, this study
investigates the following four questions:
1. Is there a relationship between the amount of practice student writers exercise in peer
review and their success in a first-year writing course?
2. Is there a relationship between the amount of practice student writers exercise in peer
review and their various identity markers?
3. Is there a relationship between the success of student writers in a first-year writing course
and their various identity markers?
4. Is there a linear regression model that can strongly account for the influence of practice
and identity on success in the pilot curriculum?
2.0 Literature Review
In many post-secondary writing classrooms, opportunities for students to review the work of
their classmates and provide formative feedback on that writing abound. This exchange of peer
feedback about in-process writing pieces is commonly referred to as peer review (cf. Armstrong
& Paulson, 2008). And, although the pedagogy of peer review has ingrained itself into many
college writing classrooms and often in a way that is facilitated by a digital software application
(cf. Anderson, 2003; Breuch, 2004; Cho & Schunn, 2010; Moxley, 2012; Pritchard & Morrow,
2017; Wilson et al., 2015), the literature on peer review and peer feedback still grapples with
questions related to the efficacy of this pedagogical strategy. The question that writing teachers
and writing program administrators struggle with is, as Paton (2002) observes, a question of peer
review and its “tangible benefits” (p. 291): Does peer review lead to benefits for students and in
student writing? Increasingly, studies have begun to examine the efficacy of the peer review
practice through an equity-based lens that considers differences in peer review efficacy alongside
variation in student identity.
Peer Review Practice, Student Identity, and Success in a First-Year Writing Pilot Curriculum
The Journal of Writing Analytics Vol. 4 | 2020 62
Discussions about peer review have long focused on the novelty of this pedagogical strategy
in the way that it arranges students and creates opportunities for their learning (Golub, 2005;
Herrington & Cadman, 1991; Huisman et al., 2019; Patchan et al., 2009; Paton, 2002). Peer
review is so distinctive in its arrangement of students and also in its output of student feedback
that scholars argue peer review should be understood and taught as its own genre (Parfitt, 2012;
Reid, 2014) and that students should receive instruction on giving and receiving feedback
(Carless & Boud, 2018; Reid, 2014). Parfitt (2012), for one, argues that peer review should be
viewed “as a genre for academic knowledge transference” (p.2), and this sentiment is supported
and extended by Reid (2014), who recommends that peer review be understood and taught as a
“crucial genre” (pp. 218, 230). By teaching peer review—and, especially, the reviewer
commentary called peer feedback—as a typified yet flexible kind of written response, Reid
suggests that the metacognitive benefits of peer review will become more apparent to students.
Reid’s goal of teaching peer review in order to facilitate student metacognition approximates
Carless and Boud’s (2018) goal of cultivating feedback literacy among students. Such feedback
literacy should encourage students to value feedback, deliberate on feedback, mange attitudes
about feedback, and act upon the feedback (Carless & Boud, 2018). Both Reid and Carless and
Boud contend that such metacognitive feedback literacy is promoted when students are asked to
write feedback, study model feedback, and engage in cyclical or sequential task design.
Recent research has also demonstrated that the benefits of peer review and peer feedback
extend to and, in fact, are greater for the student giving feedback than for the student receiving
feedback. Hart-Davidson and Meeks (in press) name this phenomenon “giver’s gain,” and they
are not alone in observing this phenomenon. Reese et al. (2018) join a growing number of
researchers who endorse the presence of giver’s gain, when they note that the benefit of peer
review “is not one sided” (p. 100). Likewise, Xiong et al. observe “that the process of providing
feedback leads to improvements in the feedback-providers’ own writing” (2012, pp. 156-157).
This observation finds support in the work of Wooley et al. (2008) and Cho and Schunn (2010).
Further, Lundstrom and Baker provide some of the most recent, most resounding, and most
widely referenced evidence of giver’s gain in their 2009 study of 91 students, divided into two
groups: those who gave peer feedback and those who received peer feedback. Ultimately,
Lundstrom and Baker found “that students taught to give peer feedback improve in their own
writing abilities more than students taught to use peer feedback,” which implies that “the act of
providing feedback may also improve student writing and may be the most beneficial aspect of
peer review” (p. 38). What is more is that differences between feedback givers and feedback
receivers occurred at a beginning proficiency level (Lundstrom & Baker, 2009). Ultimately, by
linking the practice of peer review to improved writing performance, these studies offer a basis
for further examining two of the main constructs in the current study—practice and success.
Additionally, research on peer review and its benefits for students has more deliberately
considered the parity of peer review performances among different identity-based student
groupings. Questions concerning the relationship between peer review practice and student

Gogan and Atkins
The Journal of Writing Analytics Vol. 4 | 2020 63
identity should, as Flynn (2011) makes clear, be foregrounded in contemporary studies of peer
review in the writing classroom.
Indeed, differences in student peer review practices according to gender identity have been
studied by Johnson and Yang (1989), Johnson (1992), Johnson and Roen (1992), Brammer and
Rees (2007), and, most recently, Reese et al. (2018). For the most part, these studies detect
significant difference in aspects of the peer feedback given by female students when compared to
feedback given by male students. Female graduate students, for instance, tended to use more
intensifiers and more personal references in the compliments they provided in their feedback,
and they also tended to make more use of a bookended compliment strategy in their feedback
than did males (Johnson & Roen, 1992). Moreover, when compared to their male counterparts,
female undergraduate students reported that their peer feedback was more helpful and more
polite (Reese et al., 2018).
The research on differences in student peer review according to language identity has been
much more robust, although not necessarily more conclusive. Much of this research focuses on
L2 learners, or non-native English speakers (Allen & Katayama, 2016; Ferris, 2003; Hyland &
Hyland, 2006; Leijen & Leontjeva, 2012; Lundstrom & Baker, 2009; Mangelsdorf, 1992), and
some of this research frames inquiry questions comparatively, testing constructs as manifested in
the performance of L1 learners, or native English speakers, against those tested in L2 learners
(Anderson et al., 2010). Notably, although the research that focuses on the construct of language
identity often presents the research in a global context (cf. Anderson et al., 2010), these studies
largely do not focus on the construct of nationality.
With the exception of the 2018 study by Reese et al., research studies that explore differences
in peer review practices according to racial identity or ethnicity are scant. Reese et al. (2018)
have suggested that significant differences do exist between students who identify with different
racial groupings when they are asked to share their perceptions of the peer review feedback they
give their peers in terms of its politeness, kindness, and encouragement. Nonetheless, neither
racial identity nor ethnicity have been sustained focal areas within research on peer review
practice.
Across all of these studies, the question seems to be: How varied is the giving and the
gaining associated with peer review when examined according to different student identity
groupings? Indeed, Hart-Davidson and Meeks (in press) foreground this question and the
implications it has for fairness, justness, and equity in the writing classroom when they note that
“[e]vidence puts a premium on equal opportunity to give rather than receive feedback as a key to
writer improvement.” For Hart-Davidson and Meeks, peer review pedagogy, giver’s gain,
fairness, and equity are interconnected: “To practice fair pedagogy,” Hart-Davidson and Meeks
assert, “instructors should teach helpful feedback and assign enough reviews that the weakest
reviewers can improve.” This study is, therefore, interested in examining the benefits of student
peer review practice as it occurs on the subscription-based Eli Review peer review platform and
the relationship of this practice to student identity and student success.
3.0 Research Questions
Peer Review Practice, Student Identity, and Success in a First-Year Writing Pilot Curriculum
The Journal of Writing Analytics Vol. 4 | 2020 64
The review of the literature led to the formation of four groups of questions investigating
relationships between student writers’ practice, success, and identity.
3.1 Constructs
The three concepts investigated by this study—practice, success, and identity—are
extraordinarily complex phenomena that can be defined and measured in many ways. For the
purpose of this study, the co-authors define the three concepts under investigation in a manner
that, while simplistic from some perspectives, is deliberate from the perspective that this study
contributes to an emerging, rather than a well-established, body of research. To be sure, each
construct is measured in a way that flattens out complexity in service of taking a first step toward
understanding the relationships between practice, success, and identity.
3.1.1 Practice
The construct of practice refers to the cumulative total of words produced in peer review
feedback throughout one semester of first-year writing. Think, here, of an analogy that compares
writing and athletics (cf. Borgman & McArdle, 2019; Hart-Davidson & Meeks, in press;
Zoellner, 1969, p. 282). By this analogy, the practice quantity considered in this study would be
the equivalent of other practice quantities in athletics—for instance, the total number of swings
taken in golf or even baseball practice, the total number of free throws shot in basketball
practice, or the total number of miles ran in track practice. The quantity of practice is, therefore,
indicative of a cumulative total during a set time period. It describes the amount of club
swinging, bat swinging, free-throw shooting, or running the athlete performed in a season.
Omizo has referred to this indicator as a “blunt measure” that “can give instructors a rough
baseline to approach reviews” in Eli Review (Eli Review, 2016). Extending Omizo’s point, Hart-
Davidson and Meeks (in press) explain that the measure of word count attends to the quantity
and intensity of practice; intensity is dependent, to a degree, upon frequency of practice, but it
does not necessarily indicate the quality of that practice. While the co-authors follow the Eli
Review research and development team in recognizing the importance of quality to the writing-
related practice that students enact in peer review, an examination of feedback quality sits
beyond the scope of the present study.
3.1.2 Success
In the context of this study, the construct of success refers to the final grade given to the student
writers at the end of the term. Western Michigan University uses an eight-point grading scale (A,
BA, B, CB, C, DC, D, E; respectively 4.0, 3.5, 3.0, 2.5, 2.0, 1.5, 1.0. 0.0), where the grade of
A/4.0 connotes outstanding performance in the course and the highest level of success in
achieving the learning outcomes. Conversely, the grade of E/0.0 connotes the lowest level of
performance in the course and a failure to achieve the student learning outcomes. To return to the
analogy of an athletic performance, the course grade refers to the finishing place, shot
percentage, or batting average of the athlete, where athletes who earn the same grade effectively
Gogan and Atkins
The Journal of Writing Analytics Vol. 4 | 2020 65
end their competition in a tie. The use of a final course grade as an indicator of success is a
necessarily narrow, if not oversimplified, quantification; this study does not define student
success in terms of graduation rates, workforce placements, engagement indicators, personal
dispositions, or any number of other indicators used in other studies (c.f. National Postsecondary
Education Cooperative). Rather, this study adopts a programmatic perspective, as it examines the
final grades awarded in an initial pilot semester of a new curriculum as a measure of first-year
student success in first-year writing.
3.1.3 Identity
Finally, for this study, the construct of identity can be understood in terms of the personal
descriptors that students report to Western Michigan University upon admission to the
university. These descriptors—including gender identity, ethnicity or racial identity, nationality,
and student population status—are recorded by Western Michigan University as student
information. To continue with the athletic metaphor, these pieces of information describe the
athletes. They identify who is swinging, batting, shooting, or running. Of course, the small
amount of information maintained by the university does not encompass any one student’s
complete or composite identity. These identity descriptors do, however, enable the current study
to look for patterns in data and assess equitable practices in the program’s pilot curriculum.
3.2 Research Question Categories
This study investigates four categories of research questions. Each of the first three categories of
questions focuses on the relationships between a particular pairing of the study’s three
constructs: practice, success, and identity. The fourth category of questions focuses on the
interaction or interrelationship between the practice and identity variables and their ability to
account for student success in the pilot curriculum.
3.2.1 Practice and Success
The first category of research questions that this study examines is one that considers two
measures of student performance—total word count of feedback provided by individual students
to their peers via Eli Review as practice and final course grade as success. As such, this category
of questions interrogates the relationship between the level of practice exhibited by students on
the Eli Review platform and their final course grades.
RQ1: Is there a relationship between the amount of practice student writers exercise in
peer review and their success in a first-year writing course?
3.2.2 Practice and Identity
The second category of research questions that this study examines is one that considers the level
of student practice in terms of various student identity markers. This category of questions
compares practice levels among student identity groupings—including gender identity, ethnicity
Peer Review Practice, Student Identity, and Success in a First-Year Writing Pilot Curriculum
The Journal of Writing Analytics Vol. 4 | 2020 66
or racial identity, nationality, and student population identity. Thus, these questions are
concerned with equity.
RQ2: Is there a relationship between the amount of practice student writers exercise in
peer review and their various identity markers?
3.2.3 Success and Identity
The third category of research questions focuses on success and any connections to identity. This
category of questions triangulates the study’s constructs, leaving out a consideration of practice
but focusing on equitable outcomes between different gender identities, ethnic or racial
identities, national identities, and student population identities.
RQ3: Is there a relationship between the success of student writers in a first-year writing
course and their various identity markers?
3.2.4 Success as Explained by Identity and Practice
The fourth category of research questions focuses on the ability of the identity and practice
variables to explain the outcome variable of success in the first-year writing pilot curriculum.
This category of questions comparatively analyzes different linear models and their features to
evaluate the degree to which the identity variables of gender, race, ethnicity, nationality, and
student population as well as the practice variable of total word count in Eli Review feedback
given might be understood as predicting students’ final course grades.
RQ4: Is there a linear regression model that can strongly account for the influence of
practice and identity on success in the pilot curriculum?
4.0 Research Methodology
As this study was interested in examining peer review practice, student identity, and success in
the pilot year of a newly designed first-year writing curriculum, the study was designed to
connect two readily available data sets—Eli Review usage data and student records—that could
be obtained, connected, filtered, cleaned, analyzed, and used to inform planning for the full
launch of the revised curriculum in Fall 2020. As such, this research methodology actualizes the
type of study that Palmquist (2019) describes as drawing upon data from an instructional
software program and analyzing that data alongside student demographic data.
4.1 Statement of Ethical Conduct of Research
This study was submitted for administrative review by the Western Michigan University
Institutional Review Board as project number 20-03-05. The board approved this study as
exempt, since the study used data obtained in an educational setting and subsequently de-
identified that data for analysis.
4.2 Data Sources
Gogan and Atkins
The Journal of Writing Analytics Vol. 4 | 2020 67
This study unites data from two software applications. The first application is Eli Review, the
platform for which first-year writing students purchase a subscription as part of their course
materials fee, while the second application is Cognos Analytics, the platform that the university
uses to manage institutional research and student record information.
4.2.1 Eli Review Usage Information
Eli Review usage information came from two sources from within the Eli Review application: a
downloadable “Comment Volume Report” and a course-specific task dashboard.
4.2.1.1 Eli Review Comment Volume Report. First, Eli Review offers instructors a number
of analytic functions and data download options for each of their course sections. Instructors can,
for instance, download all of the writing that was submitted by students in a particular course
section to complete an Eli Review writing task. Moreover, instructors can download a
“Comment Digest” that provides the feedback text that was exchanged by peer reviewers during
a particular review task. This study makes use of a different and less granular data download—
one that is called the “Comment Volume Report.” The “Comment Volume Report” provides
task-separated word count totals for each student, as well as task-separated, class-wide word
count totals. This report also offers a point-in-time report of the total number of words in
feedback that each individual student provides to peers. Any student who established an Eli
Review account and associated that account with a particular first-year writing course section
would appear on this report, so long as they participated in at least one task. At the end of the
term, then, this point-in-time cumulative total conveys the total number of words each student
wrote during peer review for the term. This count of total comment volume for the course is akin
to the total amount of practice an athlete invests in a complete season, and this data download
served as the measure of practice for the current study. When aggregated across course sections,
these “Comment Volume Reports” offer data about the quantity of feedback practice performed
by 1,224 student accounts in the Fall 2019 term.
4.2.1.2 Eli Review Task Dashboard. Second, Eli Review uses a task dashboard as the home
page or landing page for each unique course section that uses Eli Review. This landing page uses
time-date stamps and titles to profile the sequencing of writing tasks, review tasks, and revision
tasks. The task sequence can be established in one Eli Review course section and copied into
other course sections. In its pilot year, Western Michigan University’s first-year writing courses
all began the term using a copy of a master writing task, review task, and revision task sequence.
The master task sequence consisted of a total of 16 write-and-review task cycles, some of which
were optional and some of which included review tasks. By term’s end, the Eli Review task
dashboard indicated which course sections had maintained the curricular sequence and also
which course sections had deviated from the curricular sequence. As such, the task dashboard
provides the current study with an important inclusionary criterion. To be included in the study,
each course section needed to have demonstrated that students used Eli Review at a level of
frequency and in a sequence that maintained fidelity to the pilot curriculum, as well as in a
proportion that contributed no more than 10 percent toward students’ final course grade. Of the
Peer Review Practice, Student Identity, and Success in a First-Year Writing Pilot Curriculum
The Journal of Writing Analytics Vol. 4 | 2020 68
60 sections of first-year writing offered in the 2019 fall term, 44 sections sustained a sequencing,
a frequency, and a weighting of Eli Review tasks that met curricular expectations. These 44
course sections assigned at least 12 write-and-review cycles at appropriate times in the term,
with the majority of these sections (N = 23) assigning either 15 or 16 cycles. Moreover, these
courses configured their write-and-review cycles as low-stakes writing assignments: Completing
these cycles contributed 10 percent, at most, to students’ final course grades. A listing of these
44 course sections was made for subsequent filtering of data points.
4.2.2 Student Record Information
Student information about success and identity came from Western Michigan University’s
records and data reporting software system, which is currently IBM’s enterprise platform Cognos
Analytics.
Among the hundreds of reports that Western Michigan University’s Office of Institutional
Research has structured for accessing data about course enrollment and student performance is a
report titled “Student List by Course.” This report can be filtered by term and provides robust
data on all students who enroll in a particular course number. Among the data points that are
included on this report are the names of students, the names of their instructor of record, their
enrollment status, their course registration status, their final course grade, their cumulative grade
point average, their student population status, their gender, their ethnicity, and their nationality.
Thus, when run to output Fall 2019 first-year writing course data, this one report provides the
data with which this study examines student success and student identity.
The initial report yielded 1,302 student records for the 2019 fall sections of first-year writing.
Among these 1,302 student records, however, it is important to note that some records duplicate
student information and other records are incomplete. Duplication occurs in instances where a
student switched first-year writing course sections once the term began. Incomplete records
might be missing student record information or student final grade information. In the former
case, student record information might not have been communicated by the student to the
university—for example, when a student chooses not to provide the university with information
about their ethnicity or racial identity. In the latter case, final grade information would be
missing for the original records of students who, at midterm, applied to and were accepted into
an intensive section of first-year writing. Once accepted into this new course section, some three
dozen or so students receive a final grade in their new section of first-year writing but are not
officially “Withdrawn” from their original section of first-year writing. Also of note, this report
lists all sections of the first-year writing course, including one hybrid section, three online
sections, three honors sections, and the three aforementioned intensive sections. Not all of these
sections were involved in the pilot of the new curriculum. As such, not all of the student records
included in this report are germane to the current study.
4.3 Data Connection, Consolidation, Filtering, and De-Identification
Gogan and Atkins
The Journal of Writing Analytics Vol. 4 | 2020 69
Having obtained data from Eli Review and from Cognos Analytics and having created a list of
44 course sections that maintained the recommended curricular sequencing, frequency, and
weighting, data were connected, consolidated, filtered, and de-identified.
4.3.1 Connection
The two reports of data—one containing the cumulative word count of peer feedback that 1,224
students wrote and one containing final grade, cumulative grade point, and demographic
information for 1,302 students—were first connected. Working from the two existing reports, a
spreadsheet was created that joined the two data sets and created one record for each individual
student. The student’s name, university email address, and the name of the student’s instructor of
record were used to verify the connection between the existing data points and provided the basis
for the creation of the new combined record. The resulting data set contained complete records
for 1,212 first-year students.
4.3.2 Consolidation
The set of 1,212 records was then reviewed, and any duplicate records were consolidated.
Duplicate records occurred very infrequently—most often when a student had switched sections
of first-year writing in the early weeks of the term and had, therefore, established Eli Review
data associated with each course section. In these instances, multiple records for the same student
were reconciled and consolidated to create a single record for that student.
4.3.3 Filtering
After the data were linked to create one combined record for each unique student who enrolled in
the first-year writing course in fall of 2019 and who created an account with Eli review, the data
were filtered to contain only the records associated with the 44 course sections that maintained
fidelity to the pilot curriculum in terms of Eli Review task sequence and frequency. The focus of
the study was, again, on the impact of practice and identity on student success in a pilot
curriculum; thus, the data from course sections that did not meet the inclusionary criteria of
sequencing, frequency, and weighting were separated from the course sections that did meet the
inclusionary criteria. After applying this filter and focusing only on the 44 course sections that
maintained fidelity to the pilot curriculum, the data set consisted of records for 753 unique
students.
4.3.4 De-Identification
Having been filtered for curricular fidelity, the resulting records for 753 unique students were de-
identified to maintain student confidentiality. The de-identification process involved the deletion
of student names and the removal of their email addresses and university identification numbers
from the data set. Information about the students’ course section numbers and their instructors of
record were also removed from the data set at this stage of the research project.

Peer Review Practice, Student Identity, and Success in a First-Year Writing Pilot Curriculum
The Journal of Writing Analytics Vol. 4 | 2020 70
4.4 Data Cleaning and Coding
After the Eli Review report data were connected with the Cognos Analytics report data,
consolidated to avoid duplication, filtered for curricular fidelity, and de-identified to maintain
confidentiality, further cleaning and coding of the data was required. The cleaning process varied
depending upon the research question type and subsequently yielded different sample sizes upon
which analysis occurred. The coding strategies anticipated the specific statistical analyses that
were to be run of the data. The data cleaning and coding processes for each of the three types of
research questions are detailed below.
4.4.1 Cleaning and Coding for RQ1
This category of research questions examined the relationship between practice and success.
Practice was quantified as the number of words each student produced in feedback that was
provided to their peers. Success was quantified as the final course grade.
To prepare for data analysis, the practice data were cleaned to remove incomplete records.
Any records missing Eli Review information were removed from the data set. Indeed, a few
student records did not contain any information from Eli Review, suggesting that a few students
neither created nor used an Eli Review account. However, if a student created an Eli Review
account but supplied no words of feedback, the record remained in the data set.
The success data required that final course letter grades be converted to their numerical
values on a 4.0 grading scale. Letter grades of A, BA, B, CB, C, DC, D, and E were converted to
numerical values of, respectively, 4.0, 3.5, 3.0, 2.5, 2,0, 1.5, 1.0, and 0. During this process,
students who withdrew from the class and received a W, students who did not complete their
work for the class and received an I, students who never appeared for class and received an X,
and students who audited the course and received an AU were excluded from the data set. A
numerical calculation of these students’ final grades is not possible and, therefore, these
students’ records needed to be removed from the data set before analysis. This removal was
further justified by the fact that, in most cases where students received an I, W, or X for their
final grade, these students would not have had an equal chance to practice giving feedback to
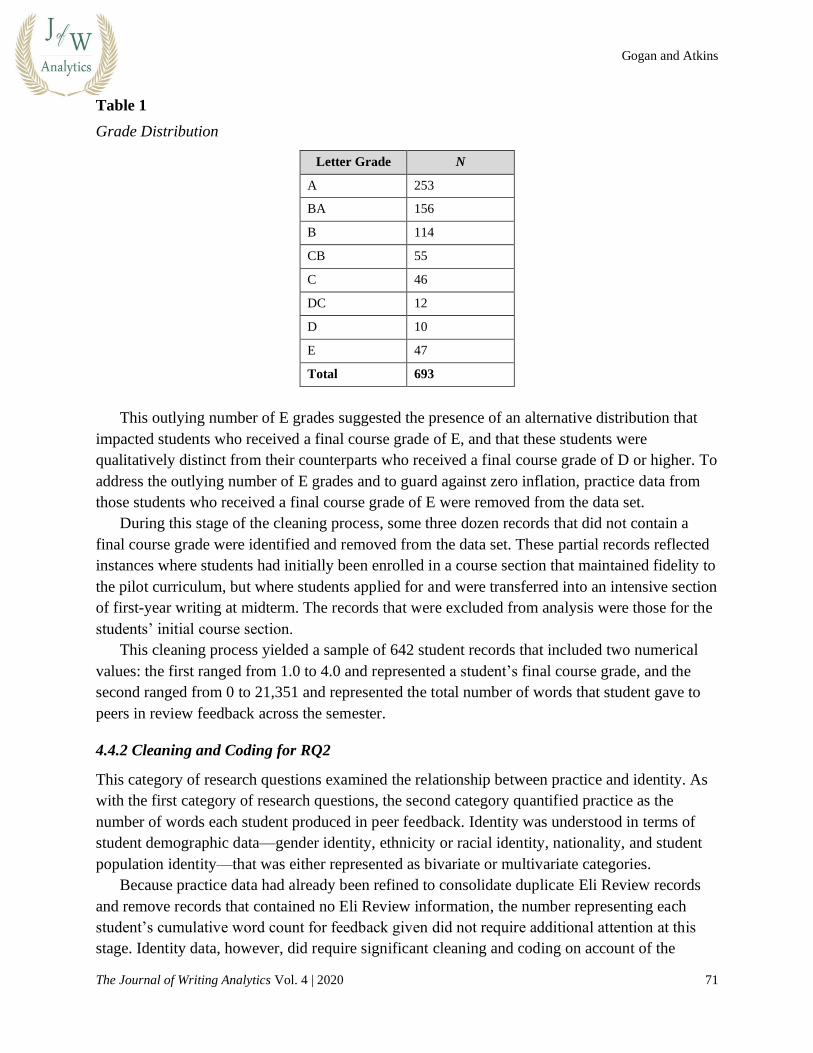
peers. Additionally, those students who earned a final course grade of E were excluded from the
data set, as the number of student E grades was not normally distributed.
Gogan and Atkins
The Journal of Writing Analytics Vol. 4 | 2020 71
Table 1
Grade Distribution
Letter Grade N
A 253
BA 156
B 114
CB 55
C 46
DC 12
D 10
E 47
Total 693
This outlying number of E grades suggested the presence of an alternative distribution that
impacted students who received a final course grade of E, and that these students were
qualitatively distinct from their counterparts who received a final course grade of D or higher. To
address the outlying number of E grades and to guard against zero inflation, practice data from
those students who received a final course grade of E were removed from the data set.
During this stage of the cleaning process, some three dozen records that did not contain a
final course grade were identified and removed from the data set. These partial records reflected
instances where students had initially been enrolled in a course section that maintained fidelity to
the pilot curriculum, but where students applied for and were transferred into an intensive section
of first-year writing at midterm. The records that were excluded from analysis were those for the
students’ initial course section.
This cleaning process yielded a sample of 642 student records that included two numerical
values: the first ranged from 1.0 to 4.0 and represented a student’s final course grade, and the
second ranged from 0 to 21,351 and represented the total number of words that student gave to
peers in review feedback across the semester.
4.4.2 Cleaning and Coding for RQ2
This category of research questions examined the relationship between practice and identity. As
with the first category of research questions, the second category quantified practice as the
number of words each student produced in peer feedback. Identity was understood in terms of
student demographic data—gender identity, ethnicity or racial identity, nationality, and student
population identity—that was either represented as bivariate or multivariate categories.
Because practice data had already been refined to consolidate duplicate Eli Review records
and remove records that contained no Eli Review information, the number representing each
student’s cumulative word count for feedback given did not require additional attention at this
stage. Identity data, however, did require significant cleaning and coding on account of the

Peer Review Practice, Student Identity, and Success in a First-Year Writing Pilot Curriculum
The Journal of Writing Analytics Vol. 4 | 2020 72
specific descriptors that Western Michigan University uses to report student demographic
information.
4.4.2.1 Gender Identity. The gender identity of each student was represented in the Cognos
Analytics report as a bivariate data point: Students identified as either “Male” or “Female.” A
very small number of records did not contain a data point for gender identity. When cleaned to
include only those records that contained both gender identity data—bivariate nominal data,
either “Male” or “Female”—and Eli Review practice data—numerical data, ranging from 0 to
21,351—the sample for the question examining practice and gender identity numbered 743.
Table 2
Sample for Research Question 2.1
Identity
Grouping N
Male 336
Female 407
Total 743
4.4.2.2 Ethnicity or Racial Identity. The ethnicity or racial identity of each student was
represented in the Cognos Analytics report as one of eight choices: “American Indian or Alaska
Native,” “Asian,” “Black or African American,” “Hispanic,” “International,” “No Response,”
“Two or More Races,” or “White.” Records for students who selected “No Response” or for
whom there was no ethnicity data available were removed from the data set. The resulting data
set consisted of seven descriptors of students’ ethnicity. To prepare this multivariate data set for
analysis, any records that contained no practice data were removed from the data set. The final
sample numbered 731.
To enable two approaches to the analysis of this data set, the final multivariate data set was
recoded, first, using only two dummy codes that converted the multivariate data set into multiple
bivariate data sets, and, second, using a series of seven dummy codes, each of which
corresponded to a discrete ethnicity or racial identity category.
The first approach to recoding offered insight into the dynamic between the predominant
category and the aggregate of the less dominant categories. Given that Western Michigan
University is a predominantly White institution, this approach used a bivariate code of “White”
or “Not White” to recode the data set of 731 student records. As a result, each student record
contained a data point for Eli Review practice that was represented as an integer between 0 and
21,351 and a bivariate data point for ethnicity or racial identity that was one of the two code
options.

Gogan and Atkins
The Journal of Writing Analytics Vol. 4 | 2020 73
Table 3
Sample for Research Question 2.2.A
Identity
Grouping N
White 507
Not White 224
Total 731
The second approach to coding provides an opportunity to investigate significant differences
between and among the ethnic and racial report categories, which encourages a disaggregated
analysis that adopts an equity lens (McNair et al., 2020). Thus, after cleaning and coding, this
approach yielded a data set of 731 records that each contained a numerical value—between 0 and
21,351—that represented practice and a dummy code—an integer between 1 and 7—that
represented a categorical descriptor of ethnicity or racial identity.
Table 4
Sample for Research Question 2.2.B
Identity Grouping N
American Indian or Alaska Native 4
Asian 15
Black or African American 76
Hispanic 46
International 44
Two or More Races 39
White 507
Total 731
4.4.2.3 Nationality. The nationality of each student was communicated at three places in the
Cognos Analytics report. First, “International” appeared as one “Ethnicity” category. Second,
and as will be discussed below, “International” appeared as a modifier to the population status of
particular students. Third, “Nation of Citizenship” appeared as its own category on the report.
This third category provides the basis for this data set. The data set, having been filtered by
course to ensure fidelity to the curriculum and having been cleaned to remove records with no
data, yielded a sample within which a total of 44 first-year writing students listed their “Nation
of Citizenship” as a country different than the United States. A total of 15 different countries
were listed, including Albania, Bangladesh, Canada, China, Dominican Republic, India,
Kinshasa, Malaysia, Nepal, Oman, Saudi Arabia, Spain, South Korea, Uzbekistan, and Vietnam.
These data points were then converted into a bivariate data set: “United States Citizen” or “Not
Peer Review Practice, Student Identity, and Success in a First-Year Writing Pilot Curriculum
The Journal of Writing Analytics Vol. 4 | 2020 74
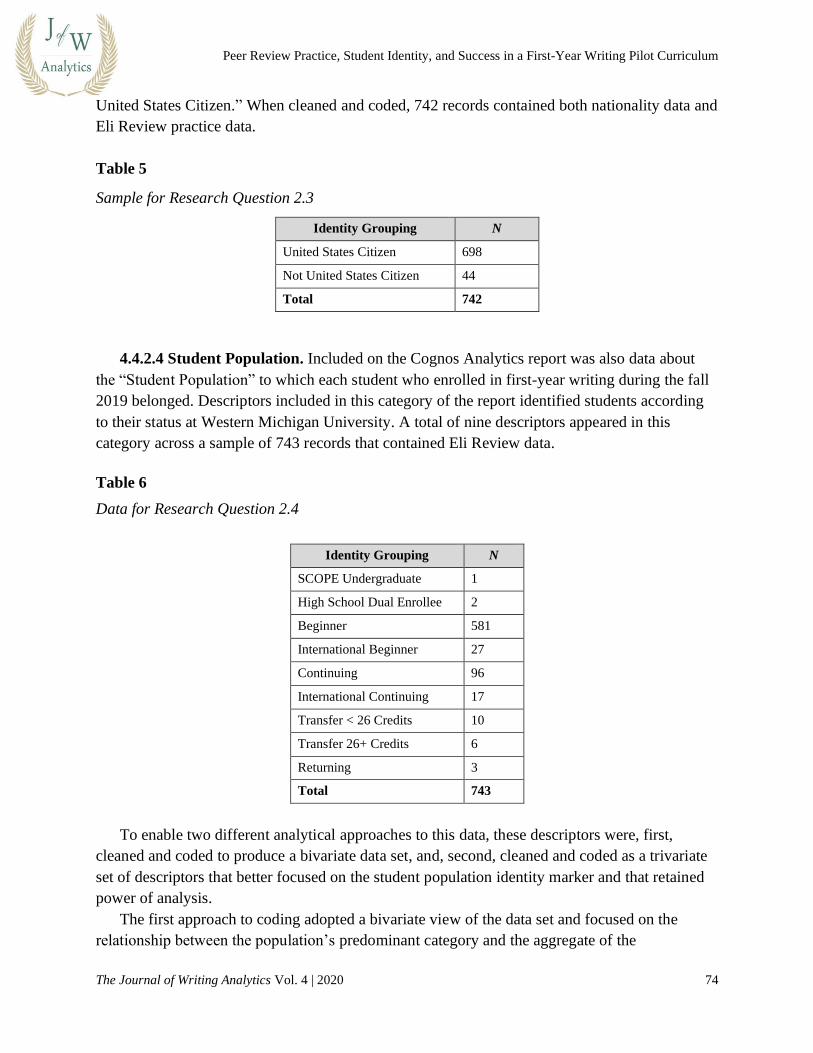
United States Citizen.” When cleaned and coded, 742 records contained both nationality data and
Eli Review practice data.
Table 5
Sample for Research Question 2.3
Identity Grouping N
United States Citizen 698
Not United States Citizen 44
Total 742
4.4.2.4 Student Population. Included on the Cognos Analytics report was also data about
the “Student Population” to which each student who enrolled in first-year writing during the fall
2019 belonged. Descriptors included in this category of the report identified students according
to their status at Western Michigan University. A total of nine descriptors appeared in this
category across a sample of 743 records that contained Eli Review data.
Table 6
Data for Research Question 2.4
Identity Grouping N
SCOPE Undergraduate 1
High School Dual Enrollee 2
Beginner 581
International Beginner 27
Continuing 96
International Continuing 17
Transfer < 26 Credits 10
Transfer 26+ Credits 6
Returning 3
Total 743
To enable two different analytical approaches to this data, these descriptors were, first,
cleaned and coded to produce a bivariate data set, and, second, cleaned and coded as a trivariate
set of descriptors that better focused on the student population identity marker and that retained
power of analysis.
The first approach to coding adopted a bivariate view of the data set and focused on the
relationship between the population’s predominant category and the aggregate of the

Gogan and Atkins
The Journal of Writing Analytics Vol. 4 | 2020 75
population’s less dominant category markers. Given that the first-year writing course at Western
Michigan University is predominantly populated by a first-time, first-year student population,
this approach to coding sought to investigate the difference between the beginning student
population and the remaining student population categories. When cleaned, the records that
contained student population data—bivariate nominal data, either “Beginner” or “Not
Beginner”—and Eli Review practice data—numerical data, ranging from 0 to 21,351—
numbered 743.
Table 7
Sample for Research Question 2.4.A
Identity Grouping N
Beginner 581
Not Beginner 162
Total 743
The second approach to coding omitted three categories—“SCOPE Undergraduate,” “High
School Dual Enrollee,” and “Returning”—all of which did not retain analytical power. Then, the
remaining categories were aggregated to focus only on students’ statuses as “Beginning,”
“Continuing,” or “Transfer.” In other words, considerations of nationality and number of transfer
credits were not needed in this analytic approach. The result was a sample of 737 student
records.
Table 8
Sample for Research Question 2.4.B
Identity Grouping N
Beginner 608
Continuing 113
Transfer 16
Total 737
4.4.3 Cleaning and Coding for RQ3
This category of research question investigated the relationship between success and identity,
using student record information provided by the Cognos Analytics report. Although both of
these categories had been cleaned and coded in conjunction with the previous two types of
research questions, the nature of this type of research question required the success data to be
recoded and the identity-based data samples to be recalculated to account for the presence or
absence of final course letter grades.

Peer Review Practice, Student Identity, and Success in a First-Year Writing Pilot Curriculum
The Journal of Writing Analytics Vol. 4 | 2020 76
As previously explained, the construct of success is, for the purpose of this study, understood
as the students’ final grade in the first-year writing course. The Cognos Analytics report conveys
this information in the form of one of eight letter grades—either A, BA, B, CB, C, DC, D, or E.
The report also includes the final grades of W for students who withdrew from the class, I for
students who did not complete the course work, X for students who did not attend the class, and
AU for students who audited the course. In order to answer the questions about the relationship
between success and identity, seven final letter grades—A through D—were retained as codes.
Students who earned one of these letter grades completed the first-year writing course, achieving
the course’s student learning outcomes to varying degrees of success. However, the final grades
that do not indicate course completion—W, I, X, and AU—were omitted from the sample.
Further omitted from the sample was the final grade of E, as its outlying distribution risked
inflating the data. The sample size of student records that included one of the seven final letter
grades was 642.
4.4.3.1 Gender Identity. Working from the success sample of 642 records, the data was
reviewed to ensure the presence of a gender identity data point—either “Male” or “Female”—in
each record. This review revealed that all 642 records included this bivariate data point;
therefore, no additional cleaning was needed. The data revealed that slightly more students in the
sample identified as “Female” than “Male.”
Table 9
Sample for Research Question 3.1
Identity Grouping N
Male 286
Female 356
Total 642
4.4.3.2 Ethnicity or Racial Identity. When the success data set of 642 student records was
reviewed to check for the presence of an ethnicity or racial identity data point, the review
showed that 632 records included a multivariate data point that identified ethnicity or racial
identity as one of seven categorical choices. The 10 records that did not contain a response for
the ethnicity data point were removed from the data set. The two approaches to coding that were
applied to respond to research question two were then reapplied to the data set and a third coding
approach was added.
The first coding approach viewed the data in terms of a bivariate coding scheme: one
dominant code and a second aggregated code encompassing the combined less dominant
categories. This approach allowed for a comparison of the final course grades for students who
identified as White and for students who did not identify as White.
Gogan and Atkins
The Journal of Writing Analytics Vol. 4 | 2020 77
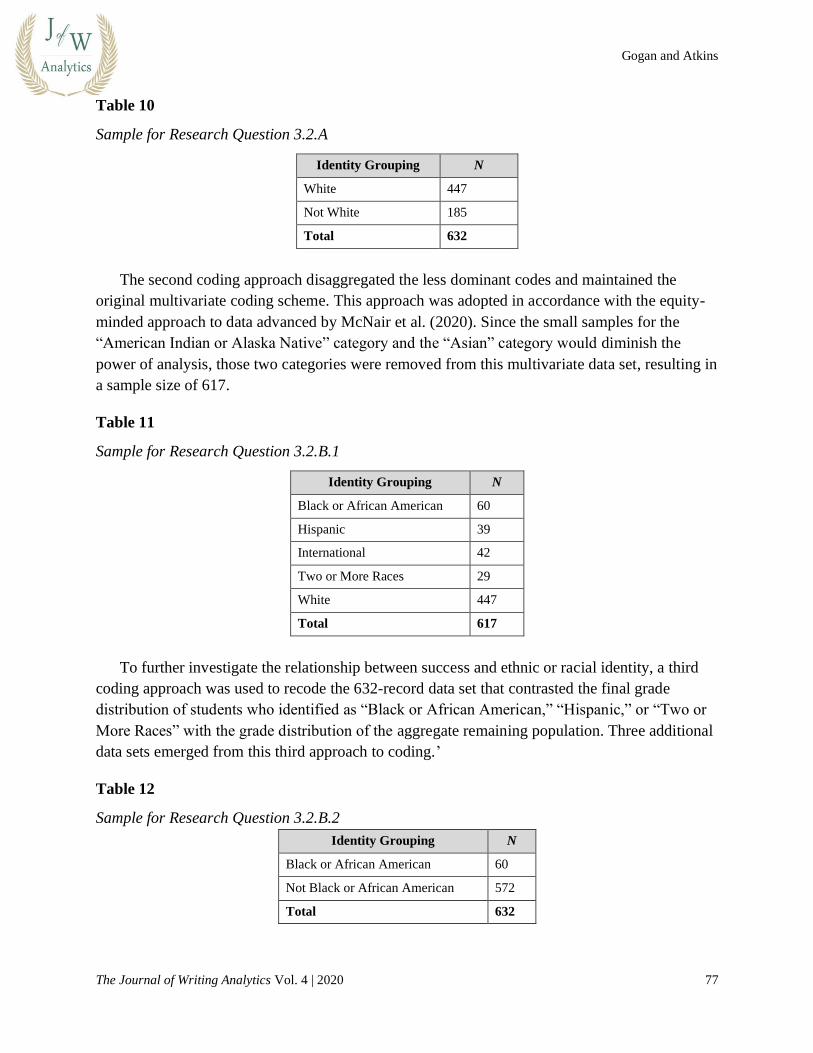
Table 10
Sample for Research Question 3.2.A
Identity Grouping N
White 447
Not White 185
Total 632
The second coding approach disaggregated the less dominant codes and maintained the
original multivariate coding scheme. This approach was adopted in accordance with the equity-
minded approach to data advanced by McNair et al. (2020). Since the small samples for the
“American Indian or Alaska Native” category and the “Asian” category would diminish the
power of analysis, those two categories were removed from this multivariate data set, resulting in
a sample size of 617.
Table 11
Sample for Research Question 3.2.B.1
Identity Grouping N
Black or African American 60
Hispanic 39
International 42
Two or More Races 29
White 447
Total 617
To further investigate the relationship between success and ethnic or racial identity, a third
coding approach was used to recode the 632-record data set that contrasted the final grade
distribution of students who identified as “Black or African American,” “Hispanic,” or “Two or
More Races” with the grade distribution of the aggregate remaining population. Three additional
data sets emerged from this third approach to coding.’
Table 12
Sample for Research Question 3.2.B.2
Identity Grouping N
Black or African American 60
Not Black or African American 572
Total 632
Peer Review Practice, Student Identity, and Success in a First-Year Writing Pilot Curriculum
The Journal of Writing Analytics Vol. 4 | 2020 78
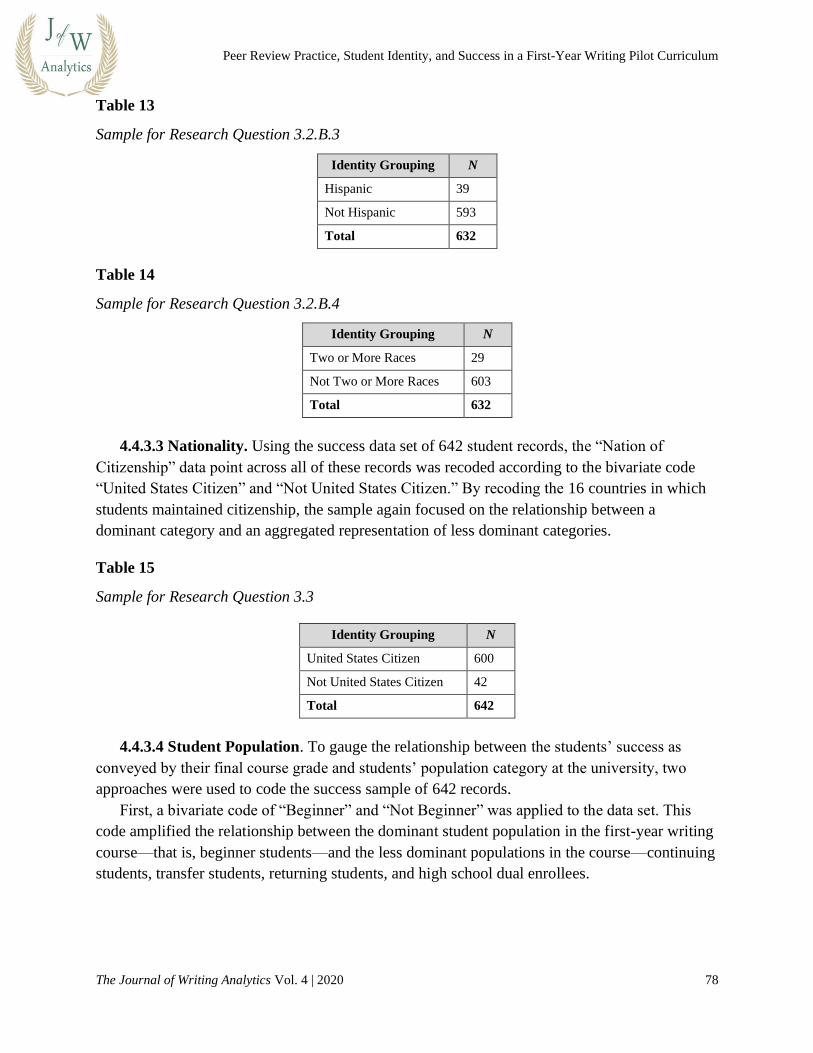
Table 13
Sample for Research Question 3.2.B.3
Identity Grouping N
Hispanic 39
Not Hispanic 593
Total 632
Table 14
Sample for Research Question 3.2.B.4
Identity Grouping N
Two or More Races 29
Not Two or More Races 603
Total 632
4.4.3.3 Nationality. Using the success data set of 642 student records, the “Nation of
Citizenship” data point across all of these records was recoded according to the bivariate code
“United States Citizen” and “Not United States Citizen.” By recoding the 16 countries in which
students maintained citizenship, the sample again focused on the relationship between a
dominant category and an aggregated representation of less dominant categories.
Table 15
Sample for Research Question 3.3
Identity Grouping N
United States Citizen 600
Not United States Citizen 42
Total 642
4.4.3.4 Student Population. To gauge the relationship between the students’ success as
conveyed by their final course grade and students’ population category at the university, two
approaches were used to code the success sample of 642 records.
First, a bivariate code of “Beginner” and “Not Beginner” was applied to the data set. This
code amplified the relationship between the dominant student population in the first-year writing
course—that is, beginner students—and the less dominant populations in the course—continuing
students, transfer students, returning students, and high school dual enrollees.
Gogan and Atkins
The Journal of Writing Analytics Vol. 4 | 2020 79
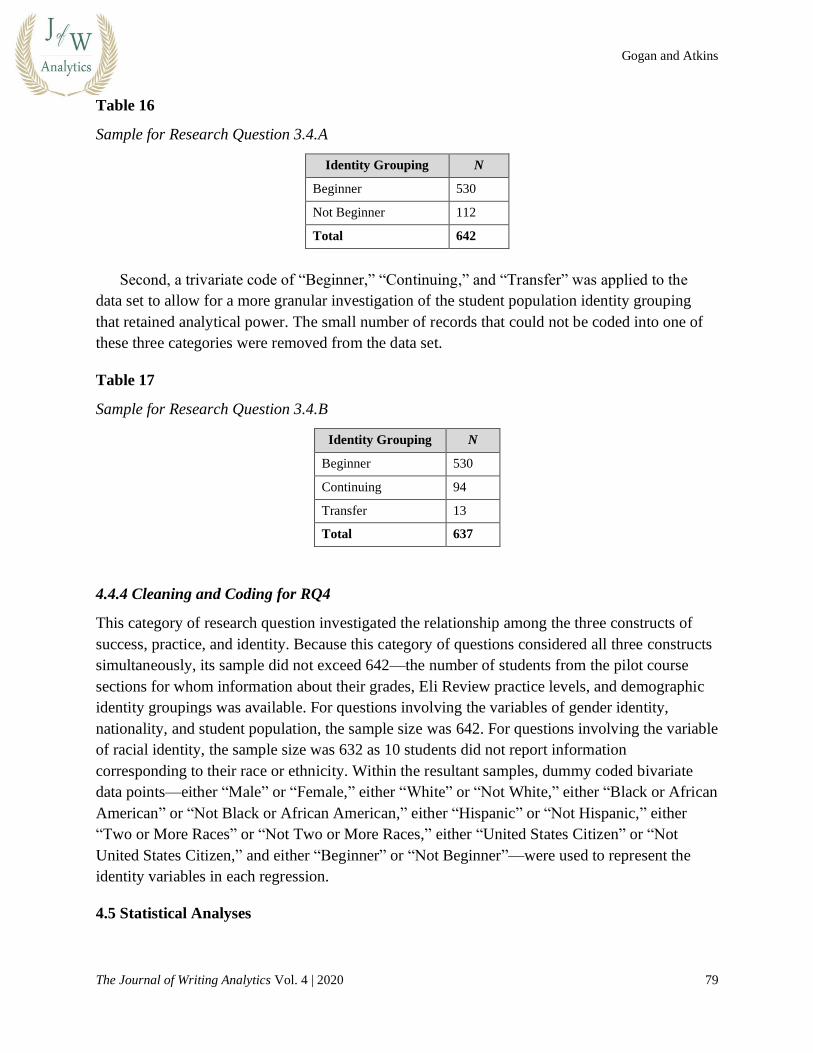
Table 16
Sample for Research Question 3.4.A
Identity Grouping N
Beginner 530
Not Beginner 112
Total 642
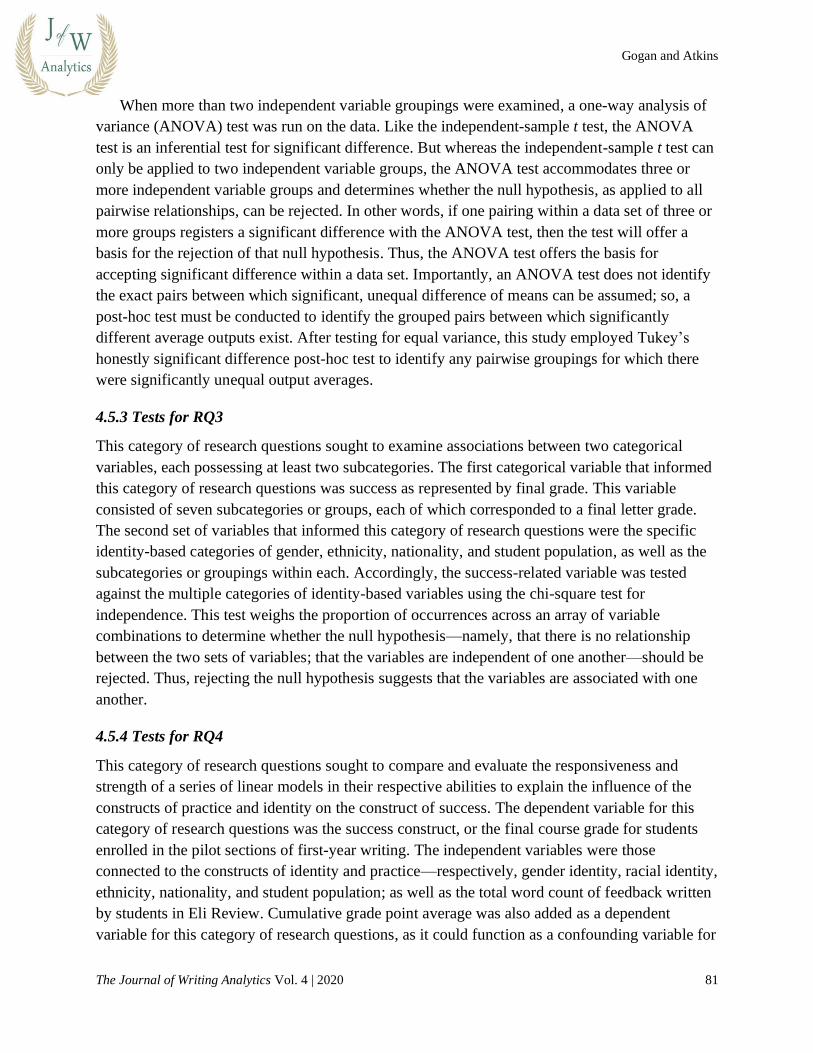
Second, a trivariate code of “Beginner,” “Continuing,” and “Transfer” was applied to the
data set to allow for a more granular investigation of the student population identity grouping
that retained analytical power. The small number of records that could not be coded into one of
these three categories were removed from the data set.
Table 17
Sample for Research Question 3.4.B
Identity Grouping N
Beginner 530
Continuing 94
Transfer 13
Total 637
4.4.4 Cleaning and Coding for RQ4
This category of research question investigated the relationship among the three constructs of
success, practice, and identity. Because this category of questions considered all three constructs
simultaneously, its sample did not exceed 642—the number of students from the pilot course
sections for whom information about their grades, Eli Review practice levels, and demographic
identity groupings was available. For questions involving the variables of gender identity,
nationality, and student population, the sample size was 642. For questions involving the variable
of racial identity, the sample size was 632 as 10 students did not report information
corresponding to their race or ethnicity. Within the resultant samples, dummy coded bivariate
data points—either “Male” or “Female,” either “White” or “Not White,” either “Black or African
American” or “Not Black or African American,” either “Hispanic” or “Not Hispanic,” either
“Two or More Races” or “Not Two or More Races,” either “United States Citizen” or “Not
United States Citizen,” and either “Beginner” or “Not Beginner”—were used to represent the
identity variables in each regression.
4.5 Statistical Analyses

Peer Review Practice, Student Identity, and Success in a First-Year Writing Pilot Curriculum
The Journal of Writing Analytics Vol. 4 | 2020 80
To answer this study’s three categories of research questions, a range of statistical analyses were
used on the data sets, including tests for correlation, tests for significant difference, and tests for
independence. Discrete tests were applied to each category of research question using the IBM
SPSS Statistics software platform, version 26.0.
4.5.1 Tests for RQ1
This category of research questions sought to describe the relationship between two numerical
variables. The first variable represented practice, and it reflected the total number of words that
each student provided in peer feedback using the Eli Review platform. The second variable
represented success, and it reflected the final grade earned by each student. These two variables
were tested for correlation to determine whether the null hypothesis—namely, that there is no
association between total word count value and final course grade—could be rejected. Further,
since these data could be rank ordered and since there was no assumption that their relationship
was neatly linear, Pearson’s correlation was used to test the strength and direction of any
correlation between the variables.
4.5.2 Tests for RQ2
This category of research questions sought to investigate a numerical data point as it could be
understood differently between and among different groupings. The dependent variable is the
numerical data point. For this category of research questions, the dependent variable is the
practice output of each student—that is, the total number of words that each student provided in
peer feedback using the Eli Review platform. The independent variable refers to the non-
numerical grouping categories. The independent variable reflects the different identity-based
groupings associated with gender, ethnicity, nationality, and student population. Notably, the
independent variables were discrete and unrelated within the data set—student record
information did not allow for records to contain multiple groupings within one particular
identity-based category. As such, the dependent variable was tested according to multiple
independent variable groupings to see if a significant difference existed in the outputs of the
different groups.
The kind of inferential statistical analysis performed on the various data sets was determined
by the number of independent variable groupings. When only two independent variable
groupings were examined, an independent-sample t test was run on the data. This test for
significant difference determines whether the null hypothesis—namely, that the output from both
groups is equal—can be rejected. The one variable t test examines the means or averages of the
outputs between the two groups, and it assumes that both independent variable groupings have
equal variance. Unequal variance would otherwise diminish the power of the t test and would
require a correction. To test for equal variance, Levene’s test of homogeneity was used. If the
independent-sample t test results offer a basis for rejecting the null hypothesis, then the
independent-sample t test suggests the alternative hypothesis—that the average output from the
two groups is unequal or significantly different.
Gogan and Atkins
The Journal of Writing Analytics Vol. 4 | 2020 81
When more than two independent variable groupings were examined, a one-way analysis of
variance (ANOVA) test was run on the data. Like the independent-sample t test, the ANOVA
test is an inferential test for significant difference. But whereas the independent-sample t test can
only be applied to two independent variable groups, the ANOVA test accommodates three or
more independent variable groups and determines whether the null hypothesis, as applied to all
pairwise relationships, can be rejected. In other words, if one pairing within a data set of three or
more groups registers a significant difference with the ANOVA test, then the test will offer a
basis for the rejection of that null hypothesis. Thus, the ANOVA test offers the basis for
accepting significant difference within a data set. Importantly, an ANOVA test does not identify
the exact pairs between which significant, unequal difference of means can be assumed; so, a
post-hoc test must be conducted to identify the grouped pairs between which significantly
different average outputs exist. After testing for equal variance, this study employed Tukey’s
honestly significant difference post-hoc test to identify any pairwise groupings for which there
were significantly unequal output averages.
4.5.3 Tests for RQ3
This category of research questions sought to examine associations between two categorical
variables, each possessing at least two subcategories. The first categorical variable that informed
this category of research questions was success as represented by final grade. This variable
consisted of seven subcategories or groups, each of which corresponded to a final letter grade.
The second set of variables that informed this category of research questions were the specific
identity-based categories of gender, ethnicity, nationality, and student population, as well as the
subcategories or groupings within each. Accordingly, the success-related variable was tested
against the multiple categories of identity-based variables using the chi-square test for
independence. This test weighs the proportion of occurrences across an array of variable
combinations to determine whether the null hypothesis—namely, that there is no relationship
between the two sets of variables; that the variables are independent of one another—should be
rejected. Thus, rejecting the null hypothesis suggests that the variables are associated with one
another.
4.5.4 Tests for RQ4
This category of research questions sought to compare and evaluate the responsiveness and
strength of a series of linear models in their respective abilities to explain the influence of the
constructs of practice and identity on the construct of success. The dependent variable for this
category of research questions was the success construct, or the final course grade for students
enrolled in the pilot sections of first-year writing. The independent variables were those
connected to the constructs of identity and practice—respectively, gender identity, racial identity,
ethnicity, nationality, and student population; as well as the total word count of feedback written
by students in Eli Review. Cumulative grade point average was also added as a dependent
variable for this category of research questions, as it could function as a confounding variable for
Peer Review Practice, Student Identity, and Success in a First-Year Writing Pilot Curriculum
The Journal of Writing Analytics Vol. 4 | 2020 82
the dependent variable of final course grade. The models tested in response to this category of
research questions were created stepwise, adding, first, an identity variable; second, the practice
variable; and, third, the confounding variable of cumulative grade point average.
Across regression models, the significance of the change in F values was tested to determine
whether the null hypothesis—that variable relationships were equal to chance relationships—
could be rejected. Change in F values that were at or below 0.05 and, therefore, were significant,
suggested that the alternative hypothesis, which holds that the independent variables can explain
the variance in the dependent variable in a way greater than chance, would therefore be accepted.
At the same time, comparisons in the R2 and Adjusted R2 values were made, allowing for the
selection of the model that could explain the highest amount of variance in the dependent
variable of success: The higher the R2 and Adjusted R2 values, the higher the explanatory value
for the model.
Within regression models, the individual variables were next analyzed for the change in
variance they brought to each step of the model. Individual variables were examined for their
influence on the slope of the regression: The B value communicates the slope of the line between
the independent variable and the dependent variable in the model. Within a particular regression
model, those variables with significant B values—at or below 0.05—could be understood to
contribute to the dependent variable in a way greater than that of chance. As such, the linear
models tested for this category of research questions yield results from which it may be claimed
that, within a strongly linear model, one or more independent variables explain or even predict
the dependent variable to a degree.
5.0 Results
Having collected, cleaned, and coded the necessary data to answer this study’s four categories of
research questions and having identified the statistical tests that would need to be performed on
this data to respond to these research questions, the tests for correlation, significant difference,
independence, and predictability were conducted. Overviews of the results of these tests are
presented below, within each category of research questions. The overview takes the form of a
table that lists the specific research questions that were asked as well as the types of statistical
tests that were run on the data to answer the questions. For tests where results were not
significant, summary results are only presented in these overview tables. For tests where results
were significant, full results are reported below each table.
5.1 Results of RQ1 Tests on Practice and Success
The tests performed on the first category of research questions address whether there was a
relationship between students’ writing practice providing peer feedback and students’ final
course grade. Practice was indicated by a number that represented students’ cumulative word
count for feedback given on Eli Review. Success was indicated by a number that corresponded to
the students’ final grades on a 4.0 scale. These data were tested for correlation and strength of
correlation.
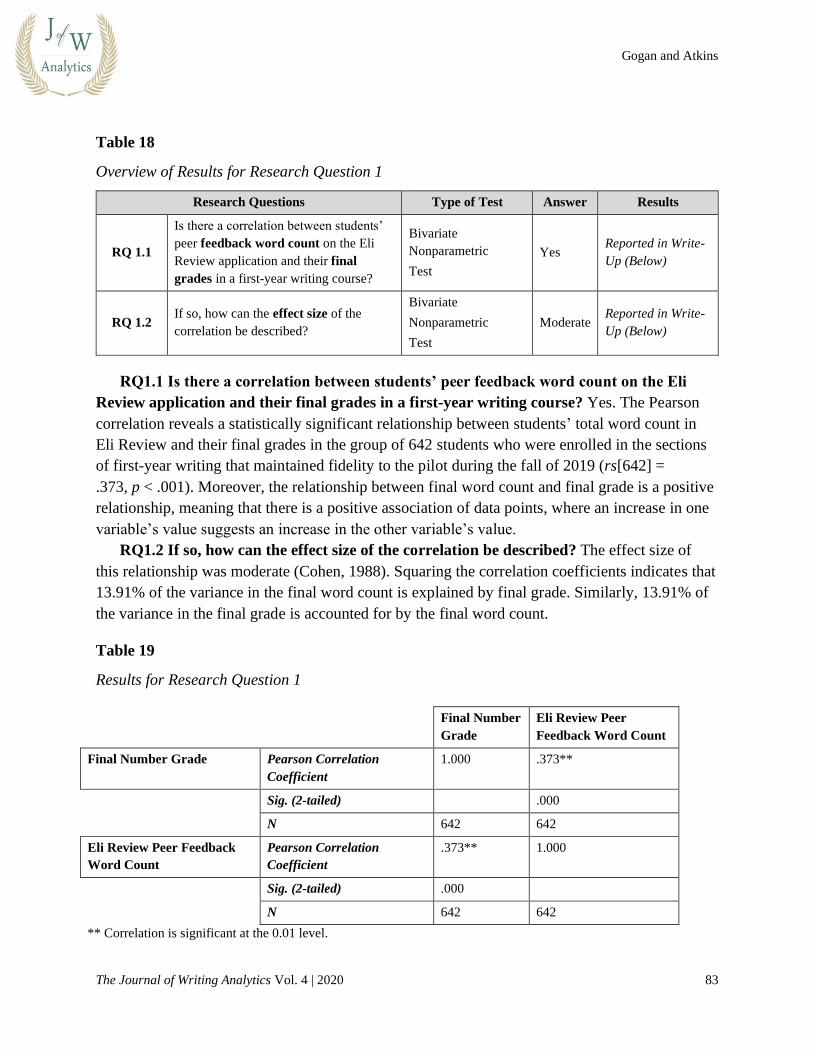
Gogan and Atkins
The Journal of Writing Analytics Vol. 4 | 2020 83
Table 18
Overview of Results for Research Question 1
Research Questions Type of Test Answer Results
RQ 1.1
Is there a correlation between students’
peer feedback word count on the Eli
Review application and their final
grades in a first-year writing course?
Bivariate
Nonparametric
Test
Yes Reported in Write-
Up (Below)
RQ 1.2 If so, how can the effect size of the
correlation be described?
Bivariate
Nonparametric
Test
Moderate Reported in Write-
Up (Below)
RQ1.1 Is there a correlation between students’ peer feedback word count on the Eli
Review application and their final grades in a first-year writing course? Yes. The Pearson
correlation reveals a statistically significant relationship between students’ total word count in
Eli Review and their final grades in the group of 642 students who were enrolled in the sections
of first-year writing that maintained fidelity to the pilot during the fall of 2019 (rs[642] =
.373, p < .001). Moreover, the relationship between final word count and final grade is a positive
relationship, meaning that there is a positive association of data points, where an increase in one
variable’s value suggests an increase in the other variable’s value.
RQ1.2 If so, how can the effect size of the correlation be described? The effect size of
this relationship was moderate (Cohen, 1988). Squaring the correlation coefficients indicates that
13.91% of the variance in the final word count is explained by final grade. Similarly, 13.91% of
the variance in the final grade is accounted for by the final word count.
Table 19
Results for Research Question 1
Final Number
Grade
Eli Review Peer
Feedback Word Count
Final Number Grade Pearson Correlation
Coefficient
1.000 .373**
Sig. (2-tailed) .000
N 642 642
Eli Review Peer Feedback
Word Count
Pearson Correlation
Coefficient
.373** 1.000
Sig. (2-tailed) .000
N 642 642
** Correlation is significant at the 0.01 level.
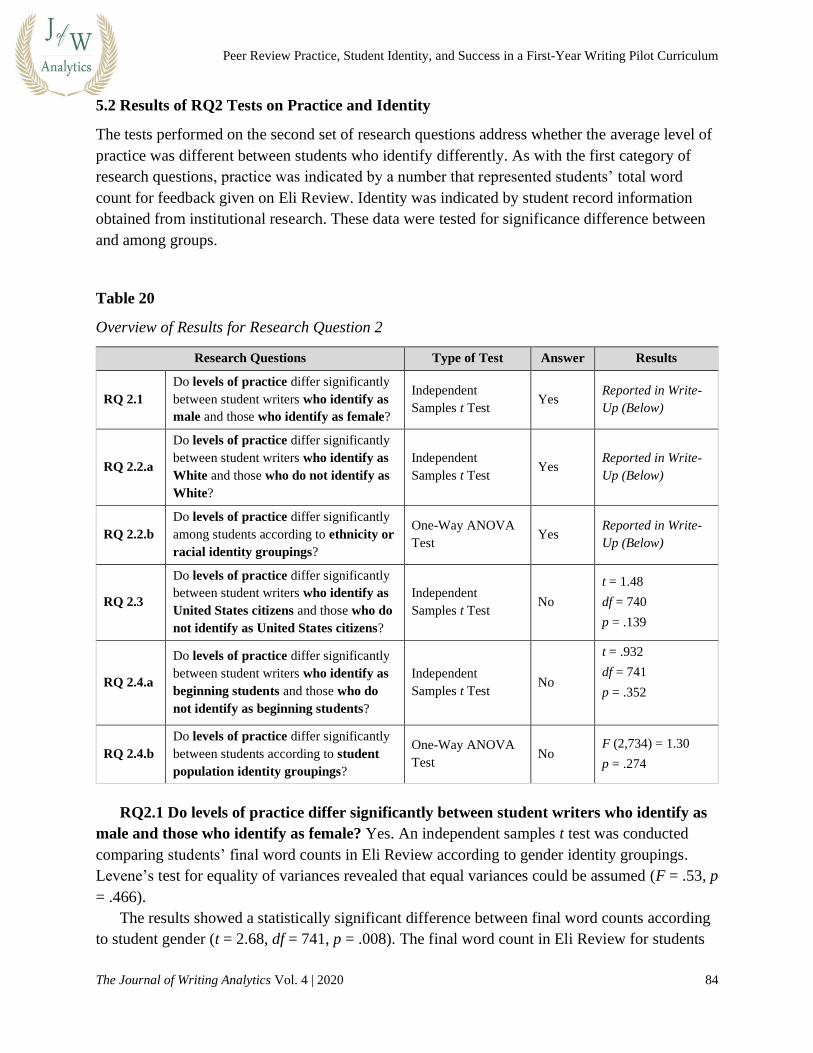
Peer Review Practice, Student Identity, and Success in a First-Year Writing Pilot Curriculum
The Journal of Writing Analytics Vol. 4 | 2020 84
5.2 Results of RQ2 Tests on Practice and Identity
The tests performed on the second set of research questions address whether the average level of
practice was different between students who identify differently. As with the first category of
research questions, practice was indicated by a number that represented students’ total word
count for feedback given on Eli Review. Identity was indicated by student record information
obtained from institutional research. These data were tested for significance difference between
and among groups.
Table 20
Overview of Results for Research Question 2
Research Questions Type of Test Answer Results
RQ 2.1
Do levels of practice differ significantly
between student writers who identify as
male and those who identify as female?
Independent
Samples t Test Yes
Reported in Write-
Up (Below)
RQ 2.2.a
Do levels of practice differ significantly
between student writers who identify as
White and those who do not identify as
White?
Independent
Samples t Test Yes
Reported in Write-
Up (Below)
RQ 2.2.b
Do levels of practice differ significantly
among students according to ethnicity or
racial identity groupings?
One-Way ANOVA
Test Yes
Reported in Write-
Up (Below)
RQ 2.3
Do levels of practice differ significantly
between student writers who identify as
United States citizens and those who do
not identify as United States citizens?
Independent
Samples t Test No
t = 1.48
df = 740
p = .139
RQ 2.4.a
Do levels of practice differ significantly
between student writers who identify as
beginning students and those who do
not identify as beginning students?
Independent
Samples t Test No
t = .932
df = 741
p = .352
RQ 2.4.b
Do levels of practice differ significantly
between students according to student
population identity groupings?
One-Way ANOVA
Test No
F (2,734) = 1.30
p = .274
RQ2.1 Do levels of practice differ significantly between student writers who identify as
male and those who identify as female? Yes. An independent samples t test was conducted
comparing students’ final word counts in Eli Review according to gender identity groupings.
Levene’s test for equality of variances revealed that equal variances could be assumed (F = .53, p
= .466).
The results showed a statistically significant difference between final word counts according
to student gender (t = 2.68, df = 741, p = .008). The final word count in Eli Review for students
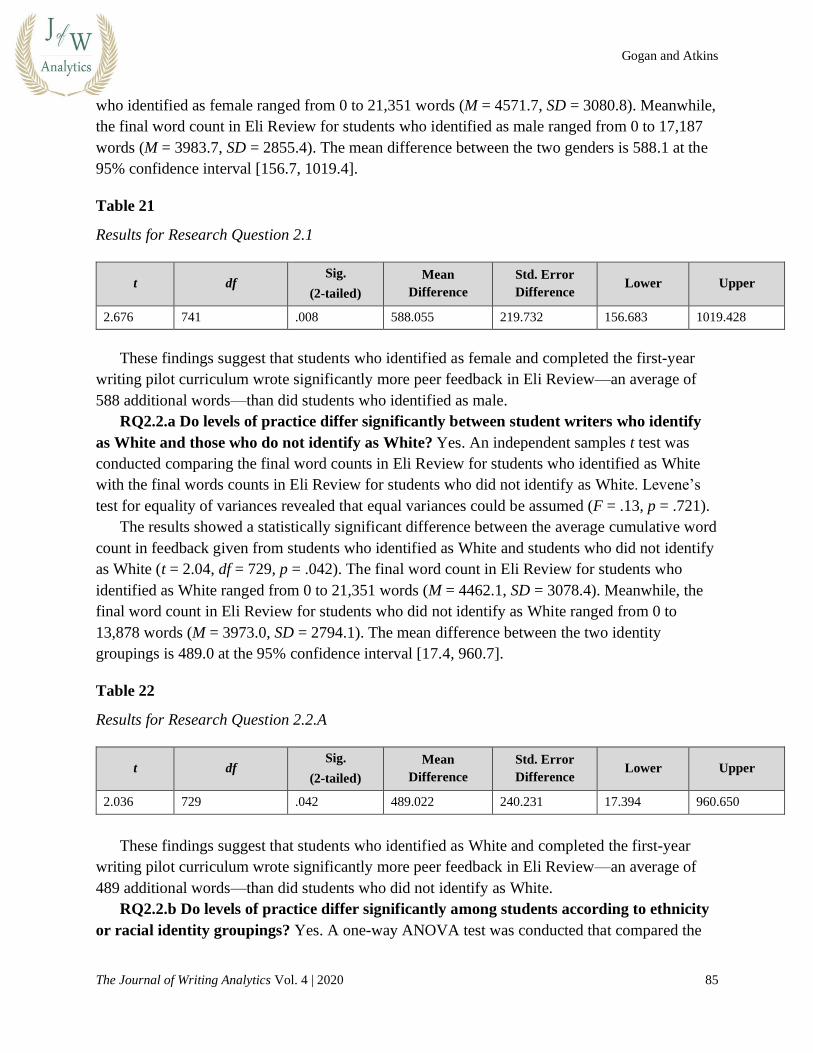
Gogan and Atkins
The Journal of Writing Analytics Vol. 4 | 2020 85
who identified as female ranged from 0 to 21,351 words (M = 4571.7, SD = 3080.8). Meanwhile,
the final word count in Eli Review for students who identified as male ranged from 0 to 17,187
words (M = 3983.7, SD = 2855.4). The mean difference between the two genders is 588.1 at the
95% confidence interval [156.7, 1019.4].
Table 21
Results for Research Question 2.1
t df Sig.
(2-tailed)
Mean
Difference
Std. Error
Difference Lower Upper
2.676 741 .008 588.055 219.732 156.683 1019.428
These findings suggest that students who identified as female and completed the first-year
writing pilot curriculum wrote significantly more peer feedback in Eli Review—an average of
588 additional words—than did students who identified as male.
RQ2.2.a Do levels of practice differ significantly between student writers who identify
as White and those who do not identify as White? Yes. An independent samples t test was
conducted comparing the final word counts in Eli Review for students who identified as White
with the final words counts in Eli Review for students who did not identify as White. Levene’s
test for equality of variances revealed that equal variances could be assumed (F = .13, p = .721).
The results showed a statistically significant difference between the average cumulative word
count in feedback given from students who identified as White and students who did not identify
as White (t = 2.04, df = 729, p = .042). The final word count in Eli Review for students who
identified as White ranged from 0 to 21,351 words (M = 4462.1, SD = 3078.4). Meanwhile, the
final word count in Eli Review for students who did not identify as White ranged from 0 to
13,878 words (M = 3973.0, SD = 2794.1). The mean difference between the two identity
groupings is 489.0 at the 95% confidence interval [17.4, 960.7].
Table 22
Results for Research Question 2.2.A
t df Sig.
(2-tailed)
Mean
Difference
Std. Error
Difference Lower Upper
2.036 729 .042 489.022 240.231 17.394 960.650
These findings suggest that students who identified as White and completed the first-year
writing pilot curriculum wrote significantly more peer feedback in Eli Review—an average of
489 additional words—than did students who did not identify as White.
RQ2.2.b Do levels of practice differ significantly among students according to ethnicity
or racial identity groupings? Yes. A one-way ANOVA test was conducted that compared the
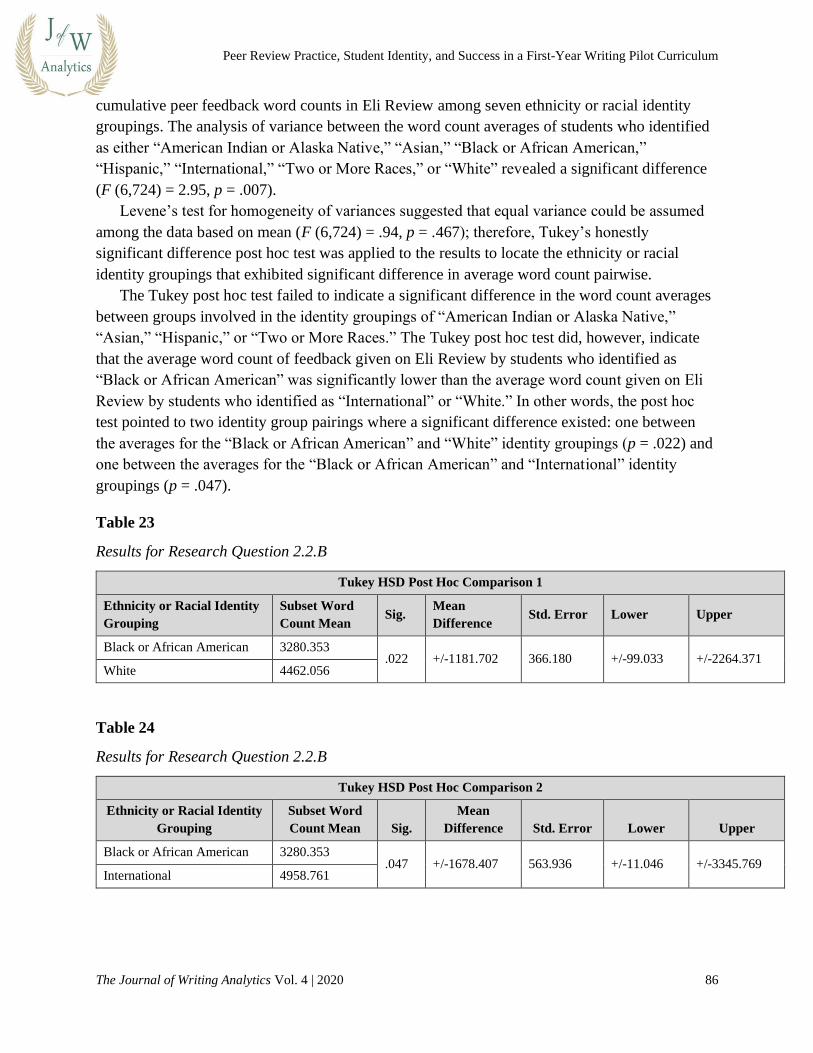
Peer Review Practice, Student Identity, and Success in a First-Year Writing Pilot Curriculum
The Journal of Writing Analytics Vol. 4 | 2020 86
cumulative peer feedback word counts in Eli Review among seven ethnicity or racial identity
groupings. The analysis of variance between the word count averages of students who identified
as either “American Indian or Alaska Native,” “Asian,” “Black or African American,”
“Hispanic,” “International,” “Two or More Races,” or “White” revealed a significant difference
(F (6,724) = 2.95, p = .007).
Levene’s test for homogeneity of variances suggested that equal variance could be assumed
among the data based on mean (F (6,724) = .94, p = .467); therefore, Tukey’s honestly
significant difference post hoc test was applied to the results to locate the ethnicity or racial
identity groupings that exhibited significant difference in average word count pairwise.
The Tukey post hoc test failed to indicate a significant difference in the word count averages
between groups involved in the identity groupings of “American Indian or Alaska Native,”
“Asian,” “Hispanic,” or “Two or More Races.” The Tukey post hoc test did, however, indicate
that the average word count of feedback given on Eli Review by students who identified as
“Black or African American” was significantly lower than the average word count given on Eli
Review by students who identified as “International” or “White.” In other words, the post hoc
test pointed to two identity group pairings where a significant difference existed: one between
the averages for the “Black or African American” and “White” identity groupings (p = .022) and
one between the averages for the “Black or African American” and “International” identity
groupings (p = .047).
Table 23
Results for Research Question 2.2.B
Tukey HSD Post Hoc Comparison 1
Ethnicity or Racial Identity
Grouping
Subset Word
Count Mean Sig.
Mean
Difference Std. Error Lower Upper
Black or African American 3280.353 .022 +/-1181.702 366.180 +/-99.033 +/-2264.371
White 4462.056
Table 24
Results for Research Question 2.2.B
Tukey HSD Post Hoc Comparison 2
Ethnicity or Racial Identity
Grouping
Subset Word
Count Mean Sig.
Mean
Difference Std. Error Lower Upper
Black or African American 3280.353 .047 +/-1678.407 563.936 +/-11.046 +/-3345.769
International 4958.761

Gogan and Atkins
The Journal of Writing Analytics Vol. 4 | 2020 87
As Table 23 suggests, students who identified as “White” wrote significantly more peer
feedback in Eli Review—an average of 1,181 additional words—than did students who
identified as “Black or African American.” Likewise, as Table 24 suggests, students who
identified as “International” wrote significantly more peer feedback in Eli Review—an average
of 1,678 additional words—than did students who identified as “Black or African American.”
5.3 Results of RQ3 Tests on Success and Identity
The tests performed on the third category of research questions address whether there is an
association between success variables and identity variables. For these tests, success was
indicated by one of seven letter grades that corresponded to a final course grade earned by a
student. Identity was indicated by student record information, as understood as a bivariate or
multivariate data set. The distributions of students’ final grades across identity-based variable
groupings were compared to detect associations between the variables or to confirm the
independence of variables.
Table 25
Overview of Results for Research Question 3
Research Question Type of Test Answer Results
RQ 3.1
Is there an association between students’
gender identity and their final grades in
a first-year writing course?
Chi-Square Test of
Independence Yes
Reported in Write-Up
(Below)
RQ 3.2.a
Is there an association between students’
identification vis-à-vis dominant ethnic
or racial groupings and their final
grades in a first-year writing course?
Chi-Square Test of
Independence No
2 (6, N = 632) = 8.70
p = .191
RQ 3.2.b
Is there an association between students’
ethnic and racial identity and their final
grades in a first-year writing course?
Chi-Square Test of
Independence No
2 (24, N = 617) =
29.79
p = .192
RQ 3.3
Is there an association between students’
national identity and their final grades
in a first-year writing course?
Chi-Square Test of
Independence No
2 (6, N = 642) = 5.11
p = .530
RQ 3.4.a
Is there an association between students’
identification vis-à-vis dominant
student population groupings and their
final grades in a first-year writing
course?
Chi-Square Test of
Independence No
2 (6, N = 642) = 1.27
p = .973
RQ 3.4.b
Is there an association between students’
student population identity and their
final grades in a first-year writing
course?
Chi-Square Test of
Independence No
2 (12, N = 637) =
9.74
p = .638
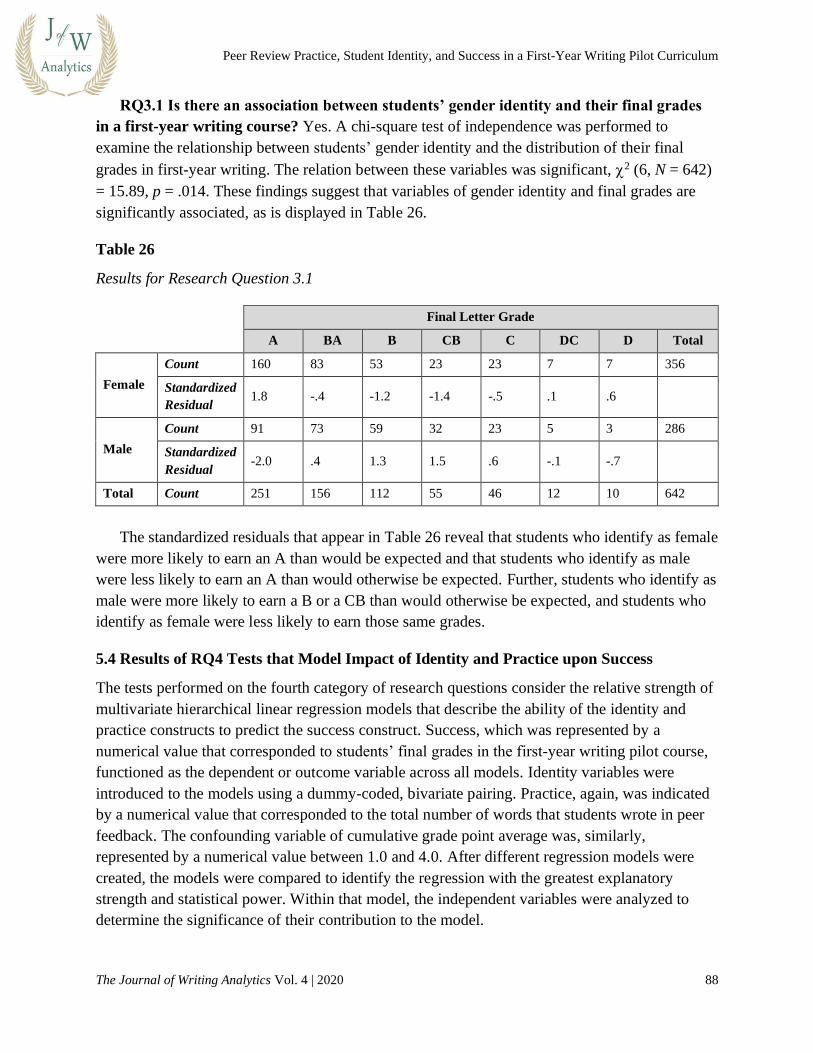
Peer Review Practice, Student Identity, and Success in a First-Year Writing Pilot Curriculum
The Journal of Writing Analytics Vol. 4 | 2020 88
RQ3.1 Is there an association between students’ gender identity and their final grades
in a first-year writing course? Yes. A chi-square test of independence was performed to
examine the relationship between students’ gender identity and the distribution of their final
grades in first-year writing. The relation between these variables was significant, 2 (6, N = 642)
= 15.89, p = .014. These findings suggest that variables of gender identity and final grades are
significantly associated, as is displayed in Table 26.
Table 26
Results for Research Question 3.1
Final Letter Grade
A BA B CB C DC D Total
Female
Count 160 83 53 23 23 7 7 356
Standardized
Residual 1.8 -.4 -1.2 -1.4 -.5 .1 .6
Male
Count 91 73 59 32 23 5 3 286
Standardized
Residual -2.0 .4 1.3 1.5 .6 -.1 -.7
Total Count 251 156 112 55 46 12 10 642
The standardized residuals that appear in Table 26 reveal that students who identify as female
were more likely to earn an A than would be expected and that students who identify as male
were less likely to earn an A than would otherwise be expected. Further, students who identify as
male were more likely to earn a B or a CB than would otherwise be expected, and students who
identify as female were less likely to earn those same grades.
5.4 Results of RQ4 Tests that Model Impact of Identity and Practice upon Success
The tests performed on the fourth category of research questions consider the relative strength of
multivariate hierarchical linear regression models that describe the ability of the identity and
practice constructs to predict the success construct. Success, which was represented by a
numerical value that corresponded to students’ final grades in the first-year writing pilot course,
functioned as the dependent or outcome variable across all models. Identity variables were
introduced to the models using a dummy-coded, bivariate pairing. Practice, again, was indicated
by a numerical value that corresponded to the total number of words that students wrote in peer
feedback. The confounding variable of cumulative grade point average was, similarly,
represented by a numerical value between 1.0 and 4.0. After different regression models were
created, the models were compared to identify the regression with the greatest explanatory
strength and statistical power. Within that model, the independent variables were analyzed to
determine the significance of their contribution to the model.
Gogan and Atkins
The Journal of Writing Analytics Vol. 4 | 2020 89
Table 27
Overview of Results for Research Question 4
Research Questions Type of Test Answer Results
RQ 4.1
Can a linear model significantly account
for the influence of practice and
identity on success in the pilot
curriculum?
Multivariate
Hierarchical Linear
Regression
Yes Reported in Write-
Up (Below)
RQ 4.2
Does the practice variable emerge as
more significant than the identity
variable in the stepwise regression
model?
Multivariate
Hierarchical Linear
Regression
Yes Reported in Write-
Up (Below)
RQ4.1 Can a linear model significantly account for the influence of practice and
identity on success in the pilot curriculum? Yes. A three-step multiple regression model with
the three predictor variables of (1) gender identity, (2) total word count for feedback given in
peer review, and (3) cumulative grade point average exhibits a stepwise increase in its ability to
explain variance in the dependent variable of final course grade. By its third step, the model
produces a multiple correlation coefficient of .749, which suggests that the model taking gender
identity, total word count in feedback, and cumulative grade point average accounts for 56.1% of
the variance in students’ final grades in the sample R2 = .561, F (3, 638) = 271.58, p < .001.
Walking through the model’s steps highlights the change in variance that the independent
variables of total word count and cumulative grade point average contribute to the model. At step
one, the independent variable of gender identity explained less than 1% of the variance in
students’ final grades R2 = .009, F (1, 640) = 5.69, p = .017. At step two, when the independent
variable of the total word count in feedback that students provided via Eli Review was added to
the model, the model’s explanatory power increased. Taken together, the independent variables
of gender identity and practice explained 14.2% of the variance in the outcome variable R2 =
.142, F (2, 639) = 53.072, p < .001. Thus, adding the practice variable enables the model to
account for an additional 13.4% of variance in success. At step three, the confounding variable of
cumulative grade point average is introduced into the model, further increasing the model’s
ability to explain variance in students’ final course grades by an additional 41.8%. By the third
step, the model accounts for 56.1% variance in the outcome variable. Notably, this model’s
combination of gender identity, total word count of feedback given, and cumulative grade point
average exhibited more explanatory power than any other model using a different identity
variable, such as racial identity, ethnicity, nationality, or student population.
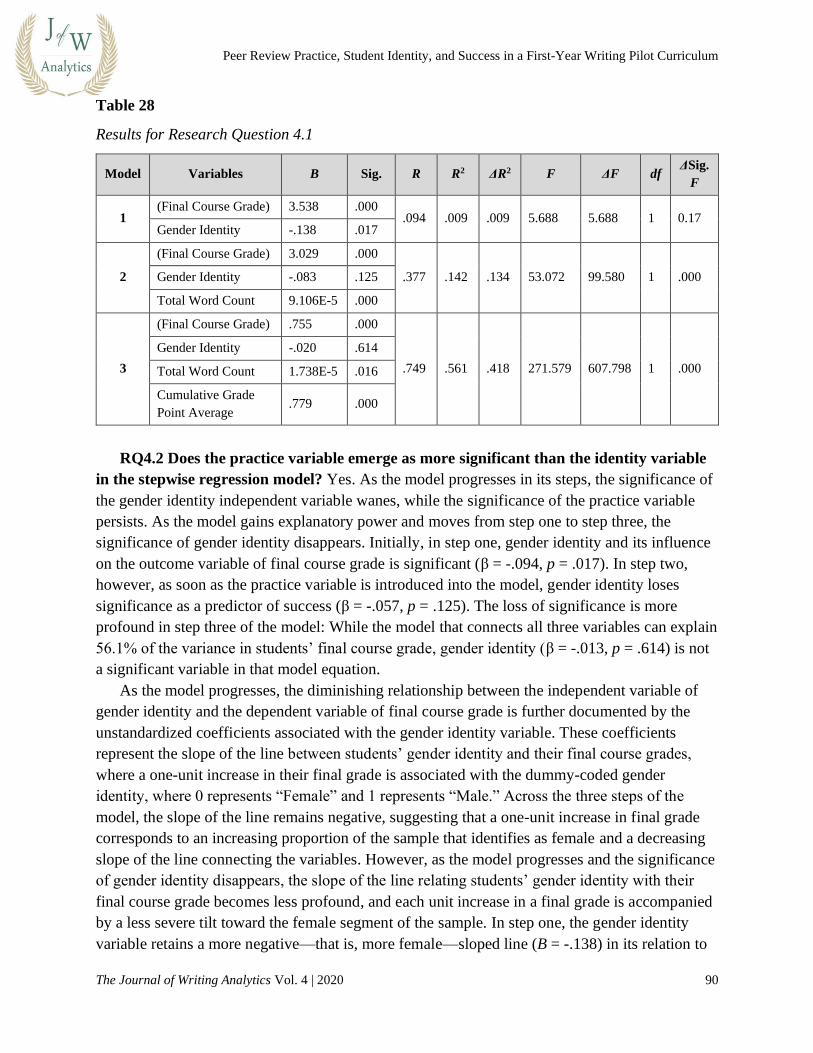
Peer Review Practice, Student Identity, and Success in a First-Year Writing Pilot Curriculum
The Journal of Writing Analytics Vol. 4 | 2020 90
Table 28
Results for Research Question 4.1
Model Variables B Sig. R R2 ΔR2 F ΔF df ΔSig.
F
1 (Final Course Grade) 3.538 .000
.094 .009 .009 5.688 5.688 1 0.17 Gender Identity -.138 .017
2
(Final Course Grade) 3.029 .000
.377 .142 .134 53.072 99.580 1 .000 Gender Identity -.083 .125
Total Word Count 9.106E-5 .000
3
(Final Course Grade) .755 .000
.749 .561 .418 271.579 607.798 1 .000
Gender Identity -.020 .614
Total Word Count 1.738E-5 .016
Cumulative Grade
Point Average .779 .000
RQ4.2 Does the practice variable emerge as more significant than the identity variable
in the stepwise regression model? Yes. As the model progresses in its steps, the significance of
the gender identity independent variable wanes, while the significance of the practice variable
persists. As the model gains explanatory power and moves from step one to step three, the
significance of gender identity disappears. Initially, in step one, gender identity and its influence
on the outcome variable of final course grade is significant (β = -.094, p = .017). In step two,
however, as soon as the practice variable is introduced into the model, gender identity loses
significance as a predictor of success (β = -.057, p = .125). The loss of significance is more
profound in step three of the model: While the model that connects all three variables can explain
56.1% of the variance in students’ final course grade, gender identity (β = -.013, p = .614) is not
a significant variable in that model equation.
As the model progresses, the diminishing relationship between the independent variable of
gender identity and the dependent variable of final course grade is further documented by the
unstandardized coefficients associated with the gender identity variable. These coefficients
represent the slope of the line between students’ gender identity and their final course grades,
where a one-unit increase in their final grade is associated with the dummy-coded gender
identity, where 0 represents “Female” and 1 represents “Male.” Across the three steps of the
model, the slope of the line remains negative, suggesting that a one-unit increase in final grade
corresponds to an increasing proportion of the sample that identifies as female and a decreasing
slope of the line connecting the variables. However, as the model progresses and the significance
of gender identity disappears, the slope of the line relating students’ gender identity with their
final course grade becomes less profound, and each unit increase in a final grade is accompanied
by a less severe tilt toward the female segment of the sample. In step one, the gender identity
variable retains a more negative—that is, more female—sloped line (B = -.138) in its relation to
Gogan and Atkins
The Journal of Writing Analytics Vol. 4 | 2020 91
final course grade than it does in step two (B = -.83) or than it does, later, in step three (B = -
.020). Put differently, the slope of the relationship between gender identity and final course grade
levels as the model becomes more complex and as gender identity loses statistical significances
as a predictor.
While the variable of gender identity becomes less and less significant as the regression
model progresses stepwise, the variable of total word count in feedback given is significant when
it is introduced into the model during step two, and it retains significance in step three when the
confounding variable of cumulative grade point average is introduced. In step two—when total
word count in the feedback students give to each other using Eli Review is introduced into the
regression model—the dependent variable of total word count emerges as a significant positive
predictor of students’ final course grade (β = .367, p < .001). Moreover, when the model’s
explanatory power is increased from explaining 14.2% of the variance in the dependent variable
in step two to explaining 56.1% of the variance in the dependent variable in step three, the
independent variable of total word count in Eli Review feedback given remains a significant
positive predictor of students’ final course grades (β = .070, p = .016). In both of these
regressions, an increase in one unit of the final course grade is accompanied by an increase in the
total word count.
Although the independent variable of total word count given in feedback remains a
significant and positive predictor of students’ final course grades, the slope of the line relating
these two variables decreases as the model moves from step two (B = .00009106) to step three (B
= .00001738). In other words, the relationship between practice and success is significantly
positive across both models, but more so in step two of the model than in step three of the model.
In the end, the fact that the identity variable loses its statistical significance and the practice
variable retains its significance as the model progresses suggests that the regression model might
be simplified to focus only on the practice variable and the confounding variable of cumulative
grade point average. Indeed, when gender identity is removed from the model, the resultant
model possesses similar explanatory power as the step three model that included gender identity
R2 = .561, F (2, 639) = 407.718, p < .001. Differences between the two models can be found in
the degrees of freedom and the F value associated with the model as well as with the significance
and slopes of the variables. When gender identity is removed from the regression model, the
practice variable accrues more significance (β = .071, p = .014) and a steeper positive slope (B =
.00001761) in relation to the outcome variable. Nonetheless, in this simplified regression model,
the total count of words given in feedback by students explains 13.9% of the variance in their
final course grade.

Peer Review Practice, Student Identity, and Success in a First-Year Writing Pilot Curriculum
The Journal of Writing Analytics Vol. 4 | 2020 92
Table 29
Simplified Model for Research Question 4.1
Variables B Sig. R R2 F df Sig.
F Change
(Final Course Grade) .723 .000
.749 .561 407.718 1 .000 Total Word Count 1.761E-5 .014
Cumulative Grade Point Average .780 .000
6.0 Discussion
The results of this study point toward three concentrated areas of notable findings: (1) the
correlations between total peer feedback word count and final course grade; (2) the significant
differences—though not as a predictor variable—between peer feedback word count total, final
course grade, and student gender identity; and (3) the significant difference in the total word
count of peer feedback given among various ethnicity or racial identity groupings. At the same
time, these results reveal that the current study is limited by its narrow definition of constructs,
by its focus on one semester’s worth of student feedback, and by potential variance in Eli
Review review task prompt instructions.
6.1 Interpretation of Results
A review of this study’s results points to three concentrated areas of notable findings, each of
which suggests statistically significant relationships between the study’s constructs.
6.1.1 Intensity of Peer Review Practice Correlated with Course Success
The results of this study reveal a substantial correlation between the total number of words that
students give in peer feedback and their final grade in first-year writing, whereby nearly 14% of
the variance in each variable is explained by the other variable. Here, the suggestion is that the
more intensely students practice providing feedback, the higher their grade will be in their first-
year writing course. In other words, this finding supports the assertion that writing is improved
through more sustained practice and regular engagement with peer review feedback cycles.
From a programmatic standpoint, these results are remarkable—first, for their reach and
second, for their impact. First, the reach of this finding deserves remark: Out of every ten
students who completed the first-year writing pilot curriculum, the final grade of at least one of
these students can theoretically be explained by the number of words in feedback they
contributed to their peers using Eli Review. That one repeated pedagogical practice can impact
the success of nearly 14 percent of students in a first-year writing course should capture the
attention of any writing educator, especially those serving as writing program administrators and
leading the design of pedagogies that reach large numbers of students across multiple sections.

Gogan and Atkins
The Journal of Writing Analytics Vol. 4 | 2020 93
Concentrating pedagogy on and devoting time and space to peer review constitutes a major way
that writing educators can help a sizable proportion of students improve upon their course grade.
Second, what is perhaps more remarkable is that the impact of this positive correlation
exceeds the maximum impact that would be expected, given the pilot curriculum’s grade
weighting. Across sections of first-year writing, Eli Review task cycles were only weighted a
combined total of 10 percent of a student’s final grade. Further, the recommendation was for
instructors to award points for review task completion, meaning that if a student completed the
task, that student would receive full points for the task. Thus, during the same review task, a
student giving 350 words of feedback to one peer could quite feasibly earn the same percentage-
toward-a-final-grade as a student giving 1,000 words of feedback to two peers. By and large,
grades were not, in other words, based upon the amount of feedback, nor were they based upon
the quality of that feedback. Since Eli Review tasks were weighted in such a way to impact the
students’ grades only minimally, it was possible for a student to complete very few—or even
none—of the Eli Review tasks and still receive a grade of BA for the course. Whereas an effect
size of 10 percent would have potentially been explained by the course grade weighting, an
effect size of almost 14 percent defies this expectation. In the end, the practice variable carries
almost 1.5 times more influence on the final course grade than the syllabus allots it.
6.1.2 Levels of Practice Differentiated by and Levels of Success Associated with Gender
Identity
The results of this study also draw a significant contrast between the students who identify as
female and the students who identify as male, yet they do not position gender identity as a
significant predictor of success in the pilot curriculum.
When tested pairwise, the three constructs of practice, success, and identity constellate in a
way that suggests that, with respect to the pilot curriculum, the average performance of students
who identify as female is more educationally positive than that of those who identify as male. In
regards to practice, students who identified as female provided peers with almost 590 more
words in cumulative feedback than did students who identified as male. In regards to success,
students who identified as female were significantly more likely than expected to receive an A in
the course.
Noting the positive correlation between the total number of words in feedback given via Eli
Review and the final course grade, while also recognizing the bivariate nature of the gender
identity grouping, it is perhaps not surprising that one gender identity grouping has more positive
performances across both constructs. This finding aligns with the finding that more intense
practice can explain a higher course grade. The suggestion that, on average, females practiced
with more intensity and achieved at higher levels than did males does not, of course, mean that
gender identity caused more or less intense practice levels or higher or lower achievement levels.
In fact, the hierarchical multivariate linear regression model with the most explanatory power
points to the opposite conclusion: Gender identity is not a significant predictor of final course
grade when it is viewed alongside the total number of words given in peer feedback and the

Peer Review Practice, Student Identity, and Success in a First-Year Writing Pilot Curriculum
The Journal of Writing Analytics Vol. 4 | 2020 94
confounding variable of cumulative grade point average. Nonetheless, this finding raises
questions about gender equity in the pilot curriculum; it calls for change in practice and compels
further research.
6.1.3 Levels of Practice Differentiated by Ethnicity or Racial Identity
Finally, the results of this study point to significant differences in the peer review intensity levels
practiced by students who identified with various ethnicity or racial identity groupings and who
participated in the pilot curriculum, but again, they do not position ethnicity or racial identity as a
significant predictor of success in the pilot curriculum.
Significant differences were revealed when the data were viewed through a bivariate coding
scheme, comparing the dominant grouping with the aggregate of the less dominant groupings—
that is, comparing the practice levels of students who identified as White to the levels of students
who did not identify as White.
Further, significant variance was revealed between two identity group pairings involving
three of the seven ethnicity or racial identity groupings: “Black or African American,”
“International,” and “White.” Together, the significant difference and significant variance show
that all ethnicity or racial identity groupings did not practice peer review at equal levels of
intensity in the curriculum’s first pilot term.
At first glance, the disparities in average levels of practice between and among ethnicity or
racial identity groupings should be concerning—especially so, in light of the correlation between
practice and success discussed previously. This correlation suggests that, as word counts increase
or decrease, grades do the same. Given the correlation between the total number of words that
students give in peer feedback and their final grade in first-year writing, the expectation might be
that students who identify with ethnic or racial groups that, on average, wrote significantly more
words of peer feedback might also be more likely than expected to receive higher final course
grades.
However, the correlation between practice and success does not hold when ethnicity or racial
identity groupings are examined. The significant difference in the average word count totals of
those students who identify as White and those students who do not identify as White does not
manifest as a significant association in terms of final grade distribution. Students who identify as
White are not significantly more likely to receive higher final grades than students who do not
identify as White. Similarly, there are no significant associations between the variable groupings
of “Black or African American,” “International,” or “White” and the final course grade
distribution. Put differently, the test results do not require a rejection of the null hypothesis. The
indication is that the variables of final grade and ethnicity or racial identity are independent of
one another. Here, too, is where an examination of the quality—in addition to the quantity—of
the peer review practice might be particularly helpful in explaining why the difference in practice
levels does not manifest as an association in grade distribution.
Even though the correlation between practice and success does not significantly manifest
across ethnicity or racial identity groupings, there is still a need to interrogate the findings of the

Gogan and Atkins
The Journal of Writing Analytics Vol. 4 | 2020 95
significantly different practice levels from an equity perspective, contemplating root causes,
assessing educational impacts, and brainstorming potential interventions. In the end, this group
of findings requires additional research and also adjustments to practice to see how opportunities
to practice peer review more equitably might be created.
6.2 Limitations of Results
Although this study builds upon the research conducted by Reese et al. (2018), this study’s limits
are many, as it still serves as a preliminary step toward understanding the relationship between
practice, success, and identity. The results of this study are limited by no fewer than three
factors, each of which receives elaboration below.
6.2.1 Limits from Narrow Constructs
First, the results of this study are limited by the narrowness of the constructs of practice, success,
and identity. As acknowledged earlier, these three constructs were defined in ways that would be
regarded by many researchers as oversimplified. The construct of practice was defined in
accordance with what Omizo calls a “blunt measure” (Eli Review, 2016). The construct of
success was relegated to a student’s final letter grade and its numerical equivalent in a first-year
writing course. This final letter grade is confounded by individual student academic habits and
dispositions, including levels of motivation, engagement, self-regulation, and acclimation. And,
perhaps most problematically, the study defined identity in terms of the information contained on
university-maintained student records. These records contained a limited number of identity
markers and, within each marker, choices were often mutually exclusive and not reflective of
current thinking about identity. Gender identity was, for instance, reduced to a binary choice
between male and female. Ethnicity, as it was labelled on the student record information,
contained ethnic (e.g., “American Indian or Alaska Native”), racial (e.g., “White”), and national
(e.g., “International”) identity markers. In the case of the identity grouping “Black or African
American,” the category combined racial and ethnic markers. Missing from these reports were
additional identity markers—such as students’ standardized test scores or socio-economic
status—that could have contributed further depth to the study. In brief, the definitions of this
study’s constructs pose significant limits to its results.
6.2.2 Limits from Sampling
Second, the results of this study are limited by the fact that the data sample came from a single
semester in an isolated year. This limitation arises from the specific institutional context of this
study and the intended use of its results. The study was designed to evaluate the relationship
between practice, success, and identity within the context of a pilot curriculum. The intent was
that the results of the tests of the pilot curriculum from the fall semester 2019 would inform
revisions to the curriculum that would be planned and executed in the spring semester 2020 for
implementation in the subsequent academic year, beginning with the fall 2020 term. Thus, the
Peer Review Practice, Student Identity, and Success in a First-Year Writing Pilot Curriculum
The Journal of Writing Analytics Vol. 4 | 2020 96
one-semester, one-year, one-sample approach was crucial to programmatic decision-making, but
perhaps not ideal for research design.
6.2.3 Limits from Review Prompt Instructions
Third, the results of this study might well be limited by some variance in the way Eli Review
feedback task prompts were written and assigned to students. As previously explained, all first-
year writing instructors were provided with a copy of a prepared Eli Review task sequence that
aligned with the pilot curriculum. This sequence included ready-made writing task assignments
and review task prompts, both of which provided students with instructions for completing the
task. Characteristically, review task prompts set a minimum comment goal (e.g., “4 contextual
comments + 1 final comment”), and it was assumed that most reviews would involve a piece of
writing receiving feedback from two different peer reviewers. However, there was some variance
in these instructions from task to task and from section to section, as the prepared instructions
were, in some cases, edited and review structures were altered. For some tasks, some instructors
adjusted the minimum number of comments or the number of peer reviews. This variance might
well have impacted the cumulative word count that this study used as an indicator of practice
intensity, and it might, therefore, limit the results.
7.0 Conclusions
Limitations considered, the results of this study speak not only to the specific research questions
under investigation, but also to the broader goals of equipping programmatic decision-makers
with data that can be used to make informed and equity-minded choices about their writing
pedagogies. Returning to the goal of using writing analytics in service of increasing equity, two
conclusions seem to emerge from this study.
7.1 Presence of a Text-Equity Gap Differentiated by Identity Groupings
This study’s findings—again, when viewed within the context of a pilot curriculum across
multiple sections of one institution’s first-year writing course—also suggest the presence of what
might be called a text-equity gap among students differentiated by identity groupings. The notion
of a gap existing among different student demographics in educational settings is not new.
Discussions of achievement gaps are, as McNair et al. (2020) note, “common” in higher
educational settings and refer to “disparities in outcomes” among students that correlate with
demographic groupings such as gender, race, and socioeconomic status (p. 72). Relatedly, Hart-
Davidson and Meeks (in press) identify patterned gaps in the word count and reciprocity factors
connected to student peer review and feedback practices on Eli Review. The gaps discussed by
Hart-Davidson and Meeks (in press) as well as by McNair et al. (2020) are centrally concerned
with equity: In fact, the latter set of co-authors recommend replacing the term achievement gap
with the term equity gap. Heretofore, these two kinds of gaps—one pertaining to demographic
differences in educational performance and one pertaining to writerly differences in Eli Review
practice—have not been brought together. However, this study links the two types of gaps and
Gogan and Atkins
The Journal of Writing Analytics Vol. 4 | 2020 97
identifies the presence of text-equity gaps that are differentiated by various identity markers.
These text-equity gaps refer to significant differences in the average quantity of feedback given
by particular identity-based groupings of students via Eli Review. As a measure of difference in
practice, these text-equity gaps speak to differences in levels of production—not necessarily
learning outcomes—that occur frequently in a low stakes context.
While there is surely a need to examine the factors that contribute to these text-equity gaps—
factors deep-rooted in educational inequities that map onto socio-economic, racial, and gender
inequities—there is a more pressing need to more precisely describe the nature of these gaps and
to more effectively redress these gaps. Writing analytics researchers are well poised to conduct
the studies that help better describe these text-equity gaps, and writing program administrators
are well poised to adopt the in-the-moment, kairotic pedagogical approach endorsed by Powell
(2013) and to find ways to close these practice-based text-equity gaps now.
7.2 Need for Practical Change
On a programmatic level, this study’s results lead to the conclusion that practical changes need to
be carried out on the first-year writing pilot curriculum in the areas of better setting the
conditions for students’ peer learning, better providing directions for Eli Review feedback tasks,
and better offering opportunities for instructors to discuss the practice-based text-equity gaps and
to brainstorm ways to close those gaps. This need reinforces the equity-minded insight offered
by Keating (2019) that instructors must improve on the way the value of peer review is
demonstrated to students and on the way that students are trained to participate in peer review.
In particular, the findings of this study stress the importance of peer review practice to
student success in the first-year writing course, and students need to know about this importance
up front in the course. The pilot curriculum included a short section in the opening chapter of the
course’s custom textbook (Gogan et al., 2020) that presented “Peer Review Benefits” to students.
Outside of this textbook section, the pilot curriculum relied upon instructors to provide additional
emphasis in class. For the Fall 2020 term, this section of the textbook has been expanded to
prime students to better engage with the conditions of learning afforded by Eli Review and, with
any luck, better reap the benefits associated with increased Eli Review practice (Gogan et al.,
2021).
This study was further limited by some variance in the directions that were given for Eli
Review feedback tasks. For some course sections and in some assignments, this variance led to
inequitable opportunities for particular students to practice writing. To make the opportunity for
practice more equitable, the review task prompts were revised to further clarify the minimum
level of practice expected from students for each task. Likewise, the guidance document
provided to instructors was revised in a similar fashion, further clarifying the expectations for the
management of the Eli Review tasks.
Finally, given that this study revealed the presence of text-equity gaps among identity-based
groupings, the study leads to a conclusion that follows the recommendation of McNair et al.
(2020) to engage program staff “in the examination of data and critical self-reflection” (p. 76).
Peer Review Practice, Student Identity, and Success in a First-Year Writing Pilot Curriculum
The Journal of Writing Analytics Vol. 4 | 2020 98
Using this study’s findings as a point of departure, the first-year writing program has already
begun convening focused discussion with course instructors to review and reflect upon the data.
These review-and-reflect sessions took the form of all-staff meetings in the Fall 2020 term, and
the idea is for these sessions to generate new pedagogical techniques through which instructors
might work to redress practice-based text-equity gaps in the first-year writing program.
8.0 Directions for Further Research
The study suggests two major directions for further research: first, mixed methods examinations
of peer feedback quality and second, experimental approaches to new pedagogical interventions.
Both of these areas encourage research into the changing behaviors of student writers as they
engage with practice and feedback.
8.1 Considerations of Feedback Quality
Additional research by writing analytics researchers needs to consider the quantity of peer
feedback in relation to the quality of that peer feedback. Such research would necessitate the use
of rigorous random sampling and data coding procedures, a quality coding scheme, and a
measure of reliability. The relationship between feedback quantity and feedback quality could
further be examined in terms of change over time. Such a view would better enable researchers
to describe the nature of peer review feedback in terms of the amount and frequency of student
peer review practice. Further, this change over time could be analyzed at increasingly smaller
levels (i.e., the comment level), providing the field with a more granular unit of analysis that
measures quality moves in proportion to text quantity as both change over time.
8.2 Applications to Pedagogy
Supporting the notion that writing analytics research can and should be used to promote equity
and opportunity, new research is needed that examines the way pedagogical interventions might
be used to increase student writing practice and improve student writing behavior. This research
might well take the form of an experimental study, wherein one group of students receives a
particular pedagogical treatment and another group of students does not. Such large-scale testing
of pedagogical innovation would help educators identify relatively more or less effective
teaching and learning practices across course sections. Such studies would also work to create an
analytics feedback loop within the writing classroom, the writing program, and the field of
rhetoric and writing studies, emphasizing the importance of feedback not only for student
learning, but also for classroom practice, curricular development, program assessment, and the
advancement of knowledge within the field.
Author Biographies
Brian Gogan is an associate professor at Western Michigan University, where he directs first-
year writing and teaches courses in composition, professional writing, and rhetorical theory. He
is lead author of Foundations in Written Communication: Strategies, Behaviors, Success, a first-
Gogan and Atkins
The Journal of Writing Analytics Vol. 4 | 2020 99
year writing textbook, in its second edition, that takes student success and equity as curricular
foci. He is currently involved in multiple research projects that examine how changing writing
behaviors may yield increased student writing success and more equitable learning outcomes.
Samantha Atkins is a PhD student at Western Michigan University, where she specializes in
fiction writing, English education, and postcolonial studies. At Western Michigan University,
she has served as an assistant director of first-year writing and a co-author of the first edition
of Foundations in Written Communication: Strategies, Behaviors, Success. Though her
background is in secondary education, Atkins now teaches composition and creative writing to
undergraduate students. Her fiction, nonfiction, and poetry can be found in Beecher’s
Magazine, Booth, Tahoma Review, Bayou Magazine, and others. In 2019, she received Western
Michigan University’s All-University Graduate Teaching Effectiveness Award and the
Department of English’s Van Rheenen Award for Excellence in Teaching College Writing.
Acknowledgments
The authors would especially like to recognize Martha Golubski for her expertise, time, and
enthusiasm as she offered statistical consultation and supportive discussion on our approach to
this research. The authors would also like to acknowledge Joshua Naranjo for statistical advice
he provided at a crucial stage of the research. Finally, the authors would like to thank Maria
Gigante and two anonymous reviewers for their feedback on the article.
References
Allen, D., & Katayama, A. (2016). Relative second language proficiency and the giving and
receiving of written peer feedback. System, 56, 96-106.
Anderson, D. (2003). Web-based peer review: An opportunity for conversation. In J. R. Galin, C.
P. Haviland, & J. P. Johnson (Eds.), Teaching/Writing in the late age of print (pp. 185-198).
Hampton Press.
Anderson, P., Bergman, B., Bradley, L., Gustafsson, M., & Matzke, A. (2010). Peer reviewing
across the Atlantic: Patterns and trends in L1 and L2 comments made in an asynchronous
online collaborative learning exchange between technical communication students in Sweden
and in the United States. Journal of Business and Technical Communication, 24(3), 296-322.
Armstrong, S. L., & Paulson, E. J. (2008). Whither “peer review”? Terminology matters for the
writing classroom. Teaching English in the Two Year College, 35(4), 398-407.
Borgman, J., & McArdle, C. (2019). Personal, accessible, responsive, strategic: Resources and
strategies for online writing instructors. University Press of Colorado.
Brammer, C., & Rees, M. (2007). Peer review from the students’ perspective: Invaluable or
invalid? Composition Studies, 35(2), 71-85.
Breuch, L. A. K. (2004). Virtual peer review: Teaching and learning about writing in online
environments. State University of New York Press.
Peer Review Practice, Student Identity, and Success in a First-Year Writing Pilot Curriculum
The Journal of Writing Analytics Vol. 4 | 2020 100
Carless, D., & Boud, D. (2018). The development of student feedback literacy: Enabling uptake
of feedback. Assessment and Evaluation in Higher Education, 43(8), 1315-1325.
Ching, K. L., & Wittstock, S. (2019). Teaching with digital peer response: Four cases of
technology appropriation, resistance, and transformation. Research in the Teaching of
English, 54(2), 161-182.
Cho, K., & Schunn, C. (2010). Developing writing skills through students giving instructional
explanations. In M. K. Stein, & L. Kucan (Eds.), Instructional explanations in the
disciplines: Talk, texts and technology (pp. 207-221). Springer.
Cohen, J. (1988). Statistical power analysis for the behavioral sciences (2nd ed.). Lawrence
Erlbaum.
Cushman, E. (2019). For whom do we make knowledge and why? Response to Diane Kelly-
Riley and Mya Poe. The Journal of Writing Analytics, 3, 351-357.
Duin, A. H., & Tham, J. (2020). The current state of analytics: Implications for learning
management system (LMS) use in writing pedagogy. Computers and Composition, 55,
102544.
Eli Review. (2016). A Computational approach to metadiscourse.
https://elireview.com/2016/04/19/computational-metadiscourse/
Eli Review. (2020). About Eli Review. https://elireview.com/about/
Ferris, D. R. (2003). Response to student writing: Implications for second language students.
Lawrence Erlbaum.
Flynn, E. A. (2011). Re-viewing peer review. The Writing Instructor.
http://files.eric.ed.gov/fulltext/EJ959705.pdf
Gere, A. R. (2019). Knowledge making and writing analytics: MLA special session. The Journal
of Writing Analytics, 3, 312-316.
Gogan, B., Atkins, S., Mitchell, K., Spinner, E., & Xaver, S. (2020). Foundations in written
communication: Strategies, behaviors, success. Macmillan Publishers.
Gogan, B., Conde, J., Mitchell, K., Scheidler, J., Spinner, E., & Xaver, S. (2021). Foundations in
written communication: Strategies, behaviors, success (2nd ed.). Macmillan Publishers.
Golub, J. N. (Ed.). (2005). More ways to handle the paper load: On paper and online. National
Council of Teachers of English.
Hart-Davidson, W., McLeod, M., Klerkx, C., & Wojcik, M. (2010). A method for measuring
helpfulness in online peer review. In Proceedings of the 28th ACM International Conference
on Design of Communication (pp. 115–121).
Hart-Davidson, B., & Meeks, M. G. (in press). Feedback analytics for peer learning: Indicators
of writing improvement in digital environments. In N. Elliot & D. Kelly-Riley (Eds.),
Improving outcomes: Disciplinary writing, local assessment, and the aim of fairness. Modern
Language Association.
Herrington, A. J., & Cadman, D. (1991). Peer review and revising in an anthropology course:
Lessons for learning. College Composition and Communication, 42(2), 184-199.
Gogan and Atkins
The Journal of Writing Analytics Vol. 4 | 2020 101
Huisman, B., Saab, N., van den Broek, P., & van Driel, J. (2019). The impact of formative peer
feedback on higher education students’ academic writing: A meta-analysis. Assessment and
Evaluation in Higher Education, 44(6), 863-880.
Hyland, K., & Hyland, F. (2006). Feedback on second language students’ writing. Language
Teaching, 39(2), 83-101.
Johnson, D. M. (1992). Compliments and politeness in peer-review texts. Applied Linguistics,
13(1), 51-71.
Johnson, D. M., & Roen, D. H. (1992). Complimenting and involvement in peer reviews: Gender
variation. Language in Society, 21(1), 27-57.
Johnson, D. M., & Yang, A. W. (1989). Politeness strategies in peer review texts. Pragmatics
and Language Learning, 1, 99-114.
Kahn, S. (2014). Review of Reichert Powell, Retention and Resistance [Review of the book
Retention and resistance: Writing instruction and students who leave, by P. R. Powell].
Composition Forum, 30(Fall 2014).
Keating, B. (2019). “A good development thing”: A longitudinal analysis of peer review and
authority in undergraduate writing. In A. R. Gere & N. Silver (Eds.), Developing writers in
higher education: A longitudinal study (pp. 56-80). University of Michigan Press.
Leijen, D. A., & Leontjeva, A. (2012). Linguistic and review features of peer feedback and their
effect on the implementation of changes in academic writing: A corpus based investigation.
Journal of Writing Research, 4(2), 178-202.
Lundstrom, K., & Baker, W. (2009). To give is better than to receive: The benefits of peer
review to the reviewer's own writing. Journal of Second Language Writing, 18(1), 30-43.
Mangelsdorf, K. (1992). Peer reviews in the ESL composition classroom: What do the students
think? English Language Teaching Journal, 46(3), 274-284.
McNair, T. B., Bensimon, E. M., & Malcom-Piqueux, L. (2020). From equity talk to equity
walk: Expanding practitioner knowledge for racial justice in higher education. John Wiley &
Sons.
Moxley, J. (2012). Aggregated assessment and “objectivity 2.0.” In Proceedings of the EACL
2012 Workshop on Computational Linguistics and Writing (pp. 19-26).
National Postsecondary Education Cooperative. (n.d.). NPEC National Symposium on
Postsecondary Student Success: Commissioned papers. https://nces.ed.gov/npec/papers.asp
Palmquist, M. (2019). Directions in writing analytics: Some suggestions. The Journal of Writing
Analytics, 3, 1-12.
Parfitt, E. (2012). Establishing the genre of peer review to create new rhetorical knowledge.
Compendium2, 5(1), 1-8.
Patchan, M. M., Charney, D., & Schunn, C. D. (2009). A validation study of students’ end
comments: Comparing comments by students, a writing instructor, and a content instructor.
Journal of Writing Research, 1(2), 124-152.
Peer Review Practice, Student Identity, and Success in a First-Year Writing Pilot Curriculum
The Journal of Writing Analytics Vol. 4 | 2020 102
Paton, F. (2002). Approaches to productive peer review. In D. Roen, V. Pantoja, L. Yena, S. K.
Miller, & E. Waggoner (Eds.), Strategies for teaching first-year composition (pp. 290-301).
National Council of Teachers of English.
Perryman-Clark, S. M. (2016). Who we are(n’t) assessing: Racializing language and writing
assessment in writing program administration. College English, 79(2), 206-211.
Perryman-Clark, S. M. (2018). Creating a united front: A writing program administrator’s
institutional investment in language rights for composition students. In S. W. Logan & W. H.
Slater (Eds.), Academic and professional writing in an age of accountability (pp. 168-184).
Southern Illinois University Press.
Powell, P. R. (2009). Retention and writing instruction: Implications for access and pedagogy.
College Composition and Communication, 60(4), 664-682.
Powell, P. R. (2013). Retention and resistance: Writing instruction and students who leave.
University Press of Colorado.
Pritchard, R. J., & Morrow, D. (2017). Comparison of online and face-to-face peer review of
writing. Computers and Composition, 46, 87-103.
Redding, A., LaHaie, J., & Bush, J. (2019). Reflective moments: Showcasing university writing
program models for black student success—Profile 3: WMU engl 1050 (first-year writing)
intensive: Reaching out and retaining struggling first-year writing students through faculty
intervention. In S. M. Perryman-Clark & C. L. Craig (Eds.), Black perspectives in writing
program administration: From the margins to the center (pp. 110-135). National Council of
Teachers of English.
Redding, A., LaHaie, J., & Bush, J. (2016). One-on-One ‘intensive’ instruction: Faculty and
students partnering for success in first-year writing. Language Arts Journal of Michigan,
32(1), 18-24.
Reese, A. N., Rachamalla, R. R., Rudniy, A., Aull, L., & Eubanks, D. (2018). Contemporary
peer review: Construct modeling, measurement foundations, and the future of digital
learning. The Journal of Writing Analytics, 2, 96-137.
Reid, E. S. (2014). Peer review for peer review’s sake: Resituating peer review pedagogy. In S.
J. Corbett, M. LaFrance, & T. E. Decker (Eds.), Peer pressure, peer power: Theory and
practice in peer review and response for the writing classroom (pp. 217-231). Fountainhead
Press.
Western Michigan University. (2019). Common data set 2019-20 [Data set].
https://wmich.edu/sites/default/files/attachments/u965/2020/WMU_CDS_2019-20_0.pdf
Wilson, M. J., Diao, M. M., & Huang, L. (2015). ‘I’m not here to learn how to mark someone
else’s stuff’: An investigation of an online peer-to-peer review workshop tool. Assessment
and Evaluation in Higher Education, 40(1), 15-32.
Wooley, R., Was, C., Schunn, C., & Dalton, D. (2008, July). The effects of feedback elaboration
on the giver of feedback. Paper presented at the 30th Annual Meeting of the Cognitive
Science Society, Washington DC.
Gogan and Atkins
The Journal of Writing Analytics Vol. 4 | 2020 103
Xiong, W., Litman, D., & Schunn, C. (2012). Natural Language Processing techniques for
researching and improving peer feedback. Journal of Writing Research, 4(2), 155-176.
Zoellner, R. (1969). Talk-write: A behavioral pedagogy for composition. College English, 30(4),
267-320.


