

PERFORMANCE, COMPENSATION, ANDTHE BALANCED SCORECARD*
Christopher D. Ittner,David F. Larcker, andMarshall W. Meyer
The Wharton SchoolThe University of Pennsylvania
November 1, 1997
*This research was funded by the Citicorp Behavioral Sciences Research Council, whose supportis gratefully acknowledged.
1997, Christopher D. Ittner, David F. Larcker, and Marshall W. Meyer
2
PERFORMANCE, COMPENSATION, ANDTHE BALANCED SCORECARD
A growing number of firms are replacing their financially-based performance measurement
and compensation systems with a "balanced scorecard" incorporating multiple financial and non-
financial indicators. Proponents of the balanced scorecard concept contend that this approach
provides a powerful means for translating a firm's vision and strategy into a tool that effectively
communicates strategic intent and motivates performance against established strategic goals
(Kaplan and Norton, 1996). However, the balanced scorecard literature provides little discussion
of the scorecard's role in compensation decisions, despite the fact that the majority of adopters use
the scorecard for this purpose (Towers Perrin, 1996). The limited discussion of performance
evaluation and compensation issues raises a number of questions regarding how the multiple
performance measures and their relative weights are chosen to ensure "balance" in the
compensation plan, the appropriate role of subjective versus formula-driven performance
evaluations, the choice of qualitative versus quantitative performance measures, and the extent to
which managers' understanding of strategic objectives and managerial actions vary with different
forms of scorecard-based incentive plans. These questions are all the more interesting because, in
the past, firms have sought to simplify performance measures by adopting multiunit organizational
designs, decentralizing operational decisions to individual business units, and holding business
units accountable mainly for bottom-line financial results.
This study provides exploratory evidence on these issues based on a field study of the U.S.
retail banking operations of “Global Financial Services” (GFS), a leading international financial
services provider. Prior to the 1990s, GFS had had, according to a senior executive, "a thirty-year
3
obsession with decentralization." Business units were held accountable for earnings and "not a lot
of other measures." Within its U.S. retail banking operations, performance was measured and
branch managers were compensated inconsistently. Beginning in 1993, GFS implemented a
formula-based system for compensating retail branch managers throughout the U.S. The system
initially rewarded profitability and growth once customer satisfaction and operational audit hurdles
had been achieved, but it changed rapidly during the three years it was in use. It was replaced in the
Western region in the second quarter of 1995 and elsewhere in the U.S. in the first quarter of 1996
by a "balanced scorecard" system. The "balanced scorecard" contained six categories of financial
and non-financial performance measures, some of which were qualitative, and was intended for use
at all levels of the organization, not just branch managers. Unlike the formula-based program, the
"balanced scorecard" used subjective weightings to aggregate the various scorecard measures when
determining overall performance evaluations and bonus awards. We examine whether managers'
understanding of strategic goals and compensation determinants differed under the two systems,
and investigate whether the balanced scorecard met the objectives of generating closer links
between strategic goals and compensation, improvements in non-financial strategic "drivers," and,
ultimately, improved financial performance.
The remainder of the paper is organized as follows. The next section provides an overview
of the balanced scorecard concept and related research on the use of multiple performance measures
and formulaic versus subjective evaluations in compensation plans. The following section
discusses the research setting for our study, with the results provided thereafter. We conclude the
paper with a summary and discussion of issues for future research.
LITERATURE REVIEW
4
Although performance measurement systems can play a key role in communicating,
evaluating, and rewarding the achievement of strategic objectives, many managers feel that their
existing measurement systems do not adequately fulfill these functions. A 1996 survey by the
Institute of Management Accounting (IMA), for example, found that only 15 percent of the
respondents' measurement systems supported top management's business objectives very well,
while 43 percent were less than adequate or poor (IMA, 1996). One of the primary criticisms of
current measurement systems is that they are generally limited to financial indicators, thereby
focusing the organization on past performance and encouraging a short-term view of strategic
objectives (e.g., Eccles, 1991; American Institute of Certified Public Accountants, 1994; Deloitte &
Touche, 1994).
Kaplan and Norton (1992, 1996) developed the balanced scorecard concept to address the
perceived shortcomings in financially-oriented performance measurement systems. The balanced
scorecard approach supplements traditional financial measures with non-financial measures focused
on at least three other perspectives--customers, internal business processes, and learning and
growth. Kaplan and Norton contend that the balanced scorecard provides a number of mechanisms
for linking long-term strategic objectives with short-term actions. First, development of the
balanced scorecard forces managers to develop a consensus around the firm's vision and strategy.
By requiring the vision and strategy to be expressed in terms of an integrated set of objectives and
measures, senior executives must agree on how broad strategic objectives can be translated into
operational measures that guide lower-level managers' actions. Second, the balanced scorecard
allows managers to communicate the firm's strategy throughout the organization, helping to ensure
that employees understand the long-term strategy, the relations among the various strategic

5
objectives, and the association between the employees' actions and the chosen strategic goals.
Third, by integrating strategic and financial plans, the balanced scorecard helps firms to allocate
resources and set priorities based on the initiatives' contribution to long-term strategic objectives.
Finally, by incorporating non-financial indicators of the drivers of strategic and financial success,
the balanced scorecard provides strategic feedback and promotes learning through the monitoring of
short-term strategic results, thereby allowing firms to modify objectives or strategies before
financial results turn down.
Although Kaplan and Norton (1996) argue that the proper role of the balanced scorecard in
determining compensation is not yet clear, a recent survey of scorecard implementations found that
70 percent of the respondents already use the balanced scorecard or some variant for compensation
purposes, and 17 percent are actively considering its use for this purpose (Towers Perrin, 1996).
Similarly, research by Ittner et al. (1997) indicates that 36 percent of U.S. firms now use both
financial and non-financial measures in their chief executive officers' annual bonus contracts, with
the weights placed on these measures a function of the firms' strategic objectives.
One question raised by the widespread use of scorecard-based compensation plans is the
effectiveness of adding additional performance measures to incentive plans. Consistent with the
balanced scorecard concept, theoretical work on performance evaluation using multiple signals in
agency settings indicates that financial measures alone may not provide the most efficient means to
motivate managers to act in the manner desired by the firm's owners (Feltham and Xie, 1994). In
theory, the bonus contract should include any performance measure that provides incremental
information about desired managerial actions in order to efficiently motivate the manager
(Holmstrom, 1979; Banker and Datar, 1989). These models indicate that, subject to the associated

6
costs, the inclusion of additional performance measures that provide information on managerial
actions will improve incentive contracting with the manager.
In practice, however, the implementation of more complex measurement systems can be
quite costly. As shown in Table 1, 25 percent of the respondents to the Towers Perrin (1996)
survey experienced problems or major problems with the extra time and expense required to
implement and operate the balanced scorecard, and 44 percent encountered problems developing
the extensive information systems needed to support the scorecard approach. The use of a large
number of performance measures may also cause managers to spread their efforts over too many
objectives, reducing the effectiveness of the incentive plan. More than 40 percent of the Towers
Perrin survey respondents, for example, stated that the large number of measures in the balanced
scorecard diluted the overall impact of the new measurement systems. Holmstrom and Milgrom's
(1991) analytical model adds that multi-criteria incentive contracts such as the scorecard may direct
agents' effort to tasks that are easily measured at the expense of tasks that are harder to measure,
even if this allocation of effort is detrimental to the firm. Their model indicates that the advantages
of adding new performance measures to an incentive contract decrease with the difficulty of
measuring performance in any other activities that make competing demands on the agent's time
and attention. Thus, the net benefit from a larger number of performance measures is unclear.
A second question is whether bonuses in multi-criteria compensation systems should be
computed using explicit, objective formulae that prescribe the weights to be attached to each
measure, or should be based on subjective performance measures or evaluations where the weight
attached to each measure is determined by the person responsible for the evaluation. Kaplan and
Norton (1996) highlight three potential difficulties in integrating the balanced scorecard measures

7
into formula-based compensation plans. First, the firm must determine the appropriate weights to
place on the multiple performance measures. Kaplan and Norton argue that the effective choice of
performance measures and their relative weights requires an explicit articulation of a "business
model" of the firm that describes the hypothesized drivers of the desired business results, and an
understanding of the extent to which the chosen measures are good indicators of the desired
strategic objectives. The Towers Perrin (1996) survey suggests that this is a difficult task in many
organizations, with 38 percent of the respondents experiencing problems in evaluating the relative
importance of the scorecard measures. Second, formulaic compensation plans may be susceptible
to the game-playing associated with explicit, formula-based rules. Finally, formula-based plans
may allow bonuses to be paid even when performance is "unbalanced" (i.e., over-achievement on
some objectives but under-achievement on others).
Strategy researchers point out that the use of formal, pre-set goals and milestones in
strategic control systems such as the balanced scorecard may also prevent the adaptability and
flexibility that is the essence of good strategy (e.g., Quinn, 1980; Mintzberg, 1987). Pre-set goals
are almost always met, but whether goals are achieved by improving performance or by improving
the measures without improving performance can be difficult to determine (Meyer and Gupta,
1994). In addition, studies by Lorange and Murphy (1984) and Goold and Quinn (1993) indicate
that formal strategic control systems may reduce performance by focusing attention on incomplete
or incorrect goals and performance measures and fostering behavioral and political barriers that
adversely affect the utility of the strategic controls. Consistent with these claims, Ittner and Larcker
(1997) found that computer industry performance was negatively associated with the provision and
monitoring of formal strategic action plans and targets.

8
Some balanced scorecard adopters have abandoned formula-based compensation plans in
favor of subjective evaluations in order to minimize these difficulties. Indeed, Kaplan and Norton
(1996) argue that the "balanced scorecard" renders subjective compensation systems "easier and
more defensible to administer . . . and also less susceptible to game playing" (p. 220). Analytical
studies indicate that subjective compensation plans can be superior to objective, formula-based
plans because they allow the firm to exploit non-contractable information that might otherwise be
ignored in formula-based contracts. Baiman and Rajan (1995), for example, show that
discretionary bonus schemes, in which an objectively-determined bonus pool is allocated to
managers based on subjective evaluations of the managers' performance, enable the owner to use
such non-contractible information as non-quantifiable or "soft" measures (e.g., the principal's
personal observations of the manager's ability or effort level) to achieve an optimal improvement in
managerial effort. Similarly, Baker et al.'s (1994) theoretical analysis indicates that the use of
subjective weights on objective performance measures allows the employer to mitigate distortions
in performance measures by "backing out" unintended dysfunctional behavior or gaming induced
by the incomplete objective performance measures.
Despite these advantages, subjective performance evaluations are not without potential
drawbacks. Expectancy theory, for example, states that employees will be motivated to perform at
higher levels if they believe that effort will lead to good performance (the effort to performance
expectancy), that rewards are contingent on performance (the performance to reward expectancy),
and that these rewards are valued and salient in the sense that they are uppermost in the employees'
minds (the valence of outcomes).1 Note that the locus of causality in expectancy theory lies in
people's beliefs about the relationships of effort to outcomes and of outcomes to rewards—so long
9
these beliefs are in place, motivation will be sustained. Thus, Newsom (1990) argues that the
increased motivation described in expectancy theories is contingent on three factors: (1) criteria (do
employees understand the difference between good and bad performance?), (2) credibility (do
employees believe management will deliver on promises of inducements for good performance?)
and (3) consistency (do employees believe that all individuals receive similar preferred outcomes
for good performance and less preferred outcomes for poor performance?). Prendegast and Topel
(1993) identify a number of reasons why subjective performance evaluations may be inferior to
objective, formula-based evaluations on these dimensions. These include greater possibility of
reneging on promises to reward superior performance since the subjective measures are not
verifiable, increased favoritism and bias in performance evaluations, the tendency to compress
subjective evaluations and rewards (to avoid giving poor ratings), and greater perceived
"unfairness" in performance evaluations. Should these possibilities materialize, workers will exert
less effort under a subjective compensation system than under a more objective incentive plan.
In summary, advocates of the balanced scorecard argue that this approach allows companies
to build consensus around the organization's vision and strategy, effectively communicate strategic
objectives, and motivate performance against established strategic goals. Although the balanced
scorecard literature acknowledges that linkages to reward systems ultimately are required for the
scorecard to create cultural change and improve economic performance, the specific form of these
linkages remains an open issue. In particular, little evidence exists on the extent to which the
balanced scorecard's use in compensation actually enhances employees' understanding of strategic
objectives and improves organizational performance, or whether these outcomes vary with different
forms of scorecard-based incentive plans.
1 See Van Eerde and Thierry (1996) for a review of the expectancy literature.

10
RESEARCH SETTING
We provide exploratory evidence on these issues using data from Global Financial
Services’ Western retail branch banks. The Western retail banking operation is part of GFS’s
North America Banking Division (NABD). The region’s branches are organized into five
geographical areas, each consisting of 5 to 20 branches.2 Branch managers within these areas
report to an area director, who in turn reports to the president of the Western banking operation.
The PIP Program
In 1993, the NABD implemented the “Performance Incentive Plan” (PIP) to motivate and
measure achievement of the organization’s strategic mission of being “the best and only place for
target customers and businesses to manage all of their money anytime, anywhere, any way they
want.” The PIP program’s mechanics and evolution from 1993 to 1995 are summarized in
appendix 1. As is evident from appendix 1, the Performance Incentive Plan was both
“balanced”—in that it included both financial and non-financial measures—and formulaic—
bonuses were determined by explicit PIP formulae. To receive a quarterly bonus, branches were
first required to receive satisfactory scores on any internal operational audits conducted during
the quarter and to pass a customer satisfaction hurdle, as measured by a market research firm’s
survey of customer satisfaction with branch performance. In 1993 and 1994, a single question
asked customers to rate their overall satisfaction with their primary branch, on a seven-point
scale. For each branch, the percentage of customers answering in the top two categories (was
calculated. In 1993, customer satisfaction levels in the top 75 percent of the Western branches
received passing scores. In 1994, customer satisfaction levels that were statistically equal to or
2 During the second quarter of 1995, the Western region consisted of 93 branches. This figure changed somewhatover the time period covered by our study. We have complete data on 78 branches, which we use in our analyses.

11
greater than the region mean received passing scores. In early 1995, the single question asking
customers to rate their overall satisfaction with their primary branch was replaced by the branch
quality index, a composite of 20 items that was believed to have better psychometric properties
than the single-item measure it replaced. The most heavily weighted item in the branch quality
index (45%) asked customers to rate "the overall quality of [the branch's] service against your
expectations" on a five-point scale.3 Branch quality indices that were statistically equal to or
greater than the region mean received passing scores in the 1995 version of the PIP program.
Branches passing the customer satisfaction hurdle in 1993 received quarterly bonuses for
achieving improvement targets in any one of eight performance objectives related to growing the
business (tier I and tier II household growth, consumer checking balance growth, business and
professional checking balance growth, revenue growth, and relationship growth), resource
management (expenses as a percent of revenue and footings as a percent of tier I and tier II
households), and “overall performance” (quarterly margin growth).4 There were minor changes
in these objectives in 1994. In addition to passing the satisfaction hurdle and having satisfactory
audit scores, branches were required to achieve targets in at least four of the eight performance
objectives to be eligible to receive a quarterly bonus. In the 1995 version of the PIP, the
objectives shifted further and included customer satisfaction (80% of customers rating overall
satisfaction with GFS in the top two categories), growth (in tier I and tier II households, checking
3 The remaining items include the quality of tellers versus expectations (7.5%), six additional items concerningtellers (7.5%), quality of other branch personnel versus expectations (7.5%), six additional items concerning non-teller employees (7.5%), quality of automated teller machines (ATMs) versus expectations (7.5%), three additionalitems concerning ATMs (7.5%), and one item measuring problem incidence (10%). The branch quality index isbelieved to have better psychometric properties because multiple-item measures reduce measurement error. However, these properties will only be improved if the resulting construct is unidimensional (i.e., all of the questionsmeasure the same construct).4 A household is a group which makes banking decisions as a family or business unit. Tier I households arecustomers with total combined balances in excess of $100 thousand (including investment balances) and tier IIhouseholds are customers with balances in excess of $10 thousand. Footings are defined as consumer and

12
balances, liabilities and assets, and revenues), and resource management (growth in margins, and
usage of automated tellers and other remote channels). To be eligible for bonuses under the 1995
PIP program, branches had to pass the satisfaction hurdle (based on the branch quality index),
have a satisfactory audit score, and meet their financial (revenue and margin) targets.
As seen above, the computation of bonuses under the PIP system became more
complicated over time. The growing complexity of the PIP bonus formulae is reflected in the
size of the document outlining each year’s program: nine pages in 1993, 38 pages in 1994, and
78 pages in 1995. The increased complexity had two causes. One was management's frustration
with a formula-based compensation system that allowed branches to earn bonuses without
delivering financial results. To insure that branches were achieving financial targets, the 1995
PIP program added a financial hurdle that made it much more difficult for unprofitable branches
to receive bonuses. The second cause of increased complexity was management's belief that
retail banking customers were ultimately customers of GFS rather than of a particular branch,
and that customers' overall satisfaction with GFS was more significant for long-term business
results than customers' satisfaction with their branches. As a senior GFS officer stated in his
remarks to 1994 PIP bonus recipients, "If we take a focus that everything is all right with my area
but there's something else wrong out there which is not my concern, we will lose long term. You
own the customer. That's the fundamental building block we have." Thus, overall satisfaction
with GFS was added as a performance objective in the 1995 PIP program—at the same time that
the 20-item branch quality hurdle replaced the single-item branch satisfaction hurdle in the PIP
program. Although the available data prevent us from judging whether the PIP program was
successful or unsuccessful, our interviews suggest that GFS management judged the program’s
business/professional liabilities plus consumer and business/professional assets (excluding mortgages).

13
overall results to be unsatisfactory because of discrepancies between financial results achieved by
individual branches and bonuses awarded under the PIP program.
The Balanced Scorecard
In early 1995, GFS refined its corporate strategy to focus on five “imperatives” for
success over time: achieving good financial results, delivering for customers, managing costs
strategically, managing risk, and having the right people in the right jobs. To evaluate progress
against these imperatives, each business is required to implement a “balanced scorecard” of
related measures. A senior executive discussed the goals of the balanced scorecard approach in
GFS’s employee newspaper:
The Balanced Scorecard is a simple matrix that leads us to examine how each business, aswell as the whole, does in all of those performance blocks. In the process, we can alsoassess individual performance against the same criteria. It not only sums up what wewant to do, it does it in a way that assures everyone in the company knows what we aretrying to accomplish and what is important in getting the job done.
Perhaps the most important thing about how it works is the balance. Our past problemscan almost always be traced to too much of a single-minded focus on bottom-lineearnings, or building revenues, or something else to the exclusion of other importantissues. By forcing us to focus on all of the key performance factors, the BalancedScorecard keeps us in balance.
The Western region replaced the PIP program with the balanced scorecard performance
evaluation and compensation system in May, 1995; other NABD regions followed in 1996. The
performance measures in the Western region’s balanced scorecard fall into six categories:
financial, strategy implementation, customer, control, people, and standards. The first three
categories are each measured using multiple quantitative indicators. Financial performance is
evaluated based on revenues, expenses, and margins. Through the first quarter of 1996, strategy
implementation was measured using the number of Premier, retail, and business/professional
14
households, household attrition, assets under management (AUM), and assets under management
per household.5 The strategy measures were changed in the second quarter of 1996, with retail
asset balances, market share, and the number of new households and customer net revenue
(CNR) per household for each customer category (Premier, retail, and business/professional)
replacing household attrition, AUM, and AUM per household.
Two measures evaluate customer-related performance: overall satisfaction with GFS and
the branch quality index, both carried over from the 1995 PIP program described earlier. Control
is measured by the results of periodic internal audits of operations and legal/regulatory
compliance. The people and standards evaluations represent qualitative assessments by the
branch managers’ supervisors. Factors considered in assessing people-related performance
include performance management, teamwork, training and development (both for the branch
manager and other branch employees), and employee satisfaction.6 Standards criteria are
leadership, business ethics and integrity, customer interaction and focus, community
involvement, and contribution to the overall business.
The steps involved in the bonus computation process under the PIP program and the
balanced scorecard are compared in Figure 1. Unlike the formula-based PIP program, the
balanced scorecard system requires senior managers to weight subjectively the various
performance measures when evaluating branch managers’ performance and determining their
bonuses. Performance is first compared with targets for each of the various financial, strategy
5 Premier households are defined as customers with balances in excess of $100 thousand.6 Performance management is defined as a manager’s ability to “achieve goals by coaching, motivating, empowering,hiring, supporting, promoting, recognizing, and challenging staff.” Although employee satisfaction is considered inevaluating the people category, employee satisfaction surveys are not conducted on a regular basis, making thequarterly assessment of this measure qualitative. Moreover, there was no statistically significant correlation betweenthe employee satisfaction scores from a 1996 survey and the subjective “people” scores given by area directors in thefirst and second quarters of 1996, indicating that quantitative employee satisfaction measures received little weight in

15
implementation, and customer measures. Branch managers then receive a “par rating” for each
of the measures within the financial, strategy, and customer categories, where “below par”
reflects performance below expectations, “at par” represents expected performance, and “above
par” reflects better than expected performance. Ratings for performance on individual measures
are then subjectively aggregated into par ratings for the financial, strategy, and customer
categories. A single overall rating is assigned for the control, people, and standards categories
(i.e., par ratings are not given for the individual criteria used to assess performance within these
three categories).7 Ratings within the six scorecard categories are then combined subjectively by
the bank manager’s area director into an overall performance rating of “below par,” “at par,” or
“above par.” A similar scorecard system is used to evaluate and reward lower-level employees.
The quarterly bonus for a branch manager is recommended initially by the manager's area
director after a review of the branch manager's scorecard. This recommendation is then taken to
a meeting where the president of the Western region, his staff (the finance director, human
resource director, compensation manager, and service quality director), and the five area directors
discuss each recommendation. The discussion generally focuses on the justification for the
overall rating recommended for the branch manager, particularly when the overall evaluation of a
manager is "above par" and the manager is eligible for a substantial bonus. The tenor of this
discussion can shift from quarter to quarter based on the organization’s priorities that period.
Financial performance that is merely "at par" may disqualify a manager from an "above par"
overall evaluation. A "below par" rating on customer satisfaction may also preclude an "above
par" overall evaluation no matter what the branch’s financial performance. A "below par"
evaluating managerial performance on this dimension.7 Formal goals are not provided for the control, people, and standards categories, but an audit rating of "3" or lower

16
evaluation on control automatically precludes an "above par" overall evaluation.
Quarterly bonuses are meant to reflect the branch manager’s overall rating, labor grade,
and current compensation. Unlike the PIP program, no formula is applied. Instead, bonuses are
intended to achieve total market-based compensation levels (salary plus bonus) for a given labor
grade and performance level. For example, assume that total compensation for branch managers
in the highest of the three labor grades is targeted at up to $75,000 annually if performance is at
par, up to $90,000 if performance is above par, and up to $105,000 or more if performance is
exceptional. If a manager with an above par overall evaluation in this labor grade earns a salary
of $80,000, the maximum quarterly bonus is $2,500 ($10,000/4). However, if the manager’s
salary is $90,000 or more, no bonus is awarded despite the above par performance. This differs
from the PIP formula, which determined a bonus percentage that was awarded regardless of the
branch manager’s salary (e.g., a branch manager with an annual salary of $80,000 and eligible for
15 percent bonus would receive a $3,000 bonus for that quarter, while a branch manager with an
annual salary of $90,000 and eligible for a 15 percent bonus would receive a quarterly bonus of
$3,375).
The subjectivity and complexity of the balanced scorecard notwithstanding, GFS's senior
management believes that the scorecard alleviates two problems experienced with the PIP
program. First, the absence of any prescribed formula and the ability to award bonuses of any
size up to the maximum compensation levels at each labor grade leaves room for discretion in
determining bonuses. Second, the balanced scorecard, in principle, forces branch managers to
consider all six categories of performance since evaluations and compensation may be based on
any combination of these measures. Under the PIP system, branch managers automatically
is "below par" performance in the control category.

17
received bonuses for meeting hurdles and then achieving certain performance objectives. This
allowed some managers to earn bonuses by growing the size of the branch even though margins
were stagnant or declining and expenses were not controlled, although this became more difficult
to do in the first quarter of 1995. The balanced scorecard system was designed to alleviate the
problems caused by the PIP program by incorporating all corporate imperatives into
compensation decisions. As explained to GFS’s employees:
Why balanced? Because it requires a business to do well on five separate measures ofperformance—not just two of them, not even four out of five. ... The point is, under thescorecard, all factors must be given weight—cost management as well as servingcustomers, people as well as making money. And attention to risk. When the businessesclick on all five disciplines, [GFS] will be the premier global growth company it aims tobe.
RESULTS
Method
We use both quantitative and qualitative analyses to examine the balanced scorecard’s
effects on the Western branches. PIP data were provided for the last three quarters of 1994 and
the first quarter of 1995, and balanced scorecard data for the second quarter of 1995 through the
second quarter of 1996. This information is used to investigate the implicit weights placed on
the various performance measures under the balanced scorecard system, and to analyze the
scorecard’s effect on financial and non-financial performance. We also obtained data from
internal employee surveys conducted in 1994 (under the PIP program) and 1996 (under the
balanced scorecard system). The comparative survey data allow us to test whether branch
managers’ understanding of strategies, goals, and priorities and their attitudes toward the
organization’s performance evaluation and compensation programs varied under the two
18
systems. Finally, we reviewed internal documents, attended quarterly bonus award meetings,
and interviewed senior GFS executives, top managers of the Western region, area directors, and
branch managers to gain insight into the implementation and operation of the balanced scorecard
system.
Scorecard Implementation Issues
A number of implementation issues arose when the balanced scorecard replaced the PIP
program in May, 1995. Our interviews suggested that two issues were especially pressing: the
time required by the scorecard process and the perceived capacity of GFS’s information systems
to generate the performance data required by the scorecard.
Compared to the PIP program, the scorecard process proved extremely time consuming,
at least in its initial stages. The balanced scorecard system demanded more time than the PIP due
in part to the large amount of required paperwork at the branch level. Under the PIP program,
branch managers allocated bonus pools to other branch employees at their discretion. Under the
scorecard process, branch managers prepare scorecards for all branch employees, including
tellers, and make bonus recommendations to area directors based on their overall evaluation of
the employee (“above par,” “at par,” “below par”). Branch managers typically spend two and a
half to four days per quarter compiling scorecards and reviewing them with branch employees.
The scorecard also required more time than the PIP program due to the involvement of
area directors and senior management in the determination of bonus awards to branch managers.
PIP bonuses were formulaic and required no action on the part of area directors or senior
management. Under the scorecard, area directors analyze the performance of branch managers
based on scorecard results and then recommend ratings for each scorecard category, overall

19
performance ratings, and quarterly bonuses. These recommendations are then discussed at
quarterly meetings of the Western region president, his staff, and the five area directors. A
significant proportion of an area director’s time is occupied by the scorecard process.
Approximately six days per quarter are required to prepare the branch managers’ scorecards,
discuss the scorecards and bonus recommendations at the quarterly bonus meetings, and meet
with the region’s president. Area directors do not view this level of effort as a positive
development. One area director, for example, claimed that he spends two and a half to three
weeks per quarter on the scorecard process (including reviewing and correcting numbers with
branch managers, meeting with area staff, analyzing mangers’ performance and writing scorecard
narratives, attending the bonus award meeting, and discussing the results with branch
managers)—“unfortunately.” Another added, “We dread it every time.”
Aside from the time demands of the scorecard, most of the branch managers we
interviewed complained about the bank's management information systems. There were concerns
about both the accuracy and timeliness of the information required by the scorecard. Several
branch managers believed that the strategy implementation measures generated by the MIS —
numbers of household, assets, and the like—were especially inaccurate. Branch managers also
reported that MIS reports are frequently delayed. Although a variety of separate information
systems provide early warnings of potential problems, and many area directors track these
indicators on a daily or weekly basis, no consolidated performance reports are issued until 45
days into the quarter (15 days after the end of the first month in the quarter). Finally, a number of
managers complained about the need to input data manually from various information systems
into a scorecard spreadsheet, rather than having an integrated scorecard system. One area

20
director summarized the perceived shortcomings in the region’s information systems, “Time
would be saved if numbers were correct in the first place, if there was a single data source, and if
information was available on a more timely basis.” These complaints were spontaneous and not
elicited by questions specifically concerning MIS. Most were in response to the penultimate
question in the interviews, which asked branch managers to suggest changes that might improve
the scorecard process.
Determinants of Scorecard Ratings
As discussed earlier, one of the primary challenges in implementing a multi-criteria
measurement system such as the balanced scorecard is determining the relative weights and
appropriate “balance” among the various indicators. After considerable discussion, GFS chose
not to attach explicit weights to the scorecard measures in order to maintain the flexibility to shift
weights as conditions changed. However, some of the branch managers that we interviewed
argued that the lack of explicit weights made performance evaluations unpredictable and allowed
financial performance to dominate other concerns. Claimed one branch manager, “Balance
lasted two quarters. By the end of the second quarter [under the scorecard], it was financials or
else.”
We examine the implicit weights placed on the various performance measures by
investigating the associations between the branches’ performance on the scorecard measures, the
par ratings given to branch managers in the six scorecard categories, and the size of their
quarterly bonuses. Table 2 provides evidence on the association between quarterly financial,
strategy, and customer par ratings (where 1 = below par, 2 = at par, and 3 = above par) and
performance versus goals for each of the quantitative performance measures in these categories.
21
The financial par results indicate that performance relative to both revenue and expense goals
was factored into managers’ evaluations during each of the quarters, with higher performance
evaluations when revenues exceeded or expenses fell below targets.8 The mean (median)
adjusted R2 is 0.55 (0.56), implying that the quantitative performance measures for this category
accounted for a little more than half of the managers’ performance evaluation on this dimension.
Nearly all of the emphasis in customer-related evaluations was on overall satisfaction
with GFS. The overall customer satisfaction measure was a significant determinant of customer
par ratings in each quarter. The branch quality index, on the other hand, had a positive and
significant impact on customer par ratings only in the second quarter of 1995 (the first period
under the balanced scorecard system). More surprisingly, the branch quality index was
significantly negative in the second quarter of 1996, implying that customer-related performance
evaluations during this period were inversely related to branch quality relative to goals. One
reason for the emphasis on overall satisfaction is that many customers view branch managers as
the central focus of their relationship with GFS, despite the fact that many potential determinants
of overall satisfaction with GFS are not under the control of branch managers. For example,
credit card and mortgage businesses are managed by centralized groups outside the Western
region. Although problems with these centralized groups may affect a customer’s rating of
overall satisfaction with GFS, this rating is unlikely to provide much insight into the effort the
branch manager devoted to satisfying customers if survey responses are based largely on
8 We did not include margins (defined as revenues - expenses) in the model because of multi-collinearity problems. When financial par scores were regressed on margins alone, the coefficients were positive and significant in eachquarter. However, the adjusted R2s for the models were substantially lower (mean = 0.22, median = 0.21). Lowvariance inflation factor (VIF) scores indicate no serious problems with multi-collinearity in any of the other modelsreported in the paper.

22
experience with the centralized groups. Complained one branch manager, “I cannot control all of
[GFS]. Branch managers are held accountable for all of [GFS], while other managers are not
accountable at all under the scorecard. It is an incredible burden to accept full responsibility for
[GFS].” Despite comments like these, some branch managers maintained high overall
satisfaction scores consistently while others did not. Our interviews indicated that a second
reason for the heavy weight on overall satisfaction was the Western president’s decision to
emphasize a common customer satisfaction measure that could be “rolled up” from the branch
level to provide an assessment of the region’s progress towards the corporate goal of 80 percent
overall satisfaction with GFS.
The strategy implementation performance measures explain relatively little of the
variation in the strategy par ratings given to branch managers (mean adjusted R2 = 0.17, median
= 0.13), with the weights placed on the various performance measures varying by quarter.9 The
number of retail households and assets under management (AUM) per household were
significant predictors of strategy ratings in the first three quarters under the balanced scorecard,
but not afterwards. The number of business and professional (B/P) households was also a
significant predictor of ratings in three of the five quarters, but household attrition was only
significant in the first quarter under the scorecard. When the strategy performance measures
were changed in the second quarter of 1996, the adjusted R2 was just 0.13 and only one of the
seven performance measures (business and professional CNR per household) was a significant
determinant of strategy par ratings.
Overall, the results in Table 2 indicate that the subjective evaluations given to branch
9 The number of Premier households is excluded from the regression models because many of the branches do nothave any Premier customers.
23
managers for financial, strategy, and customer performance were based only partially on the
quantitative performance measures included in each category on the scorecard. Adjusted R2s
ranged from 0.05 to 0.80, suggesting that roughly 20 to 95 percent of a branch manager’s par
rating for a particular category was based on factors other than performance relative to the
category’s goals. These results are consistent with studies which have found relatively low
correlations between objective and subjective ratings of employee performance (see Bommer et
al. [1995] for a review). We also find that the proportion of quantitative measures that were
significant determinants of par ratings fell from seven of eight (87.5%) in the first quarter of
balanced scorecard implementation to four of eight (50.0%) in the first quarter of 1996, and to
five of 11 (45.4%, one measure having the wrong sign) with the introduction of the new strategy
performance measures in the second quarter of 1996. One explanation of these results is that the
balanced scorecard implementation exhibited a seasoning (or maturation) process, where many
measures were initially used for performance evaluation, but a smaller number of more
manageable measures were ultimately used as the implementation matured. An alternative
interpretation, consistent with the claims of some branch managers, is that the new system
become “less balanced” over time.
Associations Between Ratings in Scorecard Categories and Overall Ratings
Table 3 investigates the association between the ratings given in each of the six scorecard
categories and the branch manager’s overall performance rating. The financial, strategy, and
customer ratings, which are based partially on quantitative measures, are the most consistent
determinants of overall performance ratings. Financial and customer ratings are positive and
significant in each quarter, while the strategy implementation ratings are significant in every
24
quarter except the first. The results for the more qualitative control, people, and standards par
ratings are mixed. From the second quarter of 1995 to the first quarter of 1996, one to two of the
qualitative ratings were significant predictors of a manager’s overall performance evaluation each
quarter, but none of these categories was a statistically significant determinant of the overall
evaluation in the second quarter of 1996.
To provide an estimate of the relative weights placed on the individual par ratings when
assessing overall performance, we use stepwise multiple regression to examine the incremental
explanatory power provided by each category’s par rating (not reported in the tables). We
develop a crude assessment of the relative weight given to a measure by dividing the incremental
R2 provided by that measure by the total R2 for the model. Consistent with claims by branch
managers, financial performance received the greatest (though not the only) weight in assessing
overall performance. On average, the incremental R2 from the introduction of the financial par
rating was 66.1 percent (median = 74.1%) of the total variance explained by the five quarterly
models. The strategy and customer par ratings, on the other hand, accounted for only 12.4
percent of the explained variance on average (median = 9.8%). The greatest weight on these
categories occurred in the second quarter of 1996, when customer par ratings explained 25.6
percent of the total R2. Despite the apparent exclusion of standards, control, and people factors
from the determination of overall par ratings in the second quarter of 1996, par ratings for these
three categories explained an average of 21.5 percent (median = 17.0%) of the overall R2. Much
of this explanatory power is due to the importance placed on people par ratings in the third
quarter of 1995, when they explained 62.3 percent of the total R2.
In general, the results in Table 3 indicate that non-financial performance was incorporated

25
into the area director’s overall assessment of a branch manager, which suggests that there was
some degree of “balance” in the new performance measurement system. Nevertheless, the
balanced scorecard system was primarily driven by financial considerations. These results
indicate that the balanced scorecard system only partially addressed criticisms that the
compensation program provided incentives for branch managers to focus their efforts on a single
or limited set of performance dimensions.
Associations Between Scorecard Ratings and Quarterly Bonuses
This section examines the extent to which scorecard ratings translated into bonus awards.
Under the PIP system, an explicit formula determined bonuses based on performance relative to
the measures included in the bonus formula, allowing minimal subjectivity in bonus awards.
Under the balanced scorecard, bonuses were intended to be a function of subjective performance
ratings, controlling for labor grade and base salary.
We examine the extent to which the performance ratings in the six scorecard categories
were weighted in bonus computations in Table 4. Because the maximum bonus award is
intended to be a function of the branch manager’s labor grade and current salary, we include
these factors as control variables in the analyses (where 1= the lowest labor grade and 3 = the
highest). Bonuses are expected to be smaller at lower labor grades and at higher salary levels
(after controlling for labor grade) due to the maximum targeted total compensation levels
established for each labor grade. Panel A of Table 4 investigates the relation between bonuses
and ratings of branch managers' overall performance. As expected, bonuses have a negative
relation with salary level and a positive relation with labor grade in these models. Overall ratings
(ranging from 1 = below par to 3 = above par) are positively associated with bonuses after

26
controlling for labor grade and salary, indicating that better performance evaluations increased
bonuses. The coefficients on overall ratings suggest that a one category increase in the overall
performance rating increased the quarterly bonus by $1,042 to $1,909, depending upon the
quarter.
The influence of the ratings in individual scorecard categories on bonus awards is
examined in Panel B of Table 4. The coefficients on salary level and labor grade again have the
predicted signs, but are statistically insignificant in most of the models. Financial performance
played an even greater role in bonus determination than in the determination of overall ratings.
Financial performance ratings are the only evaluations that were statistically significant in each
quarter. A one-category increase in a manager’s financial par rating raised the quarterly bonuses
by $812 to $1,032. Ratings of strategy implementation were significant predictors of bonus
payouts in three of the five quarters, but customer ratings were only significant at the ten percent
level (two-tail) in one quarter. The coefficients on these variables are substantially lower than
those on the financial ratings, implying that a one category difference in financial evaluation had
a larger effect on bonus awards than a one category difference in customer or strategy
evaluations.10 The more qualitative standards, control, and people ratings had little significant
effect on bonus awards. People ratings were statistically significant in the third quarter of 1995
as were standards ratings in the fourth quarter of 1995, but ratings for control were not significant
predictors of bonuses in any period.
Similar to the results in Table 3, we again observe that bonus awards incorporated both
10 Stepwise regression results also indicate that financial par scores accounted for the largest incrementalcontribution to the explained variance in quarterly bonuses. On average, the R2 from the introduction of the financialpar scores explained 78.5 percent (median = 79.4%) of the total R2, with the percentage contribution to total R2
ranging from 64.4 percent in the second quarter of 1995 to 95.4 percent in the first quarter of 1996 and 80.3 percentin the second quarter of 1996.

27
financial and non-financial factors, but that the majority of the bonus was related to a branch
manager’s performance relative to financial goals. Interestingly, the bonus computation under
the balanced scorecard system is focused much more on financial outcomes than the bonus
computation under the PIP system. For example, under the 1994 PIP system, bonuses could be
earned even with substandard financial performance, as long as the customer satisfaction and
audit hurdles were achieved and the branch achieved at least four of the other performance
objectives. However, the results in Table 4 indicate that it was unlikely that a branch manager
would receive a bonus with subpar financial performance under the balanced scorecard system,
no matter how well he or she did on the other performance dimensions.11 Thus, at least in terms
of the bonus computation, the 1994 PIP system seems to have incorporated greater “balance”
across performance measures than the balanced scorecard system. Whereas branch managers had
to meet audit and customer satisfaction hurdles as well as four of the eight other performance
objectives to receive any bonus in 1994 (i.e., 60% of the ten performance objectives and hurdles),
only one or two of the performance targets that were emphasized in a given quarter needed to be
achieved to receive a bonus under the scorecard. Finally, unlike the strict formula used to
compute bonuses under the PIP system, the balanced scorecard performance measures explained
only about half of the observed bonuses. The large unexplained variance in bonus amounts
provides direct evidence of the greater subjectivity in the balanced scorecard system than in the
PIP system.
The Balanced Scorecard’s Influence on Branch Manager Attitudes
11 We examined whether “below par” performance influenced bonuses by computing dichotomous variables for eachcategory’s performance, coded one if the branch received a below par rating on that dimension and zero otherwise. When bonuses were regressed on these measures, only below par financial performance was statistically significant. The negative coefficient on financial performance and insignificant coefficients on the other categories suggest thatsubstandard financial performance reduced bonuses, while substandard performance on the other dimension had little
28
Proponents of the balanced scorecard concept maintain that this approach provides a
powerful means for communicating a firm’s vision and strategy and for focusing attention on the
drivers of long-term organizational performance. Similarly, senior GFS executives stated that
with the formation of the scorecard, the company for the first time had an integrated corporate-
wide strategy, with the scorecard providing a common sense of what employees are working to
accomplish. The scorecard is also intended to provide incentives for managers to improve on all
five of the corporation’s strategic “imperatives,” instead of allowing managers to receive bonuses
for growth in customers and revenues alone. Yet, as seen above, the weights placed on the
performance measures in determining bonuses varied from quarter to quarter, leading some of the
branch managers we interviewed to question the relative importance of the various strategic
objectives in performance evaluation and compensation decisions.
Table 5 examines the balanced scorecard’s influence on Western branch managers’
perceived understanding of strategic goals and their attitudes toward performance evaluation
criteria using data from internal employee surveys conducted in October, 1994 (under the PIP
program) and February, 1996 (under the balanced scorecard system). We also contrast mean
1996 branch manager responses in the Western region to mean 1996 responses in the other
NABD regions, which were just beginning to replace the PIP program with the scorecard
approach. The cross-region comparisons allow us to control for time-specific factors that may
have influenced managers’ answers.12
The mean Western responses in 1994 and 1996 reveal few statistical differences in
significant effect on bonus awards.12 In the 1994 survey, branch manager scores were not coded separately from other employees’ scores in branchesoutside of the Western region. This prevents us from conducting a natural experiment comparing 1994 and 1996branch manager responses in branches that implemented the balanced scorecard in 1995 and those that retained thePIP system until early 1996.
29
perceptions under the formula-based PIP program and the more subjective, but broader, balanced
scorecard. The scorecard’s implementation brought little change in branch managers’ stated
understanding of strategic goals or their connection to the managers’ actions. Under both
systems, branch managers, on average, claimed that they understood GFS’s business goals, the
goals of their work group, the connection between their jobs and the business objectives, and the
basis on which performance would be judged. In contrast, the managers generally agreed that the
GFS strategy had become clearer to them between 1995 and 1996, suggesting that the scorecard
may have helped to communicate the company’s strategic goals. However, branch managers felt
less comfortable with the adequacy of the information provided to them about progress towards
business goals, a result consistent with the branch manager interviews.
Despite the previous section’s results and claims by some branch managers that the
weights placed on the scorecard measures varied too much from quarter-to-quarter, responses to
the statement “business objectives change too much” were nearly identical in the two periods.
Similarly, the perceived importance of customers, quality, and employee development in
performance evaluation and compensation decisions, as well as agreement with the statement
“compensation decisions are consistent with performance,” were not significantly different under
the two systems.
When the Western region’s 1996 survey responses are compared to 1996 responses for
the other NABD regions (which were just beginning to implement the balanced scorecard), a
number of significant differences emerge. The Central region received the lowest ratings on
nearly every dimension in the survey. However, the circumstances in the Central region were
unique. Prior to the 1996 survey, area directors had been eliminated and branch managers were
30
forced to compete for access to the president of the region, with negative consequences for
morale. Compared to the Western region, the Southern region received higher scores on the
perceived importance of customer service and employee development. Managers in the
Southern, Eastern, and Northern regions all ranked the adequacy of information on progress
towards business goals higher than their Western counterparts. Western branch managers,
however, rated the availability of quality measures for performance evaluation higher than
managers in the Eastern and Northern regions.
The responses in Table 5 provide little evidence that the change from the PIP system to
the balanced scorecard had a positive impact on managerial perceptions of business strategies,
goals and priorities, performance evaluation and compensation bases, or the adequacy of
measures for decision-making. The survey results indicate that the considerable number of
committee meetings, internal discussions, and formal communications to employees about the
balanced scorecard and changes in the compensation program had almost no effect on employee
attitudes. One explanation for these results is that the 1996 employee survey, although coming
after several quarters of bonus awards under the new system, was conducted too soon after the
balanced scorecard’s implementation, and thus perceptual changes may have been attenuated.
Alternatively, the balanced scorecard may have been perceived as being fundamentally the same
as the PIP system (which also incorporated metrics such as household growth, audit results, and
customer satisfaction). Finally, the formula-based PIP system may have communicated strategic
and operational goals just as well as the broader, but more subjective, balanced scorecard.
Performance Changes
Although the survey results indicate that the perceived importance of strategic objectives
31
such as customer service, employee development, and quality changed little with the adoption of
the balanced scorecard, a key test of the scorecard’s effectiveness is whether the system shifted
managers’ efforts from a single-minded focus on growth to a broader set of objectives that also
encompassed profitability and non-financial performance. A major criticism of the PIP program
was that it allowed branch managers to earn bonuses by increasing revenues and customers, even
though profit margins were not improving. In addition, the customer satisfaction hurdle only
required branches to receive satisfaction scores that were statistically equal to the region average
to be eligible for a bonus, even if satisfaction did not increase.
We examine whether the balanced scorecard fostered a greater emphasis on profitability
and non-financial performance by comparing performance improvement rates under the PIP and
scorecard systems. Due to data constraints, we focus on six measures that were tracked under
both systems: revenues, expenses, margins, return on sales (margins/revenues), the branch
quality index, and overall satisfaction with GFS. Financial performance differentials are
measured by comparing performance changes during the first four quarters under the balanced
scorecard (third quarter of 1995 to the second quarter of 1996) and performance changes during
the last four quarters of the PIP program (second quarter of 1994 to the first quarter of 1995).13
Changes in the branch quality and customer satisfaction scores are measured between the first
quarter of 1995 (the last full quarter under the PIP system) and the first quarter of 1996.
The performance comparisons are provided in Table 6. Mean and median revenue
growth rates were greater under the scorecard system, although the growth differentials were not
statistically significant in percentage terms. However, expenses also increased under the
13 The balanced scorecard was implemented mid-way through the second quarter of 1995. Consequently, this quarteris not included in the performance tests.
32
balanced scorecard, yielding lower mean and median growth rates for both profit margins and
return on sales. The branch quality and customer satisfaction scores, on the other hand, increased
significantly. Mean (median) branch quality rose by 17.6 percent (15.3%) and overall
satisfaction with GFS by 11.0 percent (18.9%). Although the higher branch quality and overall
customer satisfaction scores indicate that the scorecard may have focused greater attention on
these measures, the lower profitability improvement rates suggest that this focus may have come
at the expense of financial performance, at least in the short-term.
Table 7 examines the extent to which financial and non-financial performance changed
after the balanced scorecard’s implementation. We compute changes in each of the quantitative
scorecard measures between the third quarter of 1995 and the second quarter of 1996.14 Similar
to the results in Table 6, revenues and expenses were both significantly higher. However, the
profitability results are mixed. Mean and median changes in branch margins were positive, but
only the median percentage change is statistically significant. Median changes and percentage
changes in branch return on sales, in contrast, are statistically negative. The non-financial
indicators reveal significant increases in the branch quality index (but not overall GFS customer
satisfaction), retail households, and business and professional households. Moreover, the growth
in households exceeded the increase in household attrition, although average assets under
management (AUM) per household fell after implementation of the balanced scorecard.15
The performance analyses in Tables 6 and 7 indicate that non-financial performance
generally improved with the implementation of the balanced scorecard system. Consistent with
14 GFS replaced household attrition and assets under management (AUM) per household with other measures ofstrategy implementation in the second quarter of 1996. As a result, reported changes in these measures representdifferences between the third quarter of 1995 and the first quarter of 1996.15 A small portion (less than 1%) of the reduction in AUM per household was due to a change in the definition ofassets under the branches’ control.

33
the increase in households, we also observe an improvement in branch revenue. However,
performance on other financial dimensions, such as expenses, margins, and return on sales,
declined somewhat after the balanced scorecard was implemented. These results suggest that
branch managers may have invested financial resources to increase customer satisfaction, the
number of households, and market share, but that any increases in profitability from these
investments were not realized during the (relatively short) time period considered in our tests.
Expenses may also have risen due to the cost of implementing the new measurement system. As
a result, the implementation of the balanced scorecard did not result in contemporaneous
financial improvements for GFS branches.
Non-Financial Measures as Leading Indicators
A key assumption of the balanced scorecard approach is that non-financial measures can
be leading indicators of future financial results. If the balanced scorecard system motivated
branch managers to make investments that increased leading indicators of financial results, these
increases should be associated with subsequent increases in financial performance. We examine
whether the observed improvements in non-financial measures were leading indicators of
financial performance in Table 8. For this analysis, we regress percentage changes in financial
performance between the first and second quarters of 1996 on percentage changes in the
quantitative strategy and customer measures between the third and fourth quarters of 1995.16
Although this lag is relatively short, the frequent repurchase cycle and relatively low customer
switching costs in retail banking lead to a reasonably short lag between managerial actions and
observed economic performance.
16 We deleted outliers from the performance analyses in Tables 8. This procedure removed two or fewerobservations per model.

34
Percentage changes in the number of business and professional households exhibit a
significant positive relation with subsequent percentage changes in margins and return on sales,
as do percentage changes in retail households with future changes in margins (p < 0.15, two-tail).
Consistent with GFS’s strategic plan, the results for the strategy implementation measures
indicate that branches generating larger increases in these customer groups achieved greater
improvements in profitability in later quarters. The branch quality index is also positively
associated with subsequent changes in revenues, margins, and return on sales, supporting claims
in the performance measurement literature that customer satisfaction is a leading indicator of
financial performance. In contrast, overall satisfaction with GFS is unrelated to the financial
measures. This result is likely attributable either to the factors influencing overall satisfaction
with GFS having little affect on branch financial performance, or to the modest reliability of the
single-item, “top-two-box” method used to measure overall GFS satisfaction. Marketing
research studies, for example, find that single-item customer satisfaction measures such as the
overall satisfaction score have much lower reliability and predictive validity than multiple-item
indices such as that used to evaluate branch quality (e.g. Ryan et al., 1995).
Changes in the branch quality index are also statistically associated with subsequent
changes in both retail and business/professional households. These results suggest that increased
customer satisfaction at the branch level improved profitability directly by increasing customer
loyalty and price tolerance, as well as indirectly through the new customers brought in by
positive word-of-mouth advertising. Although GFS did not explicitly develop a “business
model” linking the non-financial balanced scorecard measures to each other or to financial
performance, the results in Table 8 suggest that one important link in the firm’s business model
35
is the relation between changes in the branch quality index and subsequent changes in both
households and profitability. Overall, the evidence in Table 8 indicates that the observed
improvements in non-financial measures were associated with changes in financial performance,
but only with some lag.
We also estimated the performance change models using the quantitative variables in
Table 8 as well as the qualitative par ratings for the standards, people, and control categories (not
reported in the tables). Changes in the standards par rating, which includes a subjective
assessment of the branch manager’s contribution to the overall business, were a significant
predictor of future changes in margins and return on sales, with the results for the quantitative
measures varying little from those reported in Table 8. Changes in the people and control par
ratings, on the other hand, were not statistically significant in any of the performance change
models. The adjusted R2s for the margin and return on sales models increased to 0.34 and 0.36,
respectively, when the three qualitative par ratings were included as additional explanatory
variables.17 This evidence supports analytical models which indicate that qualitative measures
such as the standards par ratings can incorporate valuable information on managerial
performance that may be costly or impossible to capture using quantitative measures.
CONCLUSIONS AND ISSUES FOR FUTURE RESEARCH
Our analyses suggest that GFS’s balanced scorecard yielded few significant
improvements over the PIP system during its first year. Although the more subjective scorecard
system was designed to reduce the complexity and frequent changes experienced with the
formula-based PIP system, the evidence suggests that the subjectivity embedded in the scorecard
17 When the performance variables were regressed on par ratings for the six scorecard categories, the standards parscore was significant in the margin and return on sales models, but none of the other par scores were statistically

36
system actually increased the complexity of the bonus determination process and the frequency
with which performance objectives changed. The level of “balance” in bonus determinations
also appears to have declined somewhat in the first year of the scorecard process, with financial
performance becoming the primary determinant of bonuses. GFS used the slogan “five out of
five [corporate imperatives], they all count,” but fewer than half of the scorecard categories on
average were significant determinants of bonus payouts (p < 0.10, two-tail). In no quarter was
the bonus award a function of more than four of the six scorecard dimensions. The difference
between the stated importance of performing well on all of the scorecard measures and their
actual use in determining bonuses is at least partially due to differing opinions within GFS on the
definition of “balance.” For example, one member of the Western president’s staff, after taking
some time to reflect, defined balance as the ability to shift the weights on performance measures
as circumstances changed, rather than the need to achieve on multiple performance dimensions.
The move from the formula-based PIP system to the more subjective, but broader,
scorecard also had little effect on branch managers’ perceptions of strategic goals and objectives
or compensation determinants, despite statements by GFS that the balanced scorecard provided
the firm with its first integrated corporate strategy. While this may be true for the firm as a
whole, the scorecard does not appear to have changed the Western branch managers’
understanding of the firm’s strategy or the connection between their jobs and the achievement of
the strategic objectives. Finally, the evidence does suggest that the scorecard motivated managers
to place more emphasis on non-financial dimensions such as customer satisfaction, branch
quality, and household growth. However, increases in the branch quality index, which were
predictive of future improvements in financial performance, were not rewarded during the first
significant.
37
year of the scorecard system and may have come at the expense of contemporaneous financial
results. The obvious implication of these results is that branch managers are unlikely to put
effort into improving the branch quality index, no matter how valuable this may be to the bank,
when these actions are not factored into bonus decisions.
Based on its first-year experience with the balanced scorecard and the results from this
study, the Western region of GFS has made a number of changes in its balanced scorecard
system. For example, the strategy implementation measures now include the proportion of
automated teller machine (ATM) transactions and market share. In place of monthly results,
overall GFS satisfaction and the branch quality index are now reported to branch managers as
three-month moving averages. NABD-wide changes in the balanced scorecard and bonus
compensation system are also being considered, due mainly to the results of a December, 1996
employee survey in the Northern region which found attitudes toward the scorecard to be neutral
at best and strongly negative with respect to the scorecard's impact on bonus payouts. In the
midst of these changes, the Western region's performance has improved in several key categories.
From the third quarter of 1996 through the second quarter of 1997, branch revenues increased 13
percent and branch margins increased six percent. Branch revenues grew faster than margins
because the ratio of expenses to revenues increased by seven percent, leading to lower return on
sales. Overall satisfaction with GFS increased 2.6 percent, while the branch quality index
increased by 8.5 percent. The number of retail households actually declined by 0.5 percent, while
the number of business and professional household, the most profitable segment of the retail
banking industry, increased 12.5 percent. Future analyses can determine the extent to which
38
these changes in performance were motivated by the scorecard, and whether the recent changes
in the Western region’s scorecard and compensation have affected business outcomes.
Our study raises a number of issues for future research. The first is defining precisely
what "balance" is and the mechanisms through which "balance" promotes performance. A
common view, perpetuated by early writings on the balanced scorecard concept (e.g., Kaplan and
Norton, 1992), is that "balance" is achieved by diverse measurement in the domains of financial
performance, operational performance, performance for the customer, and learning and
innovation. Multiple measures in each of several domains minimize the risk that information
germane to business results will be lost. But this approach creates the risk that strategic focus
will be lost because effort and attention are directed toward so many objectives that priorities
among these objectives cannot be set. For example, Kaplan and Norton (1996) describe "Pioneer
Petroleum" as a model implementation of the "balanced scorecard" even though its scorecard
contains upwards of 65 performance measures. A somewhat different view, originally outlined
by Eccles (1991), is that the firm's business model, which describes causal relations between the
drivers of performance and the results sought by the firm, must be understood before effective
performance measures can chosen. By implication, a balanced set of measures would consist of
two kinds of metrics: measures demonstrated to drive the performance outcomes sought by the
firm (i.e., “leading” indicators) and measures of these outcomes (i.e., “lagging” indicators).
Establishing the firm's business model prior to selecting measures has the advantage of
sharpening strategic focus and direction and setting priorities. But it is difficult to establish the
reliability and predictive validity of measures entered into the business model without having
done a great deal of measurement and analysis in the first place, and there is no guarantee that a

39
business model based on current measures and competitive environments will hold in the future.
In GFS’s case, the question is whether the performance benefits from the broad set of
measures in the balanced scorecard, which were not chosen based on an explicit business model
linking the multiple measures to each other and to financial performance, would have been
greater if the bank had first determined that measures such as the branch quality index (but not
overall GFS satisfaction) were leading indicators of financial performance and then focused
efforts on improving those metrics. Unfortunately, we cannot answer this question with the
available data. However, future research can provide guidance as to which conception of
"balance"--"balance" as variety in measurement or balance as selection of a somewhat smaller set
of measures based on their current reliability and predictive validity (which may not hold in the
future)--best promotes business outcomes.
A second issue is how closely business models should be followed in developing
compensation plans. Analytical research by Gjesdal (1981), Paul (1992), and Feltham and Xie
(1994) shows that an information system that is useful for valuing the firm need not be useful in
assessing a manager’s performance. For example, customer satisfaction may be the primary
determinant of economic performance, but it may be influenced by many factors that are outside
the manager’s control. As a result, the metric may be a noisy measure of the manager’s actions.
Similarly, a measure may be a leading indicator of economic performance, but it may not be cost
effective for the firm to motivate managers to improve it any further. Consequently, just because
certain performance measures are leading indicators of economic performance does not
necessarily imply that the weights placed on these measures for valuing the firm or predicting
future economic performance should be the same weights used in evaluating and rewarding

40
managers. Formal business models may also overlook “soft” or hard to measure performance
dimensions. Yet, as seen with the predictive ability of the standards par ratings in GFS,
subjective assessments of managerial performance may also be leading indicators of financial
success. Thus, the use of business models in designing compensation plans remains an open
issue.
A third issue is whether the same scorecard that is used to develop strategic priorities and
monitor strategic actions should be used to evaluate managerial performance. Although a large
number of scorecard measures may be desirable for decision-making and performance
monitoring purposes, a smaller number of selected performance measures may be more
appropriate for managerial performance evaluation and compensation purposes. Similarly,
experiments by Schiff and Hoffmann (1996) find that when presented with a scorecard of
financial measures and generally “softer” non-financial measures, participants tend to use the
financial measures for evaluating the performance of the business unit and the non-financial
measures for evaluating managerial performance. A potential avenue for research is examining
the relative value of different types of scorecards and performance measures for different
purposes.
A fourth issue is the desire of most companies to have performance measures that “roll-
up” to equal the performance measure totals at higher organizational levels. Although this
aggregation is possible with financial measures, it may be difficult or impossible with more
qualitative measures. Furthermore, higher-level goals may not translate directly into effective
lower-level goals. For example, one reason that customer-related performance evaluations and
bonus awards focused on overall GFS satisfaction was the Western region’s decision to evaluate
41
branch managers using a customer satisfaction index that rolled-up to provide an overall measure
of the region’s performance relative to the corporate goal of 80 percent overall satisfaction, even
though our analyses suggest that the branch quality index was a much better predictor of future
branch financial performance. The Towers Perrin survey suggests that problems such as these
are not isolated, with 34 percent of the respondents finding it difficult to decompose scorecard
goals for lower-levels in the organization. Understanding the links between performance
measures at different organizational levels will become increasingly important as more and more
companies incorporate non-financial metrics into their performance measurement systems.
A fifth issue concerns the trade-offs among the multiple measures on a balanced
scorecard. Although “balance” may require a manager to perform well on multiple dimensions,
actions taken to improve one performance measure may lead to short-term declines in other
performance measures. For example, the evidence suggests that improvements in branch quality,
overall GFS satisfaction, and the number of households may have come at the expense of
contemporaneous financial performance and quarterly bonuses, even though some of these non-
financial dimensions appear to be leading indicators of future financial performance. A key
question is how to retain “balance” in managerial actions and performance evaluations in the
presence of trade-offs. Kaplan and Norton (1996) suggest the use of hurdles to insure that
managers do not receive bonuses when they over-perform on some dimensions but under-
perform on others, an approach GFS used explicitly in the PIP system and implicitly in the
scorecard evaluations. However, a potential problem with hurdles is that they may focus undo
attention on dimensions requiring minimum performance levels and may prompt managers to
avoid investments that reduce short-term performance on the hurdle dimensions, even if these

42
investments are beneficial in the long-term. Additional research is needed on the treatment of the
inevitable trade-offs that managers will need to make among the various scorecard performance
measures.
Finally, there is the issue of whether any system using multiple measures to evaluate
performance and to compensate people can be sustained in divisionalized and highly
decentralized firms. The standard argument for divisionalization is that it economizes on
bounded rationality by focusing attention on financial results (Williamson, 1975). Clearly, the
"balanced scorecard" as implemented at GFS did not economize on bounded rationality. Rather,
it consumed a great deal of people's time, at least initially. An alternative view is that multiple
and somewhat disparate measures are essential to divisionalized firms because such measures
preserve variability—units that perform well on some measures are likely to perform less well on
others—and hence the possibility of long-term improvement (Meyer, 1993; Meyer and Gupta,
1994). As more firms adopt and then either retain or reject balanced scorecards, the
sustainability of performance evaluation and compensation systems using multiple measures will
be better understood.
43
BIBLIOGRAPHY
American Institute of Certified Public Accountants (1994). Improving business reporting—acustomer focus. New York: American Institute of Certified Public Accountants, Inc.
Baiman, S. & Rajan, M.V. (1995). The informational advantages of discretionary bonus schemes.The Accounting Review, 70, 557-579.
Baker, G., Gibbons, R., & Murphy, K.J. (1994). Subjective performance measures in optimalincentive contracts. Quarterly Journal of Economics, 109, 1125-1156.
Banker, R. & Datar, S. (1989). Sensitivity, precision and linear aggregation of signals forperformance evaluation. Journal of Accounting Research, 27, 21-39.
Bommer, W.H., Johnson, J.L., Rich, G.A., Podsakoff, P.M., & MacKenzie, S.B. (1995). On theinterchangeability of objective and subjective measures of employee performance: a meta-analysis. Personnel Psychology, 48, 587-605.
Deloitte & Touche (1994). Performance measurement. New York: Deloitte Touche TohmatsuInternational.
Eccles, R.G. (1991). The performance measurement manifesto. Harvard Business Review, 69 (2),131-137.
Feltham, G.& Xie, J. (1994). Performance measure congruity and diversity in multi-taskprincipal/agent relations. The Accounting Review, 69, 429-453.
Gjesdal, F. (1981). Accounting for stewardship. Journal of Accounting Research, 19, 208-231.
Goold, M. And Quinn J.J. (1993). Strategic control: milestones for long-term performance.London: Pitman Publishing.
Holmstrom, B. (1979). Moral hazard and observability. Bell Journal of Economics, 10, 74-91.
Holmstrom, B. & Milgrom, P (1991). Multitask principal-agent analyses: incentive contracts,asset ownership, and job design. Journal of Law, Economics, & Organization, 7, 24-52.
IMA (1996). Are corporate america’s financial measurements outdated?. Montvale, NJ: Instituteof Management Accountants.
Ittner, C.D. & Larcker, D.F. (1997). Quality strategy, strategic control systems, andorganizational performance. Accounting, Organizations and Society, 22, 293-314.
Ittner, C.D., Larcker, D.F., & Rajan, M.V. (1997). The choice of performance measures in annual
44
bonus contracts. The Accounting Review, 72, 231-255.
Kaplan, R.S. & Norton, D.P. (1992). The balanced scorecard—measures that drive performance.Harvard Business Review, 70 (1), 71-79.
Kaplan, R.S. & Norton, D.P. (1996). The balanced scorecard: translating strategy into action.Boston: Harvard Business School Press.
Lorange, P. & Murphy, D. (1984). Considerations in implementing strategic control. Journal ofBusiness Strategy, Fall, 27-35.
Meyer, M.W. (1993). Organizational design and the performance paradox. In Richard Swedberg,ed., Explorations in Economic Sociology. New York: Russell Sage Foundation.
Meyer, M.W., and Gupta, V. (1994). The Performance Paradox. Research in OrganizationalBehavior, 16, 301-361.
Mintzberg, H. (1987). Crafting strategy. Harvard Business Review, 65 (4), 66-75.
Newsom, W.B. (1990). Motivate, now!. Personnel Journal, 69 (2), 51-55.
Paul, J. (1992). On the efficiency of stock-based compensation. Review of Financial Studies, 5,471-502.
Prendergast, C. & Topel, R. (1993). Discretion and bias in performance evaluation. EuropeanEconomic Review, 37, 355-365.
Quinn, J.B. (1980). Strategies for change. Homewood, IL: Richard D. Irwin.
Ryan, M.J., Buzas, T. And Ramaswamy, V. (1995). Making CSM a power tool. MarketingResearch: A Magazine for Management & Application, 7 (Summer). 10-16.
Schiff, A.D. & Hoffman, L.R. (1996). An exploration of the use of financial and nonfinancialmeasures of performance in a service organization. Behavioral Research in Accounting, 8, 134-153.
Towers Perrin (1996). Inside “the balanced scorecard.” Compuscan Report, January, 1-5.
Van Eerde, W. & Thierry, H. (1996). Vroom’s expectancy models and work-related criteria: ameta-analysis. Journal of Applied Psychology, 81, 575-586.
Williamson, O. (1975). Markets and Hierarchies: Analysis and Antitrust Implications. NewYork: The Free Press.
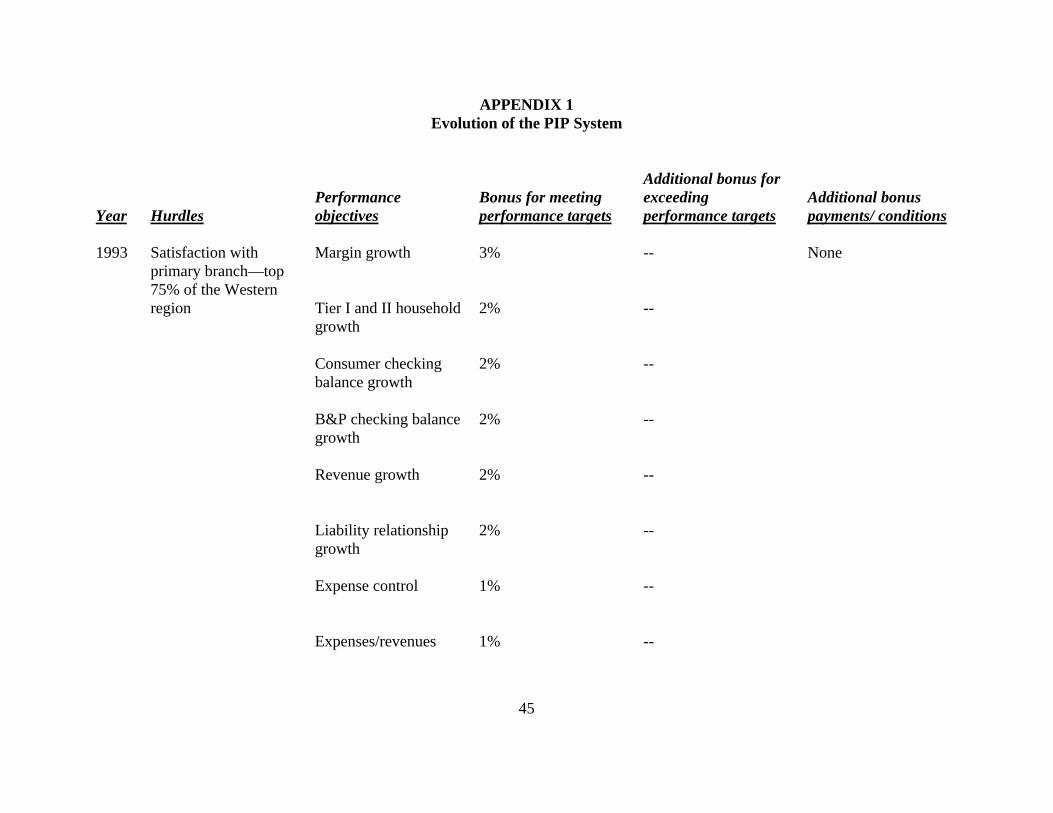
45
APPENDIX 1Evolution of the PIP System
Year HurdlesPerformanceobjectives
Bonus for meetingperformance targets
Additional bonus forexceedingperformance targets
Additional bonuspayments/ conditions
1993 Satisfaction withprimary branch—top75% of the Westernregion
Margin growth
Tier I and II householdgrowth
Consumer checkingbalance growth
3%
2%
2%
--
--
--
None
B&P checking balancegrowth
Revenue growth
2%
2%
--
--
Liability relationshipgrowth
Expense control
2%
1%
--
--
Expenses/revenues 1% --

46
Year HurdlesPerformanceobjectives
Bonus for meetingperformance targets
Additional bonus forexceedingperformance targets
Additional bonuspayments/ conditions
1994 Satisfaction withprimary branch—statistically at or abovethe region mean
Operations control—audit score of "4" or"5"
Margin growth
Tier I and II householdgrowth
Consumer checkingbalance growth
3%
1.5%
1.5%
Up to 1.5%
Up to 2.5%
Up to 2.5%
Bonus paymentaugmented bymultiplier of 10% forsatisfaction withprimary branchstatistically above theregion mean
B&P checking balancegrowth
Revenue growth
1.5%
3%
Up to 2.5%
Up to 4.5%
Liability relationshipgrowth
Expenses/revenues
1.5%
.5%
Up to 2.5%
Up to 1%
Footings/tier I and IIhouseholds
.5% Up to 1%

47
Year HurdlesPerformanceobjectives
Bonus for growth/meeting performancetargets
Additional bonus forhigh growth/exceedingperformance targets
Additional bonuspayments/ conditions
1995 Branch quality index—at or above the regionmean
Operations control—audit score of "4" or"5"
Overall GFSsatisfaction ≥ 80%
Target householdgrowth
Total checking balancegrowth
5%
2% for growth
1% for growth1% for goal
--
Up to 1%
Up to .5%Up to .5%
Bonus paymentincreased by multiplierof 2 to 10% for highproportions ofautomated teller andremote accesstransactions
Revenues and marginsmustmeet accountabilitytargets
Liability/asset growth
Revenue growth
Margin growth
1% for growth1% for goal
2% for growth2% for goal
2.5% for growth2.5% for goal
Up to .5%Up to .5%
Up to .5%Up to .5%
Up to 1%Up to 10%

48
Summarymeasure x basesalary
BonusSummarymeasure
Measure
Results vs. goal Sum of bonuspercentagesattached toeach goal ifhurdles aremet; zerootherwise
Measured performance determines bonus.
Figure 1Flow Chart of PIP Process

49
Bonus Overallevaluation
Subjective parrating based onevaluation onindividualmeasures
Subjective parrating based onevaluation inscorecardcategories
A function of:(a) base salary(b) labor grade(c) overall evaluation(d) bonus pool
Evaluation incategory
Evaluation onmeasure
Measure
Results vs. goal(financial,strategy,customer,control), ornone (people,standards)
Subjective parrating based onresults vs. goal,otherwiseentirelysubjective
Figure 1, continued Flow Chart of "Balanced Scorecard"
Measured performance does not determine bonus.

50
Table 1
Reported Problems in Implementing the Balanced Scorecard Concept;57 Organizations Responding to a 1996 Survey by Towers Perrin
Percent responding:
Not aproblem
1 2 3 4
Majorproblem
5
Difficult to evaluate relative importance ofmeasures 2% 25% 35% 29% 9%
Time and expense involved 7 25 43 20 5
Requires quantification of qualitative data 7 18 30 36 9
Large number of measures may diluteoverall impact 9 23 25 36 7
Difficult to decompose goals for lower-levels in organization 12 18 36 25 9
Requires a highly-developed informationsystem 13 18 25 35 9
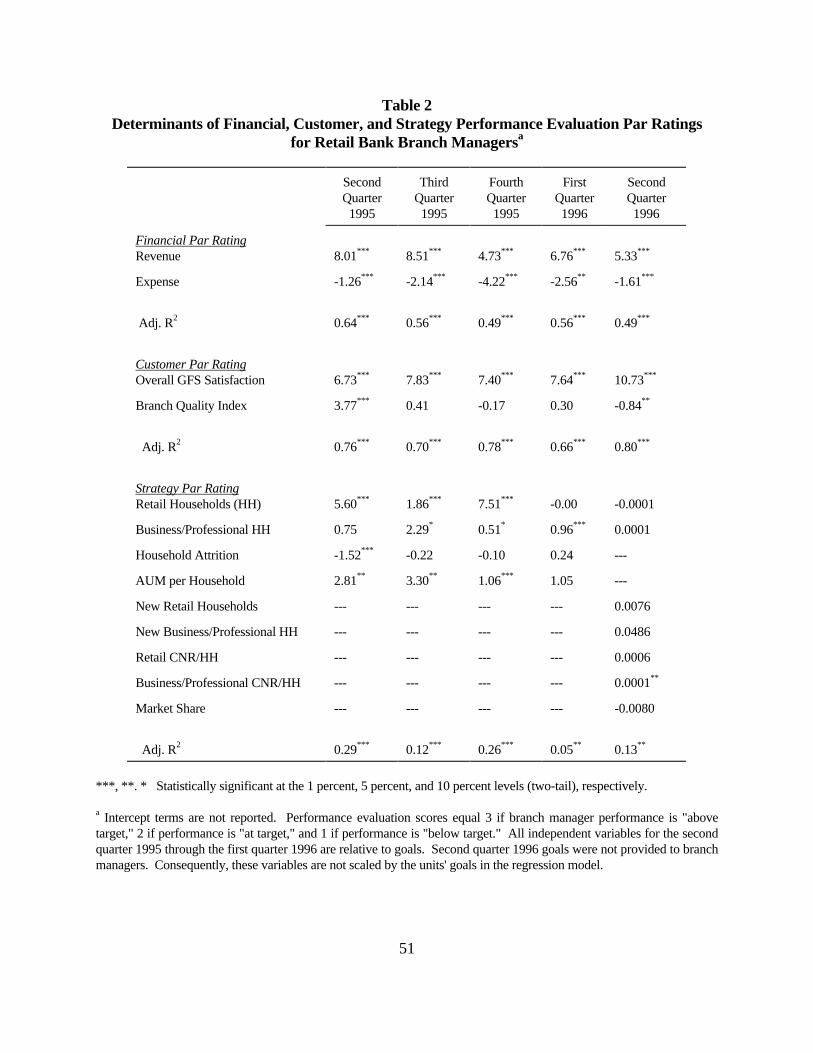
51
Table 2Determinants of Financial, Customer, and Strategy Performance Evaluation Par Ratings
for Retail Bank Branch Managersa
SecondQuarter
1995
ThirdQuarter
1995
FourthQuarter
1995
FirstQuarter1996
SecondQuarter1996
Financial Par RatingRevenue 8.01*** 8.51*** 4.73*** 6.76*** 5.33***
Expense -1.26*** -2.14*** -4.22*** -2.56** -1.61***
Adj. R2 0.64*** 0.56*** 0.49*** 0.56*** 0.49***
Customer Par RatingOverall GFS Satisfaction 6.73*** 7.83*** 7.40*** 7.64*** 10.73***
Branch Quality Index 3.77*** 0.41 -0.17 0.30 -0.84**
Adj. R2 0.76*** 0.70*** 0.78*** 0.66*** 0.80***
Strategy Par RatingRetail Households (HH) 5.60*** 1.86*** 7.51*** -0.00 -0.0001
Business/Professional HH 0.75 2.29* 0.51* 0.96*** 0.0001
Household Attrition -1.52*** -0.22 -0.10 0.24 ---
AUM per Household 2.81** 3.30** 1.06*** 1.05 ---
New Retail Households --- --- --- --- 0.0076
New Business/Professional HH --- --- --- --- 0.0486
Retail CNR/HH --- --- --- --- 0.0006
Business/Professional CNR/HH --- --- --- --- 0.0001**
Market Share --- --- --- --- -0.0080
Adj. R2 0.29*** 0.12*** 0.26*** 0.05** 0.13**
***, **. * Statistically significant at the 1 percent, 5 percent, and 10 percent levels (two-tail), respectively.
a Intercept terms are not reported. Performance evaluation scores equal 3 if branch manager performance is "abovetarget," 2 if performance is "at target," and 1 if performance is "below target." All independent variables for the secondquarter 1995 through the first quarter 1996 are relative to goals. Second quarter 1996 goals were not provided to branchmanagers. Consequently, these variables are not scaled by the units' goals in the regression model.

52
Table 3The Influence of Individual Balanced Scorecard Categories on
Overall Branch Manager Performance Evaluation Par Ratingsa
Overall Par Rating = f(Financial Par Rating, Strategy Par Rating, Customer Par Rating,Control Par Rating, People Par Rating, Standards Par Rating)
SecondQuarter
1995
ThirdQuarter
1995
FourthQuarter
1995
FirstQuarter
1996
SecondQuarter1996
Intercept -0.181 0.058 -0.594** -0.747*** -0.377*
Financial Par Rating 0.443*** 0.264*** 0.524*** 0.496*** 0.448***
Strategy Par Rating 0.083 0.190*** 0.239*** 0.132** 0.103*
Customer Par Rating 0.167** 0.128* 0.132* 0.180*** 0.354***
Control Par Rating 0.086 0.078 -0.015 0.299*** 0.088
People Par Rating 0.040 0.321** 0.170* 0.297** 0.199
Standards Par Rating 0.250* 0.072 0.271** 0.135 0.059
Adj. R2 0.49*** 0.52*** 0.75*** 0.87*** 0.76***
***, **, * Statistically significant at the 1 percent, 5 percent, and 10 percent levels (two-tail), respectively.
a Performance evaluation scores equal 3 if branch manager performance is "above target," 2 if performance is "at target,"and 1 if performance is "below target."

53
Table 4The Influence of Balanced Scorecard Par Ratings, Salary, and Labor Grade
on Branch Manager Bonus Awardsa
SecondQuarter1995
ThirdQuarter1995
FourthQuarter1995
FirstQuarter1996
SecondQuarter1996
A. Bonus = f(Salary, Organizational Level, Overall Par Rating)
Salary -0.05*** -0.02# -0.04*** -0.02# -0.04**
Labor Grade 861.88*** 368.07 189.98 582.53** 1295.01***
Overall Par Rating 1042.04*** 1909.38*** 1173.30*** 1352.44*** 1480.55***
Adj. R2 0.36*** 0.52*** 0.56*** 0.57*** 0.53***
B. Bonus = f(Salary, Organizational Level, Individual Par Ratings)
Salary -0.04# -0.01 -0.05# -0.02 -0.03
Labor Grade 840.51** 168.53 412.10# 248.64 1060.04**
Financial Par Rating 920.78*** 812.33*** 842.37*** 1032.53*** 993.85***
Strategy Par Rating 435.81** 435.27* 230.79 331.02 579.57**
Customer Par Rating 363.82# 439.75* 271.03# 195.68 149.58
Control Par Rating 3.46 309.60 -87.23 88.43 191.00
People Par Rating -142.74 760.52* -120.14 254.24 -59.00
Standards Par Rating 447.76 144.31 656.86** 12.57 497.73
Adj. R2 0.44*** 0.41*** 0.61*** 0.61*** 0.63***
***, **, *, # Statistically significant at the 1 percent, 5 percent, 10 percent, and 15 percent levels (two-tail), respectively.
a Intercept terms are not reported. Performance evaluation scores equal 3 if branch manager performance is "abovetarget," 2 if performance is "at target," and 1 if performance is "below target." Labor grade ranges from 1 to 3, withlarger scores representing higher branch manager levels.
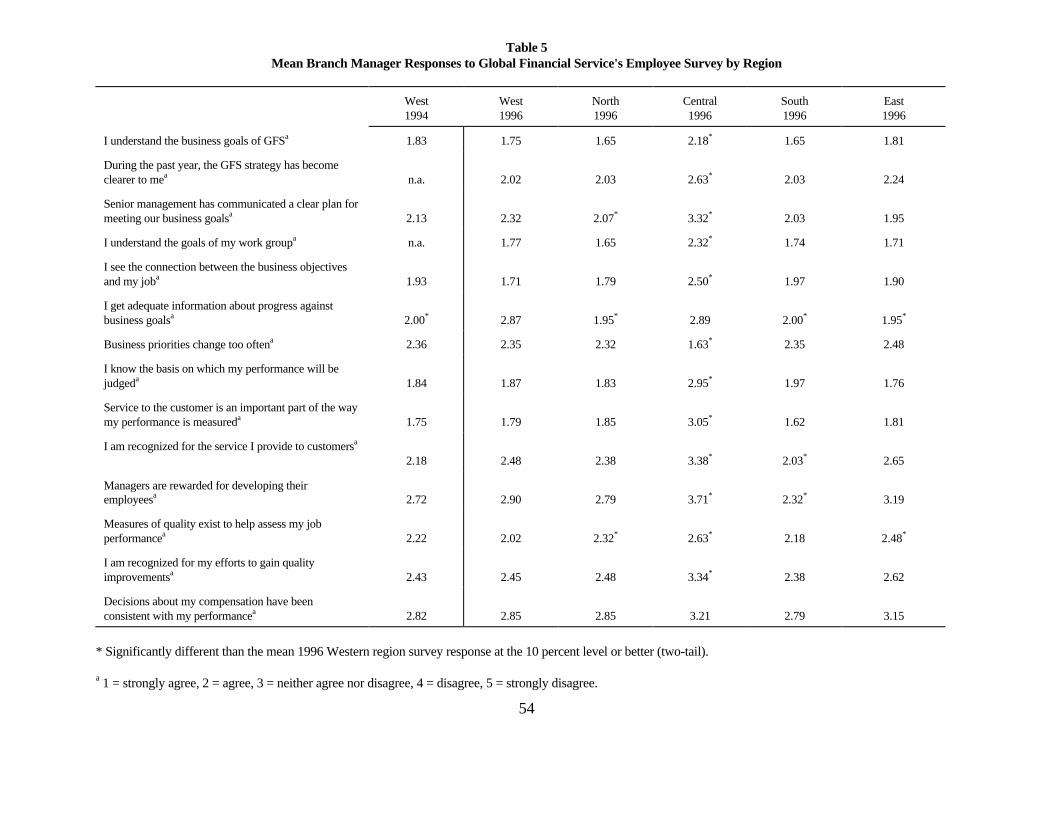
54
Table 5Mean Branch Manager Responses to Global Financial Service's Employee Survey by Region
West1994
West1996
North1996
Central1996
South1996
East1996
I understand the business goals of GFSa 1.83 1.75 1.65 2.18* 1.65 1.81
During the past year, the GFS strategy has becomeclearer to mea n.a. 2.02 2.03 2.63* 2.03 2.24
Senior management has communicated a clear plan formeeting our business goalsa 2.13 2.32 2.07* 3.32* 2.03 1.95
I understand the goals of my work groupa n.a. 1.77 1.65 2.32* 1.74 1.71
I see the connection between the business objectivesand my joba 1.93 1.71 1.79 2.50* 1.97 1.90
I get adequate information about progress againstbusiness goalsa 2.00* 2.87 1.95* 2.89 2.00* 1.95*
Business priorities change too oftena 2.36 2.35 2.32 1.63* 2.35 2.48
I know the basis on which my performance will bejudgeda 1.84 1.87 1.83 2.95* 1.97 1.76
Service to the customer is an important part of the waymy performance is measureda 1.75 1.79 1.85 3.05* 1.62 1.81
I am recognized for the service I provide to customersa
2.18 2.48 2.38 3.38* 2.03* 2.65
Managers are rewarded for developing theiremployeesa 2.72 2.90 2.79 3.71* 2.32* 3.19
Measures of quality exist to help assess my jobperformancea 2.22 2.02 2.32* 2.63* 2.18 2.48*
I am recognized for my efforts to gain qualityimprovementsa 2.43 2.45 2.48 3.34* 2.38 2.62
Decisions about my compensation have beenconsistent with my performancea 2.82 2.85 2.85 3.21 2.79 3.15
* Significantly different than the mean 1996 Western region survey response at the 10 percent level or better (two-tail).
a 1 = strongly agree, 2 = agree, 3 = neither agree nor disagree, 4 = disagree, 5 = strongly disagree.

55
Table 6Comparison of Performance Incentive Plan (PIP) and Balanced Scorecard
Financial and Customer Satisfaction Results
The figures represent differences between performance changes in the four quarters preceding the introduction of thebalanced scorecard (second quarter 1994 to first quarter 1995) and performance changes in the four quarters after itsintroduction (third quarter 1995 to second quarter 1996).a
Mean Median Standard Deviation
A. Changes in Performance
Revenues ($000) 17.20** 12.84** 66.78
Expenses/Sales 0.07*** 0.05*** 0.15
Margins ($000) -15.84** -8.91* 69.03
Return on Sales -0.07*** -0.05*** 0.15
Branch Quality Index 8.06*** 8.03*** 7.19
Overall GFS Satisfaction 6.65*** 6.67*** 8.13
B. Percentage Changes in Performance
Revenues 0.026 -0.025 0.220
Expenses/Sales 0.159*** 0.109*** 0.319
Margins -0.141 -0.081* 0.931
Return on Sales -0.148** -0.103*** 0.636
Branch Quality Index 1.176*** 1.153** 0.164
Overall GFS Satisfaction 1.110*** 1.189*** 0.138
***, **, * Statistically significant at the 1 percent, 5 percent, and 10 percent levels (two-tail), respectively. Signed ranktests for medians and t-tests for means.
a Differences in performance changes are defined as (Second Quarter 1996 - Third Quarter 1995) - (First Quarter 1995 -Second Quarter 1994). Differences in percentage changes are defined as (Second Quarter 1996/Third Quarter 1995) -(First Quarter 1995/Second Quarter 1994). Due to the lack of available branch quality and customer satisfaction data forthe entire PIP period, changes and percentage changes in these measures are computed between the first quarter 1995(PIP) and the first quarter 1996 (balanced scorecard).

56
Table 7Performance Changes Over the First Full Year of the Balanced Scorecard Implementation
in GFS's Western Branches
The changes represent differences between performance in the third quarter of 1995 and the second quarter of 1996,with the exception of assets under management (AUM) per household and household attrition, which GFS eliminatedfrom the balanced scorecard in the first quarter of 1996. Reported changes in these measures represent differencesbetween performance in the third quarter of 1995 and the first quarter of 1996.
Mean Median Standard Deviation
A. Changes in Performance
Revenues ($000) 53.20*** 33.46*** 79.63
Expenses/Sales -0.02 0.03*** 0.44
Margins ($000) 13.20 14.11 77.34
Return on Sales 0.02 -0.03** 0.44
Branch Quality Index 1.92** 2.00** 8.29
Overall GFS Satisfaction 0.70 0.50 7.39
Retail HH 33.97* 37.00* 162.58
Business/Professional HH 13.95*** 11.00*** 24.90
AUM per Household -1160.79 -1256.00*** 6761.62
Household Attrition 16.38*** 15.00*** 24.13
B. Percentage Changes in Performance
Revenues 0.22*** 0.12*** 0.66
Expenses/Sales 0.10*** 0.07*** 0.28
Margins 0.21 0.08* 1.23
Return on Sales 0.00 -0.05** 0.62
Branch Quality Index 0.05** 0.04** 0.16
Overall GFS Satisfaction 0.02 0.01 0.10
Retail HH 0.27 0.01*** 1.88
Business/Professional HH 0.22*** 0.15*** 0.46
AUM per Household -0.04*** -0.06*** 0.13
Household Attrition 0.43*** 0.40*** 0.51
***, **, * Statistically significant at the 1 percent, 5 percent, and 10 percent levels (two-tail), respectively. Signed ranktests for medians and t-tests for means.
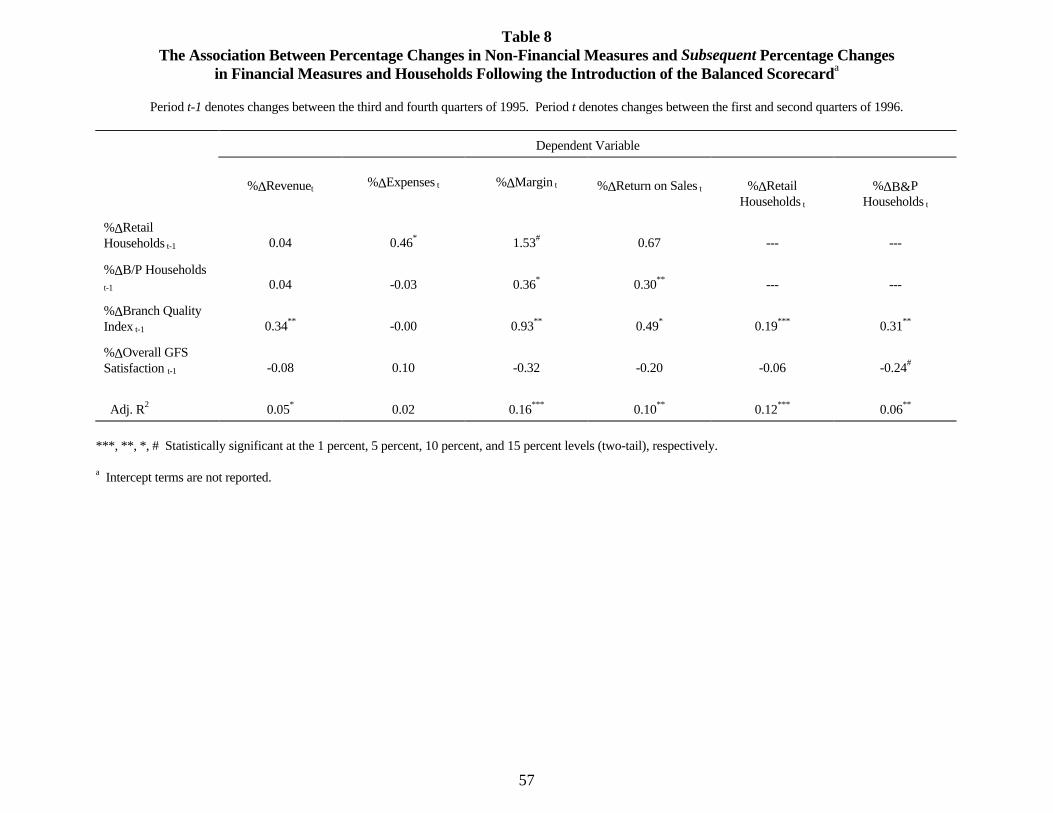
57
Table 8The Association Between Percentage Changes in Non-Financial Measures and Subsequent Percentage Changes
in Financial Measures and Households Following the Introduction of the Balanced Scorecarda
Period t-1 denotes changes between the third and fourth quarters of 1995. Period t denotes changes between the first and second quarters of 1996.
Dependent Variable
%∆Revenuet%∆Expenses t %∆Margin t %∆Return on Sales t %∆Retail
Households t
%∆Β&PHouseholds t
%∆RetailHouseholds t-1 0.04 0.46* 1.53# 0.67 --- ---
%∆B/P Householdst-1 0.04 -0.03 0.36* 0.30** --- ---
%∆Branch QualityIndex t-1 0.34** -0.00 0.93** 0.49* 0.19*** 0.31**
%∆Overall GFSSatisfaction t-1 -0.08 0.10 -0.32 -0.20 -0.06 -0.24#
Adj. R2 0.05* 0.02 0.16*** 0.10** 0.12*** 0.06**
***, **, *, # Statistically significant at the 1 percent, 5 percent, 10 percent, and 15 percent levels (two-tail), respectively.
a Intercept terms are not reported.


