
Petrofacies Evolution of Upper Siwalik-equivalent (?) Pliocene-
Pleistocene Dupi Tila Formation, Bengal Basin, Bangladesh
by
Mustuque Ahmed Munim
A thesis submitted to the Graduate Faculty of
Auburn University
in partial fulfillment of the
requirements for the Degree of
Master of Science
Auburn, Alabama
August 5, 2017
Keywords: Dupi Tila, Upper Siwalik, Provenance,
Pliocene-Pleistocene, Bengal basin, Bangladesh
Copyright 2017 by Mustuque Ahmed Munim
Approved by
Ashraf Uddin (Chair), Professor of Geosciences
Charles E. Savrda, Professor of Geosciences
David T. King, Jr., Professor of Geosciences
Willis E. Hames, Professor of Geosciences

ii
TO THE MEMORIES
OF MY MOTHER

iii
ABSTRACT
Nearly 2.5-km-thick Pliocene-Pleistocene Dupi Tila Formation of the Bengal
basin is composed of yellow, light brown, and pink, coarse- to very fine-grained,
moderately to loosely indurated sandstone, siltstone, silty clay, mudstone and shale with
some pebble beds. These synorogenic sediments crop out in northern (foothills of Garo
hills and Shillong Plateau), eastern (Sylhet Trough and Chittagong Hills), and central
Bangladesh (Comilla and vicinity) and occur in the subsurface in most other areas of
Bangladesh, including the northwest Indian Platform area. Detrital history from this area
provides data pertaining to uplift and erosional history of the hinterland areas (i.e.,
Himalayas, Indo-Burma Ranges and Shillong Plateau).
A systematic study of available detrital modes of sandstones from the Sylhet
Trough, Lalmai hills, Garo hills, Stable Platform, and Sitapahar anticline in Chittagong
hills include an array of sublithic to subfeldspathic quartz arenites. Modal analyses of the
sandstones of the Dupi Tila Formation from Sitapahar anticline (Qt64F10L27), Garo hills
(Qt88F2L10), Northwest Stable Platform (Qt87F6L7), Sylhet Trough (Qt66F9L25) and Lalmai
hills (Qt64F6L30) suggest that the sandstones have orogenic provenance signatures. Only
samples from the Garo hills, which contain higher amounts of mono- and polycrystalline
quartz, differ from the other area samples. The abundance of low- to intermediate-grade
lithic fragments (Lm2) in all samples suggest unroofing of deep crustal levels of the
orogens.
The Dupi Tila Formation samples contain an average 0.8% heavy minerals,
comprising opaque minerals, garnets, sillimanite, tourmaline, kyanite, andalusite, epidote
group minerals, chloritoid & chlorite, staurolite, etc., in order of decreasing in abundance.
The opaque fraction includes magnetite, hematite, ilmenite, pyrrhotite, and rarely pyrite.
The heavy mineral data suggest an orogenic provenance for the Dupi Tila Formation. The
relative abundance of aluminosilicates and related heavy minerals in the Dupi Tila
iv
Formation throughout the Bengal basin reflect systematic unroofing of deeper crustal
levels in the eastern Himalaya. Sillimanites (fibrolites) indicate the sediments were
sourced from protoliths of high-grade regional metamorphic rocks.
Garnet chemistry data for the Dupi Tila Formation indicate a substantial amount
of almandine suggesting provenance from amphibolite and granulite facies rocks. The
presence of Mn-rich garnets (spessartine) in the Stable platform samples indicates
provenance from pegmatite and low-grade metamorphic facies rocks. Tourmaline
chemistry suggests derivation from Al-bearing metapelites, metasammites, calc-silicate
rocks, Li-bearing pegmatites, granitoid pegmatites, and aplites. Epidote chemistry reveals
sediment derivation from relatively high-grade metamorphic rocks of epidote-
amphibolite facies. Chloritoid chemistry suggests that sediments originated from high-
pressure blueschist metamorphic facies.
Whole rock geochemical data suggest that the majority of the sediments were
derived from felsic igneous source terranes. Based on the chemical index of alteration,
the intensity of weathering in the source area was moderate to high.
Sediments of the Upper Siwalik sequences in the Himalayan foreland basin are
similar to the Dupi Tila Formation in terms of sandstone petrography and heavy mineral
character. Hence, the Dupi Tila Formation of the eastern Himalayas may serve as the
Upper Siwalik-equivalent extension of the western Himalayas. Future research projects
employing detrital geochronology should provide additional information on the
provenance history of the Dupi Tila Formation.
v
ACKNOWLEDGMENTS
I would like to express my gratefulness to almighty God who has been with me all
the way and gave me the scope to study about the mystery of the Earth. It is my pleasure
to thank all those who assisted directly and indirectly with my thesis research. It is my
utmost pleasure to express my humble gratitude to Dr. Ashraf Uddin, my thesis advisor. I
appreciate all his help and support that he provided to me for last two years. Dr. Uddin
helped me not only as the principal advisor but also as a guardian to get the best outcome
of this research.
I would also like to express my heartfelt thanks to Dr. Charles E. Savrda, David
T. King, Jr., and Willis E. Hames for their contributions to this research as my thesis
committee members. Dr. Savrda helped with significant editing in this thesis. I am
grateful to Dr. King, for giving me a better handle on stratigraphy. Also, I would like to
thank all other faculty members of Geosciences at Auburn University.
Auburn University and the Geological Society of America provided financial
assistance without which this research would not have been possible. I would like to
express my heartfelt gratitude to Dr. M. K. Roy from Rajshahi University, Bangladesh,
Dr. Humayun Ahkter and Dr. Chowdhury Qumruzzam, the University of Dhaka for their
help with logistics in collecting samples from the different parts of the Bengal basin. I
would like to thank Mr. Ershadul Haque, Director of Geological Survey of Bangladesh,
who helped me tremendously in collecting sediment core samples from northwest part of
the Bengal basin.
I want to thank Dr. David Nikles and Mr. Robert Holler of the Central Analytical
Facilities at the University of Alabama for giving me permission and assistance during
electron microprobe analysis. I am also grateful to Ms. Sheila Arington for her support
with administrative work. I thank Dr. Zeki Billor for his guidance in magnetic mineral

vi
separation. I would also like to thank all graduate students and my colleagues, for their
help and support.
Finally, I would like to thank my mother, who prior to her passing, gave me
everything that she had. I also like to thank Mrs. Jasmine Ashraf for her care and support
during my 2-year period in Auburn. I would like to thank my wife, Shakura Jahan, former
AU student, for support and motivation, and my siblings for all their continuous support
and encouragement.

vii
Table of Contents Petrofacies Evolution of Upper Siwalik-equivalent (?) Pliocene-Pleistocene Dupi Tila
Formation, Bengal Basin, Bangladesh ................................................................................. i
ABSTRACT ....................................................................................................................... iii
ACKNOWLEDGMENTS .................................................................................................. v
Chapter 1: INTRODUCTION............................................................................................. 1
1.1 INTRODUCTION ............................................................................................ 1
1.2 LOCATION ...................................................................................................... 2
1.3 PREVIOUS WORKS........................................................................................ 5
1.3.1 DEPOSITIONAL ENVIRONMENTS .......................................................... 5
1.3.2 PETROGRAPHIC STUDIES ........................................................................ 5
1.3.3 AGE ............................................................................................................... 6
1.4 OBJECTIVES ................................................................................................... 6
Chapter 2: TECTONIC SETTING AND REGIONAL GEOLOGY .................................. 8
2.1 INTRODUCTION ............................................................................................ 8
2.2 TECTONIC SETTING ..................................................................................... 8
2.3 REGIONAL GEOLOGY ................................................................................ 13
2.4 SIWALIKS OF INDIAN SUBCONTINENT ................................................ 16
2.5 DUPI TILA FORMATION ............................................................................ 18
2.5.1 DISTRIBUTION .......................................................................................... 18
2.5.2 STRATIGRAPHIC CONTEXT .................................................................. 19
2.5.3 SEDIMENTOLOGIC CHARACTER ......................................................... 21
Chapter 3: MATERIALS AND METHODS .................................................................... 23
3.1 FIELDWORK ................................................................................................. 23
3.1.1 SEDIMENT SAMPLING ............................................................................ 24
3.1.2 CORE SAMPLING ..................................................................................... 26
3.2 LABORATORY ANALYSIS ........................................................................ 26
3.3 SAMPLE PREPARATION ............................................................................ 28
3.3.1 PETROGRAPHIC THIN SECTIONS ......................................................... 28
3.3.2 HEAVY MINERAL SEPARATION .......................................................... 29
3.3.3 PREPARATION FOR MICROPROBE STUDY ........................................ 32
3.3.4 SAMPLE PULVERIZATION FOR WHOLE-ROCK CHEMISTRY ........ 33
Chapter 4: SANDSTONE PETROGRAPHY ................................................................... 35
viii
4.1 INTRODUCTION .......................................................................................... 35
4.2 PETROGRAPHY OF THE DUPI TILA FORMATION ............................... 36
4.2.1 PETROGRAPHY OF DUPI TILA SANDSTONES FROM THE SYLHET
TROUGH .............................................................................................................. 39
4.2.2 PETROGRAPHY OF DUPI TILA SANDSTONES FROM THE GARO
HILLS ................................................................................................................... 41
4.2.3 PETROGRAPHY OF DUPI TILA SANDSTONES FROM THE LALMAI
HILLS ................................................................................................................... 41
4.2.4 PETROGRAPHY OF DUPI TILA SANDSTONES FROM THE
NORTHWEST STABLE PLATFORM ............................................................... 44
4.2.5 PETROGRAPHY OF DUPI TILA SANDSTONES FROM THE
SITAPAHAR ANTICLINE .................................................................................. 44
4.3 SANDSTONE MODES .................................................................................. 47
4.4 PETROFACIES EVOLUTION ...................................................................... 47
Chapter 5: HEAVY MINERAL ANALYSIS ................................................................... 55
5.1 INTRODUCTION .......................................................................................... 55
5.2 RESULTS ....................................................................................................... 57
5.3 PROVENANCE .............................................................................................. 69
Chapter 6: MICROPROBE ANALYSIS .......................................................................... 73
6.1 INTRODUCTION .......................................................................................... 73
6.2 MINERAL CHEMISTRY .............................................................................. 74
6.3 ELECTRON MICROPROBE ......................................................................... 75
6.4 STANDARD INTENSITY CALIBRATION ................................................. 76
6.5 RESULTS ....................................................................................................... 77
6.5.1 GARNET ..................................................................................................... 79
6.5.2 TOURMALINE ........................................................................................... 83
6.5.3 EPIDOTE GROUP MINERALS ................................................................. 86
6.5.4 CHLORITOID ............................................................................................. 87
6.5.5 ILMENITE ................................................................................................... 88
6.6 PROVENANCE .............................................................................................. 89
Chapter 7: WHOLE ROCK GEOCHEMISTRY .............................................................. 91
7.1 INTRODUCTION .......................................................................................... 91
7.2 RESULTS AND INTERPRETATIONS ........................................................ 92
7.2.1 MAJOR ELEMENTS .................................................................................. 92
ix
7.2.2 TRACE AND RARE EARTH ELEMENTS ............................................... 96
7.3 WEATHERING AND DIAGENESIS ............................................................ 98
7.4 TECTONIC SETTINGS ............................................................................... 100
Chapter 8: DISCUSSION ............................................................................................... 104
8.1 PROVENANCE ............................................................................................ 104
8.2 COMPARISON WITH THE UPPER SIWALIK ......................................... 105
8.3 COMPARISON WITH OLDER BENGAL BASIN SANDSTONE UNITS 109
8.4 PALEOCLIMATE IN THE SOURCE ......................................................... 113
8.5 PALEOTECTONIC SETTING .................................................................... 114
Chapter 9: CONCLUSIONS ........................................................................................... 117
REFERENCES ............................................................................................................... 119
APPENDICES ................................................................................................................ 133
APPENDIX-A (Heavy mineral data from the Bengal basin) ............................. 133
APPENDIX-B ..................................................................................................... 135
APPENDIX-C ..................................................................................................... 138
APPENDIX-D..................................................................................................... 139
APPENDIX-E ..................................................................................................... 140
APPENDIX-F ..................................................................................................... 140
APPENDIX-G..................................................................................................... 141

x
List of Tables
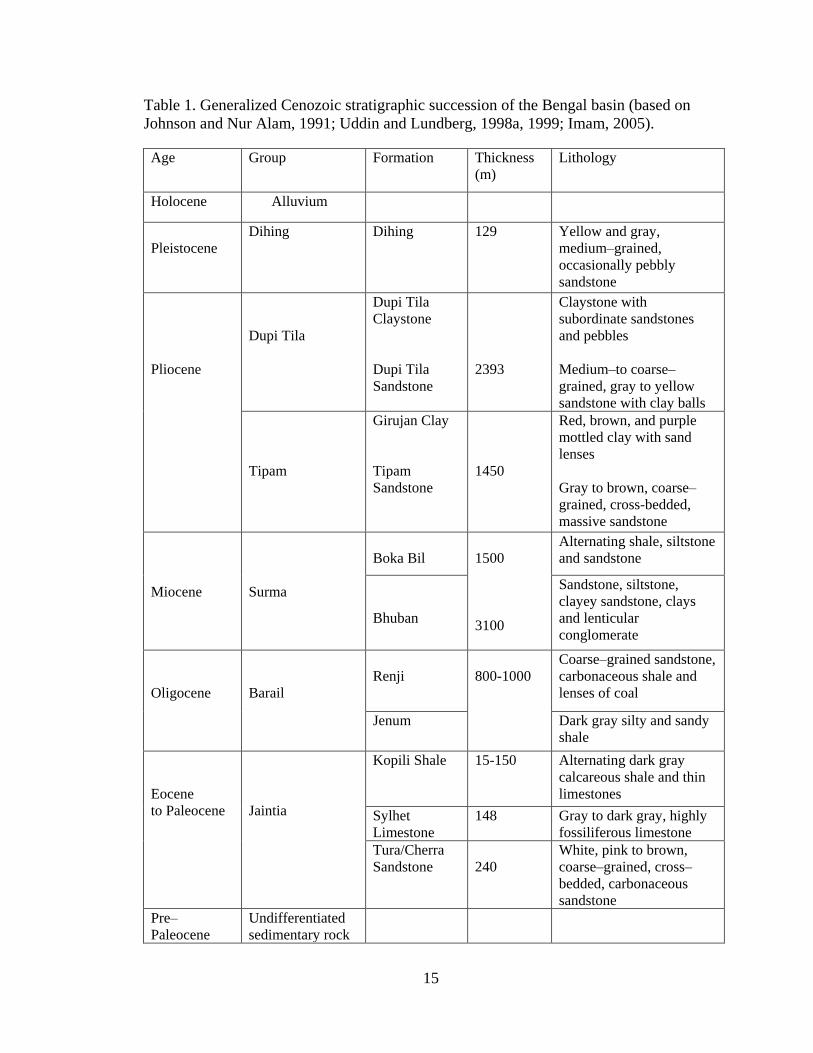
Table 1. Generalized Cenozoic stratigraphic succession of the Bengal basin (based on
Johnson and Nur Alam, 1991; Uddin and Lundberg, 1998a, 1999)…………………15
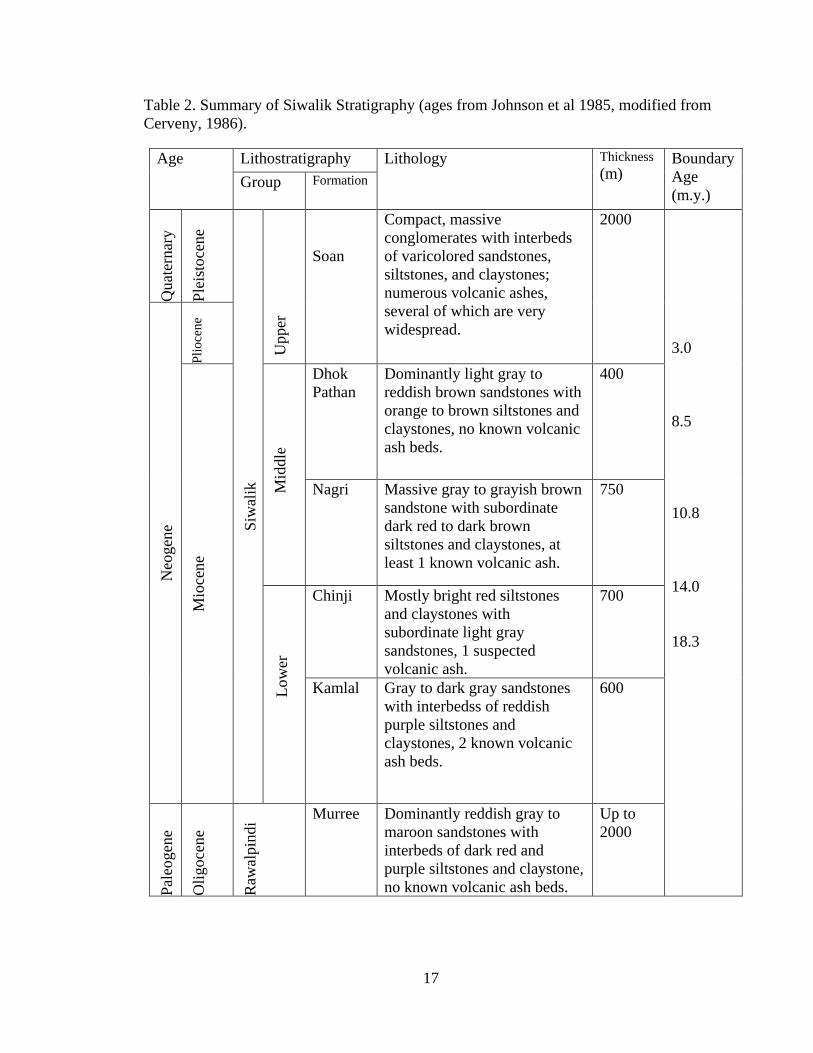
Table 2. Summary of Siwalik Stratigraphy (modified from Fatmi, 1974, ages from
Johnson et al 1985, modified from Cerveny, 1986)………………………………….17
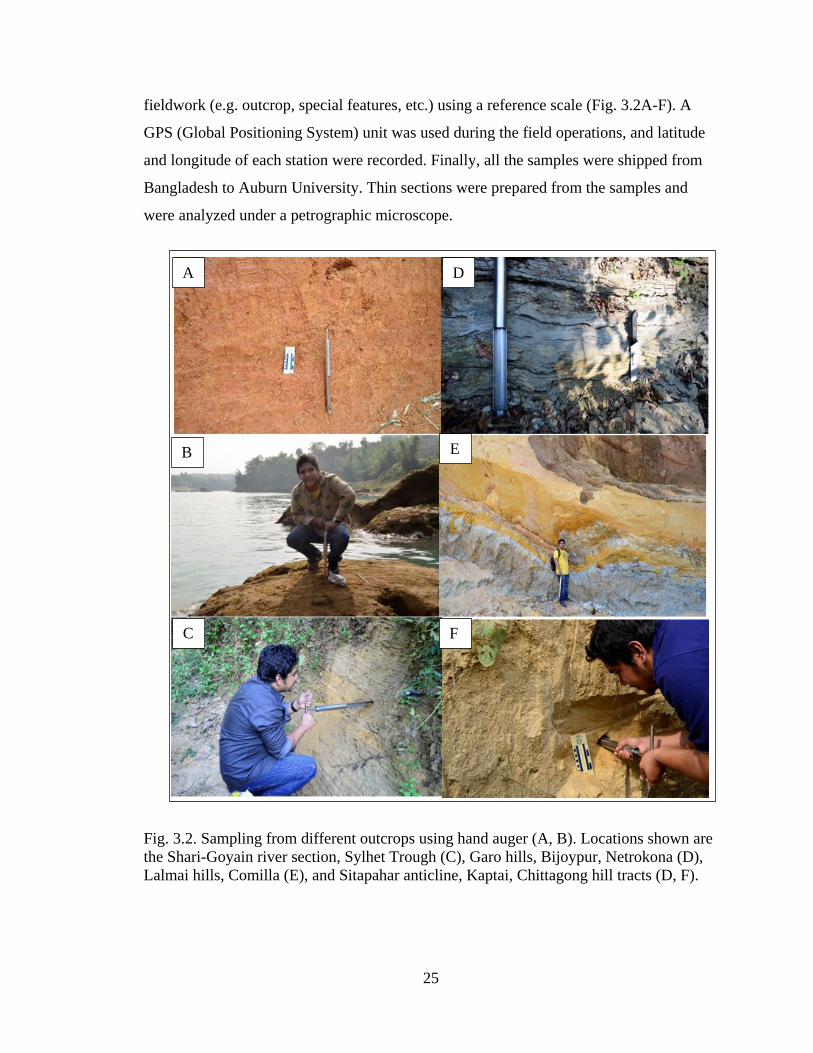
Table 3. Location and types of analyses to be completed on the Dupi Tila Formation
samples are shown with asterisks…………………………………………………….27
Table 4. Five heavy mineral grains based on different magnetic susceptibility (Hess,
1966) ………………………………………………………………..……………….31
Table 5. Recalculated modal parameters of sand and sandstone (after Graham et al.,
1976; Dickinson and Suczek, 1979; Dorsey, 1988; Uddin and Lundberg,
1998)………………………………………………………………………………….36
Table 6. Normalized modal compositions of Dupi Tila Sandstones from different regions
of the Bengal basin, Bangladesh (STDEV- Standard Deviation)……………………37
Table 7. Relative stability of minerals with similar hydraulic and diagenetic behaviors
(stability increases towards the top part of the table)………………………..………56
Table 8. Normalized abundances of heavy minerals in the Dupi Tila Formation from
various locations of Bengal basin, Bangladesh………………………………….…..59
Table 9. Electron microprobe standards used for this study………………………...77
Table 10. Ratios of some oxides and CIA (Chemical alteration index)………….....100
xi
List of Illustrations
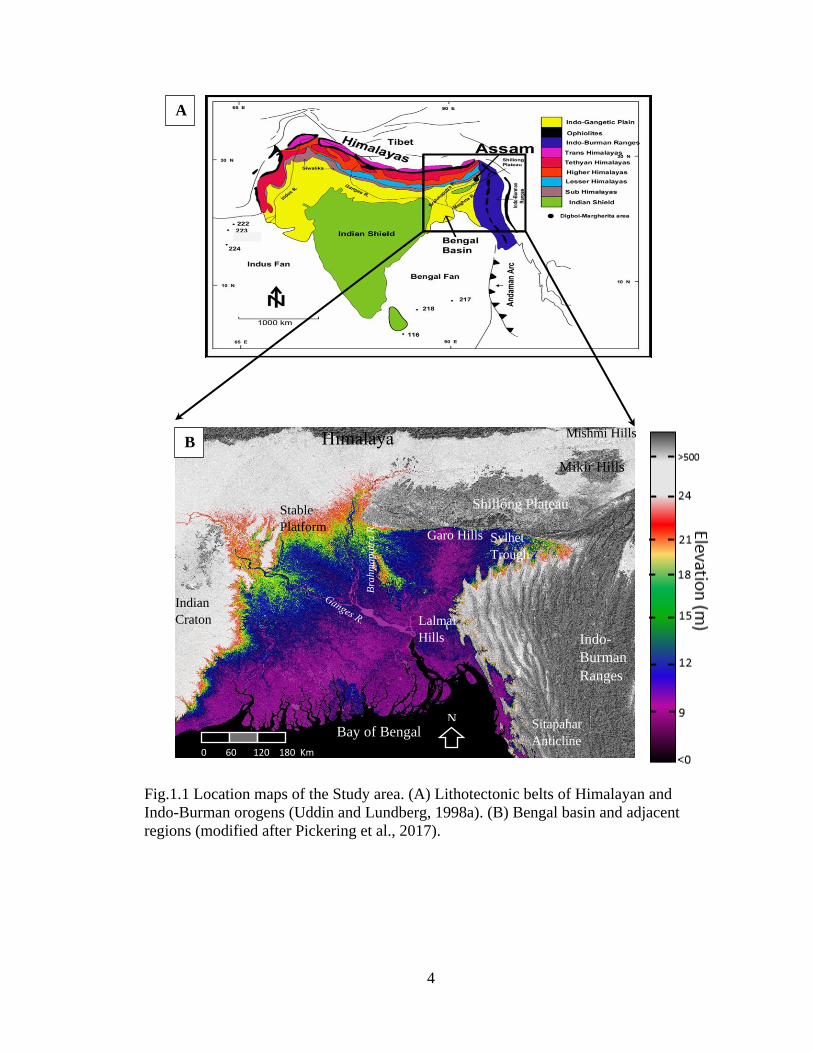
Fig.1.1 Location maps of the Study area. (A) Lithotectonic belts of Himalayan and Indo-
Burman orogens (Uddin and Lundberg, 1998a). (B) Bengal basin and adjacent regions
(modified after Pickering et al., 2017). ............................................................................... 4
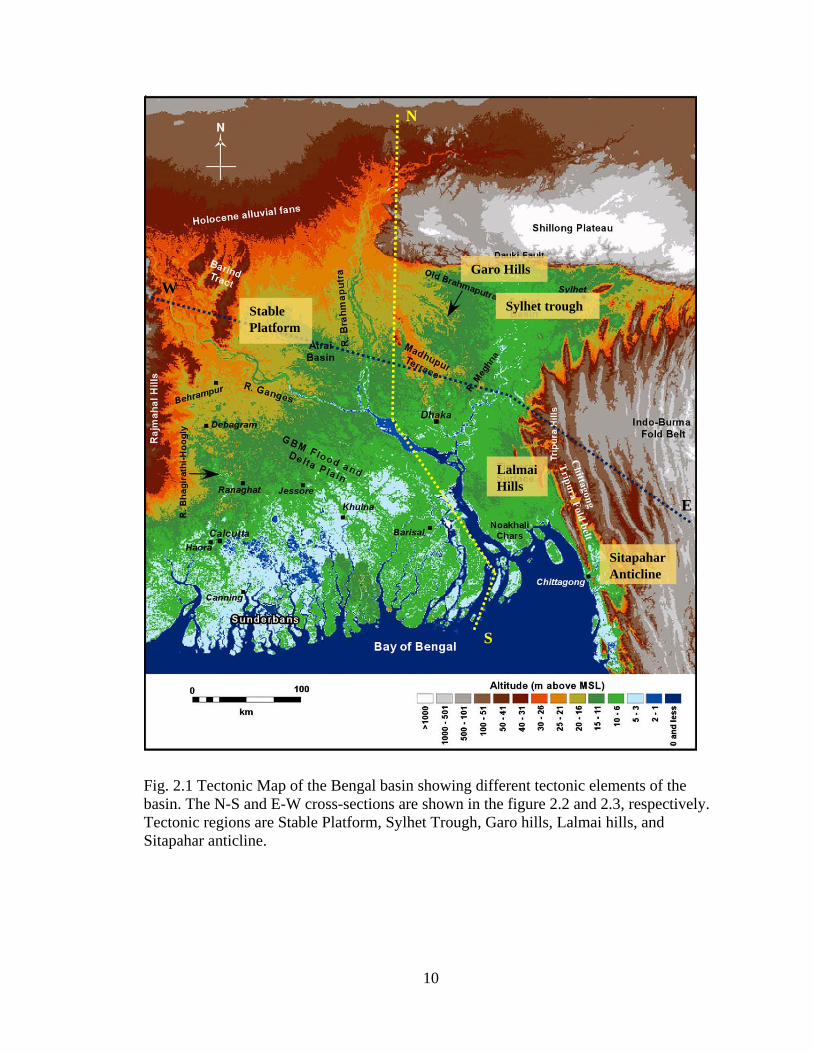
Fig. 2.1 Tectonic Map of the Bengal basin showing different tectonic elements of the
basin. The N-S and E-W cross-sections are shown in the figure 2.2 and 2.3, respectively.
Tectonic regions are Stable Platform, Sylhet Trough, Garo hills, Lalmai hills, and
Sitapahar anticline. ............................................................................................................ 10
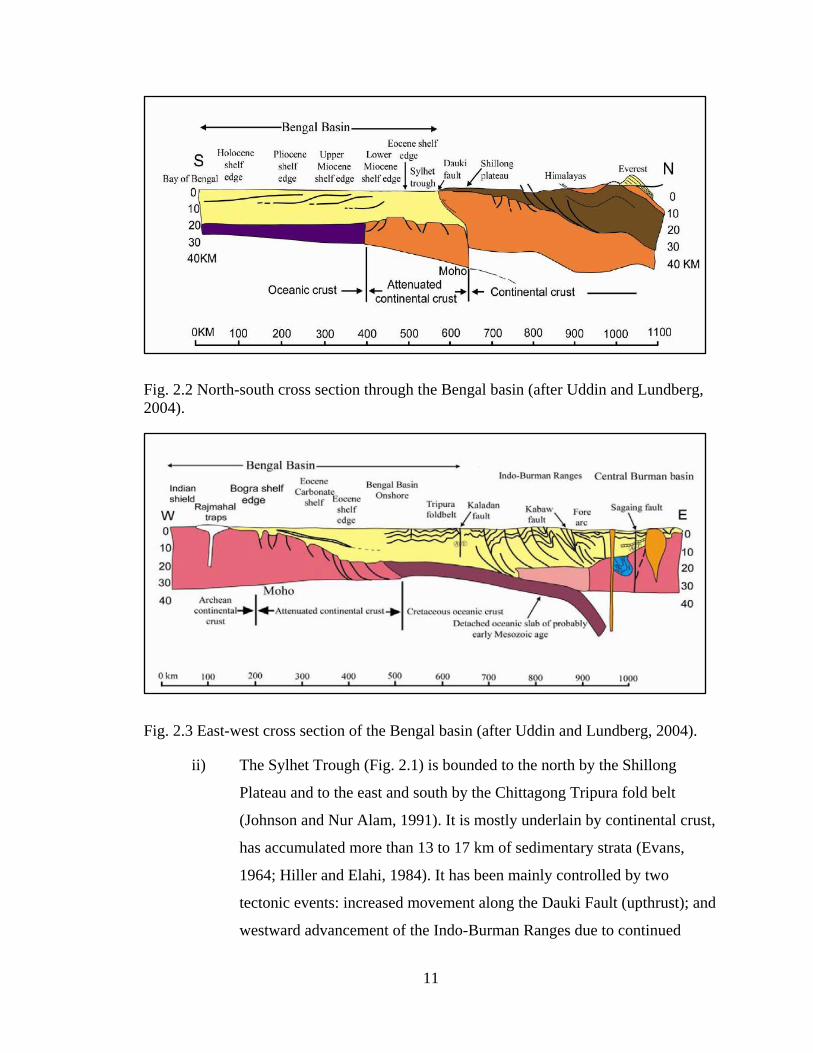
Fig. 2.2 North-south cross section through the Bengal basin (after Uddin and Lundberg,
2004). ................................................................................................................................ 11
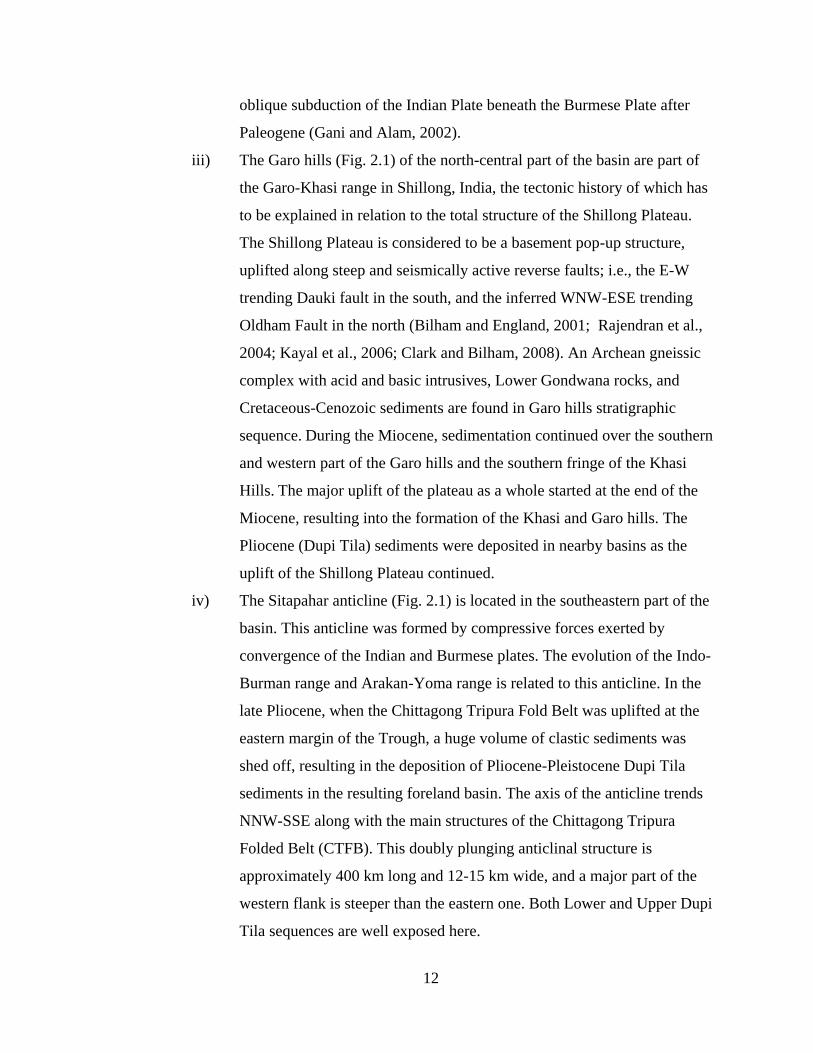
Fig. 2.3 East-west cross section of the Bengal basin (after Uddin and Lundberg, 2004). 11
Fig. 2.4 Type area of Dupi Tila Formation, Dupigoan, Sylhet, Bangladesh. ................... 19
Fig. 2.5 Stratigraphic framework of the Bengal basin, Bangladesh (modified after Uddin
and Lundberg, 1998a; Jahan et al., 2017). Orange boxes show the Dupi Tila Formation
(also known as Dupi Tila Sandstone) in different parts of the basin. ............................... 20
Fig. 2.6 Outcrops showing different characteristics of Dupi Tila Formation; A- typical
yellowish brown sandstone; B- pebble beds; C- petrified wood in sandstone; D- sand with
clay lenses; E- planar bedding; F- convolute bedding; G- rip-up clasts; and H-
bioturbation. ...................................................................................................................... 22
Fig. 3.1 Map showing study locations in the Bengal basin, Bangladesh. ......................... 24
Fig. 3.2. Sampling from different outcrops using hand auger (A, B). Locations shown are
the Shari-Goyain river section, Sylhet Trough (C), Garo hills, Bijoypur, Netrokona (D),
Lalmai hills, Comilla (E), and Sitapahar anticline, Kaptai, Chittagong hill tracts (D, F). 25
Fig. 3.3 Core samples arranged according to drilling depth, Bogra, Bangladesh. ............ 26
Fig. 3.3. Using petrographic microscope to do point counting. ........................................ 29
Fig. 3.4 Heavy minerals separation in the HRL (Himalayan Research Laboratory). ....... 30
Fig. 3.5 Heavy mineral weight percentage data from selected samples color-coded to
indicate study locations (see Appendix-A). ...................................................................... 32
Fig. 3.6 Working on the EPMA machine in the CAF lab at the University of Alabama, A-
carbon coating of the multiple-depth polished thin sections, B- using copper tape to tie up
thin sections with the probe extension, C- electron scattering during EDS, D- Part of the
microprobe machine. ......................................................................................................... 33
Fig. 4.1 Representative photomicrographs of sandstone of Dupi Tila Formation from the
Sylhet Trough, Bengal basin showing (A) mono- (Qm) and polycrystalline quartz (Qp),
sedimentary (Ls) and metamorphic lithic (Lm) grains (sample SS-2, 4X, crossed polar),
(B) mono- (Qm) and polycrystalline quartz (Qp), feldspars (plag), sedimentary (Ls), and
metamorphic lithic (Lm) fragments (sample SS-9, 4X, crossed polar). ........................... 40
xii
Fig. 4.2 Representative photomicrographs of sandstone of Dupi Tila Formation from the
Garo hills, Bengal basin showing (A) mono- (Qm) and polycrystalline quartz (Qp), and
metamorphic lithic (Lm) grains (sample BS-4, 4X, crossed polar), (B) monocrystalline
(Qm) quartz, and polycrystalline quartz (Qp) (sample BS-7, 4X, crossed polar). .......... 42
Fig. 4.3 Representative photomicrographs of sandstone of Dupi Tila Formation from the
Lalmai hills, Bengal basin showing (A) mono- (Qm)and polycrystalline quartz (Qp),
plagioclase feldspars (plag.), sedimentary (Ls) and metamorphic lithic (Lm) grains
(sample CCHS-2, 4X, crossed polar), (B) mono- (Qm) and polycrystalline quartz (Qp),
plagioclase feldspar (plag.), sedimentary (Ls), and metamorphic lithic fragments (Lm)
(sample CWSal-4, 4X, crossed polar). .............................................................................. 43
Fig. 4.4 Representative photomicrographs of sandstone of Dupi Tila Formation from the
northwest Stable Platform, Bengal basin showing (A) mono- (Qm) and polycrystalline
quartz (Qp), plagioclase feldspars (plag.), and metamorphic lithic (Lm) fragments
(sample NWD-2, GDH- 56, 4X, crossed polar), (B) mono- (Qm) and polycrystalline
quartz (Qp), sedimentary (Ls), and metamorphic lithic fragments (Lm) (sample NWR-1,
GDH-69, 4X, crossed polar). ............................................................................................ 45
Fig. 4.5 Representative photomicrographs of sandstone of Dupi Tila Formation from the
Sitapahar anticline, Bengal basin showing (A) mono- (Qm) and polycrystalline quartz
(Qp), plagioclase feldspars (plag.), and metamorphic lithic (Lm) grains (sample KS-2,
4X, crossed polar), (B) mono- and polycrystalline quartz, and metamorphic lithic
fragments (Lm) (sample KS-7, 4X, crossed polar). .......................................................... 46
Fig. 4.6 Variation of modal sandstone composition of Dupi Tila Formation from various
regions of the Bengal basin, Bangladesh (NW- Northwest, NC- North-central, NE-
Northeast, SC- South-central, and SE- Southeast) . .......................................................... 47
Fig. 4.7 QtFL plot of the Dupi Tila Formation from the Sitapahar anticline, Sylhet
Trough, Lalmai hills, Garo hills, and Stable Platform showing mean and standard
deviation polygons (provenance fields are taken from Dickinson, 1985). ....................... 48
Fig. 4.8 QmFLt plot of the Dupi Tila Formation from the Sitapahar anticline, Sylhet
Trough, Lalmai hills, Garo hills, and Stable Platform showing mean and standard
deviation polygons (provenance fields are taken from Dickinson, 1985). ....................... 49
Fig. 4.9 QmPK plot of the Dupi Tila Formation from the Sitapahar anticline, Sylhet
Trough, Lalmai hills, Garo hills, and Stable Platform showing mean and standard
deviation polygons. ........................................................................................................... 50
Fig. 4.11 Ratios of plagioclase feldspar to total feldspar (P/F) in the Dupi Tila sandstones
from various regions of the Bengal basin, showing distribution of feldspar ratios for each
area samples (NW- Northwest, NC- North-central, NE- Northeast, SC- South-central, and
SE- Southeast). .................................................................................................................. 52
Fig. 4.12 Diamond diagram plots of the Dupi Tila sandstone samples from the different
regions of the Bengal basin, Bangladesh (based on Basu et al., 1975)............................. 54
xiii
Fig. 5.1 Heavy mineral frequencies in the Dupi Tila Formation samples from various
parts of the Bengal basin (NW- Northwest, NC- North-central, NE- Northeast, SC-
South-central, and SE- Southeast; mineral color codes are distributed horizontally from
left to right in the legend). ................................................................................................. 61
Fig. 5.2 Average heavy mineral frequency in samples of the Dupi Tila Formation
combined (ZTR- zircon-tourmaline-rutile). ...................................................................... 62
Fig. 5.3 Representative photomicrographs of heavy minerals from the Sylhet Trough,
Bengal basin showing (A) garnet and opaque minerals (sample SS-4, fraction B, 10X,
plane polar), (B) Aluminosilicates, ZTR and other minerals minerals (sample SS-4,
fraction E, 10X, crossed polar) (Ctd= Chloritoid, Gt= Garnet, Ky= Kyanite, Sil=
Sillimanite, Rt= Rutile, St= Staurolite, Cz= Clinozoisites, ZTR= Zircon Rutile
Tourmaline, Opq= Opaque minerals). .............................................................................. 64
Fig. 5.4 Representative photomicrographs of heavy minerals from the Garo hills,
Bijoypur, Netrokona, Bengal basin showing (A) ZTR minerals (sample BS, fraction C,
10X, crossed polar), (B) Aluminosilicates, ZTR and other minerals (sample BS, fraction
E, 10X, crossed polar) (ZTR= Zircon Rutile Tourmaline, Tou= Tourmaline, Ky=
Kyanite, And= Andalusite, Opq= Opaque minerals). ....................................................... 65
Fig. 5.5 Representative photomicrographs of heavy minerals from the Lalmai hills,
Comilla, Bengal basin showing (A) heavy and opaque minerals (sample CCS, fraction C,
10X, crossed polar), (B) Aluminosilicates, ZTR, and other minerals (sample CLDT,
fraction E, 10X, crossed polar) (Ky= Kyanite, Sil= Sillimanite, Opq= Opaque minerals,
Zr= Zircon, Rt= Rutile, Hbl= Hornblende, St= Staurolite, Ep= Epidote, Opx=
Orthopyroxene, Tou= Tourmaline). .................................................................................. 66
Fig. 5.6 Representative photomicrographs of heavy minerals from the northwest Stable
Platform, Bengal basin showing (A) heavy and opaque minerals (sample NWR, GDH-69,
fraction C, 10X, crossed polar), (B) Aluminosilicates, Sillimanite/ fibrolitic silllimanite
(sample NWD, GDH-56, fraction E, 10X, crossed polar) (Ky= Kyanite, Sil= Sillimanite,
St= Staurolite, Bt= Biotite, Tou= Toumaline, Hbl= Hornblende, Cpx= Clinopyroxene,
Ms= Muscovite, Opq= Opaque minerals). ........................................................................ 67
Fig. 5.7 Representative photomicrographs of heavy minerals from the Sitapahar anticline,
Kaptai, Chittagong, Bengal basin showing (A) heavy and opaque minerals (sample CCS,
fraction C, 10X, crossed polar), (B) Aluminosilicates, ZTR, and other minerals (sample
CLDT, fraction E, 10X, crossed polar) (ZTR= Zircon Rutile Tourmaline, Ky= Kyanite,
Sil= Sillimanite, Opq= Opaque minerals, Ep= Epidote, Bt= Biotite, Hbl= Hornblende,
Zr= Zircon, St= Staurolite, Tou= Tourmaline, Hyp= Hypersthene, Sp= Sphene, Ap=
Apatite). ............................................................................................................................ 68
Figure 5.8 Variation in distribution of garnets in the Dupi Tila samples collected from
different parts of the Bengal basin, Bangladesh (NW- Northwest, NC- North-central, NE-
Northeast, SC- South-central, and SE- Southeast). ........................................................... 69
xiv
Figure 5.9 Variation in distribution of ZTR minerals in the Dupi Tila samples collected
from different parts of the Bengal basin, Bangladesh (ZTR= Zircon Rutile Tourmaline;
NW- Northwest, NC- North-central, NE- Northeast, SC- South-central, and SE-
Southeast). ......................................................................................................................... 70
Figure 5.10 Variation in distribution of aluminosilicates in the Dupi Tila samples
collected from different parts of the Bengal basin, Bangladesh (NW- Northwest, NC-
North-central, NE- Northeast, SC- South-central, and SE- Southeast). ........................... 70
Figure 5.11 Plots of ATi (apatite, tourmaline), GZi (garnet, zircon), ATi (apatite,
tourmaline), RZi (rutile, zircon), and ATi (apatite, tourmaline), MZi (monazite, zircon)
indices of Dupi Tila samples collected from different parts of the Bengal basin,
Bangladesh (NW- Northwest, NC- North-central, NE- Northeast, SC- South-central, and
SE- Southeast). .................................................................................................................. 71
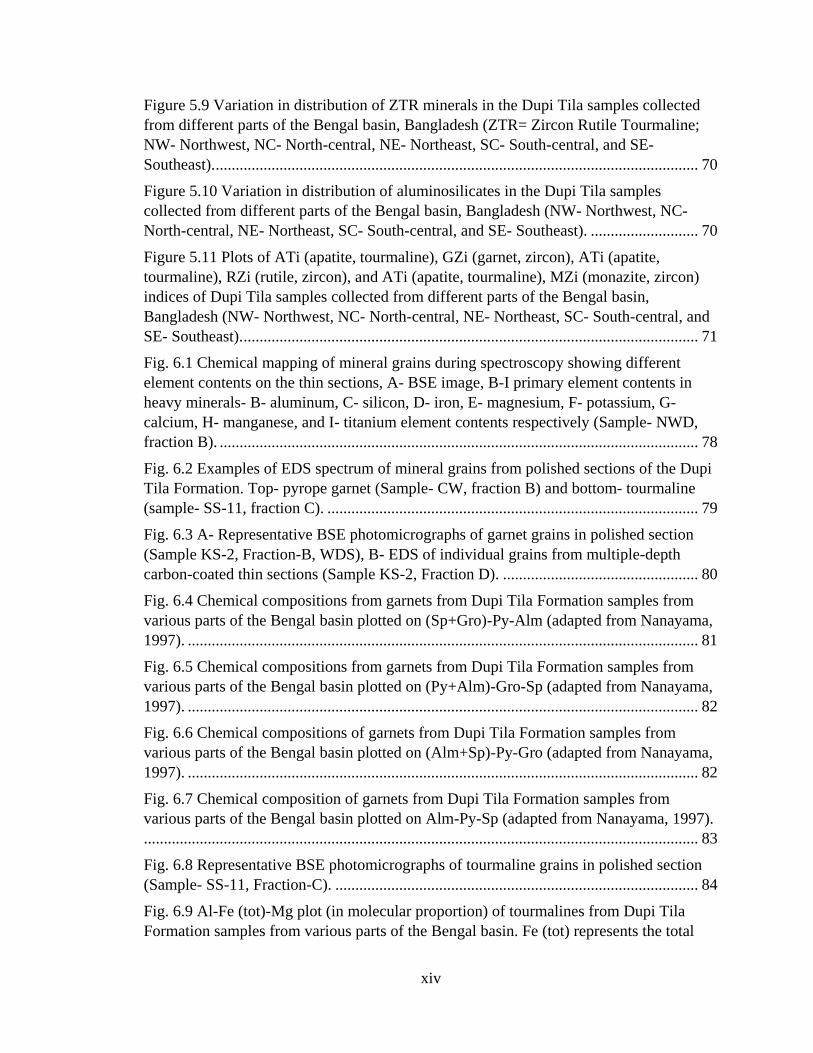
Fig. 6.1 Chemical mapping of mineral grains during spectroscopy showing different
element contents on the thin sections, A- BSE image, B-I primary element contents in
heavy minerals- B- aluminum, C- silicon, D- iron, E- magnesium, F- potassium, G-
calcium, H- manganese, and I- titanium element contents respectively (Sample- NWD,
fraction B). ........................................................................................................................ 78
Fig. 6.2 Examples of EDS spectrum of mineral grains from polished sections of the Dupi
Tila Formation. Top- pyrope garnet (Sample- CW, fraction B) and bottom- tourmaline
(sample- SS-11, fraction C). ............................................................................................. 79
Fig. 6.3 A- Representative BSE photomicrographs of garnet grains in polished section
(Sample KS-2, Fraction-B, WDS), B- EDS of individual grains from multiple-depth
carbon-coated thin sections (Sample KS-2, Fraction D). ................................................. 80
Fig. 6.4 Chemical compositions from garnets from Dupi Tila Formation samples from
various parts of the Bengal basin plotted on (Sp+Gro)-Py-Alm (adapted from Nanayama,
1997). ................................................................................................................................ 81
Fig. 6.5 Chemical compositions from garnets from Dupi Tila Formation samples from
various parts of the Bengal basin plotted on (Py+Alm)-Gro-Sp (adapted from Nanayama,
1997). ................................................................................................................................ 82
Fig. 6.6 Chemical compositions of garnets from Dupi Tila Formation samples from
various parts of the Bengal basin plotted on (Alm+Sp)-Py-Gro (adapted from Nanayama,
1997). ................................................................................................................................ 82
Fig. 6.7 Chemical composition of garnets from Dupi Tila Formation samples from
various parts of the Bengal basin plotted on Alm-Py-Sp (adapted from Nanayama, 1997).
........................................................................................................................................... 83
Fig. 6.8 Representative BSE photomicrographs of tourmaline grains in polished section
(Sample- SS-11, Fraction-C). ........................................................................................... 84
Fig. 6.9 Al-Fe (tot)-Mg plot (in molecular proportion) of tourmalines from Dupi Tila
Formation samples from various parts of the Bengal basin. Fe (tot) represents the total
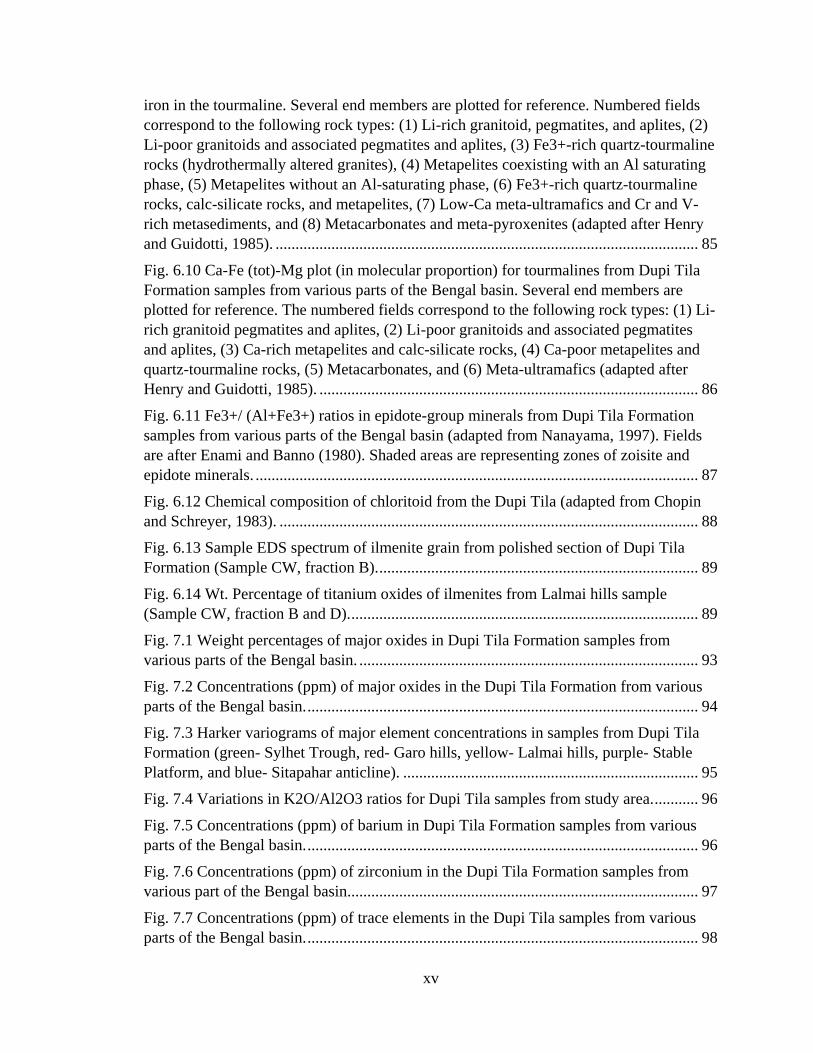
xv
iron in the tourmaline. Several end members are plotted for reference. Numbered fields
correspond to the following rock types: (1) Li-rich granitoid, pegmatites, and aplites, (2)
Li-poor granitoids and associated pegmatites and aplites, (3) Fe3+-rich quartz-tourmaline
rocks (hydrothermally altered granites), (4) Metapelites coexisting with an Al saturating
phase, (5) Metapelites without an Al-saturating phase, (6) Fe3+-rich quartz-tourmaline
rocks, calc-silicate rocks, and metapelites, (7) Low-Ca meta-ultramafics and Cr and V-
rich metasediments, and (8) Metacarbonates and meta-pyroxenites (adapted after Henry
and Guidotti, 1985). .......................................................................................................... 85
Fig. 6.10 Ca-Fe (tot)-Mg plot (in molecular proportion) for tourmalines from Dupi Tila
Formation samples from various parts of the Bengal basin. Several end members are
plotted for reference. The numbered fields correspond to the following rock types: (1) Li-
rich granitoid pegmatites and aplites, (2) Li-poor granitoids and associated pegmatites
and aplites, (3) Ca-rich metapelites and calc-silicate rocks, (4) Ca-poor metapelites and
quartz-tourmaline rocks, (5) Metacarbonates, and (6) Meta-ultramafics (adapted after
Henry and Guidotti, 1985). ............................................................................................... 86
Fig. 6.11 Fe3+/ (Al+Fe3+) ratios in epidote-group minerals from Dupi Tila Formation
samples from various parts of the Bengal basin (adapted from Nanayama, 1997). Fields
are after Enami and Banno (1980). Shaded areas are representing zones of zoisite and
epidote minerals. ............................................................................................................... 87
Fig. 6.12 Chemical composition of chloritoid from the Dupi Tila (adapted from Chopin
and Schreyer, 1983). ......................................................................................................... 88
Fig. 6.13 Sample EDS spectrum of ilmenite grain from polished section of Dupi Tila
Formation (Sample CW, fraction B). ................................................................................ 89
Fig. 6.14 Wt. Percentage of titanium oxides of ilmenites from Lalmai hills sample
(Sample CW, fraction B and D). ....................................................................................... 89
Fig. 7.1 Weight percentages of major oxides in Dupi Tila Formation samples from
various parts of the Bengal basin. ..................................................................................... 93
Fig. 7.2 Concentrations (ppm) of major oxides in the Dupi Tila Formation from various
parts of the Bengal basin. .................................................................................................. 94
Fig. 7.3 Harker variograms of major element concentrations in samples from Dupi Tila
Formation (green- Sylhet Trough, red- Garo hills, yellow- Lalmai hills, purple- Stable
Platform, and blue- Sitapahar anticline). .......................................................................... 95
Fig. 7.4 Variations in K2O/Al2O3 ratios for Dupi Tila samples from study area. ........... 96
Fig. 7.5 Concentrations (ppm) of barium in Dupi Tila Formation samples from various
parts of the Bengal basin. .................................................................................................. 96
Fig. 7.6 Concentrations (ppm) of zirconium in the Dupi Tila Formation samples from
various part of the Bengal basin........................................................................................ 97
Fig. 7.7 Concentrations (ppm) of trace elements in the Dupi Tila samples from various
parts of the Bengal basin. .................................................................................................. 98
xvi
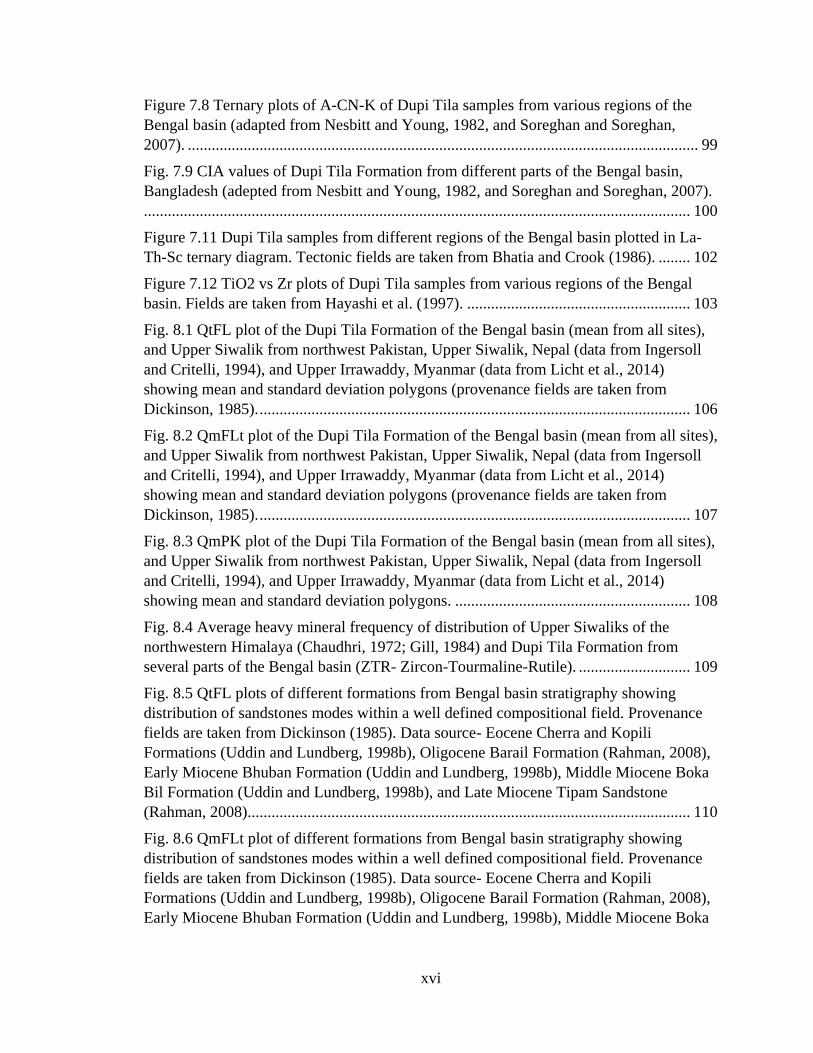
Figure 7.8 Ternary plots of A-CN-K of Dupi Tila samples from various regions of the
Bengal basin (adapted from Nesbitt and Young, 1982, and Soreghan and Soreghan,
2007). ................................................................................................................................ 99
Fig. 7.9 CIA values of Dupi Tila Formation from different parts of the Bengal basin,
Bangladesh (adepted from Nesbitt and Young, 1982, and Soreghan and Soreghan, 2007).
......................................................................................................................................... 100
Figure 7.11 Dupi Tila samples from different regions of the Bengal basin plotted in La-
Th-Sc ternary diagram. Tectonic fields are taken from Bhatia and Crook (1986). ........ 102
Figure 7.12 TiO2 vs Zr plots of Dupi Tila samples from various regions of the Bengal
basin. Fields are taken from Hayashi et al. (1997). ........................................................ 103
Fig. 8.1 QtFL plot of the Dupi Tila Formation of the Bengal basin (mean from all sites),
and Upper Siwalik from northwest Pakistan, Upper Siwalik, Nepal (data from Ingersoll
and Critelli, 1994), and Upper Irrawaddy, Myanmar (data from Licht et al., 2014)
showing mean and standard deviation polygons (provenance fields are taken from
Dickinson, 1985). ............................................................................................................ 106
Fig. 8.2 QmFLt plot of the Dupi Tila Formation of the Bengal basin (mean from all sites),
and Upper Siwalik from northwest Pakistan, Upper Siwalik, Nepal (data from Ingersoll
and Critelli, 1994), and Upper Irrawaddy, Myanmar (data from Licht et al., 2014)
showing mean and standard deviation polygons (provenance fields are taken from
Dickinson, 1985). ............................................................................................................ 107
Fig. 8.3 QmPK plot of the Dupi Tila Formation of the Bengal basin (mean from all sites),
and Upper Siwalik from northwest Pakistan, Upper Siwalik, Nepal (data from Ingersoll
and Critelli, 1994), and Upper Irrawaddy, Myanmar (data from Licht et al., 2014)
showing mean and standard deviation polygons. ........................................................... 108
Fig. 8.4 Average heavy mineral frequency of distribution of Upper Siwaliks of the
northwestern Himalaya (Chaudhri, 1972; Gill, 1984) and Dupi Tila Formation from
several parts of the Bengal basin (ZTR- Zircon-Tourmaline-Rutile). ............................ 109
Fig. 8.5 QtFL plots of different formations from Bengal basin stratigraphy showing
distribution of sandstones modes within a well defined compositional field. Provenance
fields are taken from Dickinson (1985). Data source- Eocene Cherra and Kopili
Formations (Uddin and Lundberg, 1998b), Oligocene Barail Formation (Rahman, 2008),
Early Miocene Bhuban Formation (Uddin and Lundberg, 1998b), Middle Miocene Boka
Bil Formation (Uddin and Lundberg, 1998b), and Late Miocene Tipam Sandstone
(Rahman, 2008)............................................................................................................... 110
Fig. 8.6 QmFLt plot of different formations from Bengal basin stratigraphy showing
distribution of sandstones modes within a well defined compositional field. Provenance
fields are taken from Dickinson (1985). Data source- Eocene Cherra and Kopili
Formations (Uddin and Lundberg, 1998b), Oligocene Barail Formation (Rahman, 2008),
Early Miocene Bhuban Formation (Uddin and Lundberg, 1998b), Middle Miocene Boka
xvii
Bil Formation (Uddin and Lundberg, 1998b), and Late Miocene Tipam Sandstone
(Rahman, 2008)............................................................................................................... 111
Fig. 8.7 QmPK plot of different formations from Bengal basin stratigraphy showing
distribution of sandstones modes. Data source- Eocene Cherra and Kopili Formations
(Uddin and Lundberg, 1998b), Oligocene Barail Formation (Rahman, 2008), Early
Miocene Bhuban Formation (Uddin and Lundberg, 1998b), Middle Miocene Boka Bil
Formation (Uddin and Lundberg, 1998b), and Late Miocene Tipam Sandstone (Rahman,
2008). .............................................................................................................................. 112
Fig. 8.8 LsLm1Lm2 plot of different formations from the Bengal basin stratigraphy
showing variation of lithic fragments within a well defined compositional field adapted
from Dorsey (1988). Data source- Eocene Cherra and Kopili Formations (Uddin and
Lundberg, 1998b), Oligocene Barail Formation (Rahman, 2008), Early Miocene Bhuban
Formation (Uddin and Lundberg, 1998b), Middle Miocene Boka Bil Formation (Uddin
and Lundberg, 1998b), and Late Miocene Tipam Sandstone (Rahman, 2008). ............. 113
Fig. 8.9 Qp/(F+L) vs Q/(F+L) plot of source-area climatic regimes based on Suttner and
Dutta (1986). ................................................................................................................... 114
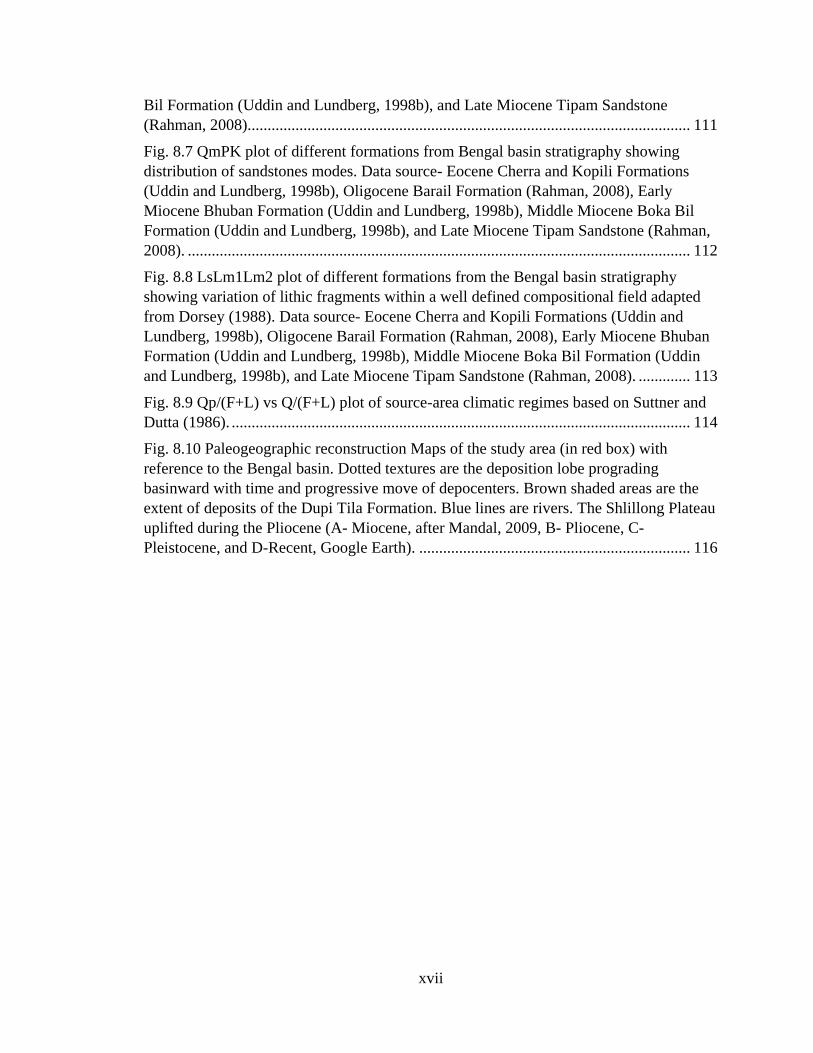
Fig. 8.10 Paleogeographic reconstruction Maps of the study area (in red box) with
reference to the Bengal basin. Dotted textures are the deposition lobe prograding
basinward with time and progressive move of depocenters. Brown shaded areas are the
extent of deposits of the Dupi Tila Formation. Blue lines are rivers. The Shlillong Plateau
uplifted during the Pliocene (A- Miocene, after Mandal, 2009, B- Pliocene, C-
Pleistocene, and D-Recent, Google Earth). .................................................................... 116
xviii
List of Acronyms
BSE Back Scattered Electron
CAF Central Analytical Facilities
CIA Chemical Index of Alteration
EDS Energy Dispersive Spectroscopy
EPMA Electron Probe Microanalyzer
GAB Geosciences Advisory Board
GDH Geological Drill Hole
GSA Geological Society of America
GSB Geological Survey of Bangladesh
HRL Himalayan Research Lab
UA University of Alabama
USNM United States National Museum
WDS Wavelength Dispersive Spectroscopy

1
Chapter 1: INTRODUCTION
1.1 INTRODUCTION
Continental collision represents an extreme end-member in compressional
tectonic history. Associated crustal thickening produces dramatic surface relief and
subsidence of flanking basins, resulting in rapid erosion and accumulation of clastic
detritus. Sedimentary basins associated with mountain belts provide important
repositories that record evidence of orogenic processes, including the interrelationship of
tectonic, climatic, and erosion events. Petrofacies evolution of sedimentary sequences
that are deposited on the flanks of mountain belts provides rudimentary constraints on
mountain-building processes and the history of exhumation of mountain belts (Uddin and
Lundberg, 1998a).
Compositional analysis of detrital sediments is a very important part in tracing
sediment provenance (Dickinson, 1970, 1982; Dickinson and Suczek, 1979; Ingersoll and
Suczek, 1979; Dickinson 1985; Garzanti et al., 1996). It focuses on key attributes of
detrital mineralogy, providing important constraints on basin evolution and unroofing
history of the mountain belts (Graham et al., 1976; Uddin and Lundberg, 1998b; Rahman,
2008). For sandstone compositional analyses, in which proportions of detrital framework
grains within sand (stone) samples are plotted on different ternary diagrams (such as
QtFL, QmFLt, and QmPK), can help distinguish various tectonic settings of source areas
(Ingersoll et al., 1984; Ingersoll and Busby, 1995). Various factors other than source rock
may have significant control on the composition of detrital sediments. Petrofacies studies
to evaluate tectonic histories are based on the assumption that modes of transportation,
depositional environments, climates, and diagenesis have not significantly altered detrital
grain composition (Suttner, 1974; Mack, 1984; Kumar 2004; Sitaula, 2009).

2
During the transport of sediments from source areas to a distant basin, feldspar
grains and lithic fragments become separated from relict quartz and are chemically
broken down. This results in quartz-rich sandstones that are characteristic of continental
interiors and passive-margin platform settings, and massive, mud-rich deltas
characteristic of passive continental margin slope settings.
The Miocene-Pliocene Siwalik Group of the sub-Himalayan range of the northern
Indian subcontinent, representing ancient Gangetic floodplain deposits, are subdivided
into three subgroups- Lower Siwalik, Middle Siwalik, and Upper Siwalik. The Pliocene-
Pleistocene Upper Siwalik (700-2300 m) deposits of the western Himalayan basins show
similarity in petrological and sedimentological characters with the Dupi Tila Formation
(300-2500 m) of the Bengal basin, which exhibits typical freshwater molassic deposits
laid down mostly by the ancestral paleo-Brahmaputra.
1.2 LOCATION
The Bengal basin is a large prograding delta-dominated basin. Formed by crustal
loading during the Indian-Asian-Burmese collision, the basin is over 20 km deep, extends
over an area of 200,000 km2, and is filled with synorogenic sequences derived from both
the Himalayas and the Indo-Burman ranges (Uddin and Lundberg, 1998a). The basin is
bounded by the Indian craton to the west, the Shillong Plateau and the Himalayan belt to
the north, and the Indo-Burman ranges to the east (Fig. 1.1). The Bengal basin lies
roughly between N 20⁰34’ to N 26⁰38’ and E 88⁰01’ to E 92⁰41’. The basin is located
primarily in Bangladesh, with a smaller part extending into the West Bengal state of
India. It is open towards the south and extends into the Bay of Bengal. It has one of the
world’s largest deltaic plains, associated with the flow of three giant rivers: the Ganges,
Brahmaputra, and Meghna. These giant rivers have carried huge volumes of sediment to
the proto-Bengal basin, concomitant with subsidence of the Bengal basin. The
sedimentation rate in the basin was particularly high during Eocene through Pliocene
(Johnson and Nur Alam, 1991). Seismic-reflection studies (Curray, 1991) show that
sedimentary and metasedimentary rocks in the Bengal basin are at least 22 km thick; 16
km are inferred to be collisional deposits. The latter sediments overlie 6 km of pre-
collisional strata, interpreted as buried continental rise and pelagic deposits. Cenozoic

3
sequences within the basin increase in thickness from west to east and from north to
south (Uddin, 1987).
4
Fig.1.1 Location maps of the Study area. (A) Lithotectonic belts of Himalayan and
Indo-Burman orogens (Uddin and Lundberg, 1998a). (B) Bengal basin and adjacent
regions (modified after Pickering et al., 2017).
Elevation
(m)
0 60 120 180 Km
Shillong Plateau
Mikir Hills
Bay of Bengal
Himalaya
Indo-
Burman
Ranges
Sylhet
Trough
Garo Hills
Lalmai
Hills
Sitapahar
Anticline
Stable
Platform
Indian
Craton
Mishmi Hills
Bra
hm
ap
utr
a R
.
N
27
24
21
18
15
12
9
A
B

5
1.3 PREVIOUS WORKS
1.3.1 DEPOSITIONAL ENVIRONMENTS
Hiller and Elahi (1988) suggest that the Dupi Tila Formation was deposited
synchronously with folding in the Sylhet Trough. The depositional environment of the
Dupi Tila Formation has been interpreted by Johnson and Nur Alam (1991) as alternating
channel and flood-plain deposits that are organized into fining-upward cycles of probable
meandering stream origin. The abundance of coarse sediments, prevalence of pebbly
beds, presence of carbonaceous material, common occurrence of cross bedding, and lack
of fossils strongly suggest a fluviatile environment of deposition for the Dupi Tila
Formation (Johnson and Nur Alam, 1991; Khan, 1991). The Upper Dupi Tila Formation
of the Sylhet Trough has been interpreted as having been deposited by small-scale, mud-
rich meandering river systems with the dominance of single fluvial channels
characterized by simple bank-attached bars (Reimann, 1993; Gani and Alam, 2002).
Recent reports of glauconite in the Upper Dupi Tila (Roy et al., 2012) indicate possible
marine depositional environments during Pliocene-Pleistocene. Roy et al. (2012) suggest
that the depositional environment changed from subaerial alluvial fans with heavily
loaded braided rivers to shallow marine and estuarine environments.
1.3.2 PETROGRAPHIC STUDIES
Miocene and younger sandstones show an orogenic provenance (Uddin and
Lundberg, 1998a); lithic sediments of the Dupi Tila Formation indicate progressive
unroofing of the Himalayas through time. The abundance of potassium feldspar in the
younger (Pliocene-Pleistocene) sand, compared to plagioclase-rich sands in the
underlying Miocene Surma Group, indicates a granitic source, probably Miocene
leucogranites of the High Himalayan Crystalline terrane (Uddin and Lundberg, 1998a).
Kumar (2004) focused on the provenance history of the Cenozoic sediments of the north
Assam area, near the eastern syntaxis, and suggested that sediments of the Assam basin
were derived from the Himalayan orogen. Coeval (?) Siwalik sediments have been well
studied along the strike of the Himalayas; i.e., in the western Himalayan foreland basin
(i.e., Opdyke et al., 1982; Johnson et al., 1985; Critelli and Ingersoll, 1994), in Nepal
(Tamrakar and Syangbo, 2014), in Darjeeling (Kundu et al., 2011), and near the eastern

6
syntaxis of the Himalayas (i.e., Chirouze et al., 2011). These studies suggest that detrital
modes reflect a collision-orogen provenance. Petrological parameters described by
Critelli et al. (1994) indicate sediment derivation from mid-crustal rocks and overlying
sedimentary strata within various tectonostratigraphic units of the High Himalaya and
Tibetan zone. Tamrakar and Syangbo (2014) inferred that the provenance of the Siwalik
Group was mainly a recycled orogen and that the source rocks through time shifted from
the low-grade metamorphic rocks of the Lesser Himalaya to the high-grade rocks of the
Higher Himalaya.
1.3.3 AGE
Sediments of the Dupi Tila Formation are devoid of fossils and thus, present a
great problem in accurate age determination. Available literature assigns a Mio-Pliocene
age to the Dupi Tila Formation based mostly on lithostratigraphy (Khan, 1991). Since
age-diagnostic fossils are not yet known, Reimann (1993) suggested that the age
assignments ranging from middle Miocene to middle Pliocene are unreliable. During the
last 7 to 3 Ma, there have been two orogenic events in the Himalaya (Amano and Taira,
1992; Harrison, et al., 1997; Catlos et al., 2002) that are related to movement along the
Main Central Thrust (MCT). During these events, extensive erosion from the Himalayas
resulted in deposition along the Himalayan foothills and adjacent basins (Catlos et al.,
2002). The only Pleistocene representatives identified to date are scattered occurrences of
the Dihing Formation, within the Bengal basin. It is likely, therefore, that the Dupi Tila
Formation was deposited during Pliocene-Pleistocene time in response to orogenesis
(Reimann, 1993). Notably, magnetostratigraphic studies by Worm et al. (1998) indicate
that age of the topmost Dupi Tila deposits is between 4.9 and 1.4 Ma.
1.4 OBJECTIVES
This study focuses on petrofacies evolution of the Dupi Tila Formation in the
Bengal basin, in order to evaluate and reconstruct the regional tectonic and detrital
histories of the basin during the Pliocene-Pleistocene.

7
The main objective of the thesis research is to infer the provenance of the Dupi Tila
Formation based on sandstone petrography, heavy minerals, mineral chemistry and
whole rock geochemistry of detrital grains.
Based on overall lithology and sediment thickness, the Upper Siwalik sediments
resemble those of the Dupi Tila Formation. The second objective of this research is to
compare the Dupi Tila Formation with well-documented Upper Siwalik sediments from
Pakistan, India, Nepal, and with the Upper Irrawaddy Formation of Myanmar, in an
attempt to develop an orogenic scale unroofing history from the western to the eastern
syntaxes of the Himalayas and the Indo-Burman ranges.

8
Chapter 2: TECTONIC SETTING AND REGIONAL GEOLOGY
2.1 INTRODUCTION
The tectonic history of the Bengal basin is related to the evolution of Himalayan
orogenic belts, which were formed in response to the collision of India and Eurasia. The
collision was brought by the migration of the Indian plate as the intervening Tethyan
Ocean was subducted beneath southern margin of the Eurasian plate (Kearey and Vine,
1990). Magnetic anomalies in the Indian Ocean and paleomagnetic measurements on the
subcontinent confirm the northward drift of India and allow the reconstruction of its path.
Basin development began in the Early Cretaceous (about 127 Ma) when the
Indian plate rifted away from Antarctica along an inferred northeast-southwest-trending
ridge system (Sclater and Fisher, 1974). After plate reorganization at about 90 Ma, the
Indian plate began migrating rapidly northward, leading to its collision with Asia, which
probably initiated during the Eocene between 55 to 40 Ma (Curray et al., 1979; Molnar,
1984; Rowley, 1996). Owing to the counter-clockwise rotation of the Indian plate (Lee
and Lawver, 1995) sometime after the initial convergence with Asia, the basin in the east
gradually started to close from north to south (oblique subduction). In the eastern part of
the basin, the subduction complex of the Indo-Burman arc emerged above sea level,
although major uplift of Himalayas may not have begun until the Miocene (Gansser,
1964). The intensity and pattern of plate-to-plate interaction varied with time, affecting
the basin architecture and sedimentation style throughout the basin.
2.2 TECTONIC SETTING
The Bengal basin is bordered by two young orogenic belts; the east-west trending
Himalayas and north-south trending Indo-Burma Range (Fig. 2.1). The basin is gradually
9
closing due to oblique subduction and orogeny along the eastern and northern margins
(Rowley, 1996). The Bengal basin has two broad tectonic provinces: (1) the stable shelf,
where thin sedimentary successions overlie the rocks of the Indian craton in the
northwestern part of Bangladesh; and (2) thick basin fill that overlies the basement of
undetermined origin in the south and east (Bakhtine, 1966; Khandoker, 1989). These two
provinces are separated by a northeast–southwest trending hinge zone. Compared to those
in the fold belt area to the east, strata in the deeper basin have experienced limited
tectonic deformation. A few deep basement faults and very gentle low angle folds with
narrow closure have been recognized from seismic data (Salt et al., 1986; Murphy, 1988;
Imam and Hussain, 2002). Sedimentation within the Bengal basin took place in five
distinct phases (Alam et al., 2003): (1) Permo-Carboniferous to early Cretaceous; (2)
Cretaceous–Mid-Eocene; (3) Mid-Eocene–Early Miocene; (4) Early Miocene–Mid-
Pliocene; and (5) Mid-Pliocene–Pleistocene. Each of these phases of sedimentation was
controlled by the tectonic cycles, which involved the interaction and collision pattern of
the major plates. Sedimentation in the basin has been divided into several stages: (1) syn-
rift stage; (2) drifting stage; (3) early collision stage; and (4) late collision stage (Johnson
and Alam, 1991; Alam et al., 2003). East-west and north-south cross-sections through the
Bengal basin are shown in figures 2.2 and 2.3.
The local and regional tectonics of northwestern Stable Platform, Sylhet Trough,
Garo hills, Sitapahar anticline, and Lalmai hills, where samples were collected for current
research, are described below and highlighted in figure 2.1.
i) The data derived from seismic surveys and exploratory wells revealed that
the northwestern Stable Platform flank is underlain by the Indian Shield
consisting of an Archean gneissic complex at varying depths over which
the Gondwana sediments have been deposited in intracratonic basins. The
Late Cretaceous Rajmahal basaltic trap flows and Cretaceous-Cenozoic
sediments, in turn, have been deposited over Gondwana sediments. The
Stable Platform is also known as Indian Platform or Stable Shelf.
10
Fig. 2.1 Tectonic Map of the Bengal basin showing different tectonic elements of the
basin. The N-S and E-W cross-sections are shown in the figure 2.2 and 2.3, respectively.
Tectonic regions are Stable Platform, Sylhet Trough, Garo hills, Lalmai hills, and
Sitapahar anticline.
N
W
E
S
Garo Hills
Lalmai
Hills
Sitapahar
Anticline
Stable
Platform
Sylhet trough
11
Fig. 2.2 North-south cross section through the Bengal basin (after Uddin and Lundberg,
2004).
Fig. 2.3 East-west cross section of the Bengal basin (after Uddin and Lundberg, 2004).
ii) The Sylhet Trough (Fig. 2.1) is bounded to the north by the Shillong
Plateau and to the east and south by the Chittagong Tripura fold belt
(Johnson and Nur Alam, 1991). It is mostly underlain by continental crust,
has accumulated more than 13 to 17 km of sedimentary strata (Evans,
1964; Hiller and Elahi, 1984). It has been mainly controlled by two
tectonic events: increased movement along the Dauki Fault (upthrust); and
westward advancement of the Indo-Burman Ranges due to continued
12
oblique subduction of the Indian Plate beneath the Burmese Plate after
Paleogene (Gani and Alam, 2002).
iii) The Garo hills (Fig. 2.1) of the north-central part of the basin are part of
the Garo-Khasi range in Shillong, India, the tectonic history of which has
to be explained in relation to the total structure of the Shillong Plateau.
The Shillong Plateau is considered to be a basement pop-up structure,
uplifted along steep and seismically active reverse faults; i.e., the E-W
trending Dauki fault in the south, and the inferred WNW-ESE trending
Oldham Fault in the north (Bilham and England, 2001; Rajendran et al.,
2004; Kayal et al., 2006; Clark and Bilham, 2008). An Archean gneissic
complex with acid and basic intrusives, Lower Gondwana rocks, and
Cretaceous-Cenozoic sediments are found in Garo hills stratigraphic
sequence. During the Miocene, sedimentation continued over the southern
and western part of the Garo hills and the southern fringe of the Khasi
Hills. The major uplift of the plateau as a whole started at the end of the
Miocene, resulting into the formation of the Khasi and Garo hills. The
Pliocene (Dupi Tila) sediments were deposited in nearby basins as the
uplift of the Shillong Plateau continued.
iv) The Sitapahar anticline (Fig. 2.1) is located in the southeastern part of the
basin. This anticline was formed by compressive forces exerted by
convergence of the Indian and Burmese plates. The evolution of the Indo-
Burman range and Arakan-Yoma range is related to this anticline. In the
late Pliocene, when the Chittagong Tripura Fold Belt was uplifted at the
eastern margin of the Trough, a huge volume of clastic sediments was
shed off, resulting in the deposition of Pliocene-Pleistocene Dupi Tila
sediments in the resulting foreland basin. The axis of the anticline trends
NNW-SSE along with the main structures of the Chittagong Tripura
Folded Belt (CTFB). This doubly plunging anticlinal structure is
approximately 400 km long and 12-15 km wide, and a major part of the
western flank is steeper than the eastern one. Both Lower and Upper Dupi
Tila sequences are well exposed here.
13
v) The Lalmai hills (Fig. 2.1) are located in the south-central part of the
Bengal basin. These hills are bounded on the east and west by faults; the
entire structural unit can be considered a horst (Khan, 1991). Morgan and
McIntire (1959) described the Lalmai hills as an uplifted block of highly
oxidized, red Pleistocene sediments. The average elevation is about 22
meters above sea level, although some of the individual peaks of the hills
are more than 45 meters high. Alluvium, Madhupur clay, and Dupi Tila
Formation are well exposed in the core of the anticlines of the Lalmai
hills.
2.3 REGIONAL GEOLOGY
The Bengal basin is asymmetric; sediment thickness increases toward the south
and the east (Bakhtine, 1966; Curray and Moore, 1974; Murphy, 1988; Khandoker, 1989;
Uddin and Lundberg, 2004). The basin contains approximately 16 km (Fig. 2.2 and 2.3)
of Cenozoic siliciclastic sediments (Uddin and Lundberg, 1998a). The basement of the
Indian platform slopes to the northwest and southeast from a central ridge, which is
underlain by the shallowest occurrence (~140 m) of Precambrian rocks in Bangladesh.
These basement rocks are the eastward subsurface continuation of the Indian shield. The
width of the basin ranges from 200 km in the north to more than 500 km in the south
where it extends into the Bay of Bengal.
Stratigraphic nomenclature of the Bengal basin has been established based on
type sections in the Assam basin (northeast India; Khan and Muminullah, 1980; Uddin et
al., 2010). Pre–Tertiary stratigraphic units of the Bengal basin are known only from the
northwestern part of the basin. A Precambrian basement complex composed of diorite,
gneiss, schist, amphibolite, diabase, migmatite, granite, granodiorite, and quartz-diorite
makes up part of the Indian craton (Zaher and Rahman, 1980; Uddin and Lundberg,
1999; Hossain, 2009). Basement rocks are overlain by a ~1–km–thick bituminous coal–
bearing sequence formed during the Permo–Carboniferous in intracratonic, fault–
bounded basins (Zaher and Rahman, 1980). This coal–bearing sequence is overlain by
~500 m of Cretaceous volcanic rocks, the Rajmahal/Sylhet Traps, which are older than
the Late Cretaceous Deccan Traps of western India. These are composed of hornblende
14
basalt, olivine basalt, and andesite (Khan and Muminullah, 1980; Uddin and Lundberg,
1999).
The generalized post–Mesozoic stratigraphy of the Bengal basin is shown in
Table 1. The Paleocene–Eocene units of Tura/Cherra Sandstone have been recovered in
drill holes in the northwest platform region (Khan and Muminullah, 1980) and are
exposed at a single locality, in a south–dipping block near the Shillong Plateau in the
northwestern part of the Sylhet trough (Uddin and Lundberg, 1999). This unit is overlain
by Middle Eocene open–marine Sylhet Limestone and late Eocene marine Kopili Shale
(Reimann, 1993; Jahan et al., 2017). The Kopili Shale is overlain by the Oligocene Barail
Group. This group, deposited in tide–dominated shelf environments (Khan, 1991; Jahan
et al., 2017), ranges from 800-1600 m thick and is exposed along the northern fringe of
the Sylhet trough near the Dauki fault (Johnson and Nur Alam, 1991). In platform areas,
Barail equivalent rock units are less than 200 meters thick and are known as the Bogra
Formation (Khan and Muminullah, 1988; Imam, 2005). The Miocene Surma Group is
subdivided into two units: 1) The Bhuban; and 2) Boka Bil formations (Holtrop and
Keizer, 1970; Hiller and Elahi, 1984; Khan, 1991), both of which extend throughout the
Bengal basin. The Surma Group was deposited in transitional delta–front settings and
comprises progradational sequences. The Surma Group is unconformably overlain by the
upper Miocene to Pliocene Tipam Group. The Tipam Group consists of the Tipam
Sandstone and Girujan Clay units, which were deposited in bed–load dominated,
braided–fluvial and lacustrine environments (Johnson and Nur Alam, 1991; Reimann,
1993). The overlying Dupi Tila Formation was deposited in meandering river
environments (Johnson and Nur Alam, 1991).
15
Table 1. Generalized Cenozoic stratigraphic succession of the Bengal basin (based on
Johnson and Nur Alam, 1991; Uddin and Lundberg, 1998a, 1999; Imam, 2005).
Age Group Formation Thickness
(m)
Lithology
Holocene Alluvium
Pleistocene
Dihing
Dihing
129
Yellow and gray,
medium–grained,
occasionally pebbly
sandstone
Pliocene
Dupi Tila
Dupi Tila
Claystone
Dupi Tila
Sandstone
2393
Claystone with
subordinate sandstones
and pebbles
Medium–to coarse–
grained, gray to yellow
sandstone with clay balls
Tipam
Girujan Clay
Tipam
Sandstone
1450
Red, brown, and purple
mottled clay with sand
lenses
Gray to brown, coarse–
grained, cross-bedded,
massive sandstone
Miocene
Surma
Boka Bil
1500
3100
Alternating shale, siltstone
and sandstone
Bhuban
Sandstone, siltstone,
clayey sandstone, clays
and lenticular
conglomerate
Oligocene
Barail
Renji
800-1000
Coarse–grained sandstone,
carbonaceous shale and
lenses of coal
Jenum Dark gray silty and sandy
shale
Eocene
to Paleocene
Jaintia
Kopili Shale
15-150
Alternating dark gray
calcareous shale and thin
limestones
Sylhet
Limestone
148
Gray to dark gray, highly
fossiliferous limestone
Tura/Cherra
Sandstone
240
White, pink to brown,
coarse–grained, cross–
bedded, carbonaceous
sandstone
Pre–
Paleocene
Undifferentiated
sedimentary rock
16
2.4 SIWALIKS OF INDIAN SUBCONTINENT
The term ‘Siwalik hills’ was introduced by Cautley to designate the sub-
Himalayan ranges occurring between the Ganges and Yamuna rivers. Studies of
vertebrate fossils and detailed magnetic stratigraphy were done in the area (Opdyke et al.,
1982; Johnson et al., 1985 and many others). Hugh Falconer, a Scottish paleontologist,
designated it as the “nearly continuous series of Tertiary formations stretching from
Punjab down to Irrawaddy” (Tripathi, 1986). The Siwalis hills are relatively low, ranging
in height from 1000-1200 m above mean sea level with variable trends running parallel to
the Himalayas.
Genetically, the Siwaliks represent clastic freshwater molasse that accumulated in
a long narrow foredeep formed to the south of the rising Himalaya, which had its
inception in the most intense uplift during the middle Miocene (Tripathi, 1986). Clastic
sediments accumulated in four different environments; lacustrine, channel and
floodplains, outwash plains, and piedmont. The age of the Siwalik Group ranges from
middle Miocene to middle Pleistocene. The Siwalik Group is subdivided into three
subgroups- Lower Siwalik, Middle Siwalik, and Upper Siwalik (Table 2).
The Lower Siwaliks (Chinji and Kamlal formations) constitute gray and green,
carbonate-cemented, fine- to medium-grained greywackes interbedded with well-
developed chocolate brown and maroon sandy clays (Pilgrim, 1913; Tripathi, 1986;
Carveny, 1986). The Lower Siwaliks are also characterized by alterations of sandstones
and clays. The Lower Siwalik Formation is underlained by the pre-Siwalik Murree
Formation.
17
Table 2. Summary of Siwalik Stratigraphy (ages from Johnson et al 1985, modified from
Cerveny, 1986).
Age Lithostratigraphy Lithology Thickness
(m) Boundary
Age
(m.y.) Group
Formation
Quat
ernar
y
Ple
isto
cene
Siw
alik
Siw
alik
U
pper
Mid
dle
Low
er
Soan
Compact, massive
conglomerates with interbeds
of varicolored sandstones,
siltstones, and claystones;
numerous volcanic ashes,
several of which are very
widespread.
2000
3.0
8.5
10.8
14.0
18.3
Neo
gen
e
Pli
oce
ne
Mio
cene
M
idd
le
Dhok
Pathan
Dominantly light gray to
reddish brown sandstones with
orange to brown siltstones and
claystones, no known volcanic
ash beds.
400
Nagri Massive gray to grayish brown
sandstone with subordinate
dark red to dark brown
siltstones and claystones, at
least 1 known volcanic ash.
750
Chinji Mostly bright red siltstones
and claystones with
subordinate light gray
sandstones, 1 suspected
volcanic ash.
700
Kamlal Gray to dark gray sandstones
with interbedss of reddish
purple siltstones and
claystones, 2 known volcanic
ash beds.
600
Pal
eogen
e
Oli
goce
ne
Raw
alpin
di
Murree Dominantly reddish gray to
maroon sandstones with
interbeds of dark red and
purple siltstones and claystone,
no known volcanic ash beds.
Up to
2000
Low
er
18
The Middle Siwaliks (Nagri and Dhok Pathan formations) consist predominately
of coarse-grained sandstones (Pilgrim, 1913; Cerveny, 1986; Tripathi 1986). They grade
from greywacke in the lower portions to arkose in the higher portions. They are soft and
friable owing to limited carbonate cementation. They are less well sorted compared to the
Lower Siwalik and contain unweathered feldspars and abundant woody material. Pebbles
are common towards the top. The clays are arenaceous. The thickness of the Middle
Siwalik, which conformably overly the Lower Siwalik, is 1390 m (Table 2).
The Upper Siwalik sediments (Soan Formation) comprise variegated, soft, and
massive pebbly sandstone with gray and brown clay beds, although conglomerates
predominate in the upper portions (Pilgrim, 1913; Tripathi 1986). The sandstones and the
conglomerates friable and contain streaks of lignite in places. The thickness of the Upper
Siwalik Formation is 2350 m.
Primary sedimentary structures observed in the Siwalik sediments include large-
scale tabular and trough cross beds and cut-and-fill structures. Small-scale cross beds,
wavy and parallel lamination, lunate and linguoid ripple marks, flute and load casts,
horizontal bedding, and mud cracks are also common (Johnson et al., 1985; Cerveny,
1986).
2.5 DUPI TILA FORMATION
2.5.1 DISTRIBUTION
The Dupi Tila Formation is widespread throughout the Bengal basin. It crops out
in most areas in the hilly regions of Sylhet, Comilla, Chittagong, and Hill Tract districts
where it commonly is overlain by a thin mantle of younger alluvium. On the flood plains
of the Ganges, Jamuna, and Meghna rivers, in the central table-land, and in the platform
area in the northwestern region, the Dupi Tila Formation lies mostly concealed under the
Pleistocene Madhupur Clay or more recent Dihing pebbles or the alluvium (Khan, 1991;
Reimann, 1993). The type area of the Dupi Tila Formation is located in the northeast
Sylhet area, Bangladesh; the unit was named for sandstone cropping out near a village
called “Dupigaon” (Fig. 2.4), where the unit is approximately 300-500 m thick.
19
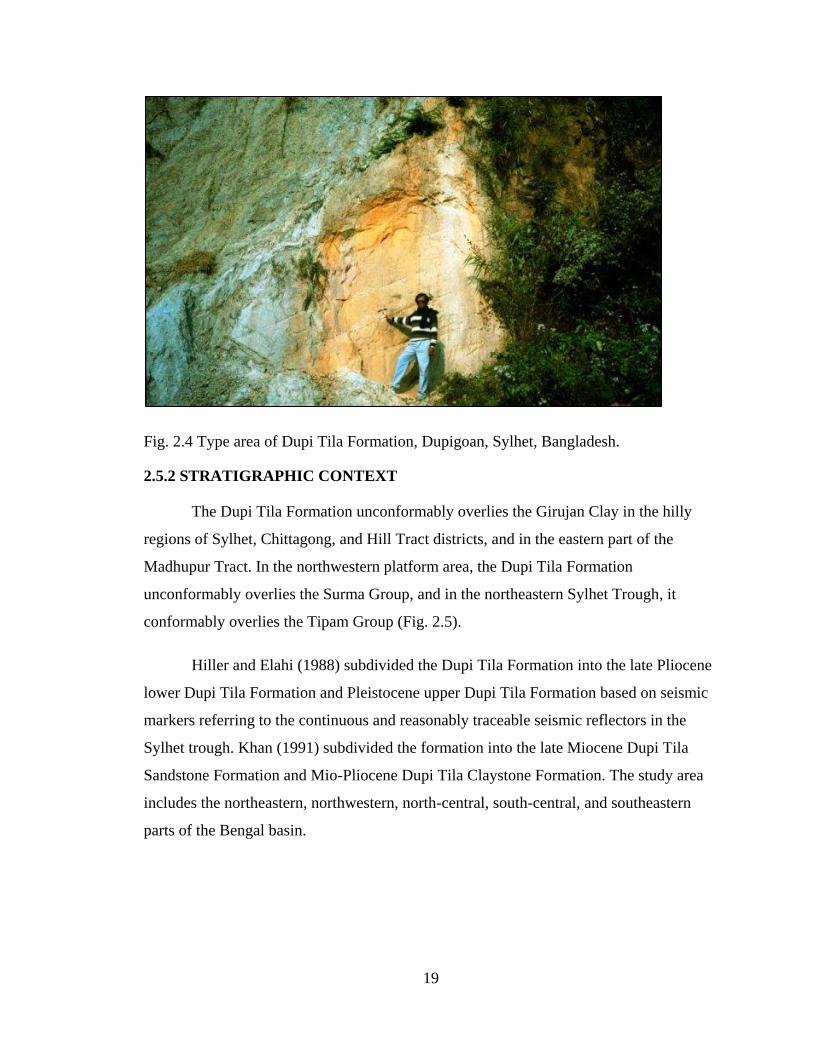
Fig. 2.4 Type area of Dupi Tila Formation, Dupigoan, Sylhet, Bangladesh.
2.5.2 STRATIGRAPHIC CONTEXT
The Dupi Tila Formation unconformably overlies the Girujan Clay in the hilly
regions of Sylhet, Chittagong, and Hill Tract districts, and in the eastern part of the
Madhupur Tract. In the northwestern platform area, the Dupi Tila Formation
unconformably overlies the Surma Group, and in the northeastern Sylhet Trough, it
conformably overlies the Tipam Group (Fig. 2.5).
Hiller and Elahi (1988) subdivided the Dupi Tila Formation into the late Pliocene
lower Dupi Tila Formation and Pleistocene upper Dupi Tila Formation based on seismic
markers referring to the continuous and reasonably traceable seismic reflectors in the
Sylhet trough. Khan (1991) subdivided the formation into the late Miocene Dupi Tila
Sandstone Formation and Mio-Pliocene Dupi Tila Claystone Formation. The study area
includes the northeastern, northwestern, north-central, south-central, and southeastern
parts of the Bengal basin.

20
Fig. 2.5 Stratigraphic framework of the Bengal basin, Bangladesh (modified after Uddin and Lundberg, 1998a; Jahan et al.,
2017). Orange boxes show the Dupi Tila Formation (also known as Dupi Tila Sandstone) in different parts of the basin.

21
2.5.3 SEDIMENTOLOGIC CHARACTER
The Dupi Tila Formation is composed of yellow (Fig. 2.6 A), light brown, and
pink, medium- to very fine-grained, moderately to poorly indurated sandstone, with
interbedded siltstone, silty clay, mudstone, and shale (Fig. 2.6D) and rare pebble beds
(Fig. 2.6B) and accumulations of petrified wood (Fig. 2.6C). It includes planar bedded
(Fig. 2.6E), planar cross-bedded, trough cross-bedded, convolute bedded (Fig. 2.6F), and
massive sandstone, ripple cross-laminated sandstone-siltstone, flaser-laminated
sandstone-shale, lenticular laminated sandstone-siltstone-shale, parallel-laminated
sandstone-siltstone, wavy laminated shale, parallel-laminated blue shale, and mudstone
(Khan, 1991; Reimann, 1993; Gani and Alam, 2002; Alam et al., 2003; Roy, 2012).
Locally sediments of the Dupi Tila are bioturbated (Fig. 2.6H) and contain rip-up clasts
(Fig. 2.6G).

22
Fig. 2.6 Outcrops showing different characteristics of Dupi Tila Formation; A- typical
yellowish brown sandstone; B- pebble beds; C- petrified wood in sandstone; D- sand with
clay lenses; E- planar bedding; F- convolute bedding; G- rip-up clasts; and H-
bioturbation.
23
Chapter 3: MATERIALS AND METHODS
3.1 FIELDWORK
Geological field work was carried out in Bangladesh from December 12, 2015, to
January 8, 2016. Sixty-one samples were collected from northeastern, northwestern,
north-central, south-central and southeastern regions of the Bengal basin, Bangladesh
(Fig. 3.1). Among these, fifty-six samples were outcrop samples, and six were drill-core
cuttings collected from the northwestern Bengal basin.
Sample-collection sites include: (i) Garo hills, Bijoypur, Netrokona, north-central,
Bengal basin; (ii) Sylhet Trough, Shari-Goyain river section, northeastern, Bengal basin;
(iii) Lalmai hills, Comilla, south-central, Bengal basin; (iv) Chittagong Hill Tracts,
Sitapahar anticline, Kaptai, southeastern, Bengal basin; and (v) the Stable Platform
(Dinajpur, and Rangpur), northwestern, Bengal basin (Fig. 3.1).

24
Fig. 3.1 Map showing study locations in the Bengal basin, Bangladesh.
3.1.1 SEDIMENT SAMPLING
Sandstone samples and associated pebbles were collected from both outcrops and
drill cores from the Bengal basin. Sediment samples were collected from various
locations at an interval of ~5 meters. Outcrop samples were collected using a hand-held
auger (Fig. 3.2A, B).
About 200 grams of sample were collected from each sample site. Samples were
saved in a sample bag, dated, and numbered. Photographs were taken during the
25
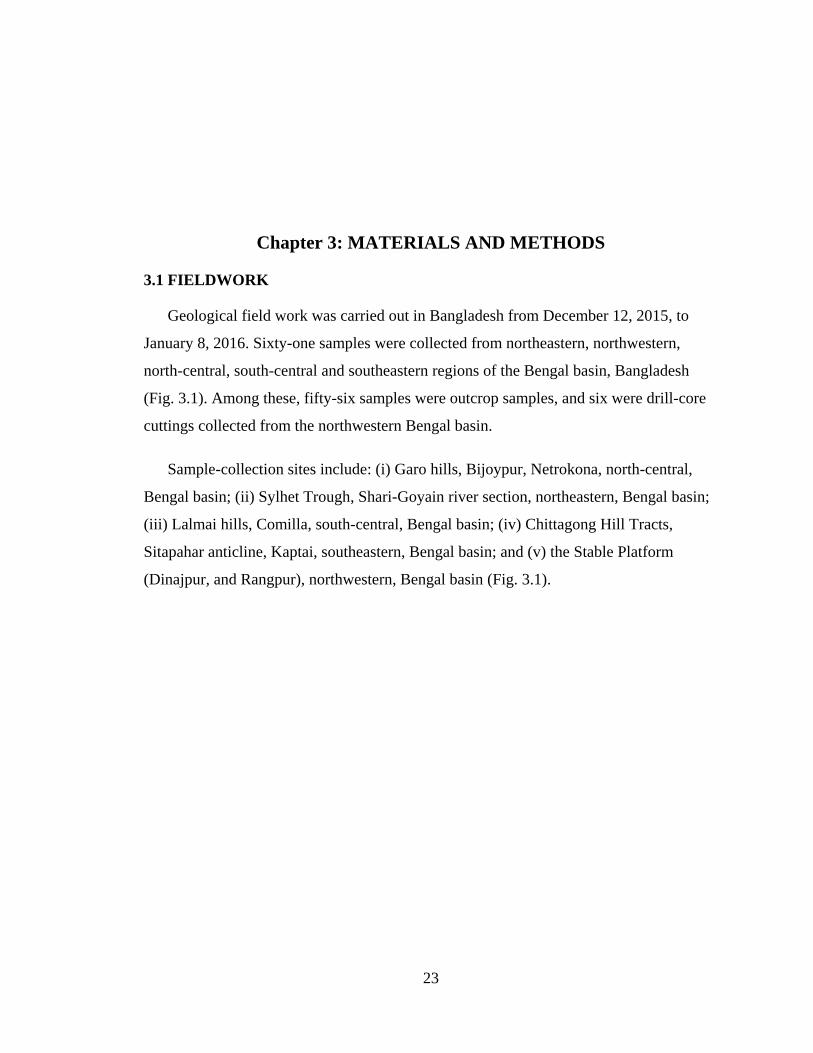
fieldwork (e.g. outcrop, special features, etc.) using a reference scale (Fig. 3.2A-F). A
GPS (Global Positioning System) unit was used during the field operations, and latitude
and longitude of each station were recorded. Finally, all the samples were shipped from
Bangladesh to Auburn University. Thin sections were prepared from the samples and
were analyzed under a petrographic microscope.
Fig. 3.2. Sampling from different outcrops using hand auger (A, B). Locations shown are
the Shari-Goyain river section, Sylhet Trough (C), Garo hills, Bijoypur, Netrokona (D),
Lalmai hills, Comilla (E), and Sitapahar anticline, Kaptai, Chittagong hill tracts (D, F).
A
E
C
B
F
D

26
3.1.2 CORE SAMPLING
Sediment cores were housed at the repositories of the Geological Survey of
Bangladesh (GSB). Only six samples were available from the core lab in Bogra,
northwestern Bangladesh (Fig. 3.3). Three samples each were collected from core GDH-
56, Dangapara, Dinajpur, and core GDH-69, Madarpur, Mithapukur, Rangpur.
Fig. 3.3 Core samples arranged according to drilling depth, Bogra, Bangladesh.
3.2 LABORATORY ANALYSIS
The following provenance indicative methods were performed on the collected
samples:
Petrographic analysis of sandstone samples
Heavy mineral analysis of intercalated sandstones
Microprobe analysis on selected heavy minerals
Whole-rock chemistry on selected mud and sand samples
Among sixty-one (61) samples, thirty (30) samples were prepared for
petrographic study, twenty-five (25) for heavy mineral analysis, ten (10) for electron
microprobe study, and ten (10) for whole-rock chemistry study. These samples are shown
in Table 3.
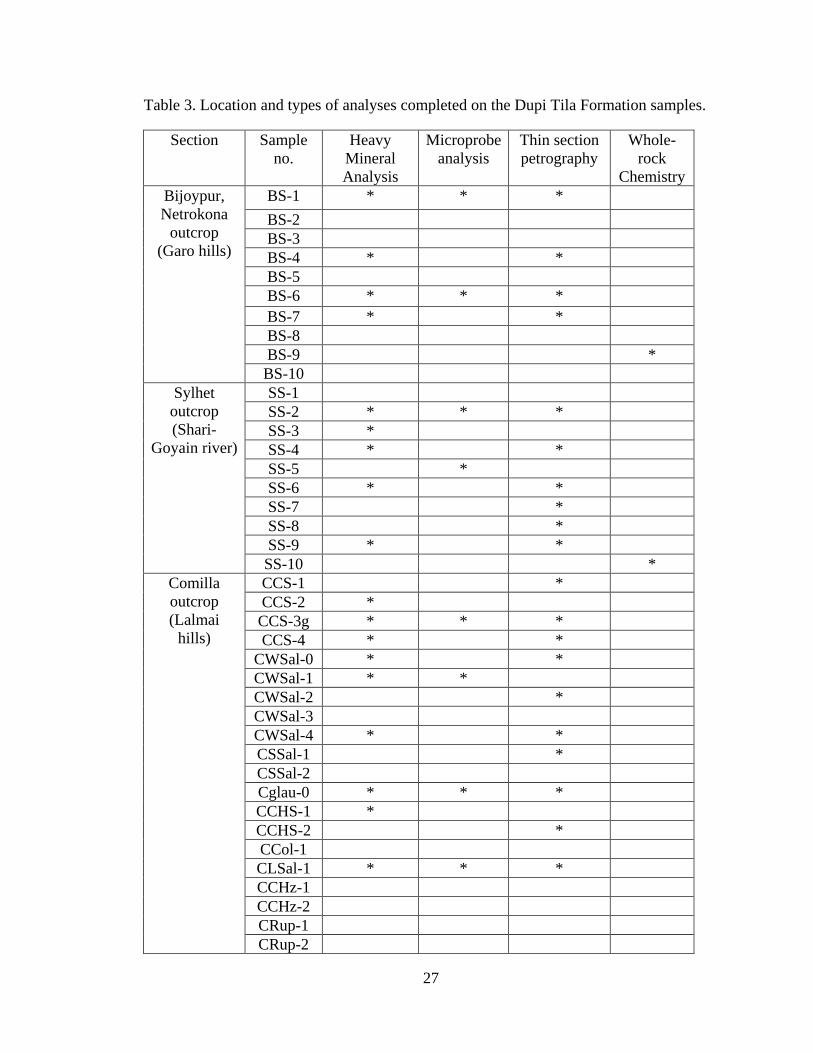
27
Table 3. Location and types of analyses completed on the Dupi Tila Formation samples.
Section Sample
no.
Heavy
Mineral
Analysis
Microprobe
analysis
Thin section
petrography
Whole-
rock
Chemistry
Bijoypur,
Netrokona
outcrop
(Garo hills)
BS-1 * * *
BS-2
BS-3
BS-4 * *
BS-5
BS-6 * * *
BS-7 * *
BS-8
BS-9 *
BS-10
Sylhet
outcrop
(Shari-
Goyain river)
SS-1
SS-2 * * *
SS-3 *
SS-4 * *
SS-5 *
SS-6 * *
SS-7 *
SS-8 *
SS-9 * *
SS-10 *
Comilla
outcrop
(Lalmai
hills)
CCS-1 *
CCS-2 *
CCS-3g * * *
CCS-4 * *
CWSal-0 * *
CWSal-1 * *
CWSal-2 *
CWSal-3
CWSal-4 * *
CSSal-1 *
CSSal-2
Cglau-0 * * *
CCHS-1 *
CCHS-2 *
CCol-1
CLSal-1 * * *
CCHz-1
CCHz-2
CRup-1
CRup-2
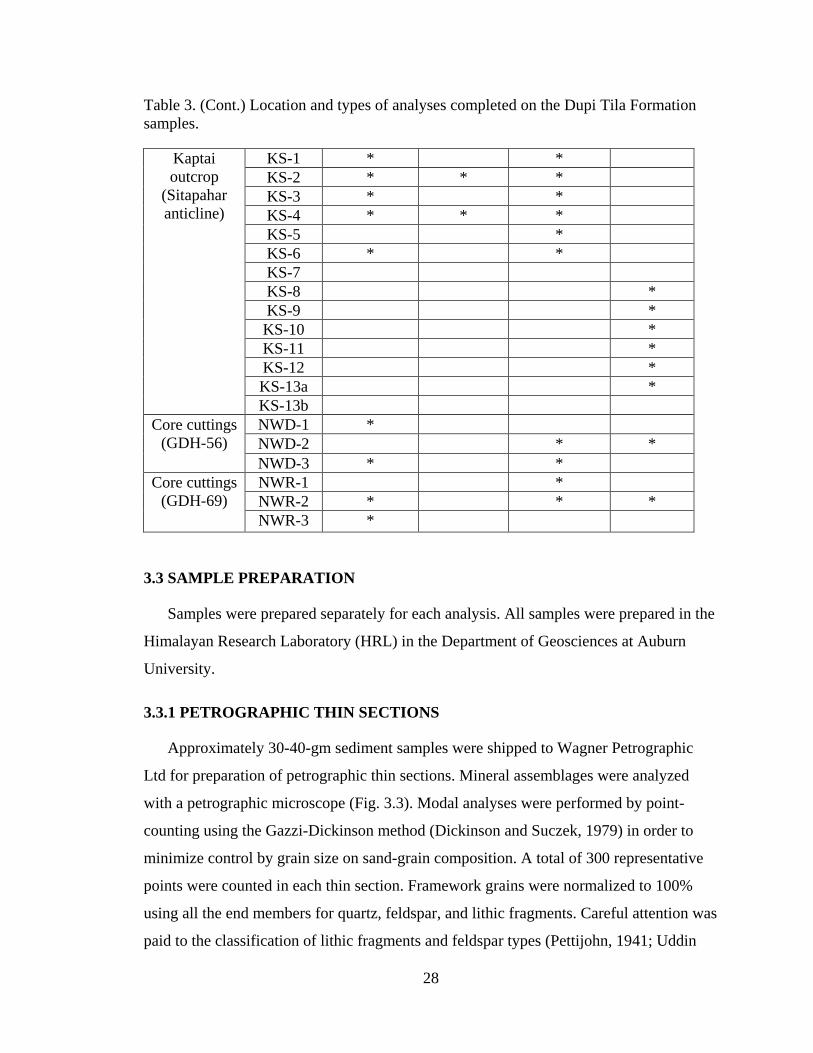
28
Table 3. (Cont.) Location and types of analyses completed on the Dupi Tila Formation
samples.
Kaptai
outcrop
(Sitapahar
anticline)
KS-1 * *
KS-2 * * *
KS-3 * *
KS-4 * * *
KS-5 *
KS-6 * *
KS-7
KS-8 *
KS-9 *
KS-10 *
KS-11 *
KS-12 *
KS-13a *
KS-13b
Core cuttings
(GDH-56)
NWD-1 *
NWD-2 * *
NWD-3 * *
Core cuttings
(GDH-69)
NWR-1 *
NWR-2 * * *
NWR-3 *
3.3 SAMPLE PREPARATION
Samples were prepared separately for each analysis. All samples were prepared in the
Himalayan Research Laboratory (HRL) in the Department of Geosciences at Auburn
University.
3.3.1 PETROGRAPHIC THIN SECTIONS
Approximately 30-40-gm sediment samples were shipped to Wagner Petrographic
Ltd for preparation of petrographic thin sections. Mineral assemblages were analyzed
with a petrographic microscope (Fig. 3.3). Modal analyses were performed by point-
counting using the Gazzi-Dickinson method (Dickinson and Suczek, 1979) in order to
minimize control by grain size on sand-grain composition. A total of 300 representative
points were counted in each thin section. Framework grains were normalized to 100%
using all the end members for quartz, feldspar, and lithic fragments. Careful attention was
paid to the classification of lithic fragments and feldspar types (Pettijohn, 1941; Uddin
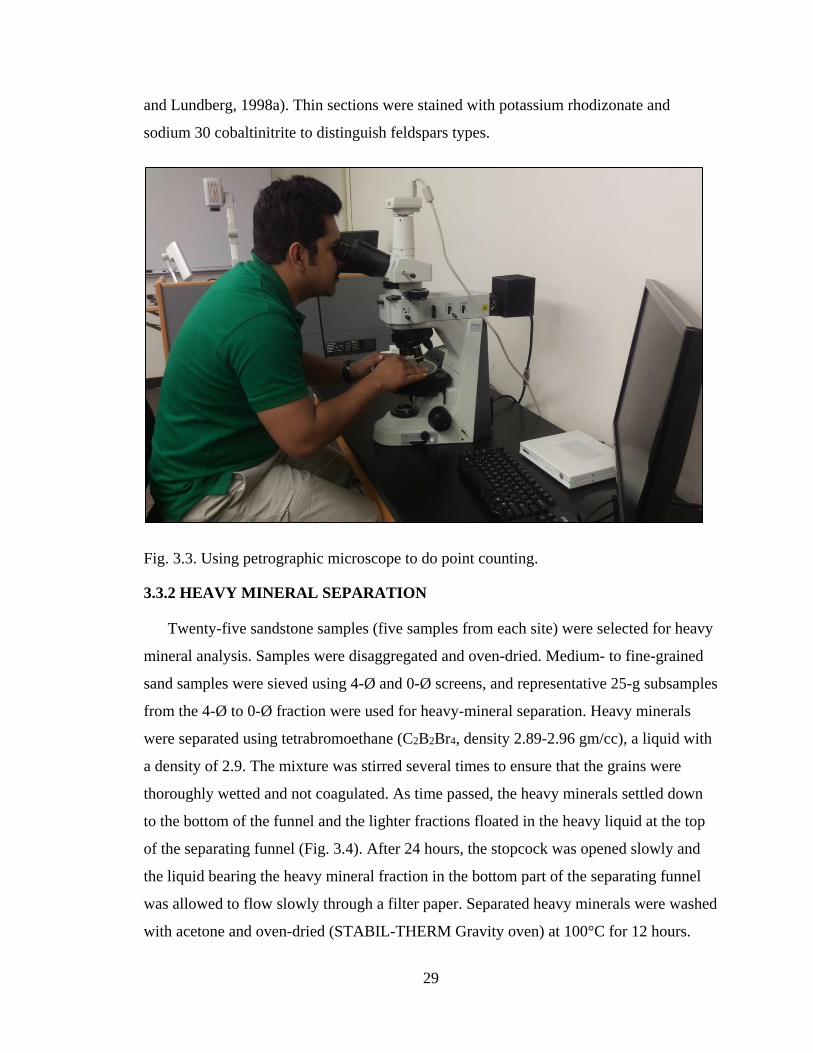
29
and Lundberg, 1998a). Thin sections were stained with potassium rhodizonate and
sodium 30 cobaltinitrite to distinguish feldspars types.
Fig. 3.3. Using petrographic microscope to do point counting.
3.3.2 HEAVY MINERAL SEPARATION
Twenty-five sandstone samples (five samples from each site) were selected for heavy
mineral analysis. Samples were disaggregated and oven-dried. Medium- to fine-grained
sand samples were sieved using 4-Ø and 0-Ø screens, and representative 25-g subsamples
from the 4-Ø to 0-Ø fraction were used for heavy-mineral separation. Heavy minerals
were separated using tetrabromoethane (C2B2Br4, density 2.89-2.96 gm/cc), a liquid with
a density of 2.9. The mixture was stirred several times to ensure that the grains were
thoroughly wetted and not coagulated. As time passed, the heavy minerals settled down
to the bottom of the funnel and the lighter fractions floated in the heavy liquid at the top
of the separating funnel (Fig. 3.4). After 24 hours, the stopcock was opened slowly and
the liquid bearing the heavy mineral fraction in the bottom part of the separating funnel
was allowed to flow slowly through a filter paper. Separated heavy minerals were washed
with acetone and oven-dried (STABIL-THERM Gravity oven) at 100°C for 12 hours.
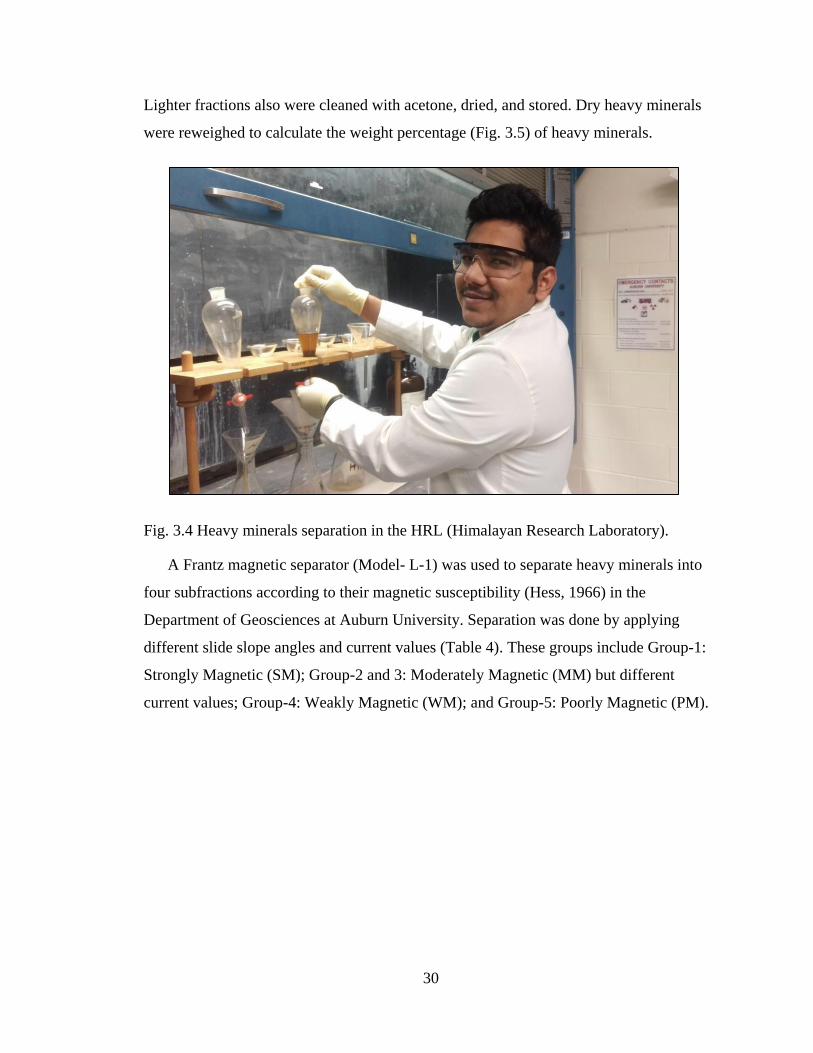
30
Lighter fractions also were cleaned with acetone, dried, and stored. Dry heavy minerals
were reweighed to calculate the weight percentage (Fig. 3.5) of heavy minerals.
Fig. 3.4 Heavy minerals separation in the HRL (Himalayan Research Laboratory).
A Frantz magnetic separator (Model- L-1) was used to separate heavy minerals into
four subfractions according to their magnetic susceptibility (Hess, 1966) in the
Department of Geosciences at Auburn University. Separation was done by applying
different slide slope angles and current values (Table 4). These groups include Group-1:
Strongly Magnetic (SM); Group-2 and 3: Moderately Magnetic (MM) but different
current values; Group-4: Weakly Magnetic (WM); and Group-5: Poorly Magnetic (PM).
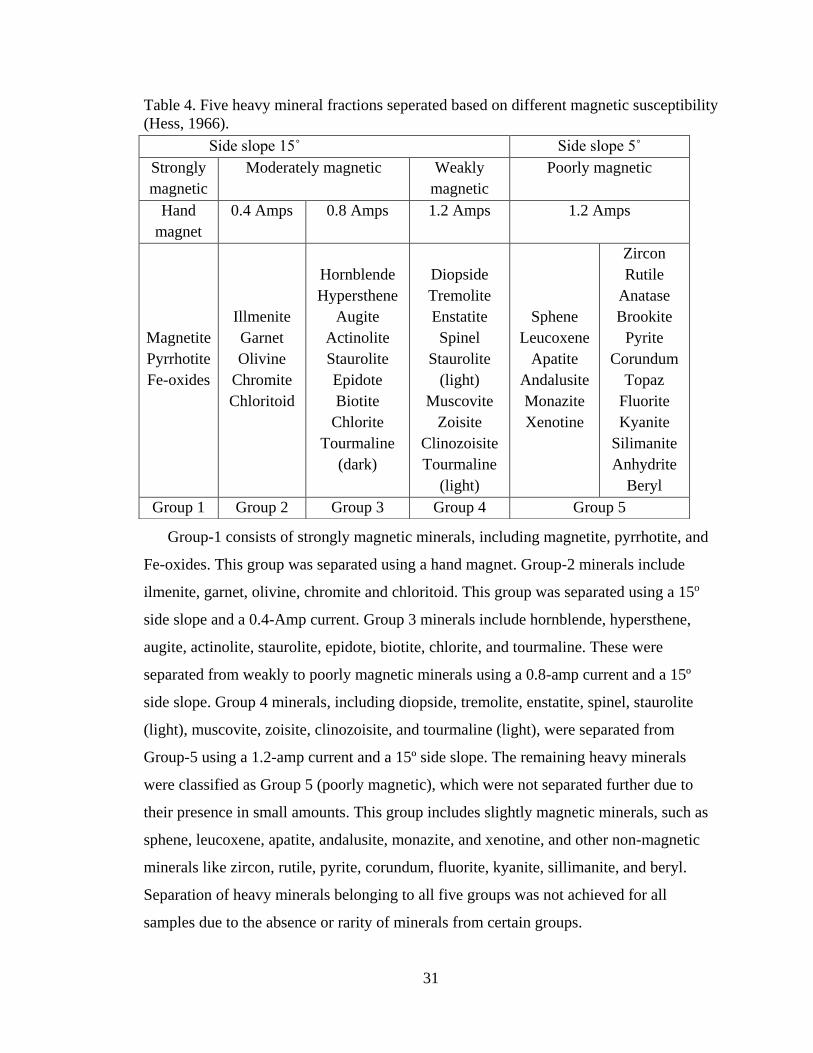
31
Table 4. Five heavy mineral fractions seperated based on different magnetic susceptibility
(Hess, 1966).
Group-1 consists of strongly magnetic minerals, including magnetite, pyrrhotite, and
Fe-oxides. This group was separated using a hand magnet. Group-2 minerals include
ilmenite, garnet, olivine, chromite and chloritoid. This group was separated using a 15o
side slope and a 0.4-Amp current. Group 3 minerals include hornblende, hypersthene,
augite, actinolite, staurolite, epidote, biotite, chlorite, and tourmaline. These were
separated from weakly to poorly magnetic minerals using a 0.8-amp current and a 15º
side slope. Group 4 minerals, including diopside, tremolite, enstatite, spinel, staurolite
(light), muscovite, zoisite, clinozoisite, and tourmaline (light), were separated from
Group-5 using a 1.2-amp current and a 15º side slope. The remaining heavy minerals
were classified as Group 5 (poorly magnetic), which were not separated further due to
their presence in small amounts. This group includes slightly magnetic minerals, such as
sphene, leucoxene, apatite, andalusite, monazite, and xenotine, and other non-magnetic
minerals like zircon, rutile, pyrite, corundum, fluorite, kyanite, sillimanite, and beryl.
Separation of heavy minerals belonging to all five groups was not achieved for all
samples due to the absence or rarity of minerals from certain groups.
Side slope 15˚
Side slope 5˚
Strongly
magnetic
Moderately magnetic Weakly
magnetic
Poorly magnetic
Hand
magnet
0.4 Amps 0.8 Amps 1.2 Amps 1.2 Amps
Magnetite
Pyrrhotite
Fe-oxides
Illmenite
Garnet
Olivine
Chromite
Chloritoid
Hornblende
Hypersthene
Augite
Actinolite
Staurolite
Epidote
Biotite
Chlorite
Tourmaline
(dark)
Diopside
Tremolite
Enstatite
Spinel
Staurolite
(light)
Muscovite
Zoisite
Clinozoisite
Tourmaline
(light)
Sphene
Leucoxene
Apatite
Andalusite
Monazite
Xenotine
Zircon
Rutile
Anatase
Brookite
Pyrite
Corundum
Topaz
Fluorite
Kyanite
Silimanite
Anhydrite
Beryl
Group 1 Group 2 Group 3 Group 4 Group 5
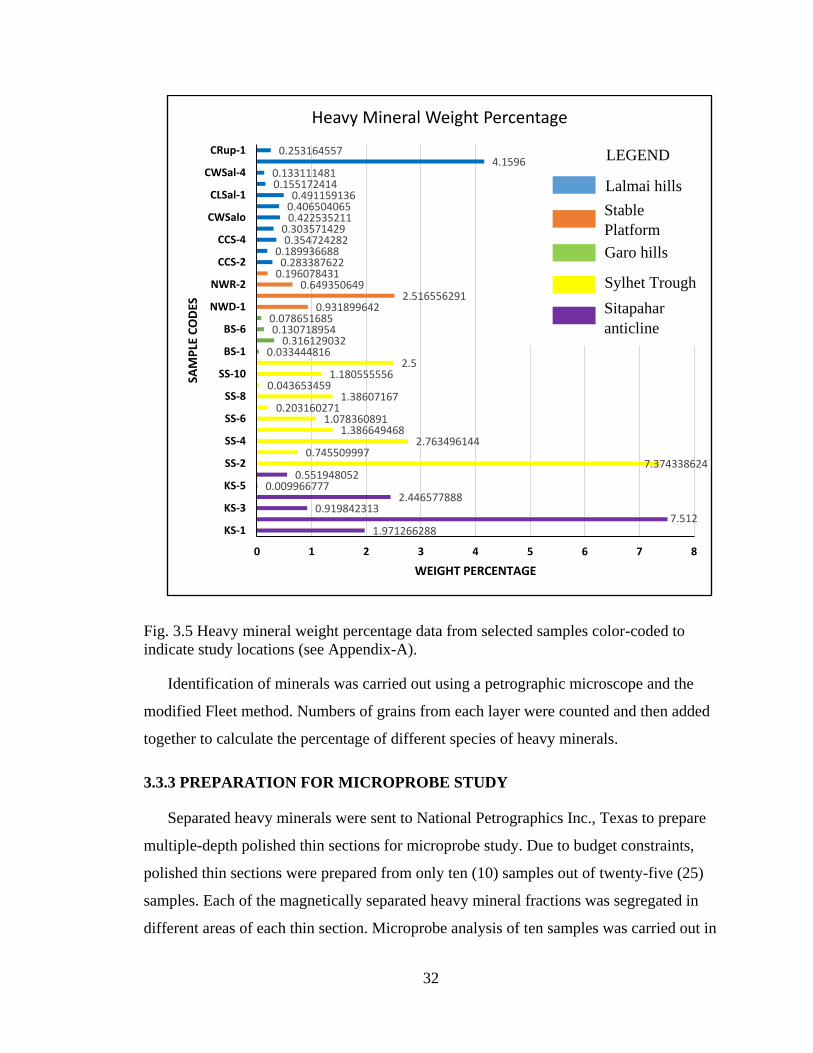
32
Fig. 3.5 Heavy mineral weight percentage data from selected samples color-coded to
indicate study locations (see Appendix-A).
Identification of minerals was carried out using a petrographic microscope and the
modified Fleet method. Numbers of grains from each layer were counted and then added
together to calculate the percentage of different species of heavy minerals.
3.3.3 PREPARATION FOR MICROPROBE STUDY
Separated heavy minerals were sent to National Petrographics Inc., Texas to prepare
multiple-depth polished thin sections for microprobe study. Due to budget constraints,
polished thin sections were prepared from only ten (10) samples out of twenty-five (25)
samples. Each of the magnetically separated heavy mineral fractions was segregated in
different areas of each thin section. Microprobe analysis of ten samples was carried out in
1.9712662887.512
0.9198423132.446577888
0.0099667770.551948052
7.3743386240.745509997
2.7634961441.386649468
1.0783608910.203160271
1.386071670.043653459
1.1805555562.5
0.0334448160.316129032
0.1307189540.078651685
0.9318996422.516556291
0.6493506490.1960784310.283387622
0.1899366880.354724282
0.3035714290.4225352110.4065040650.491159136
0.1551724140.133111481
4.159677960.253164557
0 1 2 3 4 5 6 7 8
KS-1
KS-3
KS-5
SS-2
SS-4
SS-6
SS-8
SS-10
BS-1
BS-6
NWD-1
NWR-2
CCS-2
CCS-4
CWSalo
CLSal-1
CWSal-4
CRup-1
WEIGHT PERCENTAGE
SAM
PLE
CO
DES
Heavy Mineral Weight Percentage
LEGEND
Lalmai hills
Stable
Platform
Garo hills
Sylhet Trough
Sitapahar
anticline
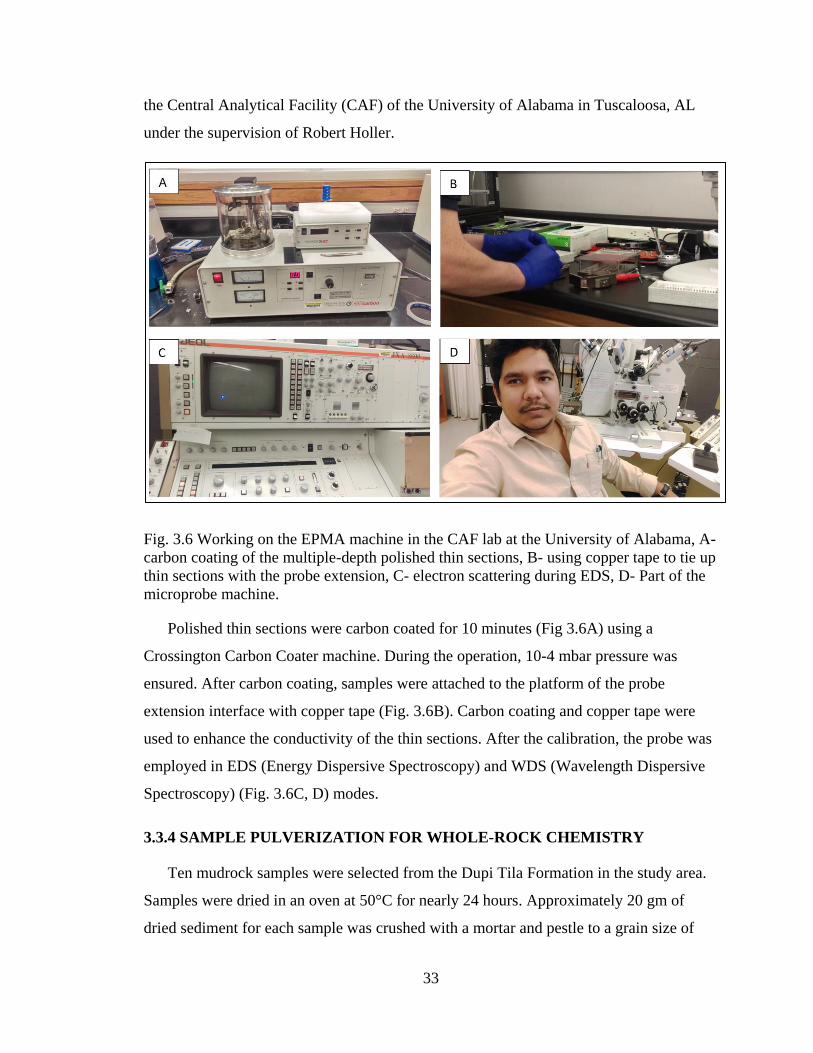
33
the Central Analytical Facility (CAF) of the University of Alabama in Tuscaloosa, AL
under the supervision of Robert Holler.
Fig. 3.6 Working on the EPMA machine in the CAF lab at the University of Alabama, A-
carbon coating of the multiple-depth polished thin sections, B- using copper tape to tie up
thin sections with the probe extension, C- electron scattering during EDS, D- Part of the
microprobe machine.
Polished thin sections were carbon coated for 10 minutes (Fig 3.6A) using a
Crossington Carbon Coater machine. During the operation, 10-4 mbar pressure was
ensured. After carbon coating, samples were attached to the platform of the probe
extension interface with copper tape (Fig. 3.6B). Carbon coating and copper tape were
used to enhance the conductivity of the thin sections. After the calibration, the probe was
employed in EDS (Energy Dispersive Spectroscopy) and WDS (Wavelength Dispersive
Spectroscopy) (Fig. 3.6C, D) modes.
3.3.4 SAMPLE PULVERIZATION FOR WHOLE-ROCK CHEMISTRY
Ten mudrock samples were selected from the Dupi Tila Formation in the study area.
Samples were dried in an oven at 50°C for nearly 24 hours. Approximately 20 gm of
dried sediment for each sample was crushed with a mortar and pestle to a grain size of

34
<0.63 mm and homogenized. Samples were sent to the ACME Laboratories Ltd.,
Vancouver, BC, Canada, for analysis. In the lab, splits of 0.2 g of each sample were
analyzed by ICP emission spectra following lithium metaborate/tetrabortate fusion and
dilute nitric digestion. Loss on Ignition was calculated by weighing the difference after
ignition at 1000oC. The geochemical analysis included the measurements of 11 oxides
(SiO2, Al2O3, Fe2O3, MgO, CaO, Na2O, K2O, TiO2, P2O5, MnO, and Cr2O3) and 7 trace
elements (Ba, Ni, Sr, Zr, Y, Nb, and Sc).
35
Chapter 4: SANDSTONE PETROGRAPHY
4.1 INTRODUCTION
Sandstone petrography is a widely used technique to infer petrofacies evolution.
Sedimentary rocks are principal sources of information in deciphering the paleotectonic
history of the Earth’s crust. Conventional petrography by point-counting using the Gazzi-
Dickinson method is followed in order to minimize control by grain size on sand-grain
composition (Dickinson and Suczek, 1979; Ingersoll et al., 1984). Careful attention was
paid to the classification of the lithic fragment and feldspar types (Uddin and Lundberg,
1998a). Data were plotted on ternary diagrams to infer tectonic provenance (Dickinson
1985; Ingersoll et al., 1984). Mack (1984) suggested that factors other than the source-
rock composition also are important in determining the ultimate composition of
sandstones. Sandstone composition is sensitive to several factors, such as climate, relief,
transport, and diagenesis, which provide valuable information for paleogeographic
reconstructions (Suttner, 1974; Ingersoll et al., 1984; Johnson, 1993). Basin evolution and
unroofing history of mountain belts can be best inferred through provenance studies that
focus on key attributes of detrital mineralogy (Dorsey, 1988; Cerveny, 1986; Uddin and
Lundberg, 1998a, b). Petrofacies evolution through detailed mineralogical analyses is
based on the assumption that modes of transportation, depositional environments,
climates, and diagenesis have not significantly altered detrital grain composition (Basu et
al., 1975; Kumar, 2004; Sitaula, 2009; Alam, 2011; Chowdhury, 2014). Hence, all these
factors need to be considered when interpreting sediment provenance (Suttner, 1974;
Johnsson, 1993). This chapter deals with sandstone petrography and modal analysis of
Pliocene-Pleistocene clastic sequences deposited throughout the Bengal basin.
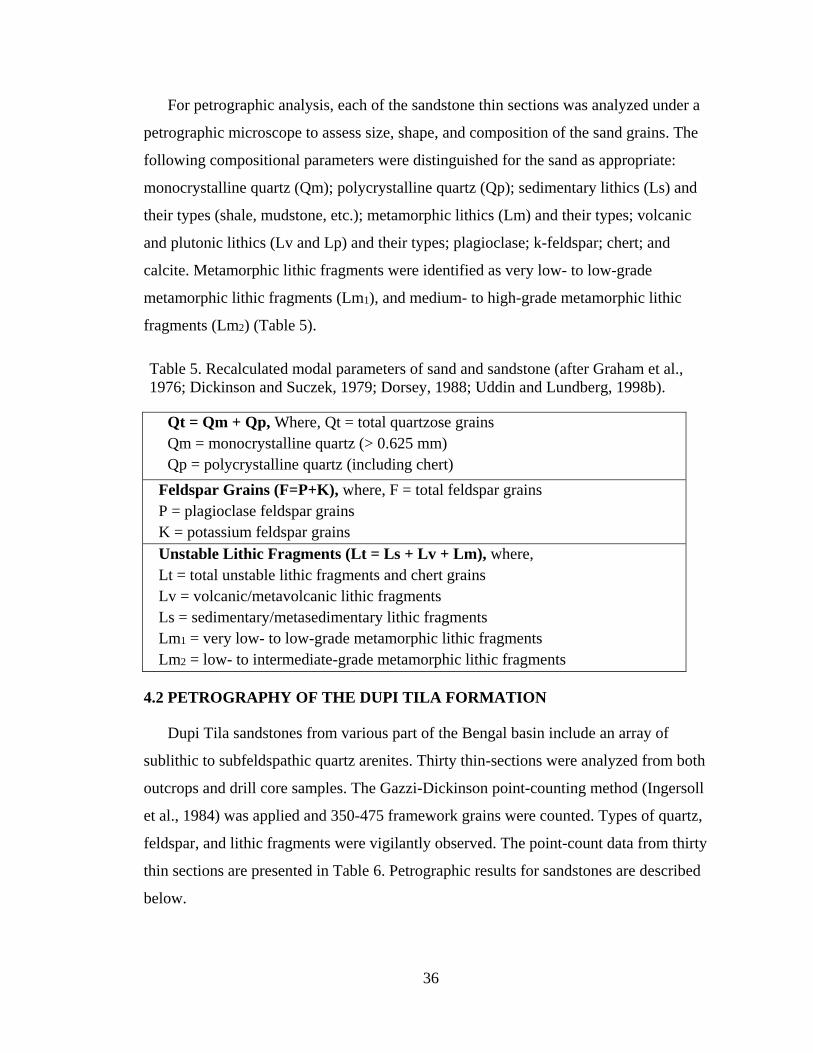
36
For petrographic analysis, each of the sandstone thin sections was analyzed under a
petrographic microscope to assess size, shape, and composition of the sand grains. The
following compositional parameters were distinguished for the sand as appropriate:
monocrystalline quartz (Qm); polycrystalline quartz (Qp); sedimentary lithics (Ls) and
their types (shale, mudstone, etc.); metamorphic lithics (Lm) and their types; volcanic
and plutonic lithics (Lv and Lp) and their types; plagioclase; k-feldspar; chert; and
calcite. Metamorphic lithic fragments were identified as very low- to low-grade
metamorphic lithic fragments (Lm1), and medium- to high-grade metamorphic lithic
fragments (Lm2) (Table 5).
Table 5. Recalculated modal parameters of sand and sandstone (after Graham et al.,
1976; Dickinson and Suczek, 1979; Dorsey, 1988; Uddin and Lundberg, 1998b).
Qt = Qm + Qp, Where, Qt = total quartzose grains
Qm = monocrystalline quartz (> 0.625 mm)
Qp = polycrystalline quartz (including chert)
Feldspar Grains (F=P+K), where, F = total feldspar grains
P = plagioclase feldspar grains
K = potassium feldspar grains
Unstable Lithic Fragments (Lt = Ls + Lv + Lm), where,
Lt = total unstable lithic fragments and chert grains
Lv = volcanic/metavolcanic lithic fragments
Ls = sedimentary/metasedimentary lithic fragments
Lm1 = very low- to low-grade metamorphic lithic fragments
Lm2 = low- to intermediate-grade metamorphic lithic fragments
4.2 PETROGRAPHY OF THE DUPI TILA FORMATION
Dupi Tila sandstones from various part of the Bengal basin include an array of
sublithic to subfeldspathic quartz arenites. Thirty thin-sections were analyzed from both
outcrops and drill core samples. The Gazzi-Dickinson point-counting method (Ingersoll
et al., 1984) was applied and 350-475 framework grains were counted. Types of quartz,
feldspar, and lithic fragments were vigilantly observed. The point-count data from thirty
thin sections are presented in Table 6. Petrographic results for sandstones are described
below.
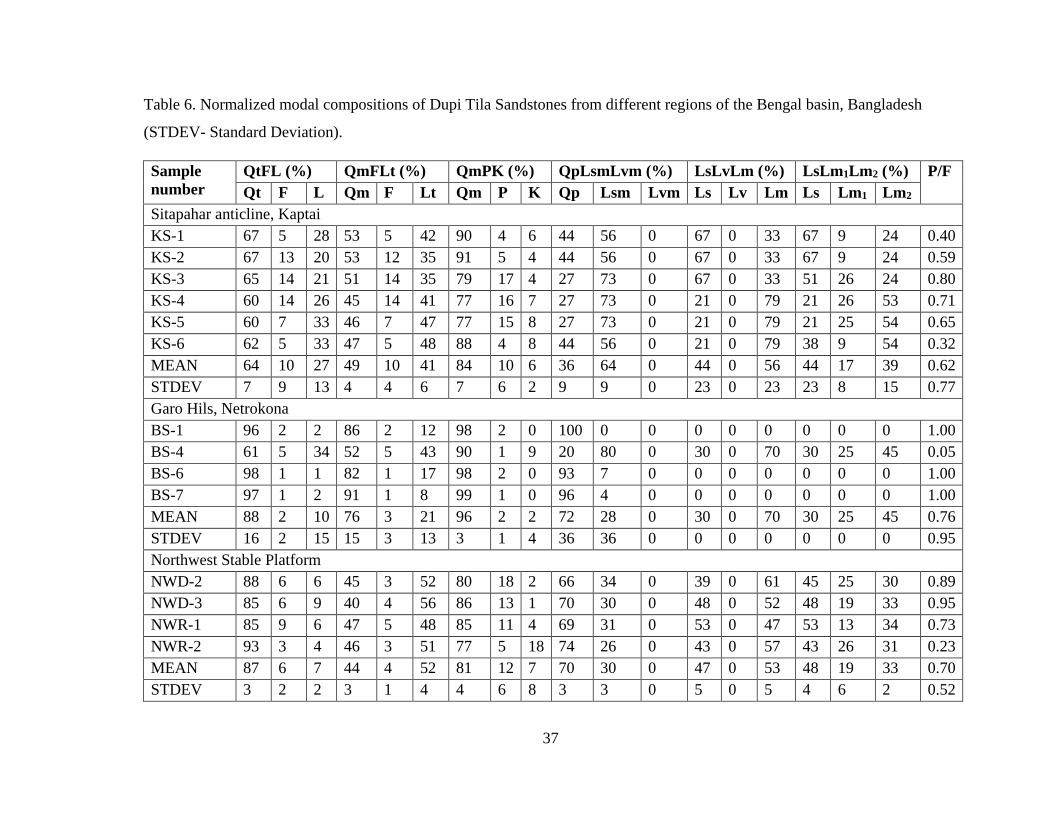
37
Table 6. Normalized modal compositions of Dupi Tila Sandstones from different regions of the Bengal basin, Bangladesh
(STDEV- Standard Deviation).
Sample
number
QtFL (%) QmFLt (%) QmPK (%) QpLsmLvm (%) LsLvLm (%) LsLm1Lm2 (%) P/F
Qt F L Qm F Lt Qm P K Qp Lsm Lvm Ls Lv Lm Ls Lm1 Lm2
Sitapahar anticline, Kaptai
KS-1 67 5 28 53 5 42 90 4 6 44 56 0 67 0 33 67 9 24 0.40
KS-2 67 13 20 53 12 35 91 5 4 44 56 0 67 0 33 67 9 24 0.59
KS-3 65 14 21 51 14 35 79 17 4 27 73 0 67 0 33 51 26 24 0.80
KS-4 60 14 26 45 14 41 77 16 7 27 73 0 21 0 79 21 26 53 0.71
KS-5 60 7 33 46 7 47 77 15 8 27 73 0 21 0 79 21 25 54 0.65
KS-6 62 5 33 47 5 48 88 4 8 44 56 0 21 0 79 38 9 54 0.32
MEAN 64 10 27 49 10 41 84 10 6 36 64 0 44 0 56 44 17 39 0.62
STDEV 7 9 13 4 4 6 7 6 2 9 9 0 23 0 23 23 8 15 0.77
Garo Hils, Netrokona
BS-1 96 2 2 86 2 12 98 2 0 100 0 0 0 0 0 0 0 0 1.00
BS-4 61 5 34 52 5 43 90 1 9 20 80 0 30 0 70 30 25 45 0.05
BS-6 98 1 1 82 1 17 98 2 0 93 7 0 0 0 0 0 0 0 1.00
BS-7 97 1 2 91 1 8 99 1 0 96 4 0 0 0 0 0 0 0 1.00
MEAN 88 2 10 76 3 21 96 2 2 72 28 0 30 0 70 30 25 45 0.76
STDEV 16 2 15 15 3 13 3 1 4 36 36 0 0 0 0 0 0 0 0.95
Northwest Stable Platform
NWD-2 88 6 6 45 3 52 80 18 2 66 34 0 39 0 61 45 25 30 0.89
NWD-3 85 6 9 40 4 56 86 13 1 70 30 0 48 0 52 48 19 33 0.95
NWR-1 85 9 6 47 5 48 85 11 4 69 31 0 53 0 47 53 13 34 0.73
NWR-2 93 3 4 46 3 51 77 5 18 74 26 0 43 0 57 43 26 31 0.23
MEAN 87 6 7 44 4 52 81 12 7 70 30 0 47 0 53 48 19 33 0.70
STDEV 3 2 2 3 1 4 4 6 8 3 3 0 5 0 5 4 6 2 0.52

38
Sylhet Trough
SS-2 69 7 24 49 7 44 87 5 8 50 50 0 57 0 43 57 12 31 0.73
SS-4 69 9 22 49 10 41 86 8 6 50 50 0 57 0 43 57 14 29 0.83
SS-6 67 11 22 47 11 42 83 11 6 38 62 0 57 0 43 44 27 29 1.00
SS-7 63 11 26 44 11 45 80 11 9 38 62 0 26 0 74 26 27 47 1.00
SS-8 63 9 28 44 8 48 80 9 11 38 62 0 26 0 74 26 25 49 0.98
SS-9 65 7 28 45 7 48 84 5 11 50 50 0 26 0 74 39 12 49 0.73
MEAN 66 9 25 46 9 45 83 9 8 44 56 0 42 0 58 42 20 39 0.97
STDEV 3 5 3 2 2 3 3 3 3 6 6 0 15 0 15 15 7 10 0.63
Lalmai hills, Comilla
CCS-1 58 5 37 37 5 58 88 6 6 35 65 0 33 0 67 33 32 35 0.47
CCS-3g 63 7 30 32 6 62 85 6 9 45 55 0 41 0 59 41 25 34 0.38
CCS-4 61 8 31 44 8 48 85 9 6 34 66 0 46 0 54 46 26 28 0.61
Cglau-S 66 4 30 54 4 42 93 3 4 30 70 0 23 0 77 23 25 52 0.47
CCHS-2 66 6 28 48 6 46 88 9 3 39 61 0 52 0 48 52 18 30 0.73
CSSal-1 66 7 27 43 7 50 86 10 4 47 53 0 45 0 55 45 17 38 0.73
CLSal-1 67 8 25 49 8 43 87 7 6 41 59 0 23 0 77 23 19 58 0.56
CWSal-0 59 6 35 46 6 48 88 7 5 27 73 0 22 0 78 22 32 46 0.60
CWSal-2 62 8 30 38 8 54 83 11 6 44 56 0 44 0 56 43 19 38 0.65
CWSal-4 68 9 23 47 9 44 84 7 9 47 53 0 49 0 51 49 23 28 0.41
MEAN 64 6 30 43 7 50 87 8 5 39 61 0 38 0 62 39 22 39 0.56
STDEV 4 1 4 6 1 7 3 2 2 7 7 0 12 0 12 12 6 10 0.32
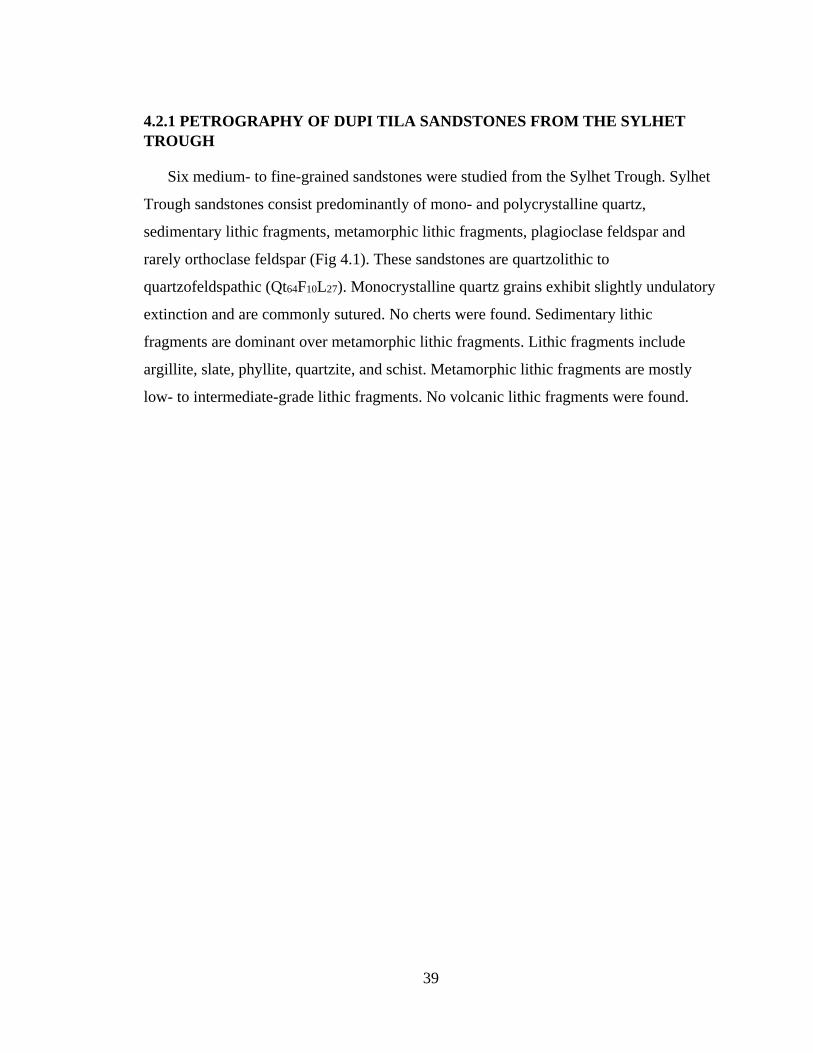
39
4.2.1 PETROGRAPHY OF DUPI TILA SANDSTONES FROM THE SYLHET
TROUGH
Six medium- to fine-grained sandstones were studied from the Sylhet Trough. Sylhet
Trough sandstones consist predominantly of mono- and polycrystalline quartz,
sedimentary lithic fragments, metamorphic lithic fragments, plagioclase feldspar and
rarely orthoclase feldspar (Fig 4.1). These sandstones are quartzolithic to
quartzofeldspathic (Qt64F10L27). Monocrystalline quartz grains exhibit slightly undulatory
extinction and are commonly sutured. No cherts were found. Sedimentary lithic
fragments are dominant over metamorphic lithic fragments. Lithic fragments include
argillite, slate, phyllite, quartzite, and schist. Metamorphic lithic fragments are mostly
low- to intermediate-grade lithic fragments. No volcanic lithic fragments were found.

40
Fig. 4.1 Representative photomicrographs of sandstone of Dupi Tila Formation from the
Sylhet Trough, Bengal basin showing (A) mono- (Qm) and polycrystalline quartz (Qp),
sedimentary (Ls) and metamorphic lithic (Lm) grains (sample SS-2, 4X, crossed polar),
(B) mono- (Qm) and polycrystalline quartz (Qp), feldspars (plag), sedimentary (Ls), and
metamorphic lithic (Lm) fragments (sample SS-9, 4X, crossed polar).
A
B
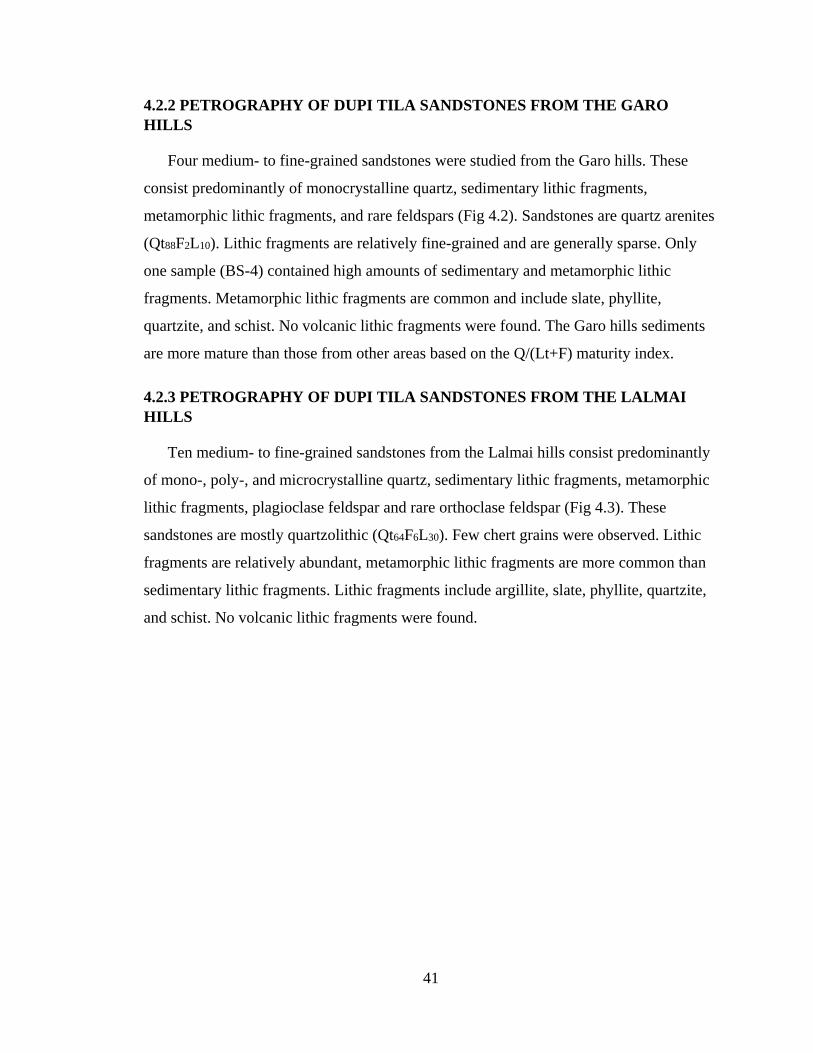
41
4.2.2 PETROGRAPHY OF DUPI TILA SANDSTONES FROM THE GARO
HILLS
Four medium- to fine-grained sandstones were studied from the Garo hills. These
consist predominantly of monocrystalline quartz, sedimentary lithic fragments,
metamorphic lithic fragments, and rare feldspars (Fig 4.2). Sandstones are quartz arenites
(Qt88F2L10). Lithic fragments are relatively fine-grained and are generally sparse. Only
one sample (BS-4) contained high amounts of sedimentary and metamorphic lithic
fragments. Metamorphic lithic fragments are common and include slate, phyllite,
quartzite, and schist. No volcanic lithic fragments were found. The Garo hills sediments
are more mature than those from other areas based on the Q/(Lt+F) maturity index.
4.2.3 PETROGRAPHY OF DUPI TILA SANDSTONES FROM THE LALMAI
HILLS
Ten medium- to fine-grained sandstones from the Lalmai hills consist predominantly
of mono-, poly-, and microcrystalline quartz, sedimentary lithic fragments, metamorphic
lithic fragments, plagioclase feldspar and rare orthoclase feldspar (Fig 4.3). These
sandstones are mostly quartzolithic (Qt64F6L30). Few chert grains were observed. Lithic
fragments are relatively abundant, metamorphic lithic fragments are more common than
sedimentary lithic fragments. Lithic fragments include argillite, slate, phyllite, quartzite,
and schist. No volcanic lithic fragments were found.

42
Fig. 4.2 Representative photomicrographs of sandstone of Dupi Tila Formation from the
Garo hills, Bengal basin showing (A) mono- (Qm) and polycrystalline quartz (Qp), and
metamorphic lithic (Lm) grains (sample BS-4, 4X, crossed polar), (B) monocrystalline
(Qm) quartz, and polycrystalline quartz (Qp) (sample BS-7, 4X, crossed polar).
A
B

43
Fig. 4.3 Representative photomicrographs of sandstone of Dupi Tila Formation from the
Lalmai hills, Bengal basin showing (A) mono- (Qm)and polycrystalline quartz (Qp),
plagioclase feldspars (plag.), sedimentary (Ls) and metamorphic lithic (Lm) grains
(sample CCHS-2, 4X, crossed polar), (B) mono- (Qm) and polycrystalline quartz (Qp),
plagioclase feldspar (plag.), sedimentary (Ls), and metamorphic lithic fragments (Lm)
(sample CWSal-4, 4X, crossed polar).
A
B
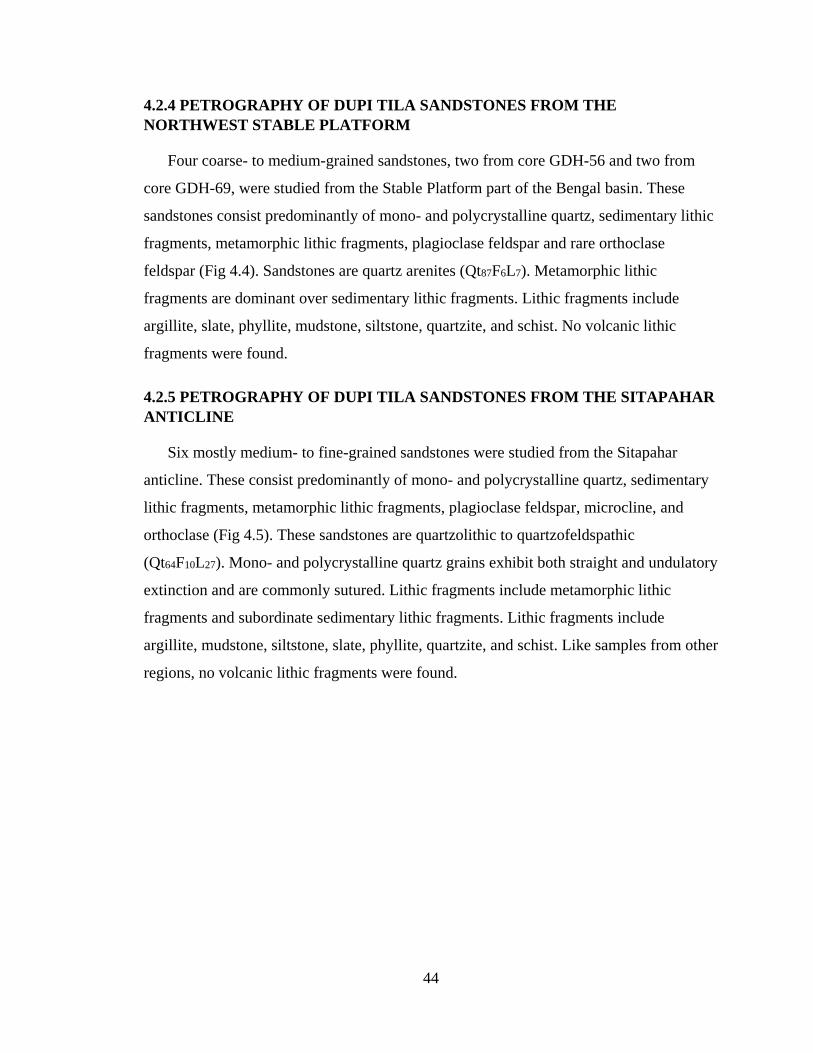
44
4.2.4 PETROGRAPHY OF DUPI TILA SANDSTONES FROM THE
NORTHWEST STABLE PLATFORM
Four coarse- to medium-grained sandstones, two from core GDH-56 and two from
core GDH-69, were studied from the Stable Platform part of the Bengal basin. These
sandstones consist predominantly of mono- and polycrystalline quartz, sedimentary lithic
fragments, metamorphic lithic fragments, plagioclase feldspar and rare orthoclase
feldspar (Fig 4.4). Sandstones are quartz arenites (Qt87F6L7). Metamorphic lithic
fragments are dominant over sedimentary lithic fragments. Lithic fragments include
argillite, slate, phyllite, mudstone, siltstone, quartzite, and schist. No volcanic lithic
fragments were found.
4.2.5 PETROGRAPHY OF DUPI TILA SANDSTONES FROM THE SITAPAHAR
ANTICLINE
Six mostly medium- to fine-grained sandstones were studied from the Sitapahar
anticline. These consist predominantly of mono- and polycrystalline quartz, sedimentary
lithic fragments, metamorphic lithic fragments, plagioclase feldspar, microcline, and
orthoclase (Fig 4.5). These sandstones are quartzolithic to quartzofeldspathic
(Qt64F10L27). Mono- and polycrystalline quartz grains exhibit both straight and undulatory
extinction and are commonly sutured. Lithic fragments include metamorphic lithic
fragments and subordinate sedimentary lithic fragments. Lithic fragments include
argillite, mudstone, siltstone, slate, phyllite, quartzite, and schist. Like samples from other
regions, no volcanic lithic fragments were found.

45
Fig. 4.4 Representative photomicrographs of sandstone of Dupi Tila Formation from the
northwest Stable Platform, Bengal basin showing (A) mono- (Qm) and polycrystalline
quartz (Qp), plagioclase feldspars (plag.), and metamorphic lithic (Lm) fragments
(sample NWD-2, GDH- 56, 4X, crossed polar), (B) mono- (Qm) and polycrystalline
quartz (Qp), sedimentary (Ls), and metamorphic lithic fragments (Lm) (sample NWR-1,
GDH-69, 4X, crossed polar).
A
B
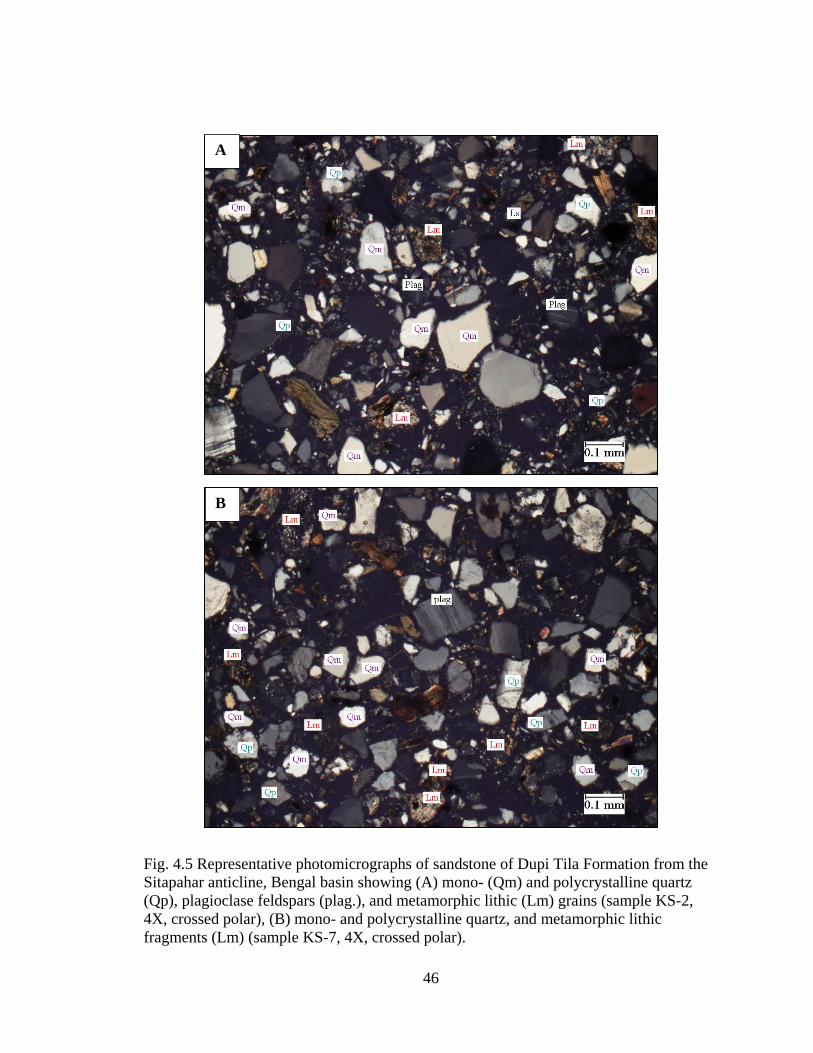
46
Fig. 4.5 Representative photomicrographs of sandstone of Dupi Tila Formation from the
Sitapahar anticline, Bengal basin showing (A) mono- (Qm) and polycrystalline quartz
(Qp), plagioclase feldspars (plag.), and metamorphic lithic (Lm) grains (sample KS-2,
4X, crossed polar), (B) mono- and polycrystalline quartz, and metamorphic lithic
fragments (Lm) (sample KS-7, 4X, crossed polar).
A
B

47
4.3 SANDSTONE MODES
The relative abundance of major framework grain types in samples from each of the
five localities is shown in figure 4.6. The Dupi Tila Formation contain high percentages
of monocrystalline quartz in all localities, but particularly in the Garo hills samples.
Polycrystalline quartz is most abundant in the Stable Platform area. Lithic fragments are
abundant in Lalmai hills, Sylhet Trough, and Sitapahar anticline regions. This plot
suggests that modal percentages of lithic fragments decrease from the northeast to
northwest whereas modal polycrystalline quartz decreases from the northwest to
northeast part of the basin. Modal feldspar contents are consistently low throughout the
basin.
Fig. 4.6 Variation of modal sandstone composition of Dupi Tila Formation from various
regions of the Bengal basin, Bangladesh (NW- Northwest, NC- North-central, NE-
Northeast, SC- South-central, and SE- Southeast) .
4.4 PETROFACIES EVOLUTION
Ternary diagrams were prepared reflecting the petrofacies evolution using modal
analyses of Dupi Tila Formation from various regions of the Bengal basin, Bangladesh.
Tectonic discrimination plots from Dickinson (1985), were prepared based on the modal
compositional analysis of sandstone framework grains. The QtFL (Fig. 4.7) plot shows
0%
10%
20%
30%
40%
50%
60%
70%
80%
90%
100%
Stable Platform Garo Hills Sylhet Trough Lalmai Hills Sitapahar Anticline
Monocrystalline Quartz (Qm) Polycrystalline Quartz (Qp) Feldspars (F) Lithic fragments (L)
NW NC NE SC SE
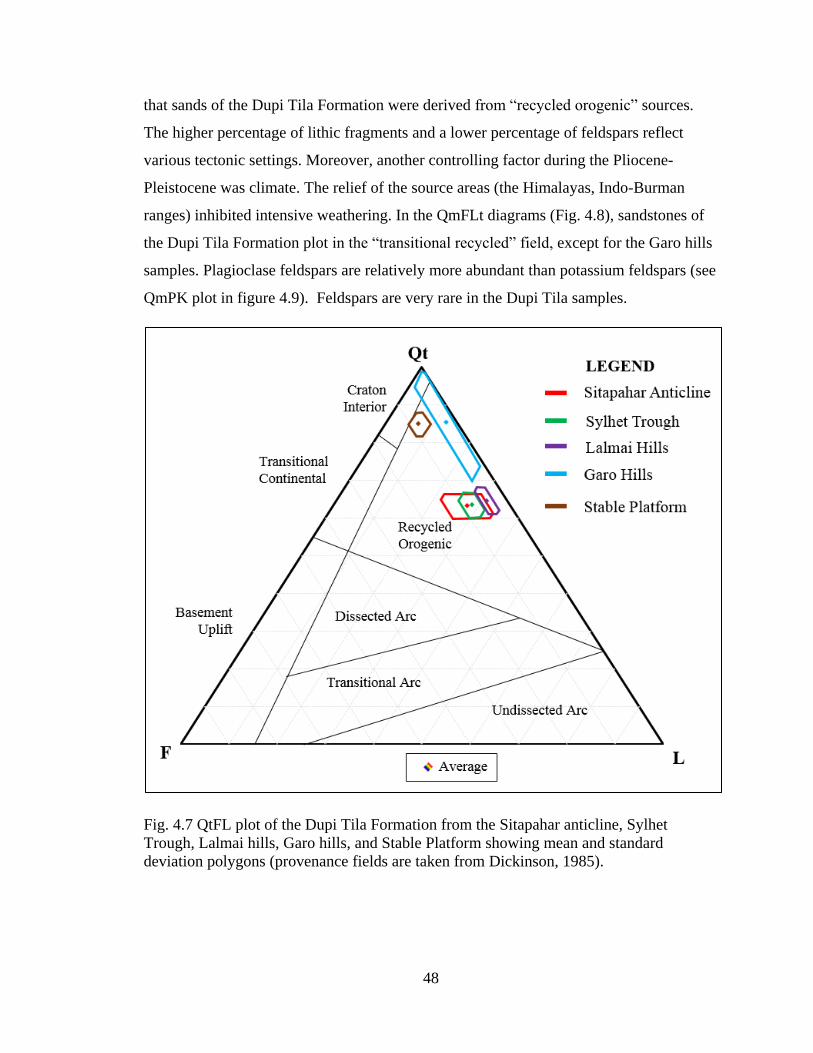
48
that sands of the Dupi Tila Formation were derived from “recycled orogenic” sources.
The higher percentage of lithic fragments and a lower percentage of feldspars reflect
various tectonic settings. Moreover, another controlling factor during the Pliocene-
Pleistocene was climate. The relief of the source areas (the Himalayas, Indo-Burman
ranges) inhibited intensive weathering. In the QmFLt diagrams (Fig. 4.8), sandstones of
the Dupi Tila Formation plot in the “transitional recycled” field, except for the Garo hills
samples. Plagioclase feldspars are relatively more abundant than potassium feldspars (see
QmPK plot in figure 4.9). Feldspars are very rare in the Dupi Tila samples.
Fig. 4.7 QtFL plot of the Dupi Tila Formation from the Sitapahar anticline, Sylhet
Trough, Lalmai hills, Garo hills, and Stable Platform showing mean and standard
deviation polygons (provenance fields are taken from Dickinson, 1985).

49
Fig. 4.8 QmFLt plot of the Dupi Tila Formation from the Sitapahar anticline, Sylhet
Trough, Lalmai hills, Garo hills, and Stable Platform showing mean and standard
deviation polygons (provenance fields are taken from Dickinson, 1985).
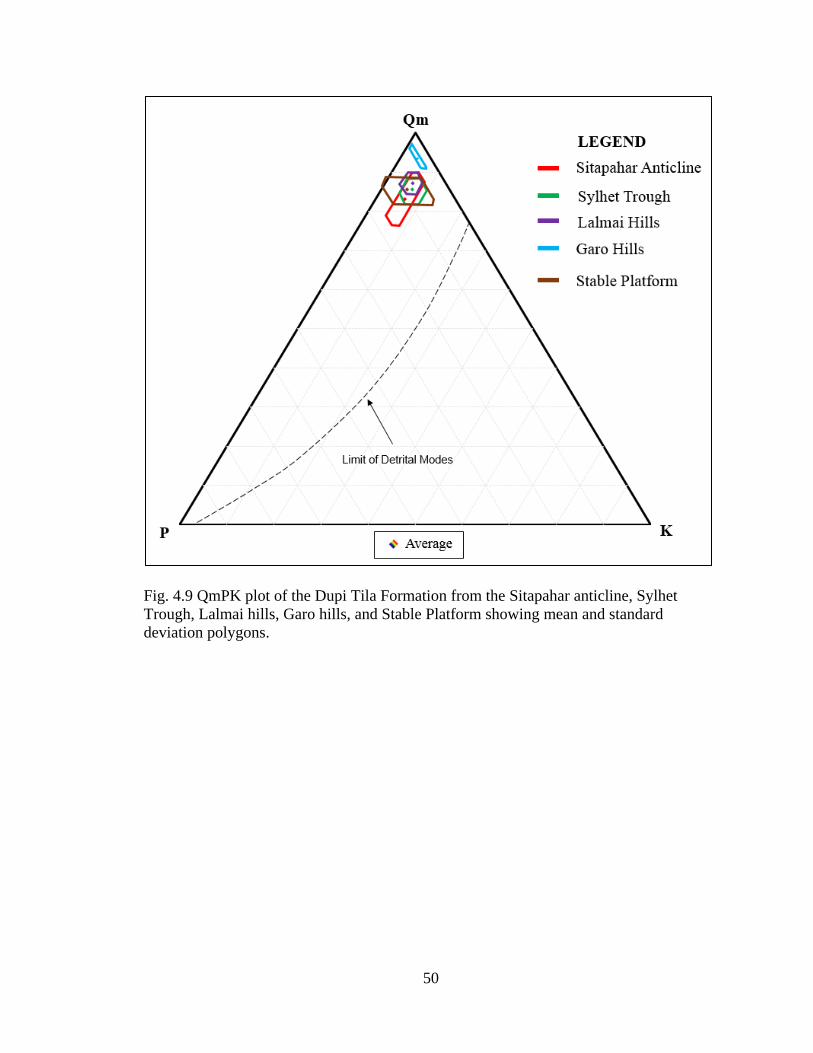
50
Fig. 4.9 QmPK plot of the Dupi Tila Formation from the Sitapahar anticline, Sylhet
Trough, Lalmai hills, Garo hills, and Stable Platform showing mean and standard
deviation polygons.
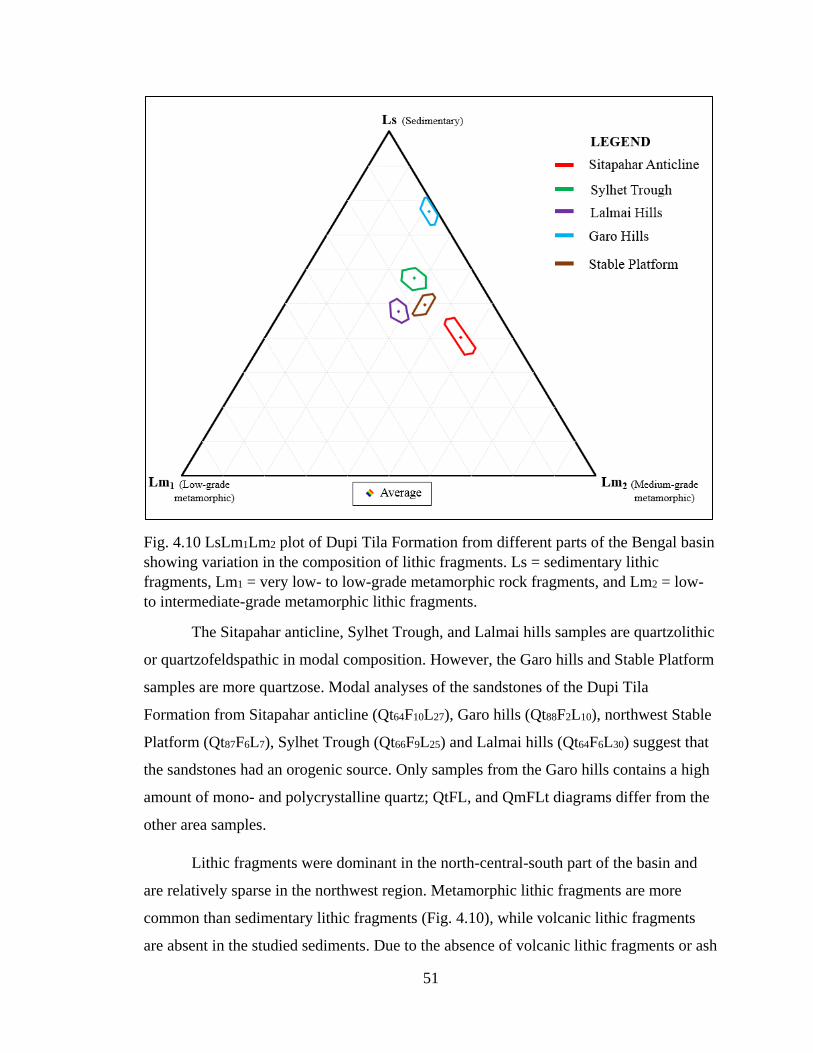
51
Fig. 4.10 LsLm1Lm2 plot of Dupi Tila Formation from different parts of the Bengal basin
showing variation in the composition of lithic fragments. Ls = sedimentary lithic
fragments, Lm1 = very low- to low-grade metamorphic rock fragments, and Lm2 = low-
to intermediate-grade metamorphic lithic fragments.
The Sitapahar anticline, Sylhet Trough, and Lalmai hills samples are quartzolithic
or quartzofeldspathic in modal composition. However, the Garo hills and Stable Platform
samples are more quartzose. Modal analyses of the sandstones of the Dupi Tila
Formation from Sitapahar anticline (Qt64F10L27), Garo hills (Qt88F2L10), northwest Stable
Platform (Qt87F6L7), Sylhet Trough (Qt66F9L25) and Lalmai hills (Qt64F6L30) suggest that
the sandstones had an orogenic source. Only samples from the Garo hills contains a high
amount of mono- and polycrystalline quartz; QtFL, and QmFLt diagrams differ from the
other area samples.
Lithic fragments were dominant in the north-central-south part of the basin and
are relatively sparse in the northwest region. Metamorphic lithic fragments are more
common than sedimentary lithic fragments (Fig. 4.10), while volcanic lithic fragments
are absent in the studied sediments. Due to the absence of volcanic lithic fragments or ash

52
beds in the Dupi Tila Formation, it can be concluded that the Rajmahap traps did not
contribute significantly to the Bengal basin. A high number of low- to intermediate-grade
metamorphic lithic fragments, dominated by slate and phyllite, occur throughout the Dupi
Tila Formation. The abundance of low- to intermediate-grade lithic fragments (Lm2) in
all samples suggest unroofing of deep crustal levels of orogens.
Very few microcline and untwined orthoclase feldspars were found in the Sylhet
Trough and Sitapahar anticline samples. Ratios of plagioclase feldspar to total feldspar
are shown in the box plot (Fig 4.11). Sylhet Trough samples have the highest feldspar
contents. Plagioclase feldspars are relatively more adundant than potassium feldspars in
all regions.
Fig. 4.11 Ratios of plagioclase feldspar to total feldspar (P/F) in the Dupi Tila sandstones
from various regions of the Bengal basin, showing distribution of feldspar ratios for each
area samples (NW- Northwest, NC- North-central, NE- Northeast, SC- South-central, and
SE- Southeast).
Due to the uplift of the Himalayas followed by erosion, voluminous siliciclastic
sediments were funneled into the Bengal basin. The Indo-Burman ranges to the east also
contributed detritus to the Bengal basin (Uddin and Lundberg, 1988a). Sediment
compositions from the Bengal basin from Oligocene to Pliocene-Pleistocene show a
temporal increase in higher-grade metamorphic lithic fragments derived from the orogens
0.0
0.5
1.0
1.5
2.0
2.5
3.0
3.5
4.0
4.5
Stable Platform Garo Hills Sylhet Trough Lalmai Hills Sitapahar Anticline
NC NE SC SE NW

53
(Uddin and Lundberg, 1998b). The Dupi Tila Formation has significant amounts of
untwinned potassium feldspars (Uddin et al., 1998b) compared to the plagioclase-rich
Miocene sandstones of the Surma Group. This suggests a plutonic source for Dupi Tila
Formation, and/or an increase in mechanical weathering relative to chemical weathering
in the source areas during the Pliocene-Pleistocene (Mack, 1978). Miocene leucogranites
of the High Himalayan Crystalline terrane (France-Lanord et al., 1993) may be a
principal source of these feldspars (Harrison et al., 1997; and many others).
Based on the Basu et al., 1975 diamond diagram, the Dupi Tila Formation sourced
from low, middle and upper rank metamorphic rocks. Most quartz grains exhibit
undulatory extinction. In the Stable Platform region, most samples fall into middle and
upper-rank metamorphic rock fields (Fig. 4.12).
Based on the immature subangular to angular grain shapes and compositional
analyses, a proximal source is suggested. The Pliocene-Pleistocene Dupi Tila Formation
is most likely derived from the Himalayas and the Indo-Burman ranges.
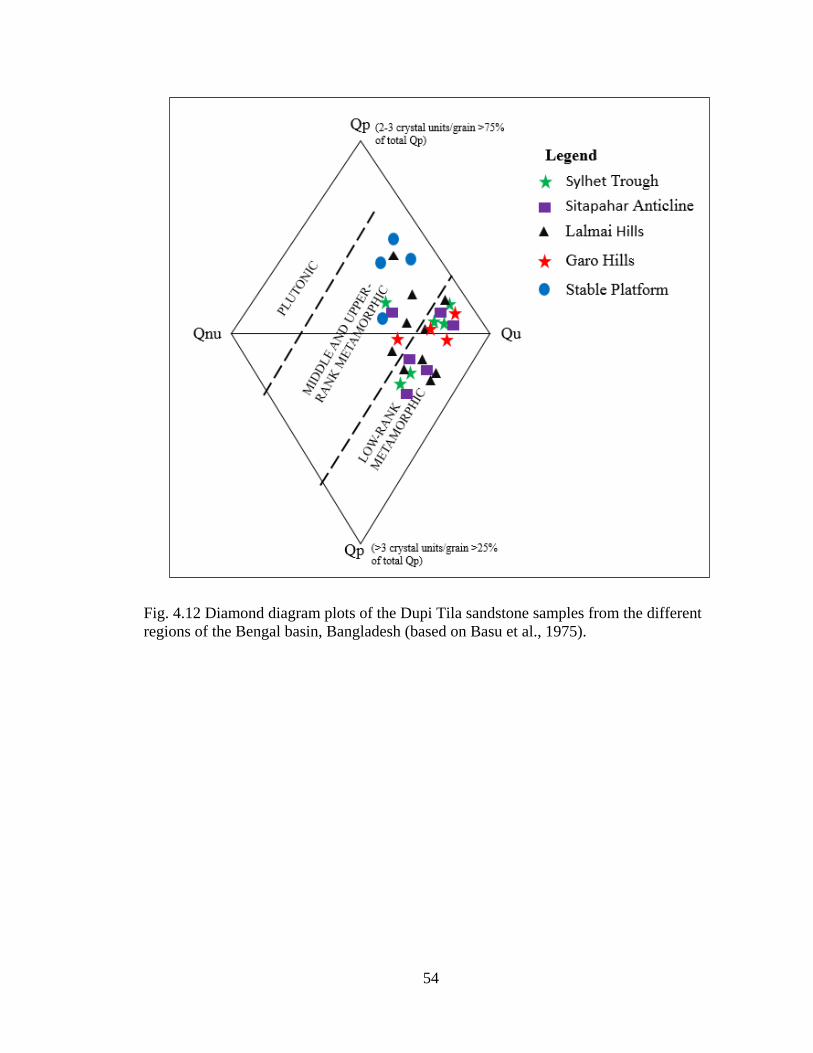
54
Fig. 4.12 Diamond diagram plots of the Dupi Tila sandstone samples from the different
regions of the Bengal basin, Bangladesh (based on Basu et al., 1975).

55
Chapter 5: HEAVY MINERAL ANALYSIS
5.1 INTRODUCTION
This study reports semi-quantitative analyses of heavy minerals, i.e., those having a
specific gravity of 2.9 or higher (Morton, 1985; Tucker, 1988). Although heavy-mineral
assemblages are greatly controlled by provenance, they are also influenced by other
extrabasinal and intrabasinal factors such as weathering, transport, deposition, and
diagenesis (Morton and Hallsworth, 1999). Many heavy minerals are indicative of
particular source rocks and, thus, are commonly used in foreland-basin studies (Najman
et al., 2008; Garzanti et al., 2007; Uddin et al., 2007). Because they are generally resistant
enough to endure transport, heavy minerals are generally sensitive indicators of the
nature of provenance. Over thirty common translucent detrital mineral species can be
used as provenance indicators (Mange and Maurer, 1992; Morton and Hallsworth, 1999).
Heavy mineral analysis has been used widely in provenance studies of siliciclastic
rocks. Studies of sediment composition can help constrain source-rock lithology.
Common minerals (like quartz and feldspars) that constitute the bulk sediment
composition are contributed by a variety of rocks. However, many heavy minerals are
restricted to specific source rocks. Thus, heavy mineral suites can provide clues to
decipher provenance lithology (Mandal, 2009; Chowdhury, 2014). Different sources
within the same tectonic setting even can be distinguished by heavy mineral analyses
(Morton, 1985; Najman and Garzanti, 2000; Garzanti et al., 2007).
Among the large variety of heavy mineral species found in sandstones, approximately
thirty are used in source-rock identification (Morton, 1985; Mange and Maurer, 1992).
Heavy mineral assemblages are generally resistant enough to endure transport (Morton
and Hallsworth, 1999; Uddin et al., 2007). Several sedimentary processes such as
weathering of source rock, mechanical breakdown, and hydraulics during transportation,
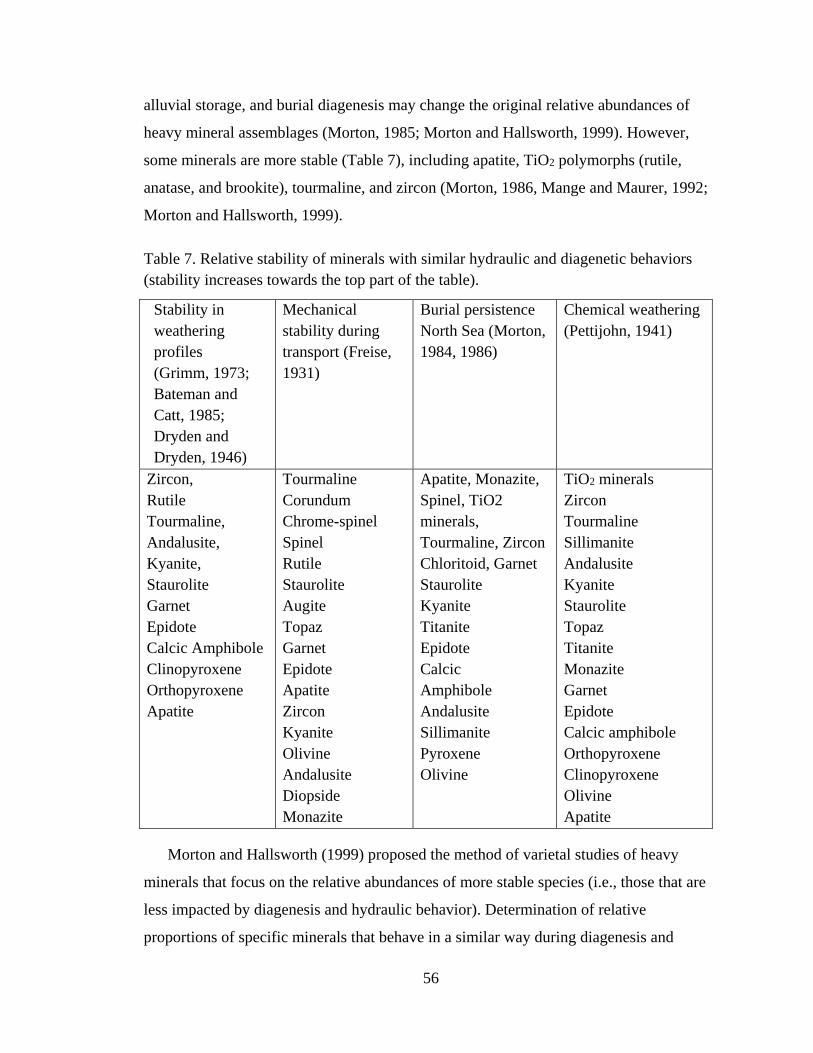
56
alluvial storage, and burial diagenesis may change the original relative abundances of
heavy mineral assemblages (Morton, 1985; Morton and Hallsworth, 1999). However,
some minerals are more stable (Table 7), including apatite, TiO2 polymorphs (rutile,
anatase, and brookite), tourmaline, and zircon (Morton, 1986, Mange and Maurer, 1992;
Morton and Hallsworth, 1999).
Table 7. Relative stability of minerals with similar hydraulic and diagenetic behaviors
(stability increases towards the top part of the table).
Stability in
weathering
profiles
(Grimm, 1973;
Bateman and
Catt, 1985;
Dryden and
Dryden, 1946)
Mechanical
stability during
transport (Freise,
1931)
Burial persistence
North Sea (Morton,
1984, 1986)
Chemical weathering
(Pettijohn, 1941)
Zircon,
Rutile
Tourmaline,
Andalusite,
Kyanite,
Staurolite
Garnet
Epidote
Calcic Amphibole
Clinopyroxene
Orthopyroxene
Apatite
Tourmaline
Corundum
Chrome-spinel
Spinel
Rutile
Staurolite
Augite
Topaz
Garnet
Epidote
Apatite
Zircon
Kyanite
Olivine
Andalusite
Diopside
Monazite
Apatite, Monazite,
Spinel, TiO2
minerals,
Tourmaline, Zircon
Chloritoid, Garnet
Staurolite
Kyanite
Titanite
Epidote
Calcic
Amphibole
Andalusite
Sillimanite
Pyroxene
Olivine
TiO2 minerals
Zircon
Tourmaline
Sillimanite
Andalusite
Kyanite
Staurolite
Topaz
Titanite
Monazite
Garnet
Epidote
Calcic amphibole
Orthopyroxene
Clinopyroxene
Olivine
Apatite
Morton and Hallsworth (1999) proposed the method of varietal studies of heavy
minerals that focus on the relative abundances of more stable species (i.e., those that are
less impacted by diagenesis and hydraulic behavior). Determination of relative
proportions of specific minerals that behave in a similar way during diagenesis and

57
transportation can be very useful (Morton and Hallsworth, 1999). Several mineral ratios
and indices have been proposed by Morton and Hallsworth (1999). These include ATi
(apatite and tourmaline index), GZi (garnet and zircon index), CZi (chrome spinel and
zircon index), MZi (monazite, zircon index), and RZi (TiO2 group and zircon ratio).
However, these methods are not applicable if the rock unit does not contain abundant
heavy minerals. In the absence of full suites of heavy minerals, analyses can be
accomplished by determining the relative abundance of all important heavy mineral
species preserved in each stratigraphic unit, recognizing dominant members of mineral
groups, and establishing index minerals from different stratigraphic levels (Peavy, 2008;
Rahman, 2008; Alam, 2011; and Chowdhury, 2014)).
Semi-quantitative analyses of heavy mineral assemblages in the representative Dupi
Tila sandstones from various regions from the Bengal basin were performed in order to
assess source-rock types and to help reconstruct paleogeography of the northeastern
Himalayas.
5.2 RESULTS
Semi-quantitative point-counting results for heavy minerals in the Dupi Tila
sandstones from the different part of the Bengal basin are presented in Table 8. Total
heavy mineral contents vary from 0.02 to 1.4% (average = 0.08%). Samples from the
Sitapahar anticline (KS samples) and Sylhet Trough (SS samples) have higher heavy
mineral contents than samples from other parts of the Bengal basin. Percentage and
average frequency of distribution of heavy minerals are plotted on bar diagrams in figures
5.1-5.2. The opacity of the samples decreases with decreasing magnetic susceptibility for
all samples (Table 4). Opaque minerals recognized in the present study are mostly oxides
and hydroxides of iron (e.g., magnetite, pyrrhotite, hematite, limonite and
ilmenite). Similar varieties of opaque minerals were also observed in the Dupi Tila
sediments, but they are relatively sparse. Percentages of opaque mineral assemblages in
the Garo hills section are notably higher than those for other samples from the basin.
Highly stable minerals (e.g., zircon, tourmaline, and rutile) are significantly more
abundant in the Lalmai hills. The order of dominance of heavy minerals in the Dupi Tila

58
Formation, from high to low is- opaque minerals, garnets, sillimanite, tourmaline,
kyanite, andalusite, epidote group, chlorite & chloritoid, and staurolite.
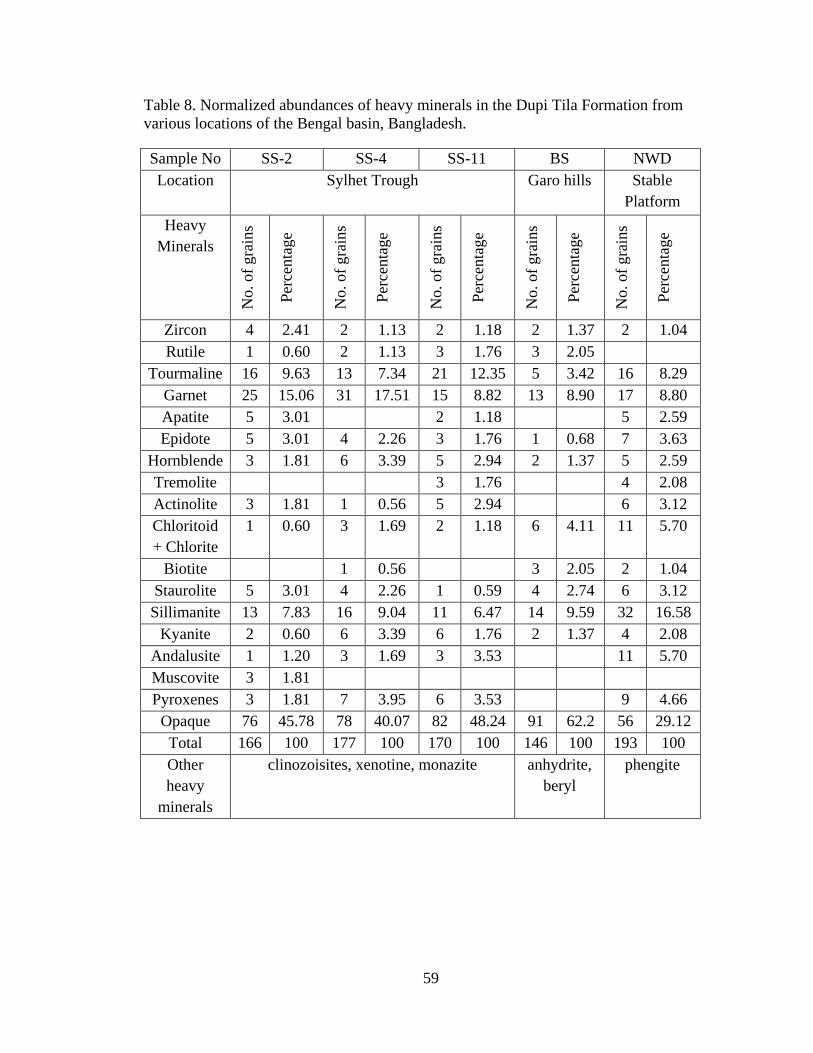
59
Table 8. Normalized abundances of heavy minerals in the Dupi Tila Formation from
various locations of the Bengal basin, Bangladesh.
Sample No SS-2 SS-4 SS-11 BS NWD
Location Sylhet Trough Garo hills Stable
Platform
Heavy
Minerals N
o. of
gra
ins
Per
centa
ge
No. of
gra
ins
Per
centa
ge
No. of
gra
ins
Per
centa
ge
No. of
gra
ins
Per
centa
ge
No. of
gra
ins
Per
centa
ge
Zircon 4 2.41 2 1.13 2 1.18 2 1.37 2 1.04
Rutile 1 0.60 2 1.13 3 1.76 3 2.05
Tourmaline 16 9.63 13 7.34 21 12.35 5 3.42 16 8.29
Garnet 25 15.06 31 17.51 15 8.82 13 8.90 17 8.80
Apatite 5 3.01 2 1.18 5 2.59
Epidote 5 3.01 4 2.26 3 1.76 1 0.68 7 3.63
Hornblende 3 1.81 6 3.39 5 2.94 2 1.37 5 2.59
Tremolite 3 1.76 4 2.08
Actinolite 3 1.81 1 0.56 5 2.94 6 3.12
Chloritoid
+ Chlorite
1 0.60 3 1.69 2 1.18 6 4.11 11 5.70
Biotite 1 0.56 3 2.05 2 1.04
Staurolite 5 3.01 4 2.26 1 0.59 4 2.74 6 3.12
Sillimanite 13 7.83 16 9.04 11 6.47 14 9.59 32 16.58
Kyanite 2 0.60 6 3.39 6 1.76 2 1.37 4 2.08
Andalusite 1 1.20 3 1.69 3 3.53 11 5.70
Muscovite 3 1.81
Pyroxenes 3 1.81 7 3.95 6 3.53 9 4.66
Opaque 76 45.78 78 40.07 82 48.24 91 62.2 56 29.12
Total 166 100 177 100 170 100 146 100 193 100
Other
heavy
minerals
clinozoisites, xenotine, monazite anhydrite,
beryl
phengite

60
Table 8. (Cont.) Normalized abundances of heavy minerals in the Dupi Tila Formation
from various locations of the Bengal basin, Bangladesh.
Sample No KS-2 KS-4 CCS CWSalLDT NWR
Location Sitapahar anticline Lalmai hills Stable
platform
Heavy
Minerals N
o. of
gra
ins
Per
centa
ge
No. of
gra
ins
Per
centa
ge
No. of
gra
ins
Per
centa
ge
No. of
gra
ins
Per
centa
ge
No. of
gra
ins
Per
centa
ge
Zircon 4 1.44 4 1.82 6 2.74 4 1.89 2 1.06
Rutile 6 2.17 2 0.91 8 3.65 11 5.19 6 3.17
Tourmaline 10 3.61 12 5.45 14 6.39 14 6.60 6 3.17
Garnet 32 11.55 18 8.18 21 9.59 17 8.02 26 13.7
6
Apatite 4 1.44 2 0.91 3 1.42 4 2.12
Epidote 12 4.33 14 6.36 6 2.74 4 1.89 6 3.17
Hornblende 12 4.33 7 3.18 4 1.83 7 3.30 1 0.53
Tremolite 6 2.17 6 2.73 2 0.91 4 1.89
Actinolite 8 2.89 2 0.91 3 1.37 6 2.83 3 1.59
Chloritoid
+ Chlorite
15 5.42 16 7.27 6 2.74 2 0.94 9 4.76
Biotite 2 0.91 4 1.83 1 0.47
Staurolite 18 6.50 7 3.18 6 2.74 2 0.94 6 3.17
Sillimanite 8 2.89 14 6.36 26 11.87 35 16.51 27 14.2
9
Kyanite 14 2.17 16 1.82 7 3.20 14 6.60 12 6.35
Andalusite 6 5.05 4 7.27 11 5.02 4 1.89 8 4.23
Muscovite 3 1.59
Pyroxenes 25 9.03 18 8.18 13 5.92 17 8.02 8 4.23
Opaque 97 35.02 78 35.45 80 36.53 67 31.60 62 32.8
0
Total 277 100 220 100 219 100 212 100 189 100
Other
heavy
minerals
fluorite, beryl,
clinozoisites
beryl, xenotine, margarite,
leucoxene
phengite
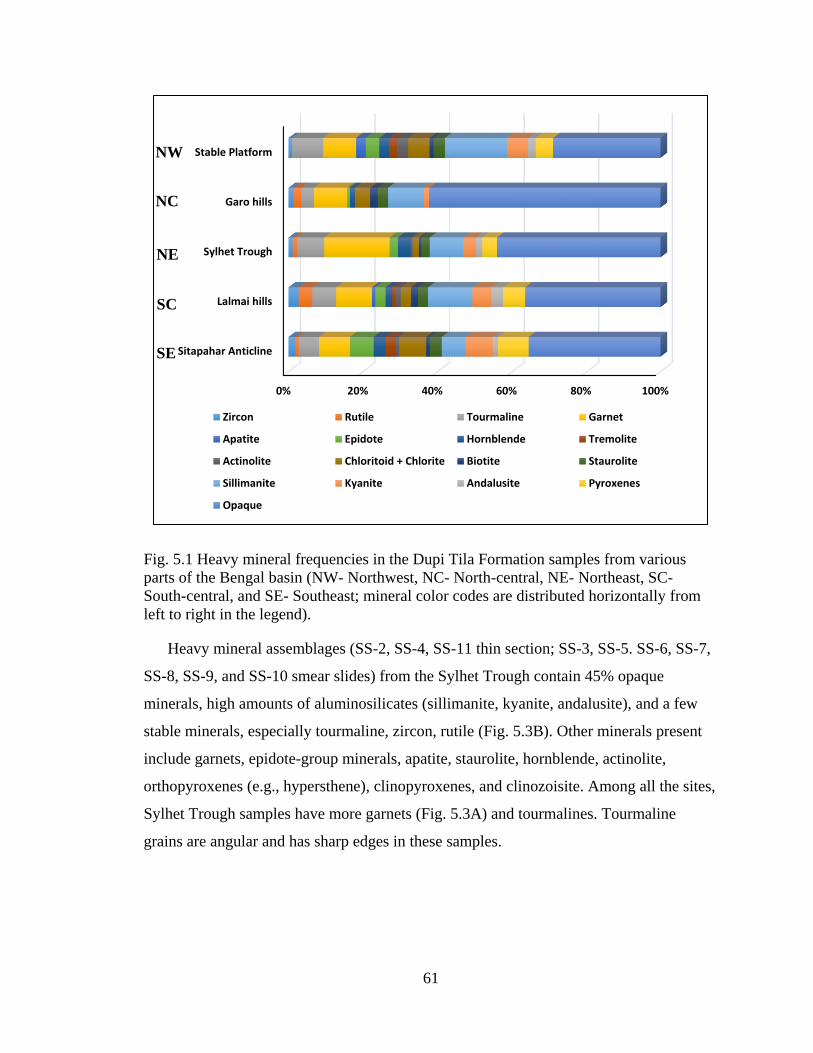
61
Fig. 5.1 Heavy mineral frequencies in the Dupi Tila Formation samples from various
parts of the Bengal basin (NW- Northwest, NC- North-central, NE- Northeast, SC-
South-central, and SE- Southeast; mineral color codes are distributed horizontally from
left to right in the legend).
Heavy mineral assemblages (SS-2, SS-4, SS-11 thin section; SS-3, SS-5. SS-6, SS-7,
SS-8, SS-9, and SS-10 smear slides) from the Sylhet Trough contain 45% opaque
minerals, high amounts of aluminosilicates (sillimanite, kyanite, andalusite), and a few
stable minerals, especially tourmaline, zircon, rutile (Fig. 5.3B). Other minerals present
include garnets, epidote-group minerals, apatite, staurolite, hornblende, actinolite,
orthopyroxenes (e.g., hypersthene), clinopyroxenes, and clinozoisite. Among all the sites,
Sylhet Trough samples have more garnets (Fig. 5.3A) and tourmalines. Tourmaline
grains are angular and has sharp edges in these samples.
0% 20% 40% 60% 80% 100%
Sitapahar Anticline
Lalmai hills
Sylhet Trough
Garo hills
Stable Platform
Zircon Rutile Tourmaline Garnet
Apatite Epidote Hornblende Tremolite
Actinolite Chloritoid + Chlorite Biotite Staurolite
Sillimanite Kyanite Andalusite Pyroxenes
Opaque
NW
NC
SC
NE
SE
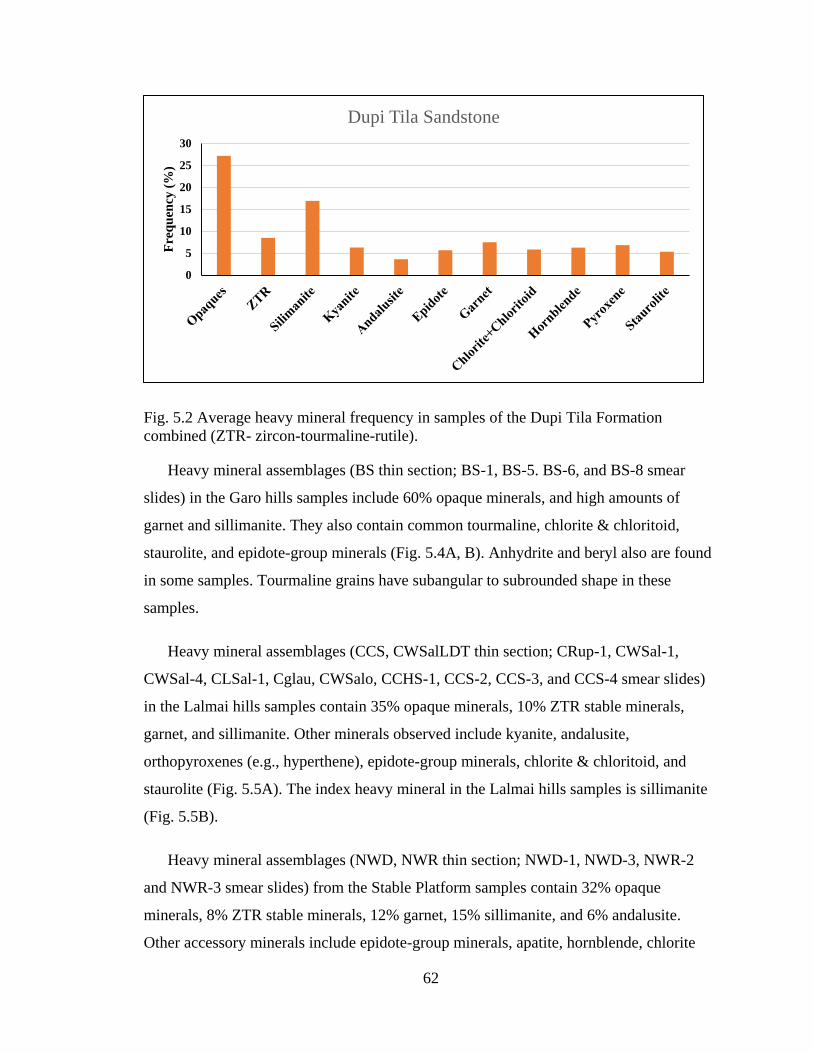
62
Fig. 5.2 Average heavy mineral frequency in samples of the Dupi Tila Formation
combined (ZTR- zircon-tourmaline-rutile).
Heavy mineral assemblages (BS thin section; BS-1, BS-5. BS-6, and BS-8 smear
slides) in the Garo hills samples include 60% opaque minerals, and high amounts of
garnet and sillimanite. They also contain common tourmaline, chlorite & chloritoid,
staurolite, and epidote-group minerals (Fig. 5.4A, B). Anhydrite and beryl also are found
in some samples. Tourmaline grains have subangular to subrounded shape in these
samples.
Heavy mineral assemblages (CCS, CWSalLDT thin section; CRup-1, CWSal-1,
CWSal-4, CLSal-1, Cglau, CWSalo, CCHS-1, CCS-2, CCS-3, and CCS-4 smear slides)
in the Lalmai hills samples contain 35% opaque minerals, 10% ZTR stable minerals,
garnet, and sillimanite. Other minerals observed include kyanite, andalusite,
orthopyroxenes (e.g., hyperthene), epidote-group minerals, chlorite & chloritoid, and
staurolite (Fig. 5.5A). The index heavy mineral in the Lalmai hills samples is sillimanite
(Fig. 5.5B).
Heavy mineral assemblages (NWD, NWR thin section; NWD-1, NWD-3, NWR-2
and NWR-3 smear slides) from the Stable Platform samples contain 32% opaque
minerals, 8% ZTR stable minerals, 12% garnet, 15% sillimanite, and 6% andalusite.
Other accessory minerals include epidote-group minerals, apatite, hornblende, chlorite
0
5
10
15
20
25
30
Fre
qu
ency
(%
)
Dupi Tila Sandstone
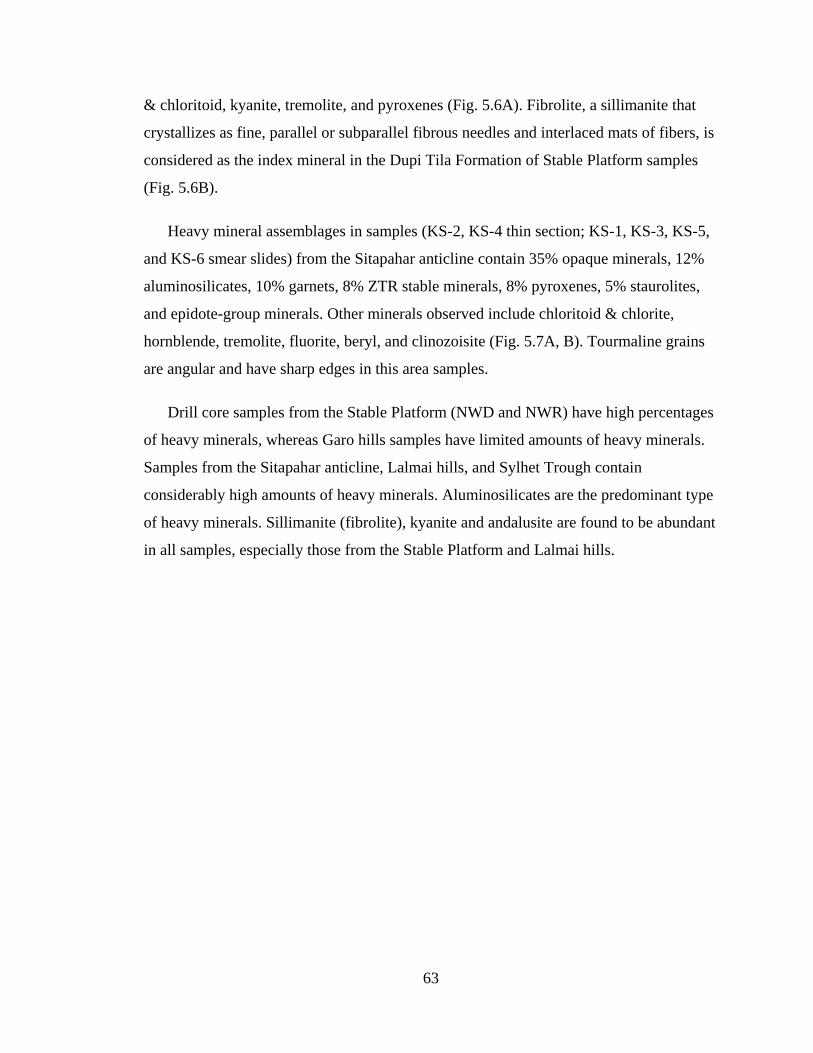
63
& chloritoid, kyanite, tremolite, and pyroxenes (Fig. 5.6A). Fibrolite, a sillimanite that
crystallizes as fine, parallel or subparallel fibrous needles and interlaced mats of fibers, is
considered as the index mineral in the Dupi Tila Formation of Stable Platform samples
(Fig. 5.6B).
Heavy mineral assemblages in samples (KS-2, KS-4 thin section; KS-1, KS-3, KS-5,
and KS-6 smear slides) from the Sitapahar anticline contain 35% opaque minerals, 12%
aluminosilicates, 10% garnets, 8% ZTR stable minerals, 8% pyroxenes, 5% staurolites,
and epidote-group minerals. Other minerals observed include chloritoid & chlorite,
hornblende, tremolite, fluorite, beryl, and clinozoisite (Fig. 5.7A, B). Tourmaline grains
are angular and have sharp edges in this area samples.
Drill core samples from the Stable Platform (NWD and NWR) have high percentages
of heavy minerals, whereas Garo hills samples have limited amounts of heavy minerals.
Samples from the Sitapahar anticline, Lalmai hills, and Sylhet Trough contain
considerably high amounts of heavy minerals. Aluminosilicates are the predominant type
of heavy minerals. Sillimanite (fibrolite), kyanite and andalusite are found to be abundant
in all samples, especially those from the Stable Platform and Lalmai hills.
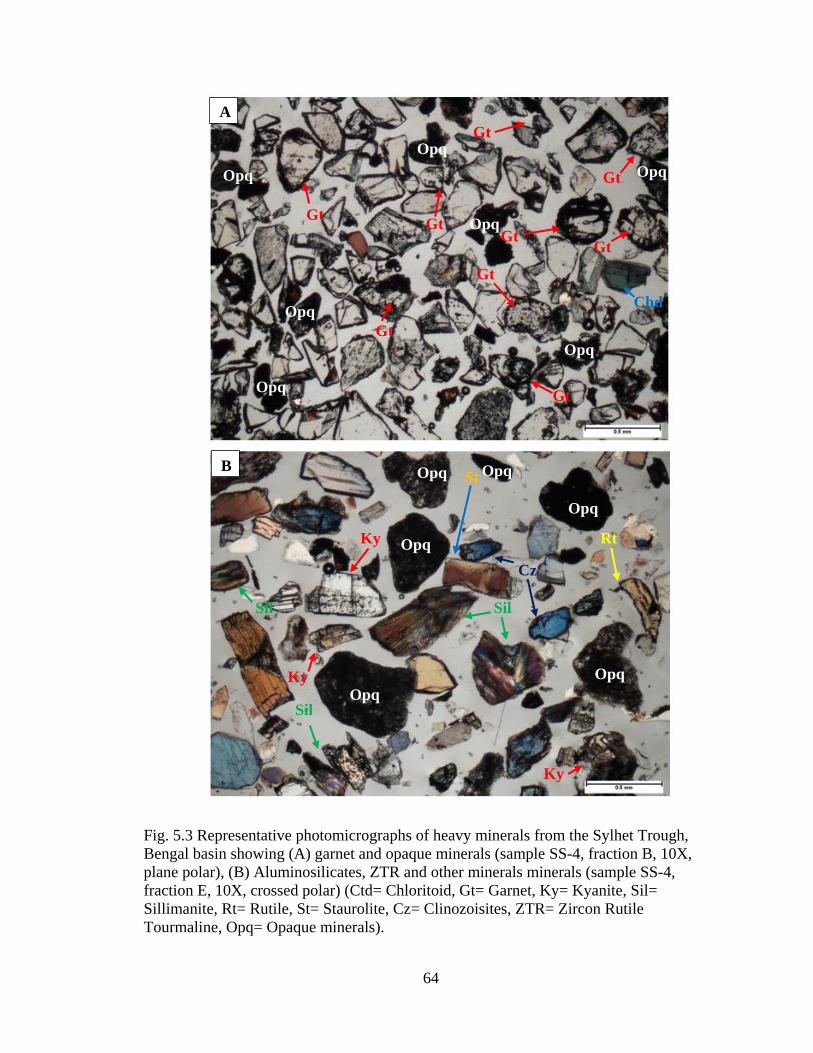
64
Fig. 5.3 Representative photomicrographs of heavy minerals from the Sylhet Trough,
Bengal basin showing (A) garnet and opaque minerals (sample SS-4, fraction B, 10X,
plane polar), (B) Aluminosilicates, ZTR and other minerals minerals (sample SS-4,
fraction E, 10X, crossed polar) (Ctd= Chloritoid, Gt= Garnet, Ky= Kyanite, Sil=
Sillimanite, Rt= Rutile, St= Staurolite, Cz= Clinozoisites, ZTR= Zircon Rutile
Tourmaline, Opq= Opaque minerals).
A
B
G
t
Gt
G
t
G
t
G
t
G
t
G
t
G
t
S
i
l
S
i
l
S
i
l
C
h
d
K
y
K
y
R
t
K
y
Opq
Opq
Opq
Opq
Opq
Opq
Opq
Opq
Opq
Opq
Opq Gt
Gt
Gt
Gt
Gt
Gt
Gt
Gt
Opq
Opq
Chd
Ky
Ky
Ky
Sil
Sil Sil
Cz
St
Rt
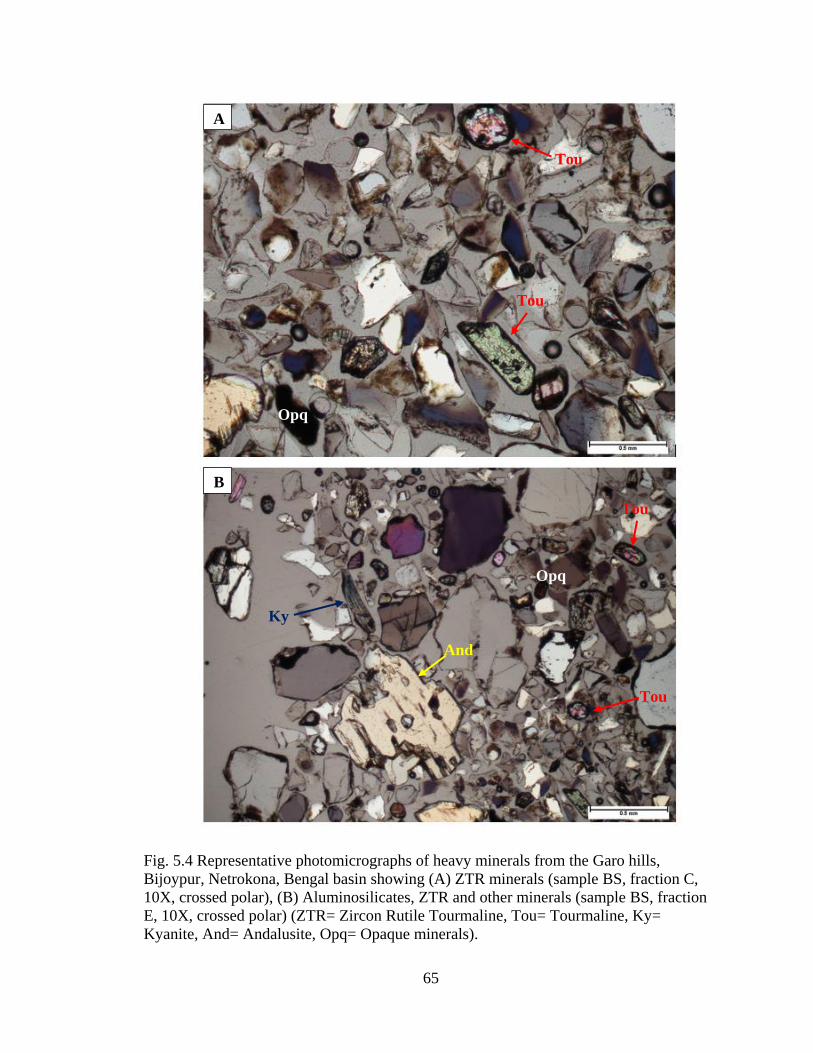
65
Fig. 5.4 Representative photomicrographs of heavy minerals from the Garo hills,
Bijoypur, Netrokona, Bengal basin showing (A) ZTR minerals (sample BS, fraction C,
10X, crossed polar), (B) Aluminosilicates, ZTR and other minerals (sample BS, fraction
E, 10X, crossed polar) (ZTR= Zircon Rutile Tourmaline, Tou= Tourmaline, Ky=
Kyanite, And= Andalusite, Opq= Opaque minerals).
A
B
T
o
u
T
o
u
K
y
T
o
u
A
n
d T
o
u
Opq
Opq
Tou
Tou
Tou
Tou
And
Ky

66
Fig. 5.5 Representative photomicrographs of heavy minerals from the Lalmai hills,
Comilla, Bengal basin showing (A) heavy and opaque minerals (sample CCS, fraction C,
10X, crossed polar), (B) Aluminosilicates, ZTR, and other minerals (sample CLDT,
fraction E, 10X, crossed polar) (Ky= Kyanite, Sil= Sillimanite, Opq= Opaque minerals,
Zr= Zircon, Rt= Rutile, Hbl= Hornblende, St= Staurolite, Ep= Epidote, Opx=
Orthopyroxene, Tou= Tourmaline).
A
B
K
y
S
t R
t
H
b
l
S
i
l
S
i
l
K
y
K
y
S
i
l
A
n
d
A
n
d
Z
r S
i
l
O
p
x
E
p
R
t
Opq
Opq
Opq
Opq
Opq
Opq
Opq
O
p
q Opq
O
p
q
Opq
Opq
T
o
u
St
Hbl
Tou
Opx
Ep
Rt
Opq
Opq
Sil
Sil
Sil
Sil
Rt
Ky
Zr
Ky
Ky
Ky
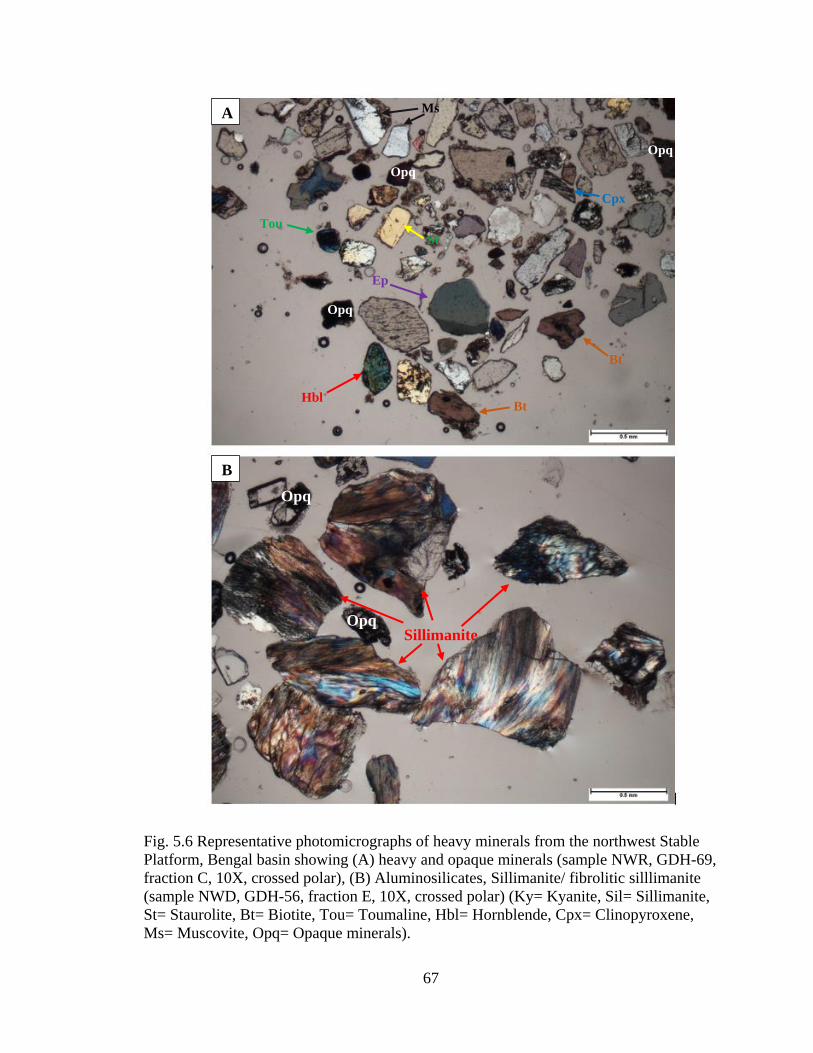
67
Fig. 5.6 Representative photomicrographs of heavy minerals from the northwest Stable
Platform, Bengal basin showing (A) heavy and opaque minerals (sample NWR, GDH-69,
fraction C, 10X, crossed polar), (B) Aluminosilicates, Sillimanite/ fibrolitic silllimanite
(sample NWD, GDH-56, fraction E, 10X, crossed polar) (Ky= Kyanite, Sil= Sillimanite,
St= Staurolite, Bt= Biotite, Tou= Toumaline, Hbl= Hornblende, Cpx= Clinopyroxene,
Ms= Muscovite, Opq= Opaque minerals).
A
B
Sillimanite
(Sil
)
E
p
B
t
B
t
O
p
x
S
t
Opq
Opq
Opq
Opq
Opq
T
o
u
M
s
Hbl
Bt
Bt
Ms
Tou St
Cpx
Ep
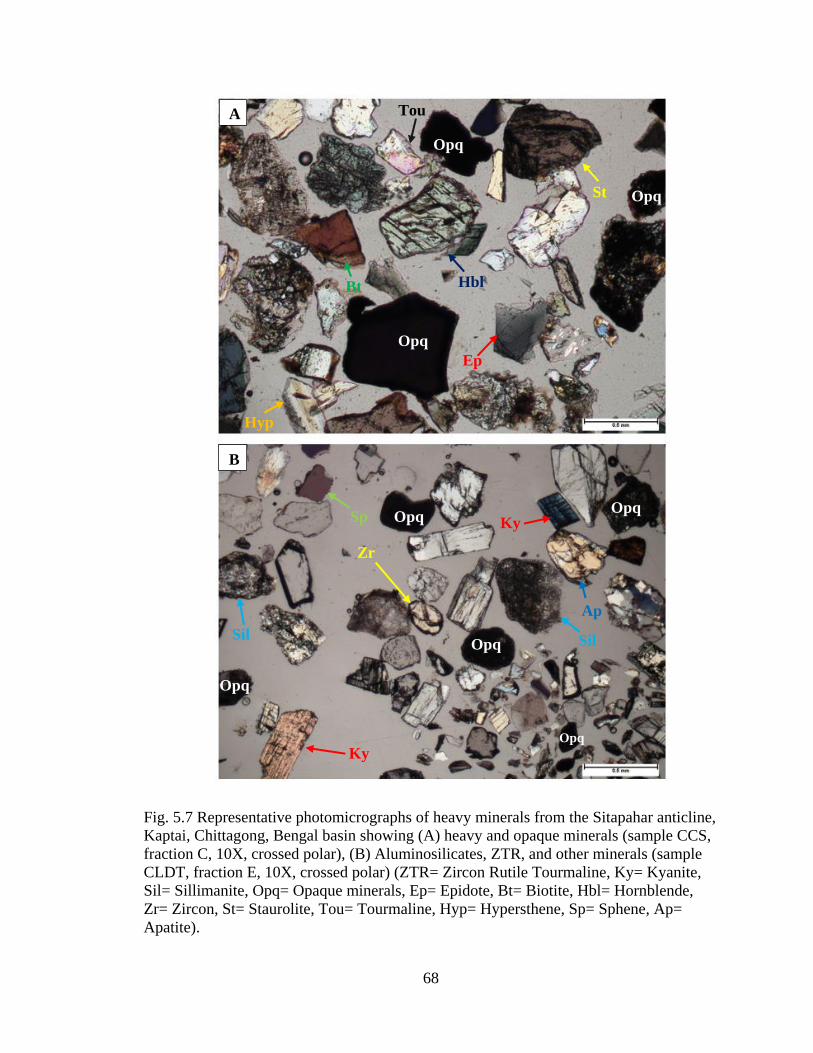
68
Fig. 5.7 Representative photomicrographs of heavy minerals from the Sitapahar anticline,
Kaptai, Chittagong, Bengal basin showing (A) heavy and opaque minerals (sample CCS,
fraction C, 10X, crossed polar), (B) Aluminosilicates, ZTR, and other minerals (sample
CLDT, fraction E, 10X, crossed polar) (ZTR= Zircon Rutile Tourmaline, Ky= Kyanite,
Sil= Sillimanite, Opq= Opaque minerals, Ep= Epidote, Bt= Biotite, Hbl= Hornblende,
Zr= Zircon, St= Staurolite, Tou= Tourmaline, Hyp= Hypersthene, Sp= Sphene, Ap=
Apatite).
A
B
K
y
H
b
l
E
p
B
t
O
p
q
O
p
q
Opq
Opq
Opq
Opq
Opq
A
n
d
S
i
l
S
i
l
Z
r
S
t
T
o
u
H
y
p
A
p
Opq
Tou
Bt
Hyp
Ep
Hbl
St
Opq
Opq
Zr
Sp
Sil Sil
Ap
Ky
Ky
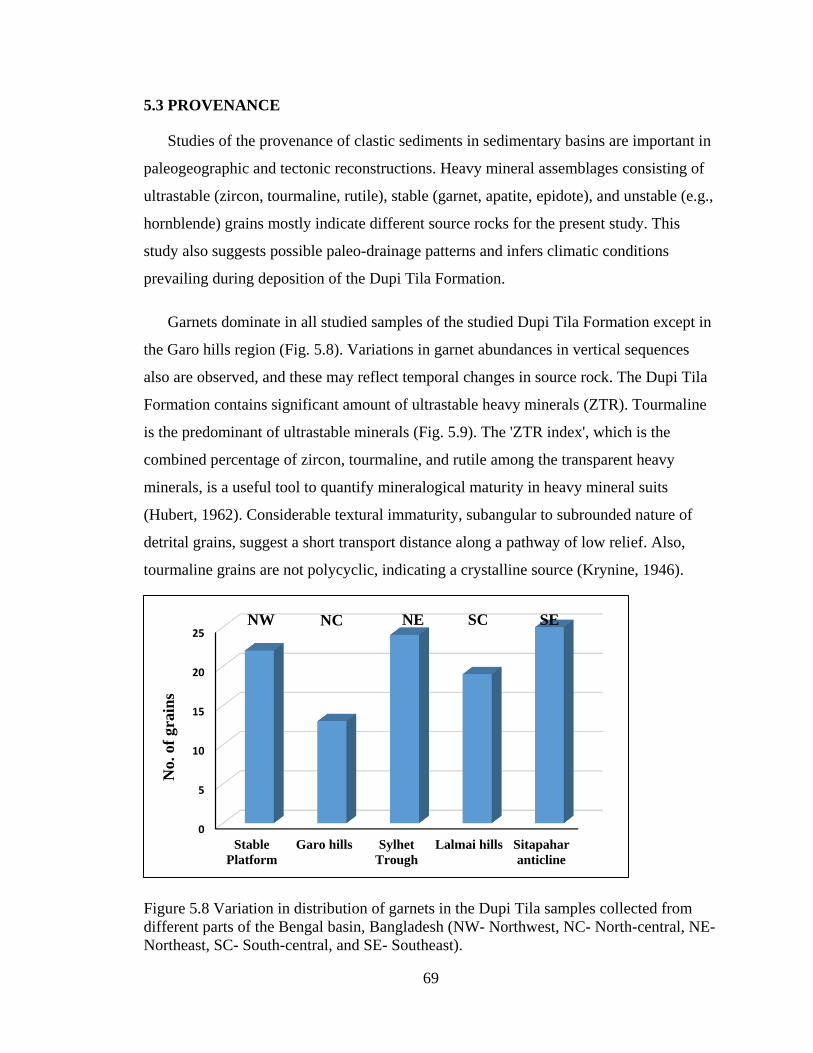
69
5.3 PROVENANCE
Studies of the provenance of clastic sediments in sedimentary basins are important in
paleogeographic and tectonic reconstructions. Heavy mineral assemblages consisting of
ultrastable (zircon, tourmaline, rutile), stable (garnet, apatite, epidote), and unstable (e.g.,
hornblende) grains mostly indicate different source rocks for the present study. This
study also suggests possible paleo-drainage patterns and infers climatic conditions
prevailing during deposition of the Dupi Tila Formation.
Garnets dominate in all studied samples of the studied Dupi Tila Formation except in
the Garo hills region (Fig. 5.8). Variations in garnet abundances in vertical sequences
also are observed, and these may reflect temporal changes in source rock. The Dupi Tila
Formation contains significant amount of ultrastable heavy minerals (ZTR). Tourmaline
is the predominant of ultrastable minerals (Fig. 5.9). The 'ZTR index', which is the
combined percentage of zircon, tourmaline, and rutile among the transparent heavy
minerals, is a useful tool to quantify mineralogical maturity in heavy mineral suits
(Hubert, 1962). Considerable textural immaturity, subangular to subrounded nature of
detrital grains, suggest a short transport distance along a pathway of low relief. Also,
tourmaline grains are not polycyclic, indicating a crystalline source (Krynine, 1946).
Figure 5.8 Variation in distribution of garnets in the Dupi Tila samples collected from
different parts of the Bengal basin, Bangladesh (NW- Northwest, NC- North-central, NE-
Northeast, SC- South-central, and SE- Southeast).
0
5
10
15
20
25
Stable
Platform
Garo hills Sylhet
Trough
Lalmai hills Sitapahar
anticline
No. of
gra
ins
NC NE SC SE NW

70
Figure 5.9 Variation in distribution of ZTR minerals in the Dupi Tila samples collected
from different parts of the Bengal basin, Bangladesh (ZTR= Zircon Rutile Tourmaline;
NW- Northwest, NC- North-central, NE- Northeast, SC- South-central, and SE-
Southeast).
Figure 5.10 Variation in distribution of aluminosilicates in the Dupi Tila samples
collected from different parts of the Bengal basin, Bangladesh (NW- Northwest, NC-
North-central, NE- Northeast, SC- South-central, and SE- Southeast).
The Dupi Tila Formation from different regions of the Bengal basin has a substantial
amount of aluminosilicates. Sillimanite is the predominant mineral throughout the basin,
0
5
10
15
20
25
30
StablePlatform
Garo hills Sylhet Trough Lalmai hills Sitapaharanticline
No. of
gra
ins
Zircon Rutile Tourmaline
0
10
20
30
40
50
60
StablePlatform
Garo hills Sylhet Trough Lalmai hills Sitapaharanticline
No. of
gra
ins
Andalusite Kyanite Sillimanite
NC NE
NE NW NC SC SE
SE SC NW
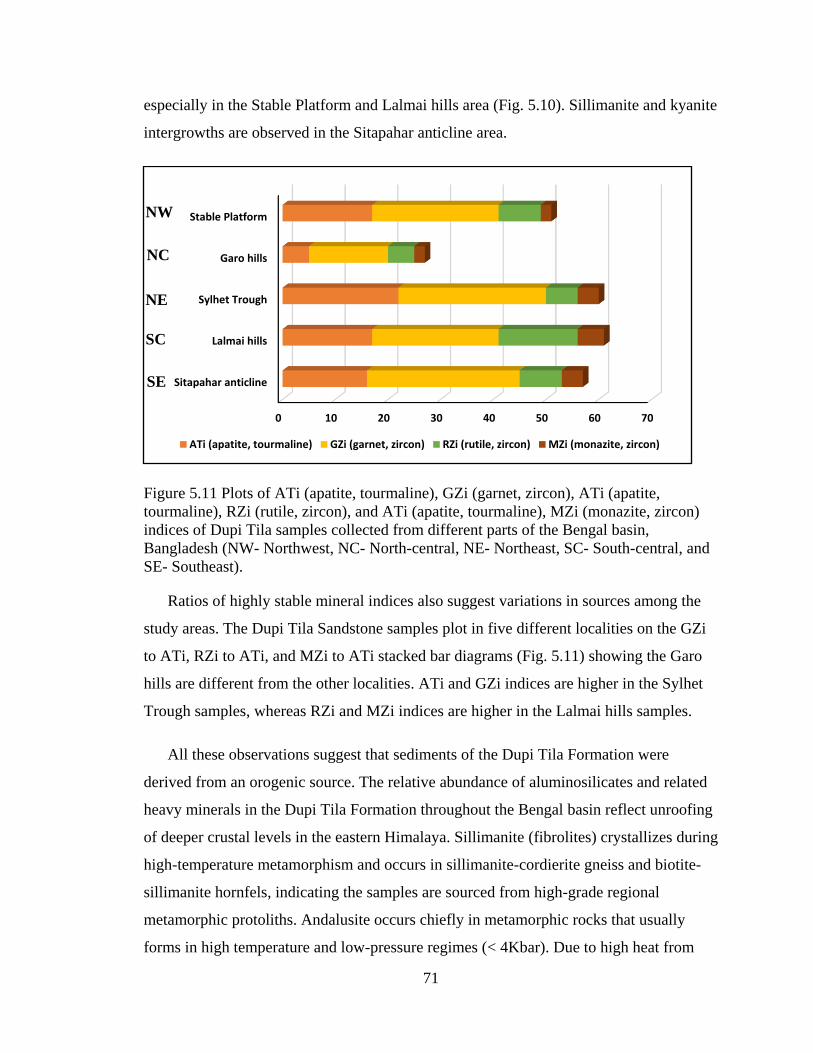
71
especially in the Stable Platform and Lalmai hills area (Fig. 5.10). Sillimanite and kyanite
intergrowths are observed in the Sitapahar anticline area.
Figure 5.11 Plots of ATi (apatite, tourmaline), GZi (garnet, zircon), ATi (apatite,
tourmaline), RZi (rutile, zircon), and ATi (apatite, tourmaline), MZi (monazite, zircon)
indices of Dupi Tila samples collected from different parts of the Bengal basin,
Bangladesh (NW- Northwest, NC- North-central, NE- Northeast, SC- South-central, and
SE- Southeast).
Ratios of highly stable mineral indices also suggest variations in sources among the
study areas. The Dupi Tila Sandstone samples plot in five different localities on the GZi
to ATi, RZi to ATi, and MZi to ATi stacked bar diagrams (Fig. 5.11) showing the Garo
hills are different from the other localities. ATi and GZi indices are higher in the Sylhet
Trough samples, whereas RZi and MZi indices are higher in the Lalmai hills samples.
All these observations suggest that sediments of the Dupi Tila Formation were
derived from an orogenic source. The relative abundance of aluminosilicates and related
heavy minerals in the Dupi Tila Formation throughout the Bengal basin reflect unroofing
of deeper crustal levels in the eastern Himalaya. Sillimanite (fibrolites) crystallizes during
high-temperature metamorphism and occurs in sillimanite-cordierite gneiss and biotite-
sillimanite hornfels, indicating the samples are sourced from high-grade regional
metamorphic protoliths. Andalusite occurs chiefly in metamorphic rocks that usually
forms in high temperature and low-pressure regimes (< 4Kbar). Due to high heat from
0 10 20 30 40 50 60 70
Sitapahar anticline
Lalmai hills
Sylhet Trough
Garo hills
Stable Platform
ATi (apatite, tourmaline) GZi (garnet, zircon) RZi (rutile, zircon) MZi (monazite, zircon)
SC
SE
NE
NC
NW

72
magmatic plutons in relatively low burial depth country rocks turned into metamorphic
rocks, indicating the samples are sourced from high-grade contact or regional
metamorphic protoliths (Visona et al., 2012).
Mountain building in the eastern Himalaya and Indo-Burman ranges was significant
and the orogenic fronts were presumably encroaching on the basin from the north and
east by Pliocene-Pleistocene time (Uddin and Lundberg, 1998a; Uddin et al., 2007).
Orthopyroxenes, especially abundant hypersthene, further suggest unroofing and erosion
of high-pressure mafic rocks, including ophliolites in both the Himalayas and the Indo-
Burman ranges.
73
Chapter 6: MICROPROBE ANALYSIS
6.1 INTRODUCTION
In addition to studying overall heavy mineral suites, provenance analysis of clastic
sediments also can be facilitated by chemical analyses of specific heavy mineral species
(e.g., garnet, zircon, tourmaline, rutile, ilmenite, chlorite, spinel, etc.), the compositions
of which are related to the formative conditions of their parent rocks (Morton and Taylor,
1991). Density and stability (both chemical and mechanical) variations among different
heavy minerals may obscure the signature of the source. Reliability of provenance
interpretation can be increased greatly by eliminating or reducing these variations.
Density and stability of a specific mineral species are relatively homogeneous. Thus,
varieties of key minerals present in a sedimentary unit are independent of influences such
as hydrodynamic sorting and diagenesis. Hence, they can provide a more reliable guide to
provenance than the simple presence/absence or relative abundance of different mineral
species.
Interpretation of provenance is considerably enhanced by determining the
composition of individual detrital grains. The advancement of the electron microprobe
made it possible to determine compositional variations in particular species of a heavy
mineral accurately and quickly. Electron microprobe analysis provides a complete
micrometer-scale quantitative chemical analysis of inorganic solids. To constrain
provenance, the chemical composition of selected detrital heavy-mineral grains (i.e.,
potentially garnet) were assessed via microprobe analysis. Microprobe analysis of ten
samples was carried out in the Central Analytical Facility of the University of Alabama in
Tuscaloosa, AL under the supervision of Robert Holler.

74
6.2 MINERAL CHEMISTRY
Specific heavy minerals, such as garnet, epidote, chloritoid, chrome-spinel, and
amphibole, have been used by previous workers to determine provenance of sediments
(Morton, 1985; Henry and Dutrow, 1990; Morton and Taylor, 1991; Nanayama, 1997;
Kumar, 2004; Zahid, 2005; Rahman, 2008).
In this study, five mineral groups (garnet, tourmaline, epidote, chloritoid and
ilmenite) were subjected to microprobe analysis. Compositional variations in their
mineral chemistry can be used to discriminate various source rocks (Enami and Banno,
1980; Chopin and Schreyer, 1983; Morton, 1985; Darby and Tsang, 1987; Henry and
Guidotti, 1985; Henry and Dutrow, 1990; Morton and Taylor, 1991; Nanayama, 1997).
Garnet is commonly found in a variety of metamorphic rocks, as well as in plutonic
igneous rocks, pegmatites, and some volcanic igneous rocks (Mange and Maurer, 1989).
The chemical formula of garnet is [X3Y2(SiO4)3], where X is replaced by bivalent cations
like Fe2+, Mg2+, Ca2+, or Mn2+, and Y is replaced by trivalent cations like Al3+, Fe3+ or
Cr3+. The specific cations in the garnet structure can be related to the type of source
rocks. The ratio of (Fe2+ + Mg2+) / (Ca2+ + Mn2+) in the garnet structure increases with the
degree of metamorphism in metamorphic source terranes (Sturt, 1962; Nandi, 1967).
Tourmaline can be found in various rock types as a common accessory mineral
(Henry and Guidotti, 1985). The general formula of tourmaline is
XY3Z6(BO3)Si6O18(OH)4, where X is occupied by Na+ and/or Ca2+, Y is occupied by
Mn2+, Fe2+, Al3+, Li2+, and/or Mg2+, and Z is occupied by Al3+, Cr3+, Mn2+ and/or Mg2+
(Deer et al., 1992). Tourmaline occurs in granites, granite pegmatites, and in contact- or
regionally metamorphosed metamorphic rocks (Mange and Maurer, 1989). End-member
calculations of tourmaline chemistry can help in distinguishing source rock types.
Previous workers have used Al-Fe (tot)-Mg and Ca-Fe (tot)-Mg plots for provenance
analysis (e.g., Henry and Guidotti, 1985; Henry and Dutrow, 1992; Kumar, 2004; Zahid,
2005; Rahman, 2008; Sitaula, 2009; Alam, 2011).
The ratio of Fe3+/ (Al+Fe3+) in epidote group minerals can help to distinguish source
rock and its temperature conditions (Enami and Banno, 1980, Nanayama, 1997).
75
Variations in the chemical composition of chloritoid are generally defined by variations
in the abundance of Fe, Mg, and Mn (Morton, 1991), which reflect different source-rock
types (Chopin and Schreyer, 1983). Ilmenite chemistry is a viable approach to determine
provenance for sands in a depocenter along with heavy mineral suites, quartz types, and
Fourier analysis of grain shape (Darby and Tsang, 1987).
6.3 ELECTRON MICROPROBE
The electron probe microanalyzer (EPMA) provides a complete micron-scale
quantitative chemical analysis of solids. This method utilizes characteristic x-rays excited
by an electron beam incident on a flat surface of the sample. As the electron beam hits the
surface of grains it responses in two different ways. Some of the beam electrons will be
scattered backward. These backscattered electrons carry information about chemical
composition of the grain. Backscattered electrons are a result of multiple elastic
scattering and have energies between 0 and E0 (the beam energy). When the electron
beam hits the sample, it loses some energy, which is received by the electrons in the outer
shell of atoms of the sample. By receiving this energy, electrons in the sample become
excited and jump from one shell to another and emit a certain amount of energy. This
emitted energy (thrown by the sample electrons) is related to chemical composition.
Some secondary electrons are also mobilized by the beam through inelastic scattering.
These electrons have energies in the range 0-50 eV with a most probable energy of 3-5
eV. Different detector setups are required to detect different types of signals as there are
energy differences between backscattered X-rays and secondary electrons.
EPMA provides a complete quantitative chemical analysis of solid materials, as well
as high-resolution scanning electron and scanning x-ray images (concentration maps).
There are two types of scanning electron images: backscattered electron (BSE) images
and secondary electron (SE) images. BSE images show compositional contrast, while SE
images show enhanced surface and topographic features.
A JEOL 8600 microprobe at the Central Analytical Facilities in the University of
Alabama was used for this study. The probe is automated by Geller Micro analytical
laboratory dQANT automation and uses an accelerating voltage of 15 KV and a beam

76
current of 15 nano amps. Both natural and synthetic standards were used to calibrate the
data.
6.4 STANDARD INTENSITY CALIBRATION
Appropriate standards were chosen to obtain standard X-ray intensities of the
substances measured during microprobe analysis. Different standards were used for
different substances. Secondary standards were analyzed as unknowns to check if their
known compositions are reproduced. Analytical conditions (e.g., accelerating voltage,
beam current, etc.) were maintained throughout the session.
The standards used for this analysis are listed in Table 9. Most of them come from the
C. M. Taylor Corp. The USNM standards come from the National Museum of Natural
History, a branch of the Smithsonian Institution. This study used two synthetic standards
obtained from the University of Oregon microprobe lab, and an almandine standard
obtained from the Harvard Mineral Museum. Calibration for each analytical session was
checked using the Kakanui Hornblende (USNM) and Pryope #39 (C. M. Taylor)
standards.
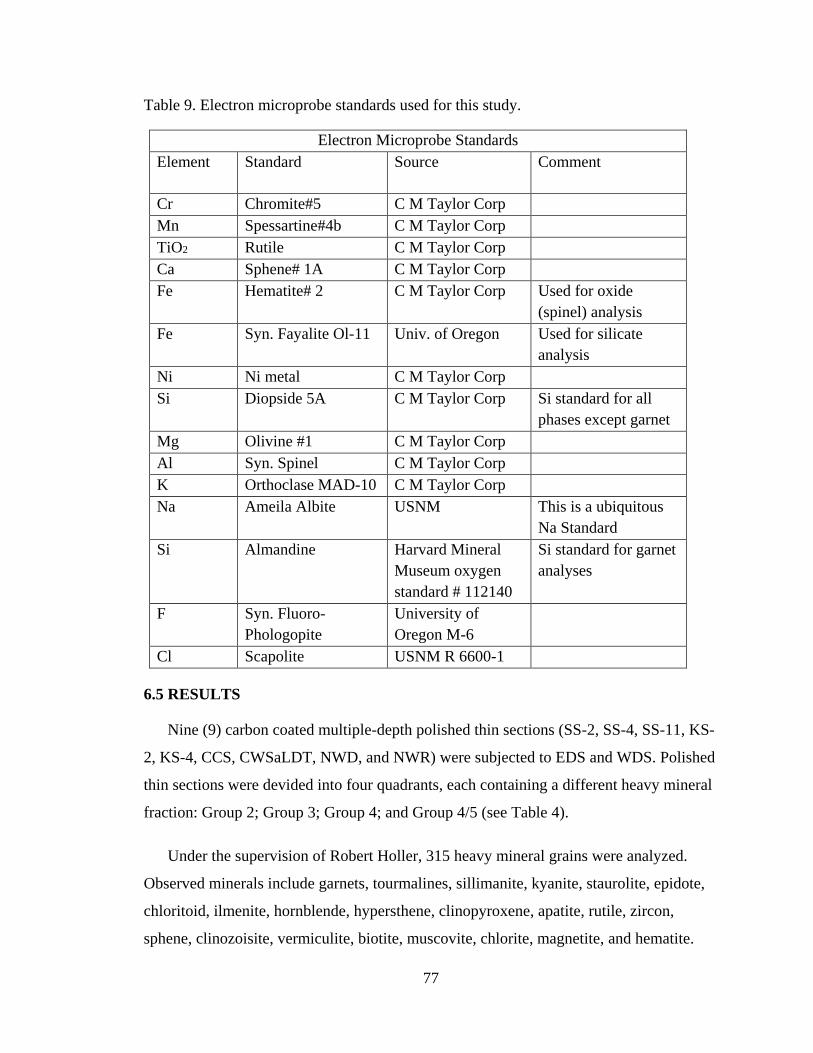
77
Table 9. Electron microprobe standards used for this study.
Electron Microprobe Standards
Element Standard Source Comment
Cr Chromite#5 C M Taylor Corp
Mn Spessartine#4b C M Taylor Corp
TiO2 Rutile C M Taylor Corp
Ca Sphene# 1A C M Taylor Corp
Fe Hematite# 2 C M Taylor Corp Used for oxide
(spinel) analysis
Fe Syn. Fayalite Ol-11 Univ. of Oregon Used for silicate
analysis
Ni Ni metal C M Taylor Corp
Si Diopside 5A C M Taylor Corp Si standard for all
phases except garnet
Mg Olivine #1 C M Taylor Corp
Al Syn. Spinel C M Taylor Corp
K Orthoclase MAD-10 C M Taylor Corp
Na Ameila Albite USNM This is a ubiquitous
Na Standard
Si Almandine Harvard Mineral
Museum oxygen
standard # 112140
Si standard for garnet
analyses
F Syn. Fluoro-
Phologopite
University of
Oregon M-6
Cl Scapolite USNM R 6600-1
6.5 RESULTS
Nine (9) carbon coated multiple-depth polished thin sections (SS-2, SS-4, SS-11, KS-
2, KS-4, CCS, CWSaLDT, NWD, and NWR) were subjected to EDS and WDS. Polished
thin sections were devided into four quadrants, each containing a different heavy mineral
fraction: Group 2; Group 3; Group 4; and Group 4/5 (see Table 4).
Under the supervision of Robert Holler, 315 heavy mineral grains were analyzed.
Observed minerals include garnets, tourmalines, sillimanite, kyanite, staurolite, epidote,
chloritoid, ilmenite, hornblende, hypersthene, clinopyroxene, apatite, rutile, zircon,
sphene, clinozoisite, vermiculite, biotite, muscovite, chlorite, magnetite, and hematite.

78
Chemical mapping also helped to evaluate element contents in minerals of interest (Fig.
6.1). The EDS spectrum recorded and WDS element weight percentage was recorded
(Fig. 6.2)
Fig. 6.1 Chemical mapping of mineral grains during spectroscopy showing different
element contents on the thin sections, A- BSE image, B-I primary element contents in
heavy minerals- B- aluminum, C- silicon, D- iron, E- magnesium, F- potassium, G-
calcium, H- manganese, and I- titanium element contents respectively (Sample- NWD,
fraction B).

79
Fig. 6.2 Examples of EDS spectrum of mineral grains from polished sections of the Dupi
Tila Formation. Top- pyrope garnet (Sample- CW, fraction B) and bottom- tourmaline
(sample- SS-11, fraction C).
6.5.1 GARNET
Garnets are one of the most abundant minerals in all samples of the Dupi Tila
Formation. A total of 22 garnet grains were analyzed (see Appendix B, Fig. 6.3), and
calculated end members were plotted in Figures 6.4 through 6.7. The four end-members
calculated are almandine, pyrope, grossular and spessartine, of which almandine is
dominant. The average almandine content in garnet grains is 50.0% with a maximum of
79.0%. Other types of garnets are- Pyrope (average 10.0%, max. 26.0%), grossular
(average 27.0%, max. 69.0%), and spessartine (average 13.0%, max. 61.0%).
Si
Si
Al
Al
Mg
Mg Ca
O
Ca Fe
Fe
O
Mn

80
Fig. 6.3 A- Representative BSE photomicrographs of garnet grains in polished section
(Sample KS-2, Fraction-B, WDS), B- EDS of individual grains from multiple-depth
carbon-coated thin sections (Sample KS-2, Fraction D).
A
B
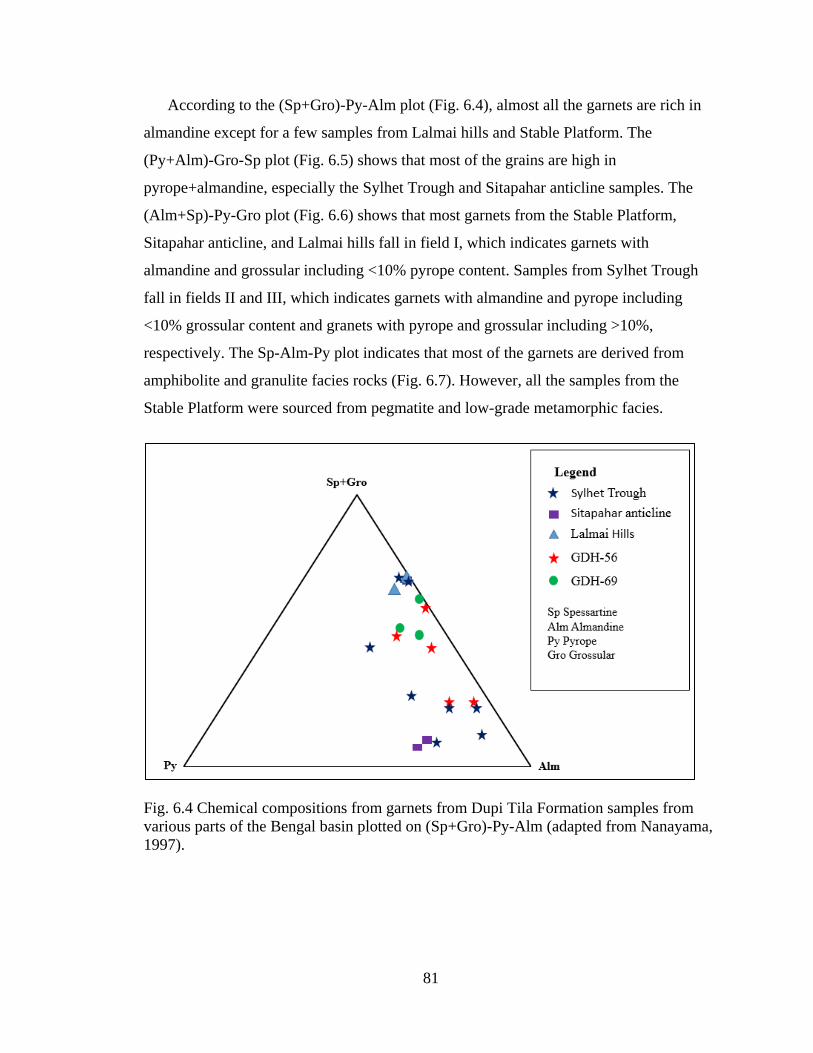
81
According to the (Sp+Gro)-Py-Alm plot (Fig. 6.4), almost all the garnets are rich in
almandine except for a few samples from Lalmai hills and Stable Platform. The
(Py+Alm)-Gro-Sp plot (Fig. 6.5) shows that most of the grains are high in
pyrope+almandine, especially the Sylhet Trough and Sitapahar anticline samples. The
(Alm+Sp)-Py-Gro plot (Fig. 6.6) shows that most garnets from the Stable Platform,
Sitapahar anticline, and Lalmai hills fall in field I, which indicates garnets with
almandine and grossular including <10% pyrope content. Samples from Sylhet Trough
fall in fields II and III, which indicates garnets with almandine and pyrope including
<10% grossular content and granets with pyrope and grossular including >10%,
respectively. The Sp-Alm-Py plot indicates that most of the garnets are derived from
amphibolite and granulite facies rocks (Fig. 6.7). However, all the samples from the
Stable Platform were sourced from pegmatite and low-grade metamorphic facies.
Fig. 6.4 Chemical compositions from garnets from Dupi Tila Formation samples from
various parts of the Bengal basin plotted on (Sp+Gro)-Py-Alm (adapted from Nanayama,
1997).
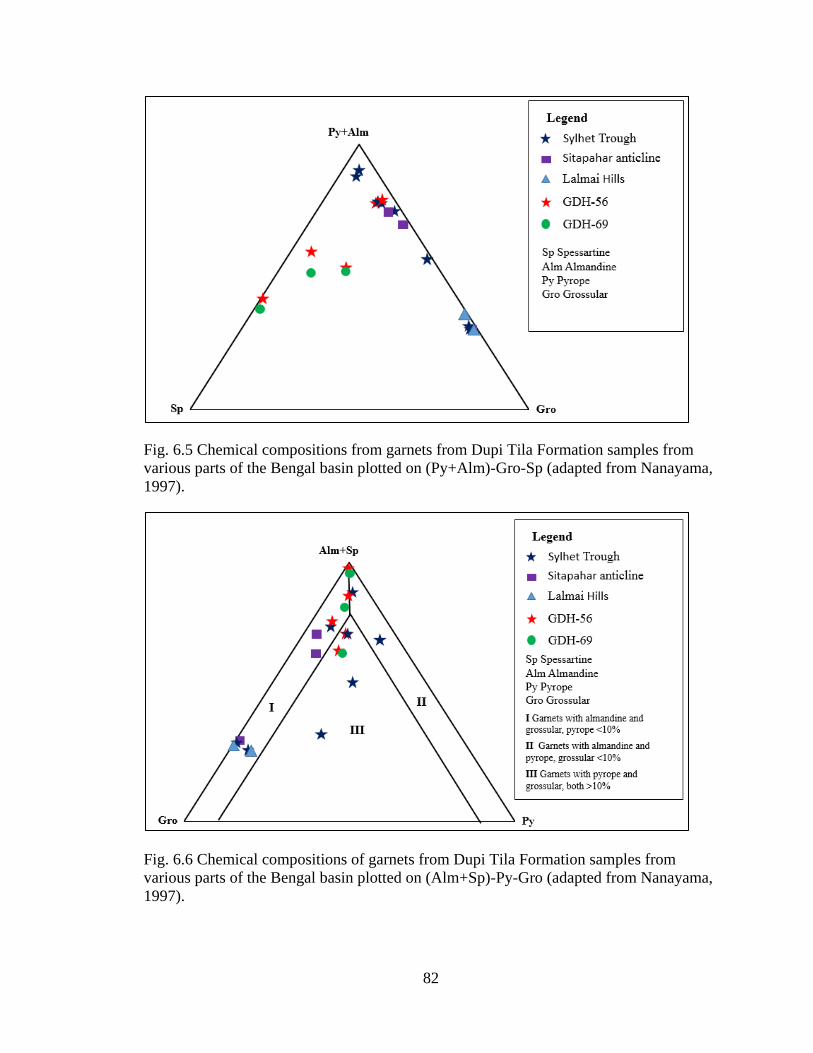
82
Fig. 6.5 Chemical compositions from garnets from Dupi Tila Formation samples from
various parts of the Bengal basin plotted on (Py+Alm)-Gro-Sp (adapted from Nanayama,
1997).
Fig. 6.6 Chemical compositions of garnets from Dupi Tila Formation samples from
various parts of the Bengal basin plotted on (Alm+Sp)-Py-Gro (adapted from Nanayama,
1997).

83
Fig. 6.7 Chemical composition of garnets from Dupi Tila Formation samples from
various parts of the Bengal basin plotted on Alm-Py-Sp (adapted from Nanayama, 1997).
6.5.2 TOURMALINE
Tourmaline is very complex in terms of its chemical structure and is usually
considered in terms of end-members. A complete solid solution exists between the two
end-member series schorl-elbaite and schorl-dravite, although there is a large miscibility
gap between elbaite and dravite. Hence, tourmalines are usually described depending on
their position in the schorl-elbaite series or in the schorl-dravite series.
A total of 16 tourmaline grains were analyzed (see Appendix C, Fig. 6.8).
Tourmalines were plotted on Al-Al50Fe50(tot)-Al50Mg50 (Fig. 6.9) and Ca-Fe(tot)-Mg
(Fig. 6.10) diagrams. The Al-Al50Fe50(tot)-Al50Mg50 plot shows that all the tourmalines
fall within the field indicating metapelites coexisting with an Al saturating phase.
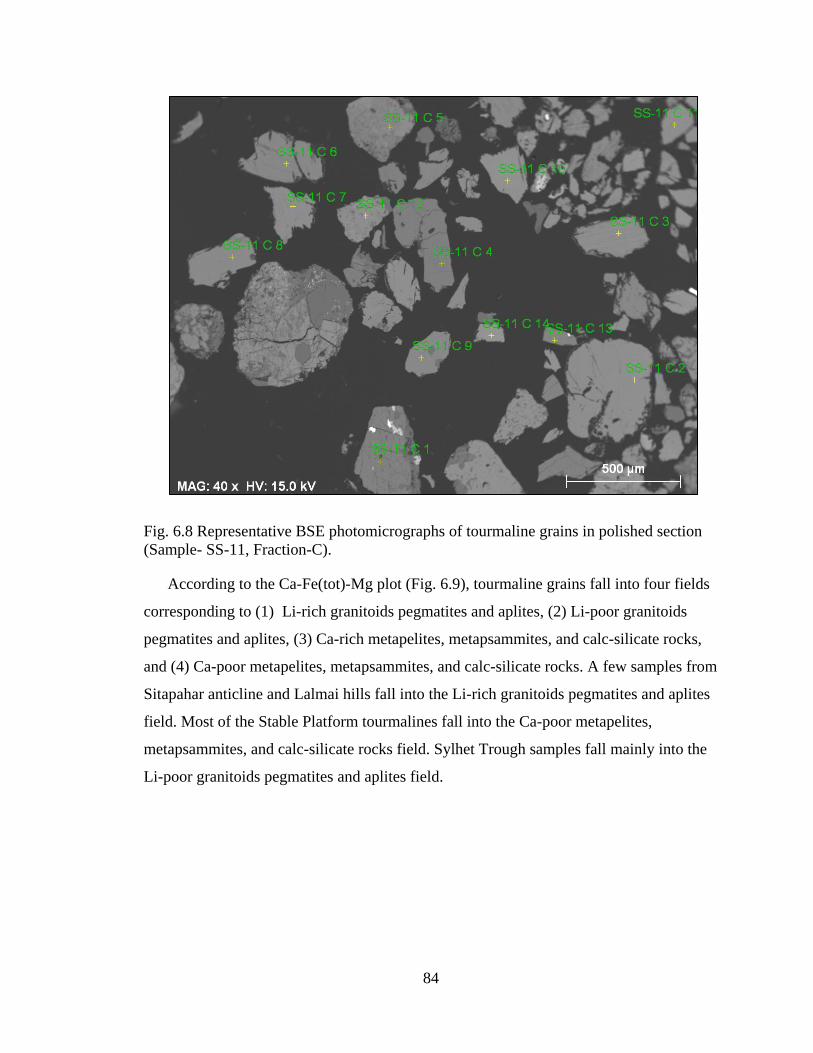
84
Fig. 6.8 Representative BSE photomicrographs of tourmaline grains in polished section
(Sample- SS-11, Fraction-C).
According to the Ca-Fe(tot)-Mg plot (Fig. 6.9), tourmaline grains fall into four fields
corresponding to (1) Li-rich granitoids pegmatites and aplites, (2) Li-poor granitoids
pegmatites and aplites, (3) Ca-rich metapelites, metapsammites, and calc-silicate rocks,
and (4) Ca-poor metapelites, metapsammites, and calc-silicate rocks. A few samples from
Sitapahar anticline and Lalmai hills fall into the Li-rich granitoids pegmatites and aplites
field. Most of the Stable Platform tourmalines fall into the Ca-poor metapelites,
metapsammites, and calc-silicate rocks field. Sylhet Trough samples fall mainly into the
Li-poor granitoids pegmatites and aplites field.
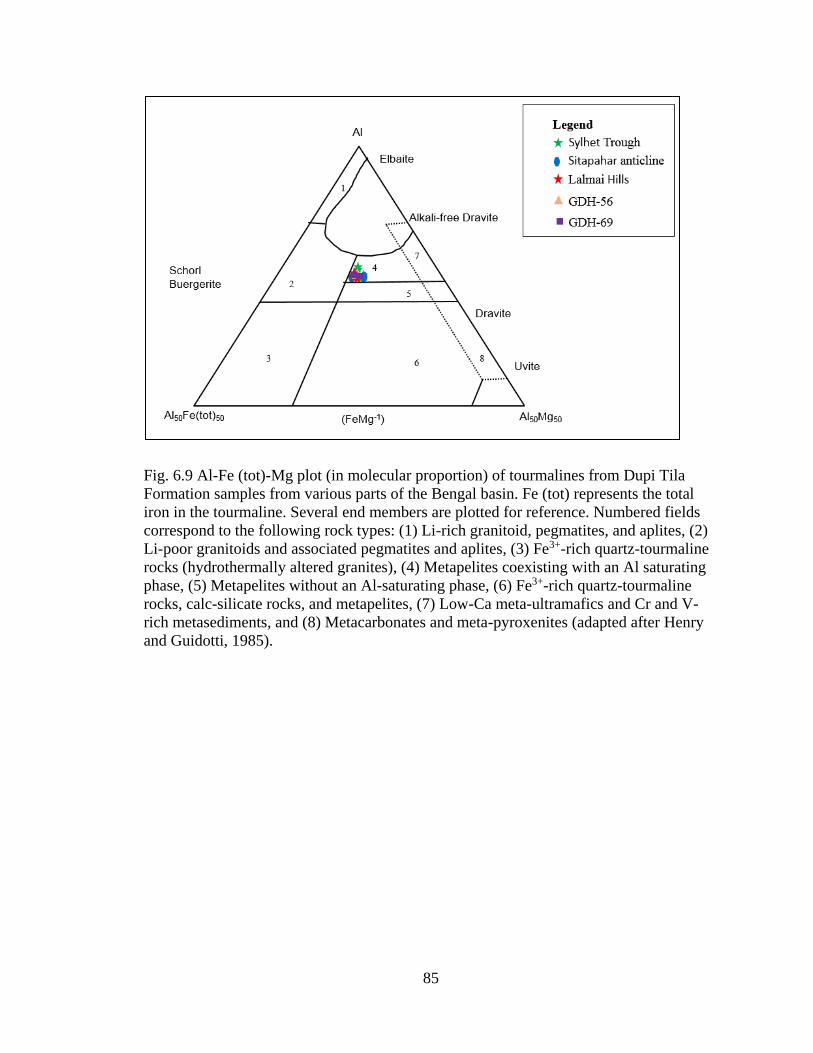
85
Fig. 6.9 Al-Fe (tot)-Mg plot (in molecular proportion) of tourmalines from Dupi Tila
Formation samples from various parts of the Bengal basin. Fe (tot) represents the total
iron in the tourmaline. Several end members are plotted for reference. Numbered fields
correspond to the following rock types: (1) Li-rich granitoid, pegmatites, and aplites, (2)
Li-poor granitoids and associated pegmatites and aplites, (3) Fe3+-rich quartz-tourmaline
rocks (hydrothermally altered granites), (4) Metapelites coexisting with an Al saturating
phase, (5) Metapelites without an Al-saturating phase, (6) Fe3+-rich quartz-tourmaline
rocks, calc-silicate rocks, and metapelites, (7) Low-Ca meta-ultramafics and Cr and V-
rich metasediments, and (8) Metacarbonates and meta-pyroxenites (adapted after Henry
and Guidotti, 1985).
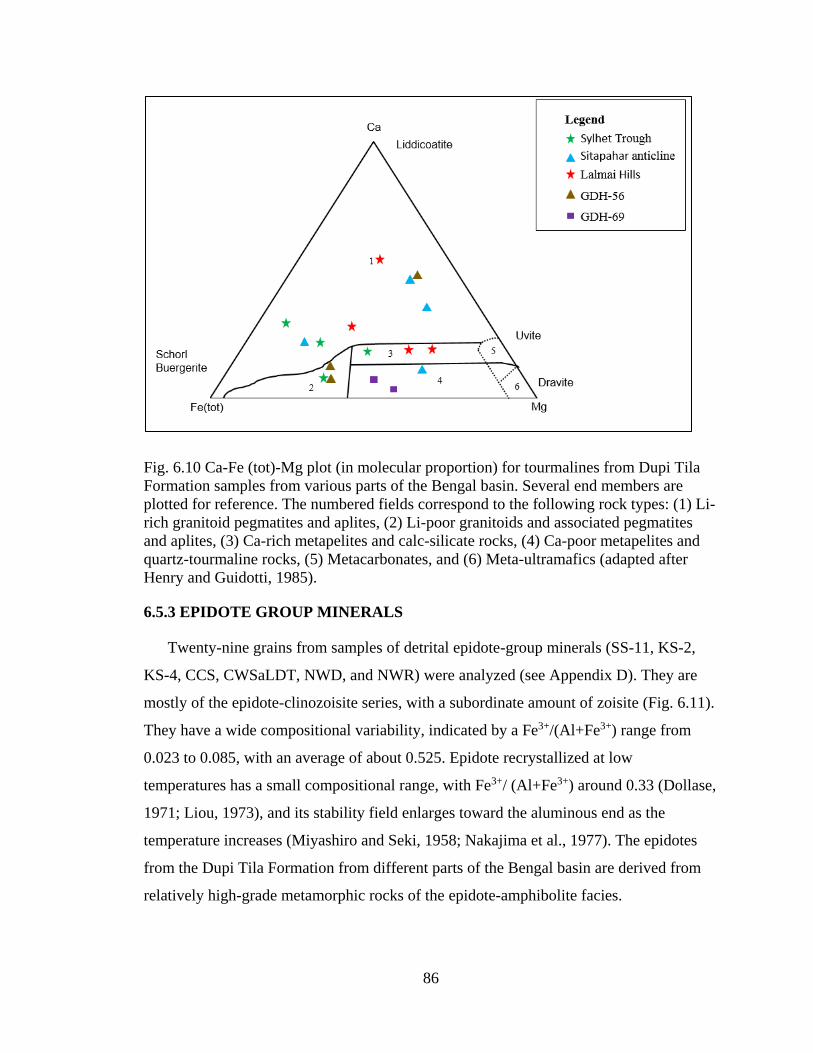
86
Fig. 6.10 Ca-Fe (tot)-Mg plot (in molecular proportion) for tourmalines from Dupi Tila
Formation samples from various parts of the Bengal basin. Several end members are
plotted for reference. The numbered fields correspond to the following rock types: (1) Li-
rich granitoid pegmatites and aplites, (2) Li-poor granitoids and associated pegmatites
and aplites, (3) Ca-rich metapelites and calc-silicate rocks, (4) Ca-poor metapelites and
quartz-tourmaline rocks, (5) Metacarbonates, and (6) Meta-ultramafics (adapted after
Henry and Guidotti, 1985).
6.5.3 EPIDOTE GROUP MINERALS
Twenty-nine grains from samples of detrital epidote-group minerals (SS-11, KS-2,
KS-4, CCS, CWSaLDT, NWD, and NWR) were analyzed (see Appendix D). They are
mostly of the epidote-clinozoisite series, with a subordinate amount of zoisite (Fig. 6.11).
They have a wide compositional variability, indicated by a Fe3+/(Al+Fe3+) range from
0.023 to 0.085, with an average of about 0.525. Epidote recrystallized at low
temperatures has a small compositional range, with Fe3+/ (Al+Fe3+) around 0.33 (Dollase,
1971; Liou, 1973), and its stability field enlarges toward the aluminous end as the
temperature increases (Miyashiro and Seki, 1958; Nakajima et al., 1977). The epidotes
from the Dupi Tila Formation from different parts of the Bengal basin are derived from
relatively high-grade metamorphic rocks of the epidote-amphibolite facies.
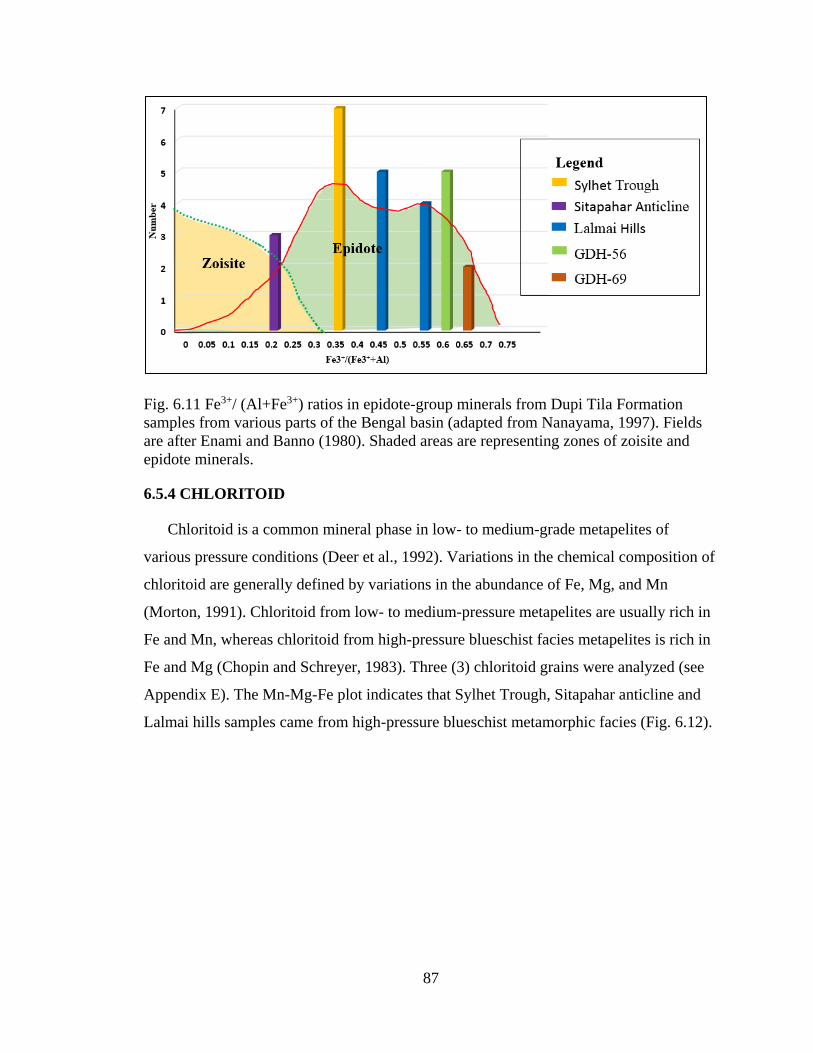
87
Fig. 6.11 Fe3+/ (Al+Fe3+) ratios in epidote-group minerals from Dupi Tila Formation
samples from various parts of the Bengal basin (adapted from Nanayama, 1997). Fields
are after Enami and Banno (1980). Shaded areas are representing zones of zoisite and
epidote minerals.
6.5.4 CHLORITOID
Chloritoid is a common mineral phase in low- to medium-grade metapelites of
various pressure conditions (Deer et al., 1992). Variations in the chemical composition of
chloritoid are generally defined by variations in the abundance of Fe, Mg, and Mn
(Morton, 1991). Chloritoid from low- to medium-pressure metapelites are usually rich in
Fe and Mn, whereas chloritoid from high-pressure blueschist facies metapelites is rich in
Fe and Mg (Chopin and Schreyer, 1983). Three (3) chloritoid grains were analyzed (see
Appendix E). The Mn-Mg-Fe plot indicates that Sylhet Trough, Sitapahar anticline and
Lalmai hills samples came from high-pressure blueschist metamorphic facies (Fig. 6.12).
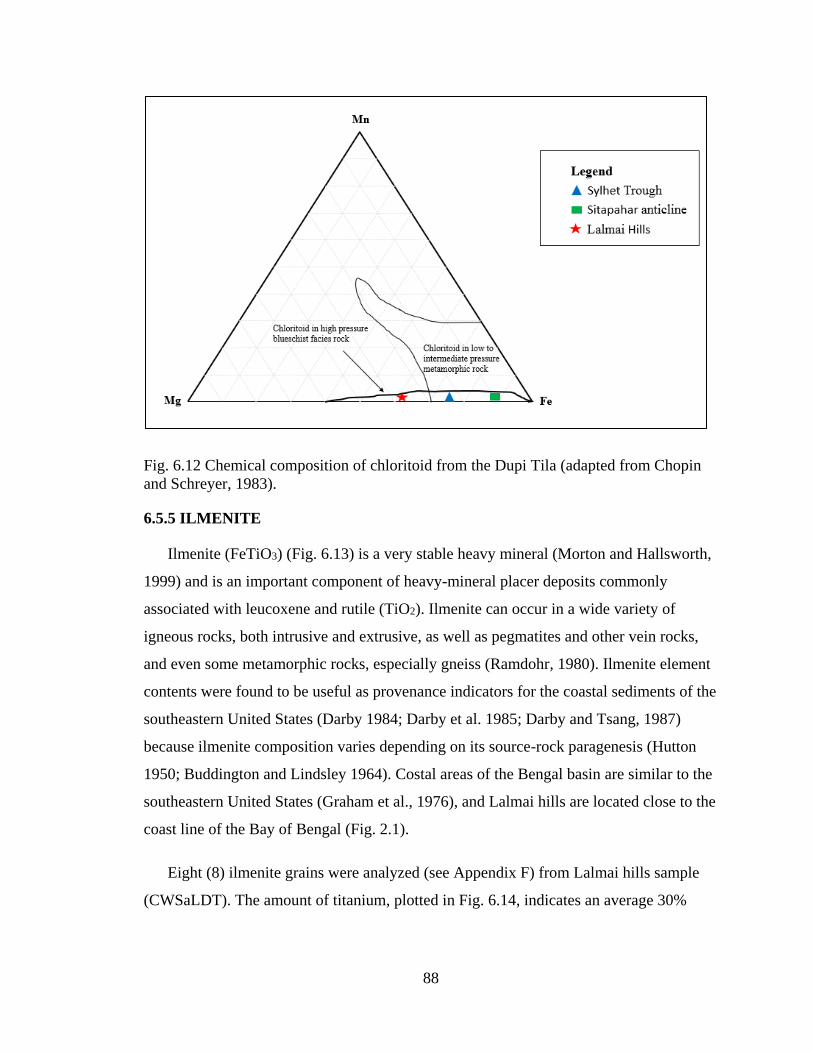
88
Fig. 6.12 Chemical composition of chloritoid from the Dupi Tila (adapted from Chopin
and Schreyer, 1983).
6.5.5 ILMENITE
Ilmenite (FeTiO3) (Fig. 6.13) is a very stable heavy mineral (Morton and Hallsworth,
1999) and is an important component of heavy-mineral placer deposits commonly
associated with leucoxene and rutile (TiO2). Ilmenite can occur in a wide variety of
igneous rocks, both intrusive and extrusive, as well as pegmatites and other vein rocks,
and even some metamorphic rocks, especially gneiss (Ramdohr, 1980). Ilmenite element
contents were found to be useful as provenance indicators for the coastal sediments of the
southeastern United States (Darby 1984; Darby et al. 1985; Darby and Tsang, 1987)
because ilmenite composition varies depending on its source-rock paragenesis (Hutton
1950; Buddington and Lindsley 1964). Costal areas of the Bengal basin are similar to the
southeastern United States (Graham et al., 1976), and Lalmai hills are located close to the
coast line of the Bay of Bengal (Fig. 2.1).
Eight (8) ilmenite grains were analyzed (see Appendix F) from Lalmai hills sample
(CWSaLDT). The amount of titanium, plotted in Fig. 6.14, indicates an average 30%
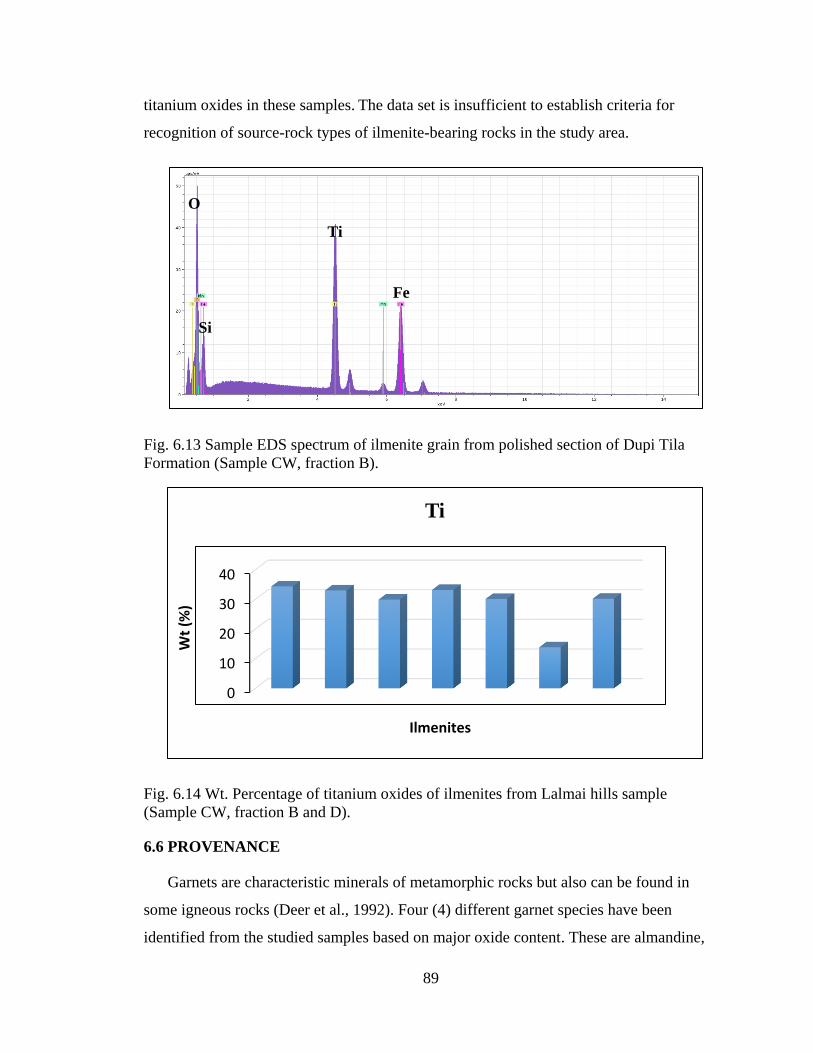
89
titanium oxides in these samples. The data set is insufficient to establish criteria for
recognition of source-rock types of ilmenite-bearing rocks in the study area.
Fig. 6.13 Sample EDS spectrum of ilmenite grain from polished section of Dupi Tila
Formation (Sample CW, fraction B).
Fig. 6.14 Wt. Percentage of titanium oxides of ilmenites from Lalmai hills sample
(Sample CW, fraction B and D).
6.6 PROVENANCE
Garnets are characteristic minerals of metamorphic rocks but also can be found in
some igneous rocks (Deer et al., 1992). Four (4) different garnet species have been
identified from the studied samples based on major oxide content. These are almandine,
0
10
20
30
40
Wt
(%)
Ilmenites
Ti
O
Si
Ti
Fe

90
pyrope, grossular, and spessartine. All studied grains are almandine rich. Garnet
compositions suggest derivation of sediments from mixed source terranes. Most of the
plots indicate a source of garnets from amphibolite, granulite, and eclogite facies rocks.
Compositional analyses of tourmaline suggest that metapelites coexisting with an Al
saturating phase are the probable source rocks for these minerals (Fig 6.10). The Ca-Fe
(tot)-Mg plot shows that most of the grains came from Li-bearing granitoids pegmatites
and aplites, Li-poor granitoids pegmatites and aplites, Ca-rich metapelites,
metapsammites, and calc-silicate rocks, and Ca-poor metapelites, metapsammites, and
calc-silicate rocks (Fig 6.11).
The epidotes from the Dupi Tila Formation from different parts of the Bengal basin
are derived from relatively high-grade metamorphic rocks of epidote-amphibolite facies.
The Mn-Mg-Fe plot for chloritoid suggests that samples from the Sylhet Trough,
Sitapahar anticline and Lalmai hills came from high-pressure blueschist metamorphic
facies.

91
Chapter 7: WHOLE ROCK GEOCHEMISTRY
7.1 INTRODUCTION
Whole rock geochemical analyses are important tools to study provenance of
terrigenous sedimentary rocks because they can provide information about rock types,
tectonic settings, and weathering history of the source rocks. Recent developments in the
field of sedimentary geochemistry highlight that chemical composition of the clastic
sedimentary rocks is a function of a complex interplay of several variables, including the
nature of the source rocks, source area weathering, and diagenesis (McLennan et al.,
1993; McLennan et al., 2003). However, plate-tectonic processes impart a distinctive
geochemical signature to sediments in two separate ways. Different tectonic
environments have distinctive provenance characteristics. Therefore, clastic sedimentary
rocks have been used to determine provenance and identify ancient tectonic settings
(Bhatia, 1983; McLennan et al., 1993). Sedimentary basins may be assigned to the
following tectonic settings: (1) oceanic island arcs, (2) continental island arcs, (3) active
continental margins, and (4) passive continental margins (Bhatia and Crook, 1986).
Roser and Korsch (1988) used discriminant function analysis of major elements
(TiO2, Al2O3, Fe2O3 tot., MgO, CaO, and Na2O) to discriminate four different provenance
groups: (1) mafic detritus, (2) intermediate, dominantly andesite detritus, (3) felsic
plutonic and volcanic detritus, and (4) recycled-mature polycyclic quartzose detritus from
sandstones and mudstones. Major element geochemistry and mineralogy of siliciclastic
rocks (Taylor and McLennan, 1985) is strongly affected by chemical weathering (Fedo et
al., 1996). The characteristics of detrital sediments greatly depend on various geological
processes involved in four major environments/settings encountered during the
sediment’s entire path of denudation from the source to deposition and burial (Sageman

92
and Lyons, 2003). These are: 1) the source area, where climate and tectonic setting might
influence weathering and erosion of bed rock; 2) the transportation route, where different
factors can modify the textural and compositional properties of sediments; 3) the
depositional site, where different physical, chemical, and biological processes constrain
the amount of sediment accumulation; and 4) the burial history during which diagenesis
may further alter sediment characteristics. Plotting Al2O3-(CaO+Na2O)-K2O relationships
in ternary diagrams provides important information about weathering processes,
sedimentary sorting, and identifying certain post-depositional processes. The potential
influence exerted on sediment geochemistry by weathering, detrital sorting, and
diagenesis/metamorphism are reasonably well understood. Trace element ratios of
immobile elements normally reflect source-rock composition rather than the sedimentary
processes (Taylor and McLennan, 1985).
7.2 RESULTS AND INTERPRETATIONS
Major, trace, and rare earth element compositions of Dupi Tila mudrock samples (SS-
W, Sylhet Trough; BS-10, Garo hills; CWSal, Lalmai hills; NWD-56, Stable Platform;
and KS-8, KS-9, KS-10, KS-11, KS-12, KS-13, Sitapahar anticline) from different parts
of the Bengal basin are presented in Appendix F.
7.2.1 MAJOR ELEMENTS
Dupi Tila samples exhibit variations in major oxide (e.g., SiO2, Al2O3, Fe2O3, MgO,
and K2O) concentrations from place to place. Silica (SiO2) is abundant in all samples,
ranging from 54-84% in different parts of the Bengal basin (Fig. 7.1). Samples from the
northwest Stable Platform have the highest concentrations of silica. Concentrations of
Al2O3 is highest in Garo hills regions. Fe2O3 and K2O3 concentrations are are low in
samples from all sites.
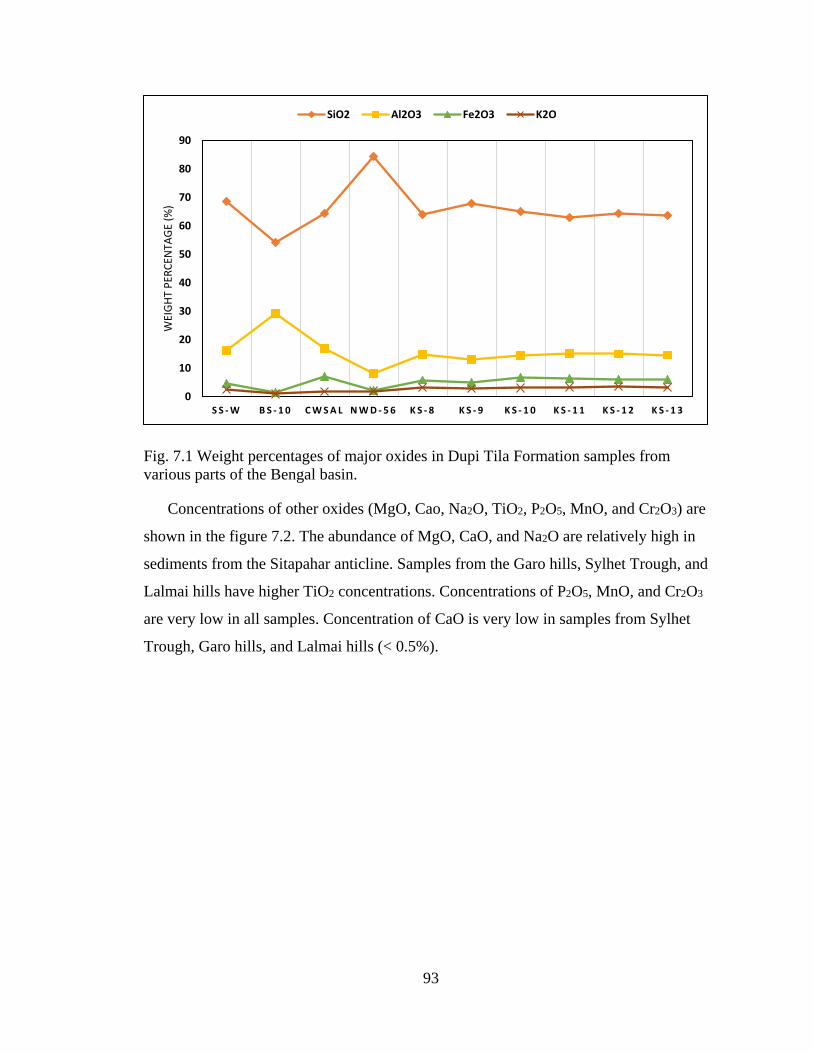
93
Fig. 7.1 Weight percentages of major oxides in Dupi Tila Formation samples from
various parts of the Bengal basin.
Concentrations of other oxides (MgO, Cao, Na2O, TiO2, P2O5, MnO, and Cr2O3) are
shown in the figure 7.2. The abundance of MgO, CaO, and Na2O are relatively high in
sediments from the Sitapahar anticline. Samples from the Garo hills, Sylhet Trough, and
Lalmai hills have higher TiO2 concentrations. Concentrations of P2O5, MnO, and Cr2O3
are very low in all samples. Concentration of CaO is very low in samples from Sylhet
Trough, Garo hills, and Lalmai hills (< 0.5%).
0
10
20
30
40
50
60
70
80
90
S S - W B S - 1 0 C W S A L N W D - 5 6 K S - 8 K S - 9 K S - 1 0 K S - 1 1 K S - 1 2 K S - 1 3
WEI
GH
T P
ERC
ENTA
GE
(%)
SiO2 Al2O3 Fe2O3 K2O
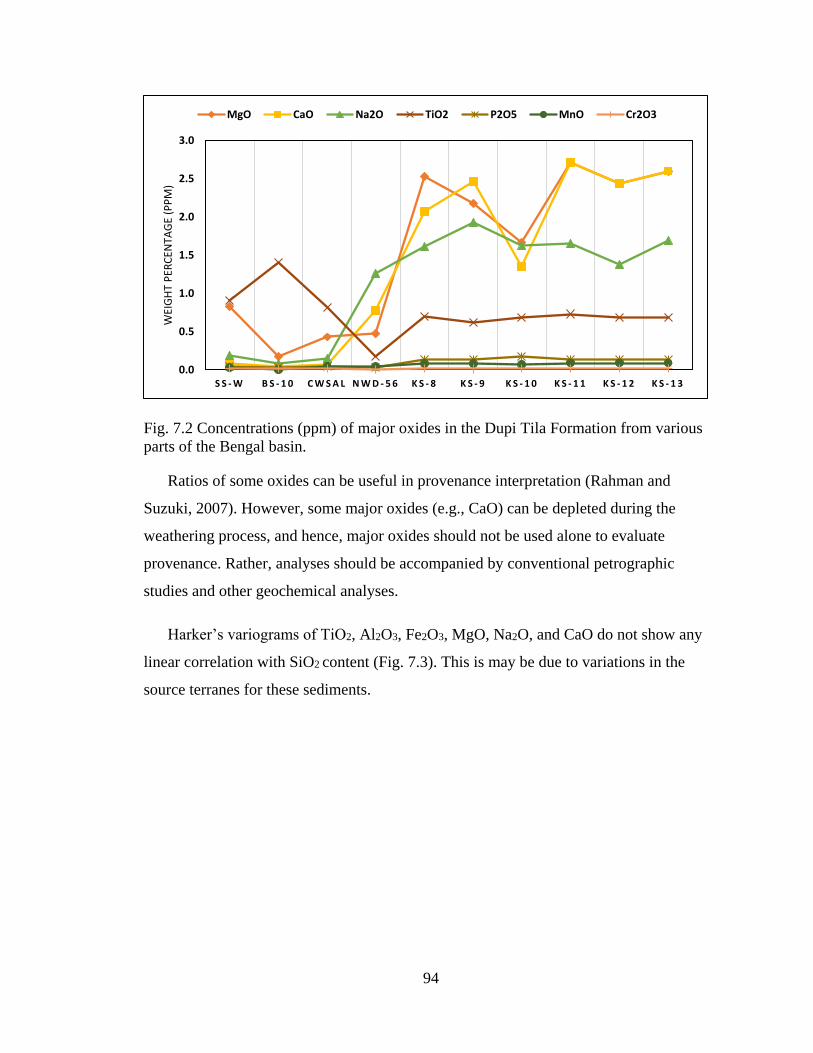
94
Fig. 7.2 Concentrations (ppm) of major oxides in the Dupi Tila Formation from various
parts of the Bengal basin.
Ratios of some oxides can be useful in provenance interpretation (Rahman and
Suzuki, 2007). However, some major oxides (e.g., CaO) can be depleted during the
weathering process, and hence, major oxides should not be used alone to evaluate
provenance. Rather, analyses should be accompanied by conventional petrographic
studies and other geochemical analyses.
Harker’s variograms of TiO2, Al2O3, Fe2O3, MgO, Na2O, and CaO do not show any
linear correlation with SiO2 content (Fig. 7.3). This is may be due to variations in the
source terranes for these sediments.
0.0
0.5
1.0
1.5
2.0
2.5
3.0
S S - W B S - 1 0 C W S A L N W D - 5 6 K S - 8 K S - 9 K S - 1 0 K S - 1 1 K S - 1 2 K S - 1 3
WEI
GH
T P
ERC
ENTA
GE
(PP
M)
MgO CaO Na2O TiO2 P2O5 MnO Cr2O3

95
Fig. 7.3 Harker variograms of major element concentrations in samples from Dupi Tila
Formation (green- Sylhet Trough, red- Garo hills, yellow- Lalmai hills, purple- Stable
Platform, and blue- Sitapahar anticline).
The ratio of K2O and Al2O3 (Fig. 7.4) can be used as an indicator of the original
composition of the Dupi Tila Formation. K2O/Al2O3 ratios are markedly different for clay
minerals and mudrocks. K2O/Al2O3 ratios range from 0-0.3 for clay minerals and from
0.3-0.9 for feldspars (Cox et al., 1995). Illite has a value of 0.28 (Lee, 2000). The ratios
of K2O/Al2O3 in samples from the study area suggest that they contain clay minerals.
0.0
1.0
2.0
3.0
0 50 100C
aO
SiO2
0.0
1.0
2.0
3.0
0 50 100
MgO
SiO2
0.0
2.0
4.0
6.0
8.0
0 50 100
Fe2O
3
SiO2
0.0
0.5
1.0
1.5
2.0
2.5
0 50 100
Na 2
OSiO2
0
5
10
15
20
25
30
35
0 50 100
Al 2
O3
SiO2
0.0
0.5
1.0
1.5
0 50 100
TiO
2
SiO2

96
Fig. 7.4 Variations in K2O/Al2O3 ratios for Dupi Tila samples from study area.
7.2.2 TRACE AND RARE EARTH ELEMENTS
Dupi Tila sediment samples from the study area exhibit variation in trace and rare
earth element (e.g., Ba, Zr, Ni, Sr, Y, Nb, Sc, Th, and La) concentrations from place to
place. All trace elements and rare earth elements are presented and described below.
Trace element data show high concentrations of Ba in Sitapahar anticline area and
low concentrations in the Garo hills area (Fig. 7.5)
Fig. 7.5 Concentrations (ppm) of barium in Dupi Tila Formation samples from various
parts of the Bengal basin.
0
0.05
0.1
0.15
0.2
0.25
0.3
SS-W BS-10 CWSal NWD-56 KS-8 KS-9 KS-10 KS-11 KS-12 KS-13
K2O
/Al 2
O3
0
100
200
300
400
500
600
SS-W BS-10 CWSal NWD-56 KS-8 KS-9 KS-10 KS-11 KS-12 KS-13
Co
nce
ntr
atio
ns
(pp
m)
Ba

97
Zirconium concentrations (Fig. 7.6) are also variable from place to place. Sediments
from the Garo hills, Lalmai hills and Sylhet Trough have high Zr contents, whereas
sediments from the Stable Platform study have the lowest amount of Zr concentrations.
Fig. 7.6 Concentrations (ppm) of zirconium in the Dupi Tila Formation samples from
various part of the Bengal basin.
The abundance of rare earth elements is not uniform in all study areas (Fig. 7.7). The
distribution of strontium (Sr) is high in Sitapahar anticline area. Ni, Y, Nb, and Sc
concentrations exhibit a similar trend in all areas. The Stable platform samples have low
rare earth elements concentrations compared to the other areas. A negative correlation is
observed between Zr and Sr.
0
50
100
150
200
250
300
350
SS-W BS-10 CWSal NWD-56 KS-8 KS-9 KS-10 KS-11 KS-12 KS-13
Co
nce
ntr
atio
ns
(pp
m)
Zr

98
Fig. 7.7 Concentrations (ppm) of trace elements in the Dupi Tila samples from various
parts of the Bengal basin.
7.3 WEATHERING AND DIAGENESIS
Weathering and diagenesis in source terranes can be estimated based on chemical
composition of sediments. The A-CN-K (Al2O3 – CaO+Na2O-K2O) plot in Figure 7.8
shows that most samples fall on the Al2O3 - K2O line close to the Al2O3 end member,
indicating highly weathered source terranes. Samples from the Stable platform and
Sitapahar anticline fall into the average granite field, whereas those from the Sylhet
Trough, Lalmai hills and Garo hills fall into the illite and kaolinite-chlorite fields. This
suggests that weathering in source regions for the latter three areas was more intense
weathering than in the Sitapahar anticline and Stable Platform source areas.
0
20
40
60
80
100
120
140
160
180
200
SS-W BS-10 CWSal NWD-56 KS-8 KS-9 KS-10 KS-11 KS-12 KS-13
Co
nce
ntr
atio
ns
(pp
m)
Ni Sr Y Nb Sc
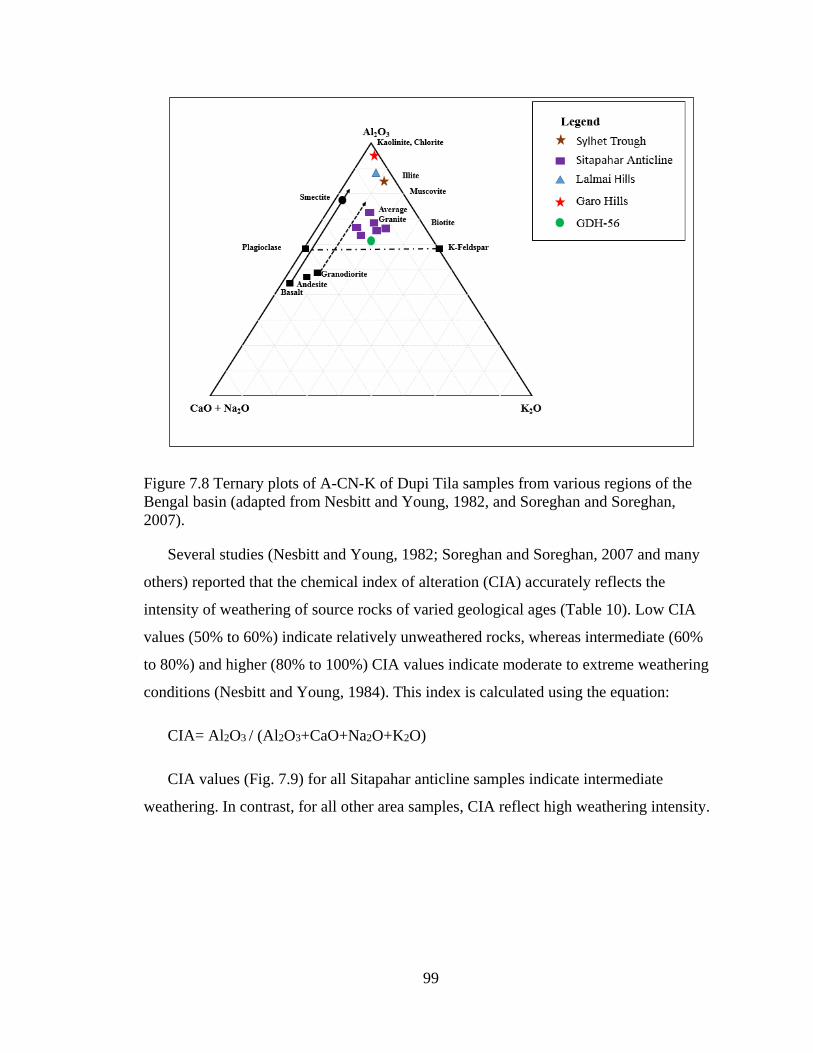
99
Figure 7.8 Ternary plots of A-CN-K of Dupi Tila samples from various regions of the
Bengal basin (adapted from Nesbitt and Young, 1982, and Soreghan and Soreghan,
2007).
Several studies (Nesbitt and Young, 1982; Soreghan and Soreghan, 2007 and many
others) reported that the chemical index of alteration (CIA) accurately reflects the
intensity of weathering of source rocks of varied geological ages (Table 10). Low CIA
values (50% to 60%) indicate relatively unweathered rocks, whereas intermediate (60%
to 80%) and higher (80% to 100%) CIA values indicate moderate to extreme weathering
conditions (Nesbitt and Young, 1984). This index is calculated using the equation:
CIA= Al2O3 / (Al2O3+CaO+Na2O+K2O)
CIA values (Fig. 7.9) for all Sitapahar anticline samples indicate intermediate
weathering. In contrast, for all other area samples, CIA reflect high weathering intensity.

100
Table 10. Ratios of select oxides and CIA (Chemical alteration index).
Sites Log(SiO2/Al2O3) Log(Fe2O3/K2O) CIA (%)
SS-W 0.63 0.22 93.65
BS-10 0.27 0.25 99.02
CWSal 0.58 0.22 96.27
NWD-56 1.02 0.62 76.30
KS-8 0.62 0.05 70.53
KS-9 0.63 0.27 66.67
KS-10 0.71 0.24 75.76
KS-11 0.65 0.35 67.98
KS-12 0.62 0.27 70.53
KS-13 0.63 0.21 67.95
Fig. 7.9 CIA values of Dupi Tila Formation from different parts of the Bengal basin,
Bangladesh (adepted from Nesbitt and Young, 1982, and Soreghan and Soreghan, 2007).
7.4 TECTONIC SETTINGS
Various chemical and petrographic (mineralogical) approaches can be used to
determine provenance from bulk samples. Von Eynatten et al. (2003) concluded that bulk
chemical analyses, including trace elements, are more effective than the study of heavy
minerals, largely because identification and counting of heavy minerals required skill and
0.00% 20.00% 40.00% 60.00% 80.00% 100.00%
SS-W
BS-10
CWSal
NWD-56
KS-8
KS-9
KS-10
KS-11
KS-12
KS-13
Chemical Index of alteration (CIA)
Low High Intermediate
LEGEND
Sylhet Trough
Stable Platform
Lalmai hills
Garo hills
Sitapahar anticline

101
was time-consuming. In contrast, rock chemistry is a consequence of the mineralogical
composition of a rock, so that petrographic studies are intrinsically more informative than
bulk rock chemistry.
Sandstones from specific tectonic regimes possess characteristic chemical
compositions. SiO2 content and K2O/Na2O ratios have been utilized by several workers
(e.g., Roser and Korsch, 1986; Sitaula, 2009) to discriminate tectonic settings of the
source area. The SiO2 vs K2O/Na2O plot for all studied samples in figure 7.10 reflects an
active continental provenance. No samples shows Island Arc or Passive Margin
provenances.
Figure 7.10 Dupi Tila samples plotted in the tectonic discrimination diagram (SiO2 vs
K2O/Na2O) of Roser and Korsch (1986).
According to Bhatia and Crook (1986), trace element plots of La-Th-Sc can be useful
in the evaluation of tectonic settings of source areas. The La-Th-Sc plot in Figure 7.11

102
shows that all of the Dupi Tila samples fall in a continental island arc field.
Figure 7.11 Dupi Tila samples from different regions of the Bengal basin plotted in La-
Th-Sc ternary diagram. Tectonic fields are taken from Bhatia and Crook (1986).
Due to their immobility, TiO2 and the trace element Zr can be used to discriminate
among igneous source-rock types (Hayashi et al., 1997). The TiO2 vs Zr plot in Figure
7.12 indicates felsic source rocks for most studied samples. However, the Dupi Tila
samples from the Garo hills predominantly fall into the intermediate igneous rock field.

103
Figure 7.12 TiO2 vs Zr plots of Dupi Tila samples from various regions of the Bengal
basin. Fields are taken from Hayashi et al. (1997).
104
Chapter 8: DISCUSSION
8.1 PROVENANCE
Sandstone petrographic studies, heavy mineral analyses, sandstone chemistry, and
bulk rock chemistry of mudrocks depict an orogenic detrital history for Dupi Tila
Formation. Modal analyses of the sandstones of the Dupi Tila Formation from the
Sitapahar anticline (Qt64F10L27), Garo hills (Qt88F2L10), Northwest Stable Platform
(Qt87F6L7), Sylhet Trough (Qt66F9L25) and Lalmai hills (Qt64F6L30) indicate that the
sandstones were derived from orogenic provenances. The distribution of sedimentary and
metamorphic lithic fragments in the provenance field indicate a source of low- to
intermediate-grade metamorphic terrains. The heavy mineral analyses supports the Dupi
Tila Formation has an orogenic source. The relative abundance of aluminosilicates and
ultrastable minerals in the Dupi Tila Formation throughout the Bengal basin reflect
unroofing of deeper crustal levels. Garnet, tourmaline, epidote and chloritoid chemistry
also supports derivation from a low- to high-grade metamorphic facies rocks. Finally, the
chemical indices of alteration from the bulk rock chemistry of Dupi Tila mudrocks reflect
an active continental provenance of felsic rocks.
The Pliocene-Pleistocene Dupi Tila Formation is most likely derived from the
Himalayas and the Indo-Burman ranges. Based on modal compositional analyses of all
the samples, a nearby source is suggested. Possible sources also include the Mikir hills,
and Mishmi hills to the northeast. The Shillong Plateau, which was uplifted during
Pliocene time along the northern margin of the Bengal basin (Johnson and Nur Alam,
1991), may have provided detritus proximal to the uplift and contributed sand especially
rich in sedimentary lithic fragments eroded from cover units.
105
The Dupi Tila Formation has more untwinned potassium feldspars than plagioclase,
suggesting a plutonic source and/or an increase in mechanical weathering relative to
chemical weathering in the source areas (Uddin and Lundberg, 1998b). The presence of
andalusite from heavy mineral analyses also supports magmatic pluton and Miocene
leucogranite in central-east Himalaya (Visona et al., 2012). Miocene leucogranites of the
High Himalayan Crystalline terrane (France-Lanord et al., 1993) may have been a key
source of the feldspars (Harrison et al., 1997; and many others). Mountain building in the
eastern Himalaya and Indo-Burman ranges was significant and the orogenic fronts were
presumably encroaching on the basin from the north and east by the Pliocene-Pleistocene
(Uddin and Lundberg, 1998b). Orthopyroxenes, especially abundant hypersthene, further
suggest unroofing, including that of ophiolitic rocks.
Based on sandstone modal analyses and heavy mineral study, i.e., the Garo hills
samples show distinct deviation from samples from other localities. They contain more
quartz, fewer lithic fragments, and different heavy mineral assemblages. It is possible that
the Garo hills samples are not derived from the Dupi Tila Formation, but instead are
older.
8.2 COMPARISON WITH THE UPPER SIWALIK
Neogene Siwalik sediments have been well studied along the strike of the Himalayas;
e.g., in the western Himalayan foreland basin (i.e., Opdyke et al., 1982; Johnson et al.,
1985; Critelli et al., 1994), in Nepal (Tamrakar and Syangbo, 2014), in Darjeeling
(Kundu and Mukul, 2011), near the eastern syntaxis of the Himalayas (i.e., Chirouze et
al., 2011), and the Upper Irrawaddy Formation in Myanmar (Licht et al., 2014).
However, comparison of detrital history of Dupi Tila Formation with equivalent Upper
Siwalik Formation has not yet been carried out in the Bengal basin.
The Dupi Tila sediment shows fining upward sequences, whereas the Upper Siwalik
sediments are coarsening upward and relatively proximal to the orogenic belt. Both the
Upper Siwalik and Dupi Tila Formation sourced from the deeper part of the orogenic
system. Like the Upper Siwaliks, the sandstone modal composition and detrital heavy
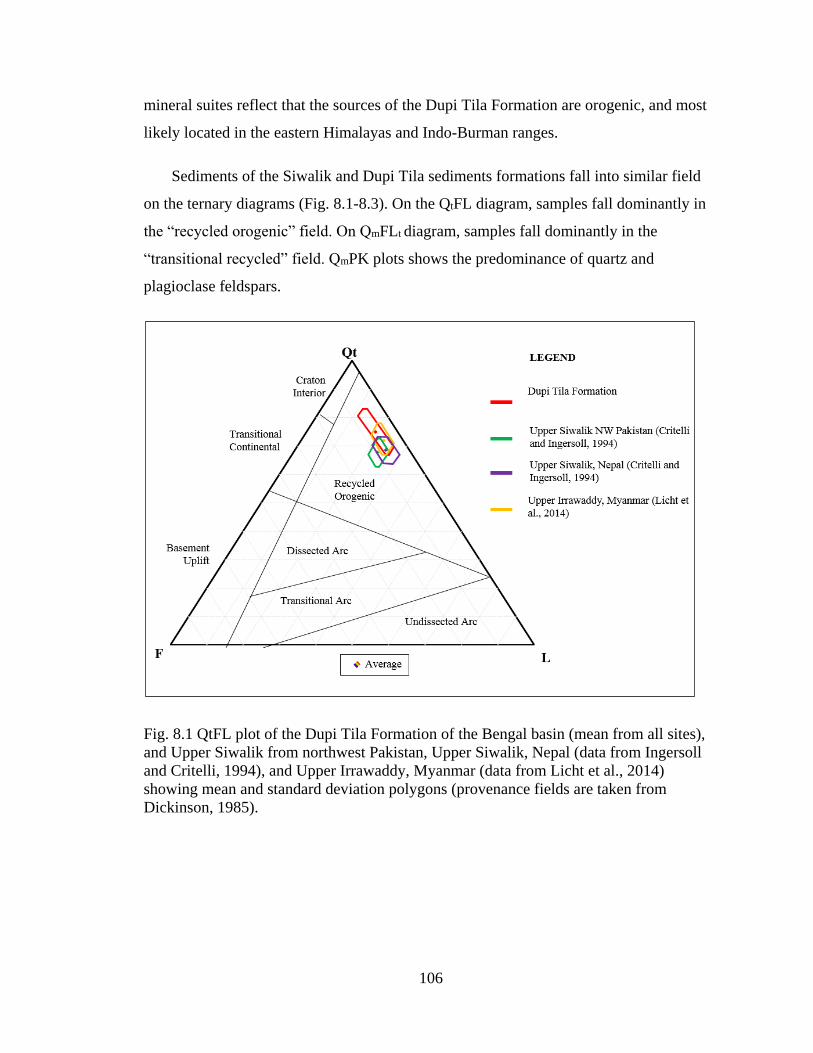
106
mineral suites reflect that the sources of the Dupi Tila Formation are orogenic, and most
likely located in the eastern Himalayas and Indo-Burman ranges.
Sediments of the Siwalik and Dupi Tila sediments formations fall into similar field
on the ternary diagrams (Fig. 8.1-8.3). On the QtFL diagram, samples fall dominantly in
the “recycled orogenic” field. On QmFLt diagram, samples fall dominantly in the
“transitional recycled” field. QmPK plots shows the predominance of quartz and
plagioclase feldspars.
Fig. 8.1 QtFL plot of the Dupi Tila Formation of the Bengal basin (mean from all sites),
and Upper Siwalik from northwest Pakistan, Upper Siwalik, Nepal (data from Ingersoll
and Critelli, 1994), and Upper Irrawaddy, Myanmar (data from Licht et al., 2014)
showing mean and standard deviation polygons (provenance fields are taken from
Dickinson, 1985).

107
Fig. 8.2 QmFLt plot of the Dupi Tila Formation of the Bengal basin (mean from all sites),
and Upper Siwalik from northwest Pakistan, Upper Siwalik, Nepal (data from Ingersoll
and Critelli, 1994), and Upper Irrawaddy, Myanmar (data from Licht et al., 2014)
showing mean and standard deviation polygons (provenance fields are taken from
Dickinson, 1985).

108
Fig. 8.3 QmPK plot of the Dupi Tila Formation of the Bengal basin (mean from all sites),
and Upper Siwalik from northwest Pakistan, Upper Siwalik, Nepal (data from Ingersoll
and Critelli, 1994), and Upper Irrawaddy, Myanmar (data from Licht et al., 2014)
showing mean and standard deviation polygons.
The Dupi Tila Formation from different parts of the Bengal basin also compare
favorably (Fig. 8.4) with those of the Upper Siwalik of the northwestern Himalaya
(Chaudrhri, 1972; Gill, 1984) with respect to heavy mineral assemblages. Both units are
characterized by high abundances of sillimanite, staurolite, ZTR, garnet, andalusite,
epidote-group minerals, and kyanite minerals. Sillimanite is the index mineral for both of
the formations.

109
Fig. 8.4 Average heavy mineral frequency of distribution of Upper Siwaliks of the
northwestern Himalaya (Chaudhri, 1972; Gill, 1984) and Dupi Tila Formation from
several parts of the Bengal basin (ZTR- Zircon-Tourmaline-Rutile).
8.3 COMPARISON WITH OLDER BENGAL BASIN SANDSTONE UNITS
Data obtained from modal analysis in previous studies of the Eocene Cherra and
Kopili Formations (Uddin and Lundberg, 1998b), Oligocene Barail Formation (Rahman,
2008), Early Miocene Bhuban Formation (Uddin and Lundberg, 1998b), Middle Miocene
Boka Bil Formation (Uddin and Lundberg, 1998b), Late Miocene Tipam Sandstone
(Rahman, 2008) are plotted along with the Dupi Tila data in figures 8.5-8.8. QtFL and
QmFLt plots indicate that older formations are relatively more quartzose and feldspathic
(Fig. 8.5, 8.6). Although the Eocene sandstones are completely non-orogenic, however,
Oligocene and younger units including the Dupi Tila Formation, seem to have a ‘recycled
orogenic’ source. The Miocene units also are more feldspathic compared to the Dupi Tila
Formation, which suggest a change in sediment dispersal in the Bengal basin. In QmPK
monocrystalline plot, the Dupi Tila sediments resemble that of Middle Miocene Bhuban
Formation (Fig. 8.7).
0 10 20 30
Opaques
ZTR
Silimanite
Kyanite
Andalusite
Epidote
Garnet
Chlorite+ Chloritoid
Hornblende
Pyroxene
Staurolite
Upper Siwalik Dupi Tila
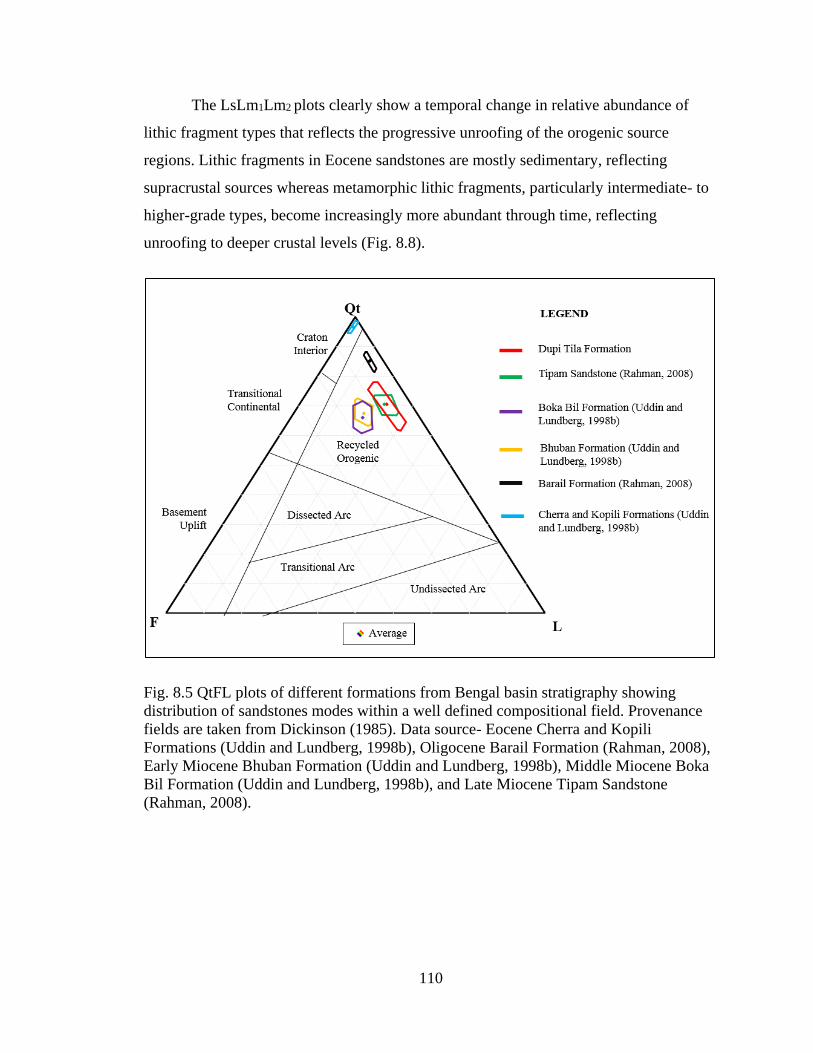
110
The LsLm1Lm2 plots clearly show a temporal change in relative abundance of
lithic fragment types that reflects the progressive unroofing of the orogenic source
regions. Lithic fragments in Eocene sandstones are mostly sedimentary, reflecting
supracrustal sources whereas metamorphic lithic fragments, particularly intermediate- to
higher-grade types, become increasingly more abundant through time, reflecting
unroofing to deeper crustal levels (Fig. 8.8).
Fig. 8.5 QtFL plots of different formations from Bengal basin stratigraphy showing
distribution of sandstones modes within a well defined compositional field. Provenance
fields are taken from Dickinson (1985). Data source- Eocene Cherra and Kopili
Formations (Uddin and Lundberg, 1998b), Oligocene Barail Formation (Rahman, 2008),
Early Miocene Bhuban Formation (Uddin and Lundberg, 1998b), Middle Miocene Boka
Bil Formation (Uddin and Lundberg, 1998b), and Late Miocene Tipam Sandstone
(Rahman, 2008).

111
Fig. 8.6 QmFLt plot of different formations from Bengal basin stratigraphy showing
distribution of sandstones modes within a well defined compositional field. Provenance
fields are taken from Dickinson (1985). Data source- Eocene Cherra and Kopili
Formations (Uddin and Lundberg, 1998b), Oligocene Barail Formation (Rahman, 2008),
Early Miocene Bhuban Formation (Uddin and Lundberg, 1998b), Middle Miocene Boka
Bil Formation (Uddin and Lundberg, 1998b), and Late Miocene Tipam Sandstone
(Rahman, 2008).
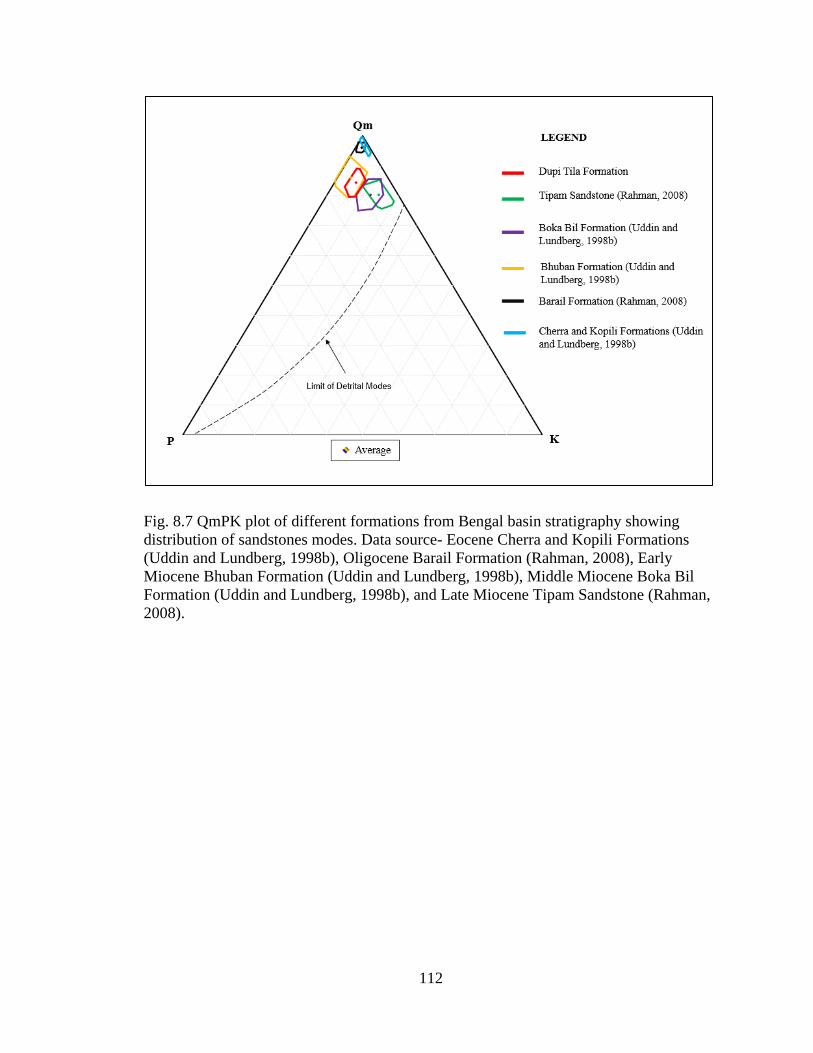
112
Fig. 8.7 QmPK plot of different formations from Bengal basin stratigraphy showing
distribution of sandstones modes. Data source- Eocene Cherra and Kopili Formations
(Uddin and Lundberg, 1998b), Oligocene Barail Formation (Rahman, 2008), Early
Miocene Bhuban Formation (Uddin and Lundberg, 1998b), Middle Miocene Boka Bil
Formation (Uddin and Lundberg, 1998b), and Late Miocene Tipam Sandstone (Rahman,
2008).
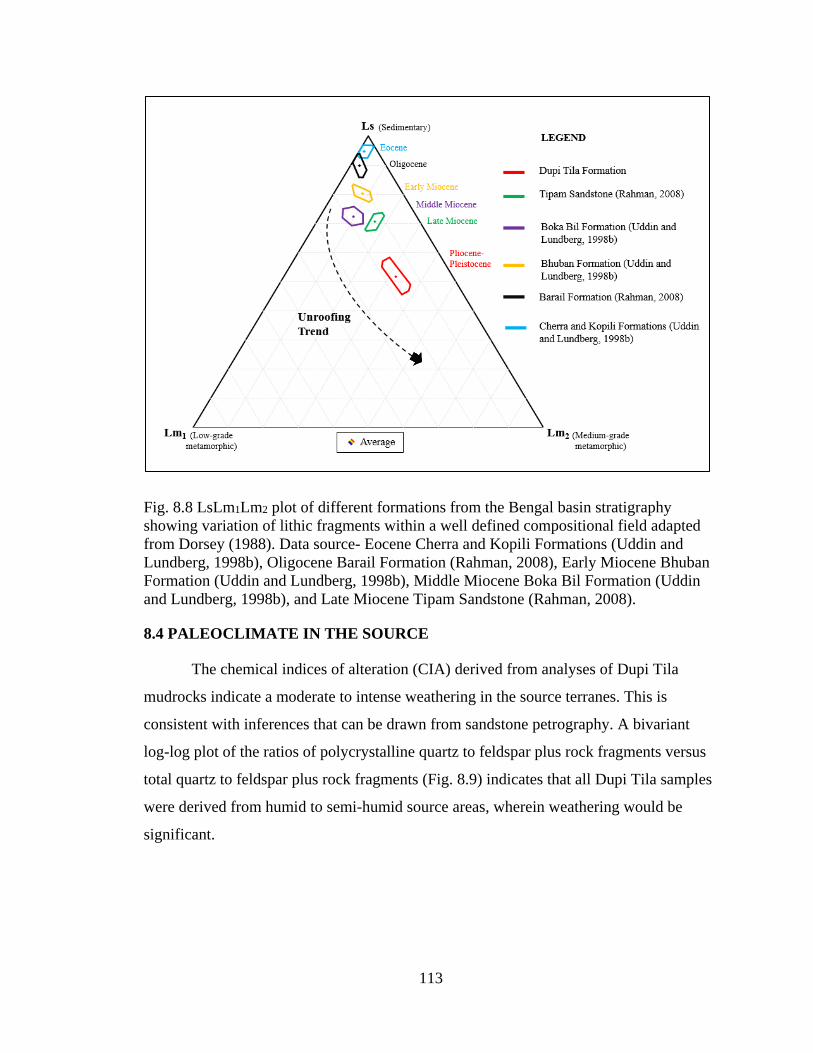
113
Fig. 8.8 LsLm1Lm2 plot of different formations from the Bengal basin stratigraphy
showing variation of lithic fragments within a well defined compositional field adapted
from Dorsey (1988). Data source- Eocene Cherra and Kopili Formations (Uddin and
Lundberg, 1998b), Oligocene Barail Formation (Rahman, 2008), Early Miocene Bhuban
Formation (Uddin and Lundberg, 1998b), Middle Miocene Boka Bil Formation (Uddin
and Lundberg, 1998b), and Late Miocene Tipam Sandstone (Rahman, 2008).
8.4 PALEOCLIMATE IN THE SOURCE
The chemical indices of alteration (CIA) derived from analyses of Dupi Tila
mudrocks indicate a moderate to intense weathering in the source terranes. This is
consistent with inferences that can be drawn from sandstone petrography. A bivariant
log-log plot of the ratios of polycrystalline quartz to feldspar plus rock fragments versus
total quartz to feldspar plus rock fragments (Fig. 8.9) indicates that all Dupi Tila samples
were derived from humid to semi-humid source areas, wherein weathering would be
significant.
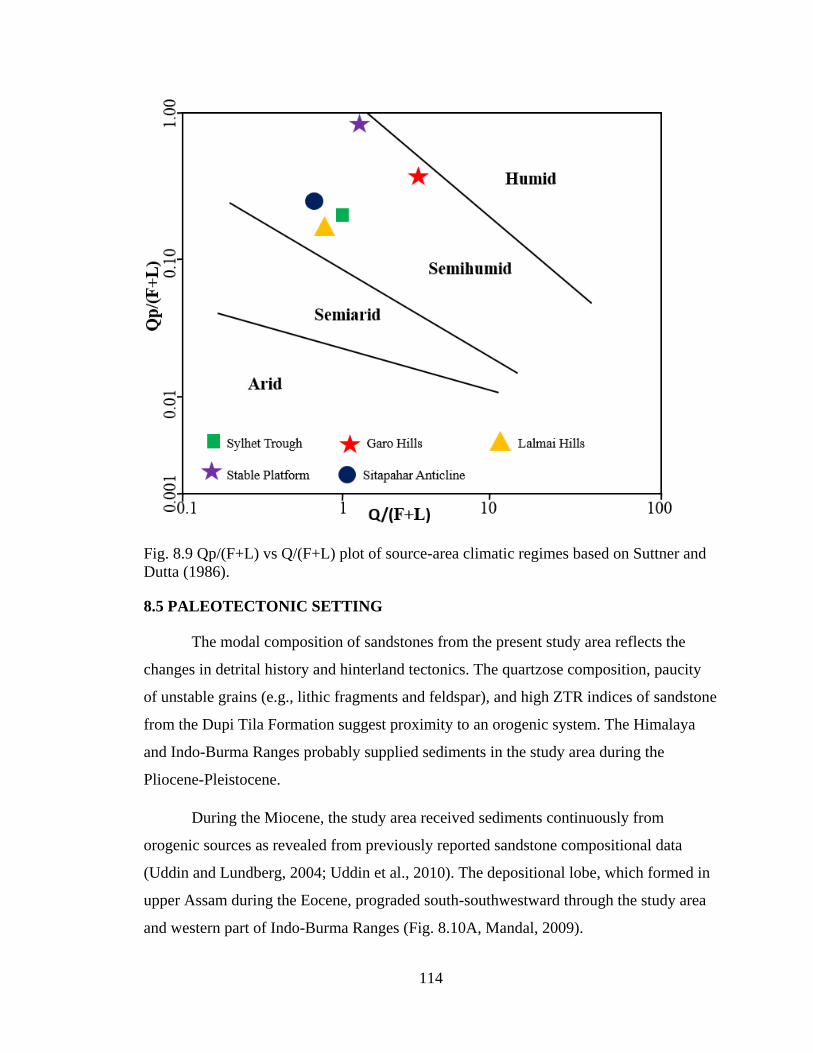
114
Fig. 8.9 Qp/(F+L) vs Q/(F+L) plot of source-area climatic regimes based on Suttner and
Dutta (1986).
8.5 PALEOTECTONIC SETTING
The modal composition of sandstones from the present study area reflects the
changes in detrital history and hinterland tectonics. The quartzose composition, paucity
of unstable grains (e.g., lithic fragments and feldspar), and high ZTR indices of sandstone
from the Dupi Tila Formation suggest proximity to an orogenic system. The Himalaya
and Indo-Burma Ranges probably supplied sediments in the study area during the
Pliocene-Pleistocene.
During the Miocene, the study area received sediments continuously from
orogenic sources as revealed from previously reported sandstone compositional data
(Uddin and Lundberg, 2004; Uddin et al., 2010). The depositional lobe, which formed in
upper Assam during the Eocene, prograded south-southwestward through the study area
and western part of Indo-Burma Ranges (Fig. 8.10A, Mandal, 2009).
115
During Pliocene time, sediment continued to be delivered from the orogenic belts
into an actively prograding Bengal foreland basin. The Shillong Plateau, which was
uplifted in the Pliocene along the northern margin of the Bengal basin, may have
provided another source for detritus proximal to the uplift (Fig. 8.10B, C; Johnson and
Nur Alam, 1991). Due to continuous crustal shortening, the Indo-Burman Ranges became
a structural high towards the end of the Miocene-Pliocene and may have become a source
of detritus in the Bengal basin. This is indicated by the presence of pyroxenes in the Dupi
Tila sandstones. Due to the uplift of the Shillong Plateau, the paleo-Brahmaputra shifted
its course from east to west (Fig. 8.10D, Uddin and Lundberg, 1999). Due to the presence
of Mn-rich garnet (spessartine) in the Dupi Tila Formation, it can be concluded that, not
only there is sediment contribution from orogeny, but the Rajmahal traps might also have
contributed to the Bengal basin.
Similarly, paleo-Ganges sedimentary fluxes came from the western side of the
Bengal basin (Stable Platform) as evidenced by the Tista fan depositing at northwestern
end of the Bengal basin (Fig. 8.10C, Reimann, 1993).

116
Fig. 8.10 Paleogeographic reconstruction Maps of the study area (in red box) with
reference to the Bengal basin. Dotted textures are the deposition lobe prograding
basinward with time and progressive move of depocenters. Brown shaded areas are the
extent of deposits of the Dupi Tila Formation. Blue lines are rivers. The Shlillong Plateau
uplifted during the Pliocene (A- Miocene, after Mandal, 2009, B- Pliocene, C-
Pleistocene, and D-Recent, Google Earth).
A
C D
B
Miocene Pliocene
Pleistocene Recent

117
Chapter 9: CONCLUSIONS
Based on sandstone modal composition, heavy mineral assemblages, electron probe
analyses and whole rock chemistry of mudrocks, the following inferences can be drawn
from this study:
1. The Dupi Tila sediments of the Bengal basin are orogenic. Clastic sediments were
derived from the exhumation of the Himalayas and Indo-Burman Ranges.
2. Sandstone compositions indicate that sediments of the Dupi Tila Formation are
predominantly comprised of monocrystalline quartz, polycrystalline quartz,
plagioclase feldspar, orthoclase feldspar and metamorphic (primarily Lm2) and
sedimentary lithic fragments.Volcanic lithic fragments are absent. Their
compositions indicate that Dupi Tila sediments were derived from low- to
intermediate-grade metamorphic and granitoid terranes.
3. The presence of sillimanite (fibrolites), kyanite, andalusite, staurolite, and ZTR
minerals suggest that the sediments were sourced from the low- to high-grade
metamorphic rocks.
4. The abundance of almandine garnet indicates amphibole and granulite facies
provenances. The presence of Mn-rich garnets in the Stable platform samples
indicate sediments were partly sourced from the Rajmahal volcanic trap.
Tourmaline chemistry suggests that sediments were sourced from Al-saturated
metapelites, clac-silicates, metasammites, Li –bearing pegmatites, granitoid
pegmatites, and aplites. Epidote compositions indicate derivation from relatively
high-grade metamorphic rocks of epidote-amphibolite facies. Chloritoid
chemistry suggests a source from high-pressure blueschist metamorphic facies.

118
5. Bulk sediment chemistry data indicate that the sediments were sourced from felsic
igneous rocks (i.e., average granitoid terranes) in an active continental
provenance. The chemical indices of alteration indicate intense weathering in the
source terranes.
6. Sandstone modal studies indicate that the Upper Siwalik sediments from the
northwest Pakistan, Nepal, and Upper Irrawaddy Formation from Myanmar are
very similar to those of the Dupi Tila Formation. Sillimanite is the index mineral
for both the Upper Siwaliks and Dupi Tila Formation.
7. When compared with sandstones of older Cenozoic sequences of the Bengal
basin, the sedimentary and metamorphic lithic fragments of the Dupi Tila
Formation strongly show a progressive unroofing of the Himalayas and Inro-
Burman ranges.
8. Modal compositions and heavy mineral distributions suggest the Dupi Tila
sediments form the Garo hills are different than other Dupi Tila sequences of the
basin. This calls into question the true stratigraphic position of the Dupi Tila at
Garo hills.
119
REFERENCES
Alam, A.K.M. M., Xie, S., and Chowdhury, S.Q., 2009. Clay Mineralogy and Diagenesis
of Shale: A Case Study from the Mio-Pliocene Tipam and Dupi Tila Shales of
Bandarban Anticline, Bandarban Hill Tracts, Bangladesh: Journal of Applied
Sciences, v. 9, p. 2770-2777.
Alam, M., Alam, M.M., Curray, J.R., Chowdhury, M.L.R., and Gani, M.R., 2003. An
overview of the sedimentary geology of the Bengal basin in relation to the
regional tectonic framework and basin-fill history: Sedimentary Geology, v. 155,
p. 179–208.
Alam, M.I., 2011. Petrofacies and Paleotectonic Evolution of Permo-Carboniferous
Gondwanan Sequences of the Bengal basin, Bangladesh [unpublished M.S.
Thesis]: Auburn University, Auburn, AL, 134 p.
Amano, K., and Taira, A., 1992. Two-phase uplift of Higher Himalayas since 17 Ma:
Geology, v. 20, p. 391-394.
Auden, J. B., 1935. Traverses in the Himalaya: Record of Geological Survey of India, v.
69, p. 123–169.
Bakhtine, M.I., 1966. Major tectonic features of Pakistan, Part II, The eastern province:
Science and Industry, v. 4, p. 89-100.
Bhatia, M., 1983. Plate tectonics and geochemical composition of sandstones: Journal of
Geology, v. 91, p. 611-627.
Bhatia, M. R., and Crook, K. A. W., 1986. Trace element characteristics of greywacke
and tectonic setting discrimination of sedimentary basins: Contributions to
Mineralogy and Petrology, v. 92, p. 181-193.
Blatt, H., 1967. Provenance determinations and recycling of sediments: Journal of
Sedimentary Research, v. 37.
Basu, A., 1976. Petrology of Holocene fluvial sand derived from plutonic source rocks:
implications to paleoclimatic interpretation: Journal of Sedimentary Research, v.
46.
120
Basu, A., Young, S. W., Suttner, L. J., James, W. C., and Mach, G. H., 1975.
Reevaluation of the use of undulatory extinction and polycrystallinity in detrital
quartz for provenance interpretation: Journal of Sedimentary Petrology, v. 45, p.
873-882.
Bateman, R.M., and Catt, J.A., 1985. Modification of heavy mineral assemblages in
English coversands by acid pedochemical weathering: Catena, v. 12, p. 1-21.
Bilham, R., and England, P., 2001. Plateau ‘pop-up’ in the great 1897 Assam earthquake:
Nature, v. 410, p. 806-809.
Buddington, A. F., AND Lindsley, D. H., 1964. Iron-titanium oxide minerals and
synthetic equivalents: Journal of Petrology, v. 5, p. 310-357.
Burbank, D. W., Beck, R. A., and Mulder, T., 1996. The Himalayan Foreland Basin: In
the Tectonic evolution of Asia: Cambridge University Press, p. 149-188.
Catlos, E.J., Harrison, T.M., Manning, C.E., Grove, M., Rai, S.M., and Hubbard, M.S.,
2002. Records of the evolution of the Himalayan orogen from in situ Th-Pb ion
microprobe dating of Monazite: Eastern Nepal and western Garhwal: Journal of
Asian Earth Sciences, v. 20, p. 459-479.
Cerveny, P.F., 1986. Uplift and Erosion of the Himalaya over the past 18 Million years:
Evidence from fission track dating of detrital zircons and heavy mineral analysis:
unpublished M.S. thesis, Dartmouth College, 198 p.
Chaudhri, R.S., 1972. Heavy minerals from the Siwalik formations of the northwestern
Himalayas: Sedimentary Petrology, v. 8, p. 77-82.
Chirouze, F., Dupont-Nivet, G., Huyghe, P., Van der Beek, P., Chakraborti, T., Bernet,
M., and Erens, V., 2011. Magnetostratigraphy of the Neogene Siwalik Group in
the far eastern Himalaya: Kameng section, Arunachal Pradesh, India: Asian Earth
Sciences, v. 44, p. 117-135.
Chowdhury, N.U.Md.K., 2014. Paleogeographic reconstruction of part of Eastern
Gondganaland: Paterofacies and Detrital Geochronologic study of Permo-
Carboniferous Gondwanan Sequences of India and Bangladesh: M.S. Thesis
(unpublished), 169 p.
Chopin, C., and Schreyer, P., 1983. A unique magnesiochloritoid-bearing, highpressure
assemblage from the Monte Rosa, Western Alps: petrologic and 40Ar-39Ar
radiometric study: Contribution of Mineral Petrology v. 87, p. 388-398.
Clark, M.K., and Bilham, R., 2008. Miocene rise of the Shillong Plateau and the
beginning of the end for the Eastern Himalaya: Earth and Platetary Science
Letters, v. 269, p. 337-351.
121
Cox, R., Lowe, D. R., and Cullers, R. L., 1995. The influence of sediment recycling and
basement composition on evolution of mudrock chemistry in the southwestern
United States: Geochimica et Cosmochimica Acta, v. 59, no. 4, p. 2919-2940.
Critelli, S., and Ingersoll, R.V., 1994. Sandstone Petrology and Provenance of the Siwalik
Group (NW Pakistan and WS Nepal): Journal of Sedimentary Research, v. 64, p.
815-823.
Curray, J.R., 1991. Geological history of the Bengal geosyncline: Journal of Association
of Exploration of Geophysicist XII, v. 12, p. 209-219.
Curray, J.R., and Moore, D.G., 1974. Sedimentary and tectonic processes of the Bengal
deep-sea fan and geosyncline: in Burk, C.A., and Drake, C.L., eds., The Geology
of Continental Margins: New York, Springer-Verlag, p. 617-628.
Curray, J. R., Moore, D. G., Lawver, L. A., Emmel, F. J., Taitt, R. W., Henry, M., and
Kieckhefer, R., 1979. Tectonics of the Andaman Sea and Burma, in Watkins, J.S.,
Montadert, L., and Dickinson, P., eds., Geological and geophysical investigations
of continental margins: American Association of Petroleum Geologists, Memoir
29, p. 189-198.
Darby, D. A., 1984. Trace elements in ilmenite: a way to discriminate provenance or age
in coastal sands: Geological Society America Bulletin, v. 95, p. 1208-1218.
Darby, D. A., Tsang, Y. W., and Council IIl, E. A., 1985. Detrital ilmenite composition:
implications for coastal sand sources and dispersal pathways: Geological Society
of America Abstract Program, v. 17, p. 559.
Darby, D.A., Tsang, Y.W., 1987. Variation in ilmenite element composition within and
among drainage basins: implications for provenance: Journal of Sedimentary
Petrology, v. 57, p. 831–838.
DeCelles, P.G., Gehrels, G.E., Quade, J., Ojha, T.P., Kapp, P.A., and Upreti, B.N., 1998.
Neogene foreland basin deposits, erosional unroofing, and the kinematic history
of the Himalayan fold-thrust belt, western Nepal: Geological Society of America
Bulletin, v. 110, p. 2-21.
DeCelles, P.G., Robinson, D.M., Quade, J., Ojha, T.P., Garzione, C.N., Copeland, P., and
Upreti, B.N., 2001. Stratigraphy, structure, and tectonic evolution of the
Himalayan fold-thrust belt in western Nepal: Tectonics, v. 20, p. 487-509.
Decelles, P.G., Gehrels, G.E., Najman, Y., Martin, A.J., Carter, A., and Garzanti, E.,
2004. Detrital Geochronology and geochemistry of Cretaceous-early Miocene
strata of Nepal: implications for timing and diachroneity of initial Himalayan
orogenesis: Earth and Planetary Science Letters, v. 277, p. 313-330.
122
Deer, W.A., Howie, R.A., and Zussman, J., 1992. Rock-Forming Minerals (2nd ed.):
London, Longman Scientific Technical, Harlow, United Kingdom, 696 p.
Dickinson, W.R., 1970. Interpreting detrital modes of greywacke and arkose: Journal of
Sedimentary Petrology, v. 40, p. 695-707.
Dickinson, W.R., and Suczek, C.A., 1979. Plate tectonics and sandstone compositions:
American Association of Petroleum Geologist Bulletin, v. 63, p. 2164-2182.
Dickinson, W.R., 1982. Composition of sandstones in Circum-Pacific subduction
complexes and fore-arc basins: American Association of Petroleum Geologists
Bulletin, v. 66, p. 121-137.
Dickinson, W.R., 1985. Interpreting provenance relations from detrital modes of
sandstone, in Zuffa, G.G., ed., Reading Provenance from Aranites: Dordecht, The
Netherlands, Riedel, v. 148, p. 333-361.
Dollase, W.A., 1971. Refinement of the crystal structures of epidote, allanite and
hancockite: American Mineralogist, v. 56, p. 447-464.
Dorsey, R. J., 1988. Provenance evolution and unroofing history of a modern arc
continent collision: Evidence from petrography of Plio-Pleistocene sandstones,
eastern Taiwan: Journal of Sedimentary Petrology, v. 58, p. 208-218.
Dryden, A.L., and Dryden, C., 1946. Comparative rates of weathering of some common
heavy minerals: Journal of Sedimentary Petrology, v. 16, p. 91-96.
Enami, M., and Banno, S., 1980. Zoisite-clinozoisite relations in low- to medium-grade
high-pressure metamorphic rocks and their implications: Mineralogical Magazine,
v. 43, p. 1005-1013.
Evans, P., 1964. Tertiary succession in Assam: Transactions of Mineralogical and
Geological Institute of India, v. 27, p. 155-260.
Fedo, C. M., Nesbitt, H. W., and Young, G. M., 1996. Unraveling the effects of
metasomatism in sedimentary rocks and paleosols, with implications for
paleoweathering conditions and provenance: Geology, v. 23, p. 921-924.
France-Lanord, C., Derry, L. and Michard, A., 1993. Evolution of the Himalaya since
Miocene time: Isotopic and sedimentologic evidence from the Bengal Fan, in
Himalayan Tectonics, edited by P. J. Treloar and M. Searle: Geological Soc.
Spec. Publ., v. 74, p. 603–621.
Freise, F.W., 1931. Untersuchung von Mineralen auf Ab-nutzbarkeit bei Verfrachtung im
Wasser: Tschermaks Mineralogy of Petrology, v. 41, p. 1-7

123
Gani, M.R., Alam, M. M., 2002. Fluvial facies architecture in small-scale river systems in
the Upper Dupi Tila Formation, northeast Bengal basin, Bangladesh: Journal of
Asian Earth Sciences, v. 24, p. 225-236.
Gansser, A., 1964. Geology of the Himalayas: Interscience, London, 289 p.
Garzanti, E., Critelli, S., and Ingersoll, R. V., 1996. Paleogeographic and paleotectonic
evolution of the Himalayan range as reflected by detrital modes of Tertiary
sandstones and modern sands (Indus transect, India and Pakistan): Geological
Society of America Bulletin, v. 24, p. 631–642.
Garzanti, E., Vezzoli, G., Ando, S., Lave, J., Attal, M., France-Lanord, C., and Decelles,
P., 2007. Quantifying sand provenance and erosion (Marsyandi River, Nepal
Himalaya): Earth and Planetary Sciences Letters, v. 258, p. 500-515.
Gill, G.T.S., 1984. Heavy mineral assemblage of the Siwalik Group exposed between the
rivers Ghaggar and Markanda, northwestern Himalaya. In: Srivastava, R.A.K.
(Ed.), Sedimentary Geology of the Himalaya: Current Trends in Geology, v. 5, p.
223–234.
Graham, S.A., Ingersoll, R.V., and Dickinson, W.R., 1976. Common provenance for
lithic grains in Carboniferous sandstones from Ouachita Mountains and black
Warrior Basin: Journal of Sedimentary Petrology, v. 46, p. 620-632.
Grimm, W.D., 1973. Stepwise heavy mineral weathering in the residual quartz gravel,
Bavarian Molasse (Germany): Contribution to Sedimentology, v. 1, p 103-125.
Harrison, T.M., Ryerson, F.J., Le Fort, P., Yin, A., Lovera, O.M., Catlos, E.J., 1997. A
Late Miocene-Pliocene origin for central Himalayan inverted metamorphism:
Earth and Planetary Sciences Letters, v. 146, p. 1-8.
Hayashi, K. I., H.Fujisawa, Holland, H. D., and H.Ohmoto, 1997. Geochemistry of 1.9
Ga sedimentary rocks from northeastern Labrador, Canada: Geochimica et
Cosmochimica Acta, v. 61, p. 4115–4137.
Henry, D. J., and Dutrow, B. L., 1992. Tourmaline in a low grade clastic
metasedimentary rocks: an example of the petrogenetic potential of tourmaline:
Contributions to Mineralogy and Petrology, v. 112, p. 203-218.
Henry, D. J., and Guidotti, C. V., 1985. Tourmaline in the staurolite grade metapelites of
NW Maine: a petrogenetic indicator mineral: American Mineralogist, v. 70, p. 1-
15.
Hess, H.H., 1966. Notes on Operation of Frantz Isodynamic Magnetic Separator,
Princeton University: User manual guide, 6 p.
124
Hiller, K., and Elahi, M., 1984. Structural development and hydrocarbon entrapment in
the Surma Basin, Bangladesh (northwest Indo–Burman Fold belt): Proceedings of
4th Offshore Southeast Asia Conference, Singapore, p. 6-50 – 6-63.
Hiller, K., and Elahi, M., 1988. Structural growth and hydrocarbon entrapment in the
Surma basin, Bangladesh: Wagner, H.C., (Ed), Petroleum Resources in China and
Related Subjects, Circum-Pacific Council Energy Mineral Resources Earth
Science Series, v. 10, p. 657-669.
Hodges, K.V., Hames, W.E., Olszewski, W., Burchfiel, B.C., Royden, L.H., and Chen,
Z., 1994. Thermobarometric and 40Ar/39Ar geochronologic constraints on
Eohimalayan metamorphism in the Dinggye area, Southern Tibet: Contributions
to Mineralogy and Petrology, v. 117, p. 151–163.
Hodges, K.V., 2000. Tectonics of the Himalaya and southern Tibet from two
perspectives: Geological Society of America Bulletin, v. 112, p. 324-350.
Holtrop, J.F., and Keizer, J., 1970. Some aspects of stratigraphy and correlation of the
Surma Basin wells, East Pakistan: New York, United Nations, ECAFE Mineral
Resources Development Series no. 36, p. 143-155.
Hossain, M.S., 2009. Overpressure in the eastern Bengal basin, Bangladesh, and its
relation to compressional tectonics [unpublished M.S. Thesis], Auburn
University, Auburn, AL, 119 p.
Hubert, J.F., 1962. A zircon-tourmaline-rutile maturity index and the interdependence of
the composition of heavy mineral assemblages with the gross composition and
texture of sandstones: Journal of Sedimentary Research, v. 32.
Hutton, C.O., 1950. Studies of heavy detrital minerals: Geol. Soc. America Bull., v. 61, p.
635-716.
Imam, B., 2005. Energy Resources of Bangladesh: University Grants Commission of
Bangladesh, Dhaka, 132 p.
Imam, M. B., and Hussain, M., 2002. A review of hydrocarbon habitats in Bangladesh:
Journal of Petroleum Geology, v. 25, p. 31–52.
Ingersoll, R.V., Bullard, T.F., Ford, R.L., Grimm, J.P., Pickle, J.D., and Sares, S.W.,
1984. The effect of grain size on detrital modes: A test of the Gazzi-Dickinson
point-counting method: Journal of Sedimentary Petrology, v. 54, p. 103-116.
Ingersoll, R.V., and Busby, C., 1995. Tectonics of sedimentary basins: Blackwell science.

125
Ingersoll, R.V., and Suezek, C.A., 1979. Petrology and Provenance of Neogene sand
from Nicobar and Bengal fans, DSDP sites 211 and 218: Journal of Sedimentary
Research, v. 49, p. 1217-1228.
Jahan, S., Uddin, A., Savrda, S., and Pashin, J., 2017. Petroleum source-rock evaluation
of upper Eocene Kopili Shale, Bengal basin, Bangladesh: International Journal of
Coal Geology, v. 172, p. 71-79.
Johnson, M.J., 1993. The system controlling the composition of clastic sediments, in
Geological Society of America Special Papers, Geological Society of America, p.
1–20.
Johnson, N.M., Stix, J. Tauxe, L., Cerveny, P.F., and Tahirkheli, R.A.K., 1985.
Paleomagnetic chronology, fluvial processes, and tectonic implications of the
Siwalik deposits near Chinji village, Pakistan: Journal of Geology, v. 93, p. 27–
40.
Johnsson, M.J. 1990. Tectonic versus chemicalweathering controls on the composition of
fluvial sands in tropical environments. Sedimentology, v. 37, p. 713–116.
Johnson, S.Y., and Nur Alam, A. M. N., 1991. Sedimentation and tectonics of the Sylhet
Trough, Bangladesh: Geological Society of America Bulletin, v. 103, p. 1513-
1527.
Johnsson, M.J. 1993. The system controlling the composition of clastic sediments. In:
Processes controlling the composition of clastic sediments (Johnsson, M.J., and
Basu, A. Eds.), Geological Society of America Special Papers, v. 284, p. 1–19.
Kayal, J.R., 2010. Himalayan tectonic model and the great earthquakes: an appraisal,
Geomatics, Natural Hazards and Risk, 1:1, 51-67, DOI:
10.1080/19475701003625752
Kearey, P., and Vine, F.J., 1990. Global Tectonics: Blackwell Science limited, 2nd
edition, 333 p.
Khan, F.H., 1991. Geology of Bangladesh, the University Press Limited, 207 p.
Khan, M.R., and Muminullah, M., 1980. Stratigraphy of Bangladesh, in petroleum and
mineral resources of Bangladesh: Seminar and exhibition: Dhaka, Government of
People's Republic of Bangladesh, p. 35-40.
Khan, M.R., and Muminullah, M., 1988. Stratigraphic lexicon of Bangladesh: Geological
Survey of Bangladesh, Records, v. 5, p. 1-67.
126
Khandoker, R.A., 1989. Development of major tectonic elements of the Bengal basin: a
plate tectonic appraisal: Bangladesh Journal of Scientific Research, v. 7, p. 221–
232.
Krynine, P.D., 1946. The Tourmaline Group in sediments: Geology, v. 54, no. 2, p. 65-
87.
Kumar, P., 2004. Provenance history of Cenozoic sediments near Digboi-Margherita
area, eastern syntaxis of the Himalayas, Assam, northeast India (M.S. Thesis):
Auburn University, Auburn, AL, 131 p.
Kundu, A., Matin, A., and Mukul, M., 2012. Depositional environment and provenance
of Middle Siwalik sediments in Tista Valley, Darjiling District, Eastern Himalaya,
India: Journal of Earth System Science, v. 121, p. 73-89.
Lee, Y. I., 2000. Provenace derived from the geochemistry of the Paleozoic-early
Mesozoic mudrocks of the Pyeongan Supergroup, Korea: Sedimentary Geology,
v. 149, p. 219-235.
Lee, T.Y., and Lawver, L., 1995. Cenozoic plate reconstruction of Southeast Asia:
Tectonophysics, v. 251, p. 85-138.
Liou, J.G., 1973. Synthesis and stability relations of epidote, Ca2Al2FeSiO12 (OH):
Journal of Petrology, v. 14, p. 381-413.
Litcht, A., Reisberg, L., France-Lanord, C., Soe, A.N., and Jaeger, J.J., 2014. Cenozoic
evolution of the central Myanmar drainage system: insights from sediment
provenance in the Minbu Sub-Basin: Basin Research, p. 1-15.
Mack, G.H., 1984. Exceptions to the relationship between plate tectonics and sandstone
composition: Journal of Sedimentary Petrology, v. 54, p. 212-220.
Mandal, S., 2009. Sedimentation and tectonics of the Lower Cenozoic sequences from
southeast of Shillong Plateau, India: Provenance history of the Assam-Bengal
system, Eastern Himalayas (M.S. Thesis): Auburn University, Auburn, AL, 136 p.
Mange, M.A., and Maurer, H.F.W., 1992. Heavy Minerals in color: London, Chapman &
Hall, London, 147 p.
McDougall and McElhinny, 1970. The Rajmahal traps of India: K-Ar ages and
palaeomahnetism: Earth and Planetary Science Letters, v. 9, p. 371-378.
McLennan, S. M., Barbara, B., Hemming, S. R., Hurowitz., J. A., lev, S. M., and
McDaniel, D. K., 2003. The role of provenance and sedimentary processes in the
geochemistry of sedimentary rocks. In Geochemistry of sediments and

127
sedimentary rocks: Evolutionary considerations to mineral deposit-forming
environments, Geological Association of Canada, v.4, p. 7-38.
McLennan, S. M., Hemming, S., McDaniel, D. K., and Hanson, G. N., 1993.
Geochemical approaches to sedimentation, provenance and tectonics. In Johnson,
M. J., Basu, A., eds, processes controlling the composition of the clastic
sediments: Geological Society of America., Boulder, Colorado, Special Paper, v.
284, p. 21-40.
Miyashiro, A., and Seki, Y., 1958. Enlargement of the composition field of epidote and
piemontite with rising temperature: American Journal of Science, v., 256, p. 423-
430.
Molnar, P., 1984. Structure and tectonics of the Himalaya: Constraints and implications
of geophysical data: Annual Review of Earth and Planetary Sciences, v. 12, p.
489-518.
Molnar, P., and Tapponier, P., 1975. Cenozoic Tectonics of Asia: effects of a continental
collision: Science, v. 189, p. 419-426.
Morgan, J.P. and McIntire, W.G., 1959. Quaternary Geology of the Bangal Basin, East
Pakistan and India. Bull. Geol. Soc. Amer., v. 70, p.319-342.
Morton, A.C., 1984. Stability of detrital heavy minerals in Tertiary sandstones of the
North Sea Basin: Clay Mineralogy, v. 19, p 287-308.
Morton, A.C., 1985. Heavy minerals in provenance studies: in G.G. Zuffa (editor),
Provenance of Arenites: D. Reidel Publishing, Boston, p. 249-277.
Morton, A.C., 1986. Dissolution of apatite in North Sea Jurassic sandstone: Implications
for the generation of secondary porosity: Clay Mineralogy, v. 21, p 711-733.
Morton, A.C., and Taylor, P.N., 1991. Geochemical studies of detrital heavy minerals
and their application to provenance research: Geological Society, London, Special
Publications, v. 57, p. 31–45.
Morton, A.C., and Hallsworth, C.R., 1999. Processes controlling the composition of
heavy mineral assemblages in sandstones: Sedimentary Geology, v. 124, p. 3-30.
Morton, A., Hallsworth, C.R., and Chaltonb, B., 2004. Garnet compositions in Scottish
and Norwegian basement terrains: a framework for interpretation of North Sea
sandstone provenance: Marine and Petroleum Geology, v. 21, p. 393-410.
Morton, A.C., and Taylor, P.N., 1991. Geochemical and isotopic constraints on the nature
and age of basement rocks from Rockall Bank, NE Atlantic: Journal of the
Geological Society, London, v. 148, p. 630-634.
128
Murphy, R.W., 1971. Bangladesh enters the oil era: Oil and Gas Journal, v. 86, no. 9 p.
76-82.
Murphy, R.W., 1988. Stratigraphic revision of the Cretaceous-Tertiary sediments of the
Shillong Plateau: Geological Survey of India Records, v. 107, p. 80-90.
Najman, Y., and Garzanti, E., 2000. Reconstructing early Himalayan tectonic evolution
and paleogeography from Tertiary foreland basin sedimentary rocks, northern
India: Geological Society of America Bulletin, v. 112, p. 951-952.
Nakajima, T., Banno, S., and Suzuki, T., 1977. Reactions leading to the disappearance of
pumpellyite in low-grade metamorphic rocks of the sanbagawa metamorphic belt
in central Shikoku, Japan: Journal of Petrology, v. 18, p. 263-284.
Nanayama, F., 1997. An electron microprobe study of the Amazon Fan: Proceedings of
the Ocean Drilling Program, Scientific Results, v. 155, p. 147-168.
Nandi, K., 1967. Garnets as indices of progressive regional metamorphism:
Mineralogical Magazine, v. 36, p. 89-93.
Najman, Y., Bickle, M., BouDagher-Fadel, M., Carter, A., Garzanti, E., Paul, M.,
Wijbrans, J., Willett, E., Oliver, G., Parrish, R., Akhter, S. H., Allen, R., Ando, S.,
Chisty, E., Reisberg, L., and e, G. V., 2008. The Paleogene record of Himalayan
erosion: Bengal basin, Bangladesh: Earth and Planetary Science Letters, v. 273, p.
1-14.
Nesbitt, H.W., Fedo, C.M., and Young, G.M., 1997. Quartz and feldspar stability steady
and non-steady state weathering, and petrogenesis of siliciclastic sands and muds:
Journal of Geology, v. 105, p. 173-191.
Nesbitt, H.W., and Young, G.M., 1984. Prediction of some weathering trend of plutonic
and volcanic rocks based on thermodynamic and kinetic considerations: Journal
of Geology, v. 48, p. 1523-1534.
Opdyke, N.D., Johnson, N.M., Johnson, G.D., Linsay, E.H., and Tahirkheli, R.A.K.,
1982. Paleomagnetism of the Middle Siwalik formations of northern Pakistan and
rotation of the Salt Range Decollement: Palaeogeography, v. 37, p. 1–15.
Pettijohn, F. J., Potter, P. E., and Siever, R., 1987. Sand and Sandstone: Berlin, Springer-
Verlag, 553 p.
Pickering, J.L., Goodbred, S.L., Beam, J.C., Ayers, J.C., Covey, A.K., Rajapara, H.M.,
and Singhvi, A.K., 2017. Terrace formation in the upper Bengal basin since the
Middle Pleistocene: Brahmaputra fan delta construction during multiple
highstands: Basin research, p. 1-18.

129
Rahman, M.W., 2008. Sedimentation and Tectonic evolution of Cenozoic sequence from
Bengal and Assam foreland basin, Eastern Himalayas (unpublished M.S. Thesis):
Auburn, Auburn University, 180 p.
Rahman, M. J. J., and Suzuki, S., 2007. Geochemistry of sandstones from the Miocene
Surma Group, Bengal basin, Bangladesh: Implications for Provenance, tectonic
setting and weathering: Geochemical Journal, v. 41, p. 415-428.
Reimann, K.U., 1993. Geology of Bangladesh, Borntraeger, Berlin, 154 p.
Ramdohr, P., 1980. Ore Minerals and Their Intergrowth (2nd ed.): New York, Pergamon
Press, 1205 p.
Peavy, T., 2008, Provenance of lower Pennsylvanian Pottsville Formation, Cahaba
synclinorium, Alabama [unpublished M.S. Thesis]: Auburn University, Auburn,
AL, 106 p.
Pettijohn, F.J., 1941, Persistence of heavy minerals and geologic age: Journal of Geology,
v. 49, p 610-625.
Pilgrim, G.E., 1913. The structure and correlation of the Simla rocks: Memoire of the
Geological Survey of India, v. 53, 140 p.
Rajendran, C.P., Rajendran, K., Durah, B.P., Baruah, S. and Earnest, A., 2004.
Interpreting the style of faulting and paleoseismicity associated with the 1897
Shillong, northeast India earthquake: Implications for regional tectonism:
Tectonics, v. 23, TC4009, DOI 1029/2003 TC001605.
Roser, B. P., and Korsch, R. J., 1988. Provenance signatures of sandstone-mudstone
suites determined using discriminant function analysis of major-element data:
Chemical Geology, v. 67, p. 119-139.
Rowley, D.B., 1996. Age of initiation of collision between India and Asia: A review of
stratigraphic data: Earth and Planetary Science Letters, v. 145, p. 1-13.
Roy, M.K., Ahmed, S.S., Bhattacharjee, T.K., Mahmud, S., Moniruzzaman, M., Haque,
M.M., Saha, S., Molla, M.I., and Roy, P.C., 2012. Paleoenvironment of
Depositional of the Dupi Tila Formation, Lalmai Hills, Comilla, Bandladesh,
2012: Journal of Geological Society of India, v. 80, p. 409-419.
Sageman, B.B., and Lyons, T.W., 2003. Geochemistry of fine-grained sediments and
sedimentary rocks: volume 7. In F. Mackenzie (Ed.): Treatise on Geochemistry, v.
7, p. 115-158.
130
Salt, C.A., Alam, M.M., and Hossain, M.M., 1986. Bengal basin: current exploration of
the hinge zone area of southwestern Bangladesh: Proceedings of 6th Offshore
Southeast Asia Conference, Singapore, p. 55-57.
Sclater, J.G., and Fisher, R.L., 1974. Evolution of the east-central Indian Ocean, with
emphasis on the tectonic setting of the Ninetyeast Ridge: AAPG bulletin, v. 85, p.
683-702.
Sengupta, S., Ray, K.K., Acharyya, S.K., and Smith, J.B.D., 1990. Nature of ophiolite
occurrence along the eastern margin of the Indian plate and their tectonic
significance: Geology, v. 18, p. 439-442.
Sifeta, K., Korch, R., and Kimura, J.I., 2005. Geochemistry, provenance, and tectonic
setting of Neoproterozoic metavolcanic and metasedimentary units, Werri area,
Northern Ethiopia: journal of African Earth Science, v. 41, p. 212-234.
Sitaula, R.P., 2009. Petrofacies and paleotectonic evolution of Gondwanan and post-
Gondwanan sequences of Nepal (unpublished M.S. Thesis): Auburn, Auburn
University, 186 p.
Soreghan, M. J., and Soreghan, G. S. L., 2007. Whole-rock geochmistry of upper
Paleozoic loessite, western Pangaea: Implication for paleo-atmospheric
circulation: Earth and Planetary Science Letters, v. 255, p. 117-132.
Suttner, L.J., 1974. Sedimentary Petrology Provinces: An evaluation, in Ross, C.A., ed.,
Paleogeographic Provinces and Provinciality: Society of Economic
Paleontologists and Mineralogists, Special Publication, v. 21, p. 75-84.
Suttner, L.J., Basu A., and Mack, G.H. 1981. Climate and the origin of quartz arenite.
Journal of Sedimentary Petrology, v. 51, p. 1235–1244.
Suttner, L.J., and Dutta, P.K. 1986. Alluvial sandstone composition and paleoclimate. 1.
Framework mineralogy: Journal of Sedimentary Petrology, v. 56, p. 329–345.
Strut, B.A., 1962. The composition of garnets from pelitic schists in relation to the grade
of regional metamorphism: Journal of Petrology, v. 3, p. 181-191.
Tamrakar, N.K., and Syangbo, D.K. 2014. Petrography and provenance of the Siwalik
Group sandstones from the Main Boundary Thrust region, Samari River area,
Central Nepal, sub-Himalaya: Boletín de Geología, v. 36, p. 25-44.
Taylor, S. R., and McLennan, S. M., 1985. The continental crust: Its composition and
evolution: Oxford, Blackwell Scientific Publication, 9-16 p.
Tripathi, C., 1986. Siwaliks of the Indian Subcontinent: Paleontological Society of India,
v. 31, p. 1-8.
131
Tucker, M., 1988. Techniques in Sedimentology: Blackwell Scientific Publications,
London, 395 p.
Uddin, A., 1987. A Geological Evaluation of the Hydrocarbon Potential of the
Ganges/Bengal Delta of Bangladesh: M.S. Thesis, University of Hawaii,
Honolulu, Hawaii, 167 p.
Uddin, A., Lundberg, N., 1998a. Unroofing history of the Eastern Himalaya and the Indo-
Burman Ranges: Heavy mineral study of Cenozoic sediments from the Bengal
basin, Bangladesh: Journal of Sedimentary Research, v. 68, p. 465-472.
Uddin, A., and Lundberg, N., 1998b. Cenozoic history of the Himalayan-Bengal system:
Sand composition in the Bengal basin, Bangladesh: Geological Society of
America Bulletin, v. 110, p. 497-472.
Uddin, A., and Lundberg, N., 1999. A paleo-Brahmaputra? Subsurface lithofacies
analysis of Miocene deltaic sediments in the Himalayan-Bengal system,
Bangladesh: Sedimentary Geology, v. 123, p. 239-254.
Uddin, A., Lundberg, N., 2004. Miocene sedimentation and subsidence during continent-
continent collision, Bengal basin, Bangladesh: Sedimentary Geology, v. 164, p.
131-146.
Uddin, A., Kumar, P., and Sarma, J.N., 2007. Early orogenic history of the eastern
Himalayas: Compositional studies of Paleogene sandstones from Assam, NE
India: International Geology Review, v. 49, p. 798-810.
Uddin, A., Kumar, P., Sarma, J.N., and Akhter, S.H., 2009. Heavy-mineral constraints on
provenance of Cenozoic sediments from the foreland basins of Assam, India and
Bangladesh: Erosional history of the eastern Himalayas and the Indo-Burman
ranges, in Mange, M.A., and Wright, D.T., eds., Heavy minerals in use,
Developments in Sedimentology, Elsevier, Amsterdam, v. 58, p. 823-847.
Uddin, A., Hames, W.E., and Zahid, K.M., 2010. Laser 40Ar/39Ar age constraints on
Miocene sequences from the Bengal basin: Implications for middle Miocene
denudation of the eastern Himalayas: Journal of Geophysical Research, v. 115,
B07416, doi: 10.1029/2009JB006401.
Visona, D., Carosi, R., Montomoli, C., Tiepolo, M., and Peruzzo, L., 2012. Miocene
andalusite leucogranite in central-east Himalaya (Everest-Masang Kang area):
Low-pressure melting during heating: Lithos, v. 144-145, p. 194-208.
Von Eynatten, H.; Barcelo´ -Vidal, C.; and PawlowskyGlahn, V. 2003. Composition and
discrimination of sandstones: a statistical evaluation of different analytical
methods: Journal of Sedimentary Research, v. 73, p. 47–57.
132
West, R.M. 1984. Siwalik faunas from Nepal: Paleoecologic and Paleoclimatic
implications. In: The evolution of the East Asian environment Centre of Asian
Studies. Vol. 2. (Whyte, R.O. Ed.). University of Hongkong, p. 724–744.
Worm, H.U., Ahmed, A.M.M., Ahmed, N.U., Islam, H.O., Huq, M.M., Hambach, U.,
Lietz, J., 1998. Large sedimentation rate in the Bengal delta: Magnetostratigraphic
dating of Cenozoic sediments from northeastern Bangladesh: Geology, v. 26, p.
487-490.
Zaher, M.A., and Rahman, A., 1980, Prospects and investigations for minerals in the
northern part of Bangladesh in Petroleum and Mineral Resources of Bangladesh,
Seminar and Exhibition: Dhaka, Government of People’s Republic of
Bangladesh, p. 9-18.
Zahid, K. M., 2005. Provenance and basin tectonics of Oligocene-Miocene sequences of
the Bengal basin, Bangladesh [Unpublished M.S. Thesis]: Auburn University,
142p.
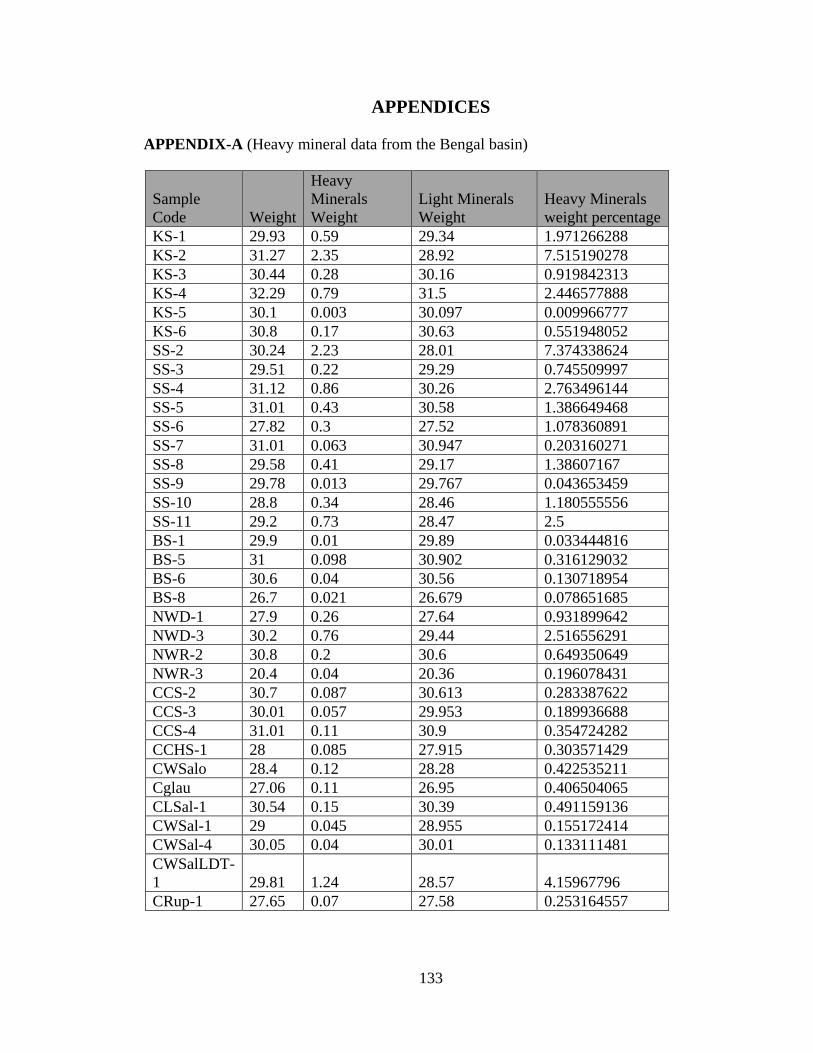
133
APPENDICES
APPENDIX-A (Heavy mineral data from the Bengal basin)
Sample
Code Weight
Heavy
Minerals
Weight
Light Minerals
Weight
Heavy Minerals
weight percentage
KS-1 29.93 0.59 29.34 1.971266288
KS-2 31.27 2.35 28.92 7.515190278
KS-3 30.44 0.28 30.16 0.919842313
KS-4 32.29 0.79 31.5 2.446577888
KS-5 30.1 0.003 30.097 0.009966777
KS-6 30.8 0.17 30.63 0.551948052
SS-2 30.24 2.23 28.01 7.374338624
SS-3 29.51 0.22 29.29 0.745509997
SS-4 31.12 0.86 30.26 2.763496144
SS-5 31.01 0.43 30.58 1.386649468
SS-6 27.82 0.3 27.52 1.078360891
SS-7 31.01 0.063 30.947 0.203160271
SS-8 29.58 0.41 29.17 1.38607167
SS-9 29.78 0.013 29.767 0.043653459
SS-10 28.8 0.34 28.46 1.180555556
SS-11 29.2 0.73 28.47 2.5
BS-1 29.9 0.01 29.89 0.033444816
BS-5 31 0.098 30.902 0.316129032
BS-6 30.6 0.04 30.56 0.130718954
BS-8 26.7 0.021 26.679 0.078651685
NWD-1 27.9 0.26 27.64 0.931899642
NWD-3 30.2 0.76 29.44 2.516556291
NWR-2 30.8 0.2 30.6 0.649350649
NWR-3 20.4 0.04 20.36 0.196078431
CCS-2 30.7 0.087 30.613 0.283387622
CCS-3 30.01 0.057 29.953 0.189936688
CCS-4 31.01 0.11 30.9 0.354724282
CCHS-1 28 0.085 27.915 0.303571429
CWSalo 28.4 0.12 28.28 0.422535211
Cglau 27.06 0.11 26.95 0.406504065
CLSal-1 30.54 0.15 30.39 0.491159136
CWSal-1 29 0.045 28.955 0.155172414
CWSal-4 30.05 0.04 30.01 0.133111481
CWSalLDT-
1 29.81 1.24 28.57 4.15967796
CRup-1 27.65 0.07 27.58 0.253164557
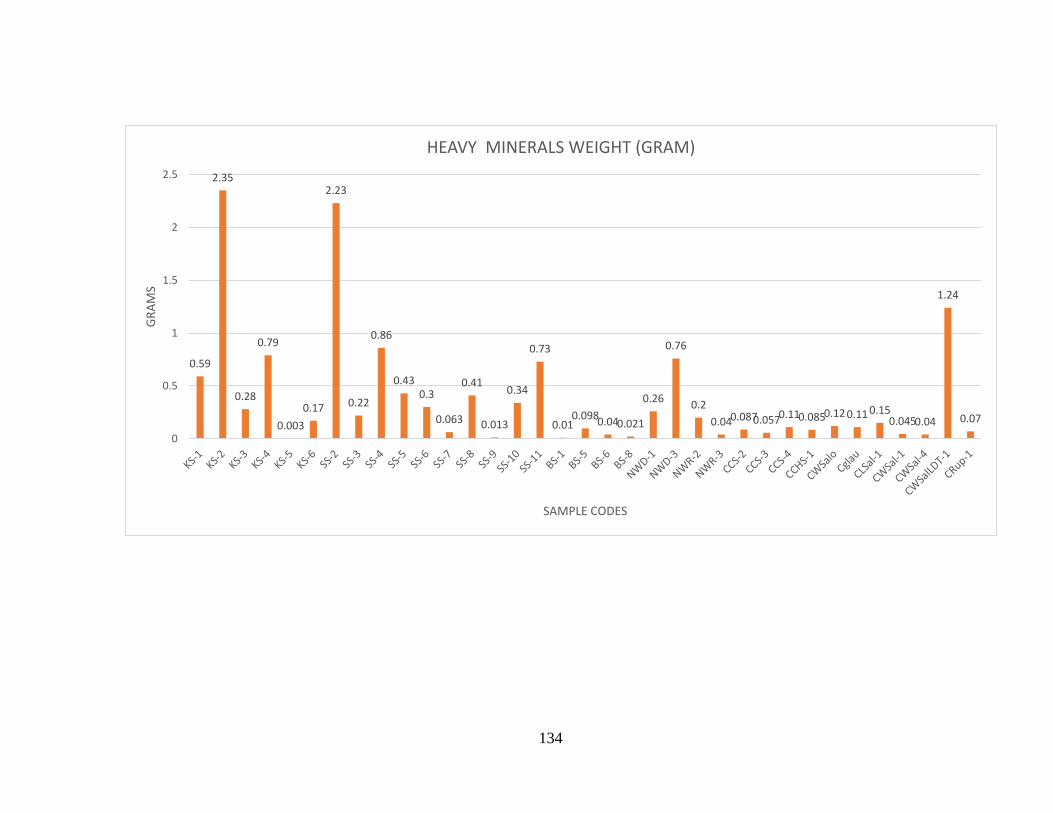
134
0.59
2.35
0.28
0.79
0.003
0.17
2.23
0.22
0.86
0.430.3
0.063
0.41
0.013
0.34
0.73
0.010.098
0.040.021
0.26
0.76
0.2
0.040.0870.0570.110.0850.12 0.11 0.150.0450.04
1.24
0.07
0
0.5
1
1.5
2
2.5
GR
AM
S
SAMPLE CODES
HEAVY MINERALS WEIGHT (GRAM)
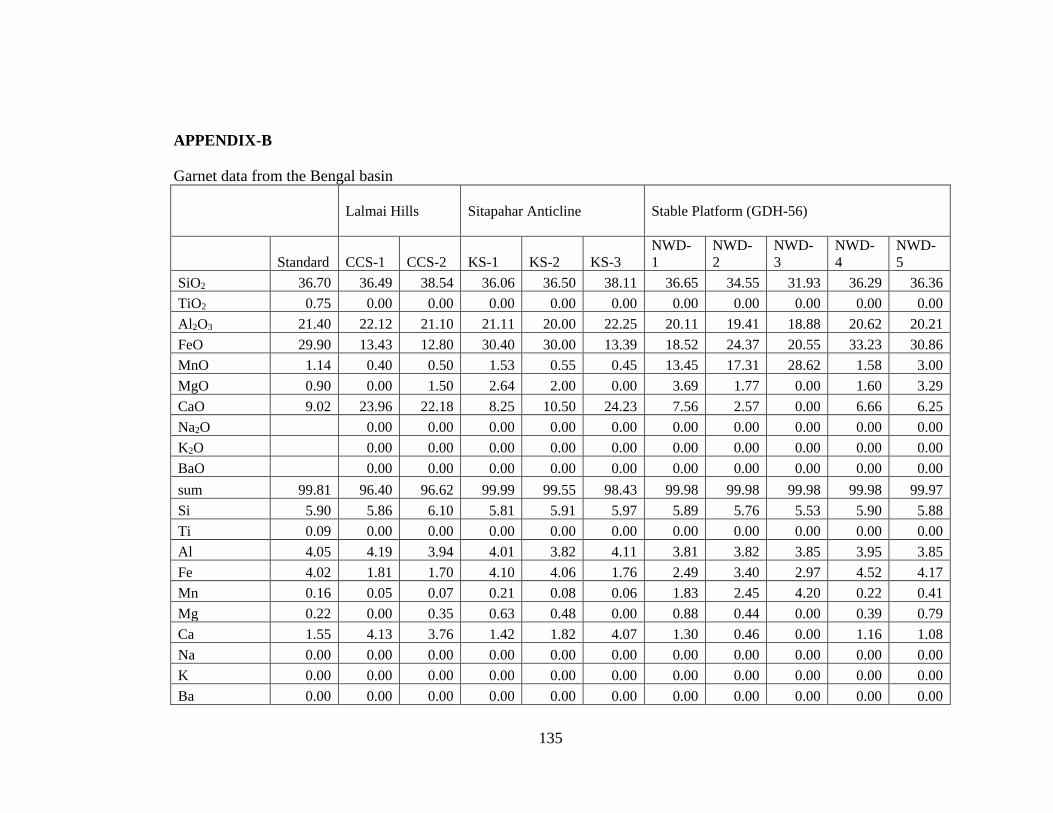
135
APPENDIX-B
Garnet data from the Bengal basin
Lalmai Hills
Sitapahar Anticline
Stable Platform (GDH-56)
Standard CCS-1 CCS-2 KS-1 KS-2 KS-3
NWD-
1
NWD-
2
NWD-
3
NWD-
4
NWD-
5
SiO2 36.70 36.49 38.54 36.06 36.50 38.11 36.65 34.55 31.93 36.29 36.36
TiO2 0.75 0.00 0.00 0.00 0.00 0.00 0.00 0.00 0.00 0.00 0.00
Al2O3 21.40 22.12 21.10 21.11 20.00 22.25 20.11 19.41 18.88 20.62 20.21
FeO 29.90 13.43 12.80 30.40 30.00 13.39 18.52 24.37 20.55 33.23 30.86
MnO 1.14 0.40 0.50 1.53 0.55 0.45 13.45 17.31 28.62 1.58 3.00
MgO 0.90 0.00 1.50 2.64 2.00 0.00 3.69 1.77 0.00 1.60 3.29
CaO 9.02 23.96 22.18 8.25 10.50 24.23 7.56 2.57 0.00 6.66 6.25
Na2O 0.00 0.00 0.00 0.00 0.00 0.00 0.00 0.00 0.00 0.00
K2O 0.00 0.00 0.00 0.00 0.00 0.00 0.00 0.00 0.00 0.00
BaO 0.00 0.00 0.00 0.00 0.00 0.00 0.00 0.00 0.00 0.00
sum 99.81 96.40 96.62 99.99 99.55 98.43 99.98 99.98 99.98 99.98 99.97
Si 5.90 5.86 6.10 5.81 5.91 5.97 5.89 5.76 5.53 5.90 5.88
Ti 0.09 0.00 0.00 0.00 0.00 0.00 0.00 0.00 0.00 0.00 0.00
Al 4.05 4.19 3.94 4.01 3.82 4.11 3.81 3.82 3.85 3.95 3.85
Fe 4.02 1.81 1.70 4.10 4.06 1.76 2.49 3.40 2.97 4.52 4.17
Mn 0.16 0.05 0.07 0.21 0.08 0.06 1.83 2.45 4.20 0.22 0.41
Mg 0.22 0.00 0.35 0.63 0.48 0.00 0.88 0.44 0.00 0.39 0.79
Ca 1.55 4.13 3.76 1.42 1.82 4.07 1.30 0.46 0.00 1.16 1.08
Na 0.00 0.00 0.00 0.00 0.00 0.00 0.00 0.00 0.00 0.00 0.00
K 0.00 0.00 0.00 0.00 0.00 0.00 0.00 0.00 0.00 0.00 0.00
Ba 0.00 0.00 0.00 0.00 0.00 0.00 0.00 0.00 0.00 0.00 0.00
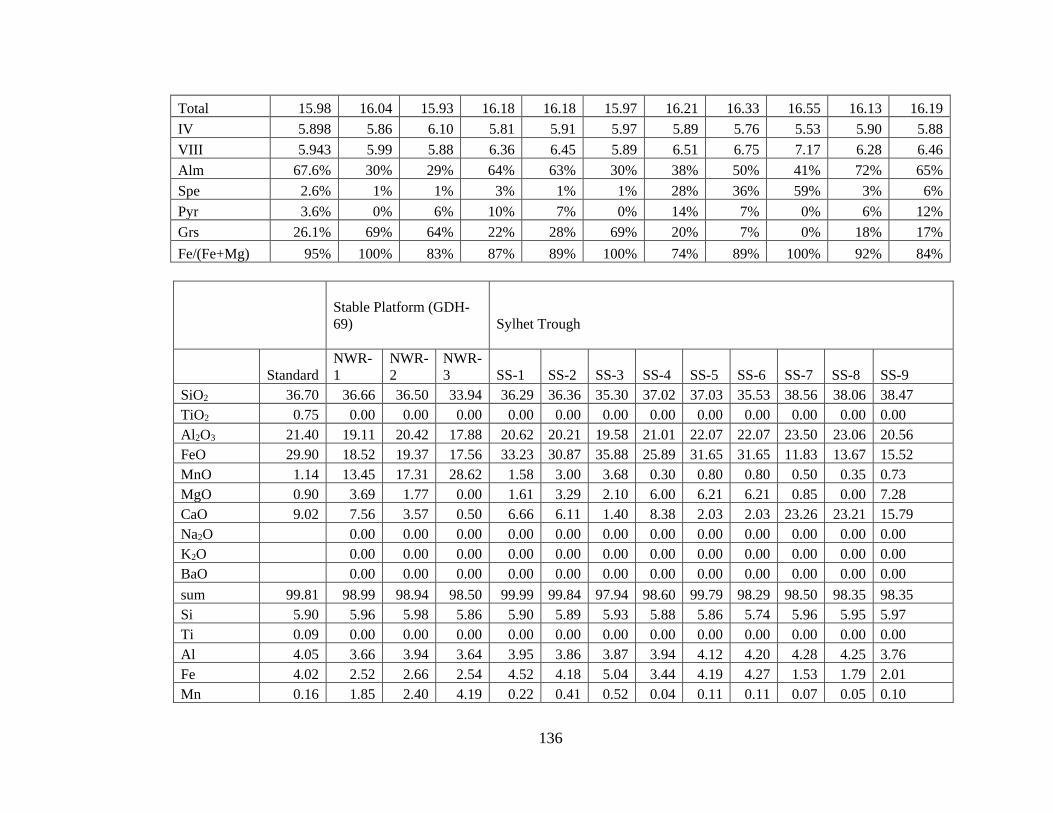
136
Total 15.98 16.04 15.93 16.18 16.18 15.97 16.21 16.33 16.55 16.13 16.19
IV 5.898 5.86 6.10 5.81 5.91 5.97 5.89 5.76 5.53 5.90 5.88
VIII 5.943 5.99 5.88 6.36 6.45 5.89 6.51 6.75 7.17 6.28 6.46
Alm 67.6% 30% 29% 64% 63% 30% 38% 50% 41% 72% 65%
Spe 2.6% 1% 1% 3% 1% 1% 28% 36% 59% 3% 6%
Pyr 3.6% 0% 6% 10% 7% 0% 14% 7% 0% 6% 12%
Grs 26.1% 69% 64% 22% 28% 69% 20% 7% 0% 18% 17%
Fe/(Fe+Mg) 95% 100% 83% 87% 89% 100% 74% 89% 100% 92% 84%
Stable Platform (GDH-
69)
Sylhet Trough
Standard
NWR-
1
NWR-
2
NWR-
3 SS-1 SS-2 SS-3 SS-4 SS-5 SS-6 SS-7 SS-8 SS-9
SiO2 36.70 36.66 36.50 33.94 36.29 36.36 35.30 37.02 37.03 35.53 38.56 38.06 38.47
TiO2 0.75 0.00 0.00 0.00 0.00 0.00 0.00 0.00 0.00 0.00 0.00 0.00 0.00
Al2O3 21.40 19.11 20.42 17.88 20.62 20.21 19.58 21.01 22.07 22.07 23.50 23.06 20.56
FeO 29.90 18.52 19.37 17.56 33.23 30.87 35.88 25.89 31.65 31.65 11.83 13.67 15.52
MnO 1.14 13.45 17.31 28.62 1.58 3.00 3.68 0.30 0.80 0.80 0.50 0.35 0.73
MgO 0.90 3.69 1.77 0.00 1.61 3.29 2.10 6.00 6.21 6.21 0.85 0.00 7.28
CaO 9.02 7.56 3.57 0.50 6.66 6.11 1.40 8.38 2.03 2.03 23.26 23.21 15.79
Na2O 0.00 0.00 0.00 0.00 0.00 0.00 0.00 0.00 0.00 0.00 0.00 0.00
K2O 0.00 0.00 0.00 0.00 0.00 0.00 0.00 0.00 0.00 0.00 0.00 0.00
BaO 0.00 0.00 0.00 0.00 0.00 0.00 0.00 0.00 0.00 0.00 0.00 0.00
sum 99.81 98.99 98.94 98.50 99.99 99.84 97.94 98.60 99.79 98.29 98.50 98.35 98.35
Si 5.90 5.96 5.98 5.86 5.90 5.89 5.93 5.88 5.86 5.74 5.96 5.95 5.97
Ti 0.09 0.00 0.00 0.00 0.00 0.00 0.00 0.00 0.00 0.00 0.00 0.00 0.00
Al 4.05 3.66 3.94 3.64 3.95 3.86 3.87 3.94 4.12 4.20 4.28 4.25 3.76
Fe 4.02 2.52 2.66 2.54 4.52 4.18 5.04 3.44 4.19 4.27 1.53 1.79 2.01
Mn 0.16 1.85 2.40 4.19 0.22 0.41 0.52 0.04 0.11 0.11 0.07 0.05 0.10

137
Mg 0.22 0.89 0.43 0.00 0.39 0.79 0.53 1.42 1.46 1.49 0.20 0.00 1.68
Ca 1.55 1.32 0.63 0.09 1.16 1.06 0.25 1.43 0.34 0.35 3.85 3.89 2.63
Na 0.00 0.00 0.00 0.00 0.00 0.00 0.00 0.00 0.00 0.00 0.00 0.00 0.00
K 0.00 0.00 0.00 0.00 0.00 0.00 0.00 0.00 0.00 0.00 0.00 0.00 0.00
Ba 0.00 0.00 0.00 0.00 0.00 0.00 0.00 0.00 0.00 0.00 0.00 0.00 0.00
Total 15.98 16.21 16.05 16.32 16.13 16.19 16.14 16.15 16.08 16.16 15.89 15.92 16.15
IV 5.898 5.96 5.98 5.86 5.90 5.89 5.93 5.88 5.86 5.74 5.96 5.95 5.97
VIII 5.943 6.58 6.12 6.82 6.28 6.44 6.34 6.33 6.11 6.23 5.65 5.72 6.42
Alm 67.6% 38% 43% 37% 72% 65% 79% 54% 69% 69% 27% 31% 31%
Spe 2.6% 28% 39% 61% 3% 6% 8% 1% 2% 2% 1% 1% 1%
Pyr 3.6% 14% 7% 0% 6% 12% 8% 22% 24% 24% 3% 0% 26%
Grs 26.1% 20% 10% 1% 18% 16% 4% 23% 6% 6% 68% 68% 41%
Fe/(Fe+Mg) 95% 74% 86% 100% 92% 84% 91% 71% 74% 74% 89% 100% 54%
*'Standard' presents an almandine microprobe analysis from Deer et al., 1992, for reference.
Cations are calculated on the basis of 24 oxygen per formula unit.
See thesis text for further details of standardization and analysis.
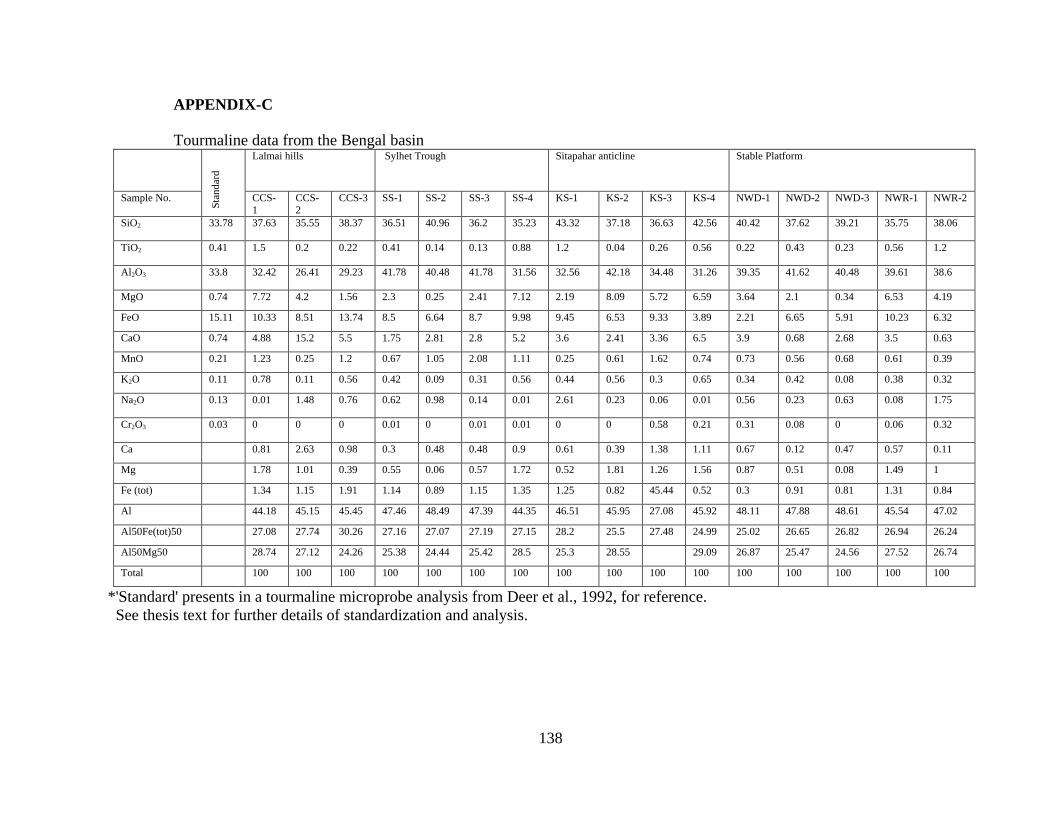
138
APPENDIX-C
Tourmaline data from the Bengal basin
Sta
nd
ard
Lalmai hills Sylhet Trough Sitapahar anticline Stable Platform
Sample No. CCS-
1
CCS-
2
CCS-3 SS-1 SS-2 SS-3 SS-4 KS-1 KS-2 KS-3 KS-4 NWD-1 NWD-2 NWD-3 NWR-1 NWR-2
SiO2 33.78 37.63 35.55 38.37 36.51 40.96 36.2 35.23 43.32 37.18 36.63 42.56 40.42 37.62 39.21 35.75 38.06
TiO2 0.41 1.5 0.2 0.22 0.41 0.14 0.13 0.88 1.2 0.04 0.26 0.56 0.22 0.43 0.23 0.56 1.2
Al2O3 33.8 32.42 26.41 29.23 41.78 40.48 41.78 31.56 32.56 42.18 34.48 31.26 39.35 41.62 40.48 39.61 38.6
MgO 0.74 7.72 4.2 1.56 2.3 0.25 2.41 7.12 2.19 8.09 5.72 6.59 3.64 2.1 0.34 6.53 4.19
FeO 15.11 10.33 8.51 13.74 8.5 6.64 8.7 9.98 9.45 6.53 9.33 3.89 2.21 6.65 5.91 10.23 6.32
CaO 0.74 4.88 15.2 5.5 1.75 2.81 2.8 5.2 3.6 2.41 3.36 6.5 3.9 0.68 2.68 3.5 0.63
MnO 0.21 1.23 0.25 1.2 0.67 1.05 2.08 1.11 0.25 0.61 1.62 0.74 0.73 0.56 0.68 0.61 0.39
K2O 0.11 0.78 0.11 0.56 0.42 0.09 0.31 0.56 0.44 0.56 0.3 0.65 0.34 0.42 0.08 0.38 0.32
Na2O 0.13 0.01 1.48 0.76 0.62 0.98 0.14 0.01 2.61 0.23 0.06 0.01 0.56 0.23 0.63 0.08 1.75
Cr2O3 0.03 0 0 0 0.01 0 0.01 0.01 0 0 0.58 0.21 0.31 0.08 0 0.06 0.32
Ca 0.81 2.63 0.98 0.3 0.48 0.48 0.9 0.61 0.39 1.38 1.11 0.67 0.12 0.47 0.57 0.11
Mg 1.78 1.01 0.39 0.55 0.06 0.57 1.72 0.52 1.81 1.26 1.56 0.87 0.51 0.08 1.49 1
Fe (tot) 1.34 1.15 1.91 1.14 0.89 1.15 1.35 1.25 0.82 45.44 0.52 0.3 0.91 0.81 1.31 0.84
Al 44.18 45.15 45.45 47.46 48.49 47.39 44.35 46.51 45.95 27.08 45.92 48.11 47.88 48.61 45.54 47.02
Al50Fe(tot)50 27.08 27.74 30.26 27.16 27.07 27.19 27.15 28.2 25.5 27.48 24.99 25.02 26.65 26.82 26.94 26.24
Al50Mg50 28.74 27.12 24.26 25.38 24.44 25.42 28.5 25.3 28.55 29.09 26.87 25.47 24.56 27.52 26.74
Total 100 100 100 100 100 100 100 100 100 100 100 100 100 100 100 100
*'Standard' presents in a tourmaline microprobe analysis from Deer et al., 1992, for reference.
See thesis text for further details of standardization and analysis.
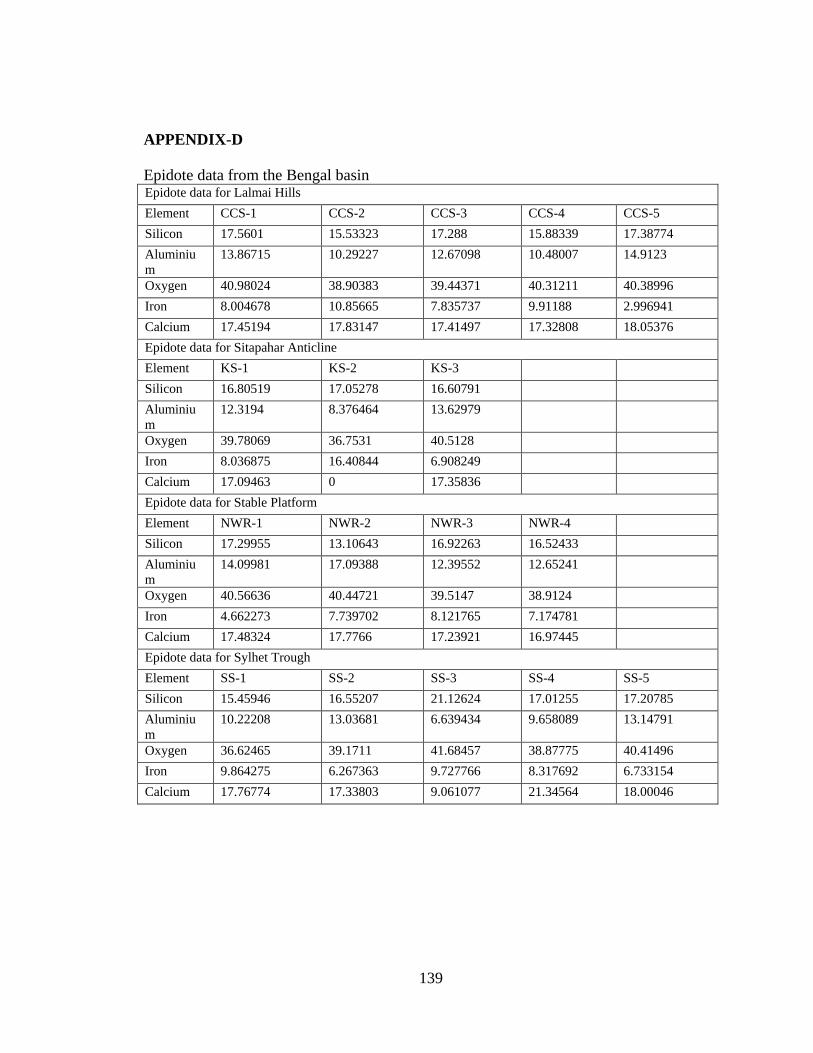
139
APPENDIX-D
Epidote data from the Bengal basin Epidote data for Lalmai Hills
Element CCS-1 CCS-2 CCS-3 CCS-4 CCS-5
Silicon 17.5601 15.53323 17.288 15.88339 17.38774
Aluminiu
m
13.86715 10.29227 12.67098 10.48007 14.9123
Oxygen 40.98024 38.90383 39.44371 40.31211 40.38996
Iron 8.004678 10.85665 7.835737 9.91188 2.996941
Calcium 17.45194 17.83147 17.41497 17.32808 18.05376
Epidote data for Sitapahar Anticline
Element KS-1 KS-2 KS-3
Silicon 16.80519 17.05278 16.60791
Aluminiu
m
12.3194 8.376464 13.62979
Oxygen 39.78069 36.7531 40.5128
Iron 8.036875 16.40844 6.908249
Calcium 17.09463 0 17.35836
Epidote data for Stable Platform
Element NWR-1 NWR-2 NWR-3 NWR-4
Silicon 17.29955 13.10643 16.92263 16.52433
Aluminiu
m
14.09981 17.09388 12.39552 12.65241
Oxygen 40.56636 40.44721 39.5147 38.9124
Iron 4.662273 7.739702 8.121765 7.174781
Calcium 17.48324 17.7766 17.23921 16.97445
Epidote data for Sylhet Trough
Element SS-1 SS-2 SS-3 SS-4 SS-5
Silicon 15.45946 16.55207 21.12624 17.01255 17.20785
Aluminiu
m
10.22208 13.03681 6.639434 9.658089 13.14791
Oxygen 36.62465 39.1711 41.68457 38.87775 40.41496
Iron 9.864275 6.267363 9.727766 8.317692 6.733154
Calcium 17.76774 17.33803 9.061077 21.34564 18.00046
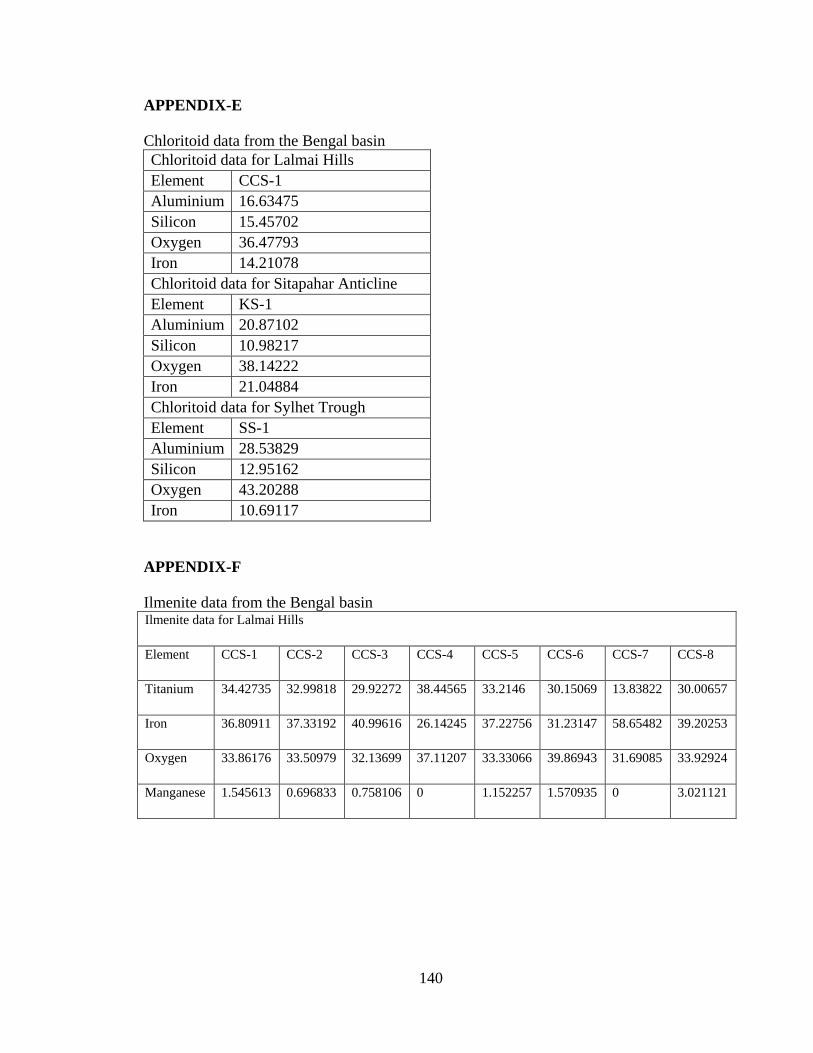
140
APPENDIX-E
Chloritoid data from the Bengal basin
Chloritoid data for Lalmai Hills
Element CCS-1
Aluminium 16.63475
Silicon 15.45702
Oxygen 36.47793
Iron 14.21078
Chloritoid data for Sitapahar Anticline
Element KS-1
Aluminium 20.87102
Silicon 10.98217
Oxygen 38.14222
Iron 21.04884
Chloritoid data for Sylhet Trough
Element SS-1
Aluminium 28.53829
Silicon 12.95162
Oxygen 43.20288
Iron 10.69117
APPENDIX-F
Ilmenite data from the Bengal basin Ilmenite data for Lalmai Hills
Element CCS-1 CCS-2 CCS-3 CCS-4 CCS-5 CCS-6 CCS-7 CCS-8
Titanium 34.42735 32.99818 29.92272 38.44565 33.2146 30.15069 13.83822 30.00657
Iron 36.80911 37.33192 40.99616 26.14245 37.22756 31.23147 58.65482 39.20253
Oxygen 33.86176 33.50979 32.13699 37.11207 33.33066 39.86943 31.69085 33.92924
Manganese 1.545613 0.696833 0.758106 0 1.152257 1.570935 0 3.021121

141
APPENDIX-G
Whole rock chemistry data from the Bengal basin Sample
Sites
SiO2 Al2O
3
Fe2O
3
MgO CaO Na2
O
K2O TiO2 P2O
5
MnO Cr2O
3
Ba Ni Sr Zr Y Sc Th Nb La Sum
% % % % % % % % % % % ppm pp
m
pp
m
pp
m
ppm pp
m
pp
m
pp
m
%
0.01 0.01 0.04 0.01 0.01 0.01 0.01 0.01 0.01 0.01 0.002 5 20 2 5 3 15 5 1 1 0.01
NWD-56 84.42 8.08 2.17 0.47 0.78 1.26 1.95 0.18 0.03 0.04 0.006 434 <20 101 103 12 18 15 25 29 100.01
KS-10 64.90 14.50 6.81 1.67 1.35 1.62 3.02 0.68 0.17 0.07 0.013 571 43 150 231 32 15 25 12 28 99.96
SS-W 68.66 16.22 4.44 0.83 0.08 0.19 2.49 0.91 0.04 0.03 0.017 413 51 60 249 29 4 20 <5 25 99.96
KS-8 63.87 14.86 5.82 2.53 2.07 1.61 3.10 0.70 0.13 0.08 0.013 434 45 147 211 27 12 25 12 12 99.94
CWSal 64.47 16.79 7.04 0.43 0.07 0.15 1.70 0.81 0.04 0.05 0.015 297 49 30 285 25 11 25 10 27 99.97
BS-10 54.22 29.22 1.55 0.17 0.04 0.08 0.92 1.41 0.03 <0.0
1
0.023 194 49 43 289 28 12 15 8 26 99.97
KS-13 63.66 14.61 5.85 2.60 2.40 1.69 3.23 0.68 0.14 0.09 0.013 442 45 159 201 28 13 10 13 32 99.95
KS-12 64.41 14.98 5.96 2.44 1.24 1.38 3.63 0.68 0.14 0.09 0.012 465 51 122 187 26 12 25 13 27 99.94
KS-11 62.81 15.01 6.26 2.71 2.20 1.65 3.36 0.73 0.13 0.09 0.013 454 50 148 189 27 12 25 16 26 99.94
KS-9 67.92 13.14 4.95 2.18 2.46 1.93 2.81 0.62 0.14 0.08 0.011 394 36 174 248 26 11 30 13 28 99.95


