
1
Petroleum Economic Petroleum Economic EvaluationEvaluation
with oil price analysis and with oil price analysis and sensitivity modelingsensitivity modeling
Seung Hoon OHSeung Hoon OH
Petroleum Economist, KNOCPetroleum Economist, KNOC
August 2004August 2004
Index Index
Part 1. Main concepts Part 1. Main concepts
Part 2. Methodology Part 2. Methodology
Part 3. Optimum InvestmentPart 3. Optimum Investment
Part 4. Oil field Evaluation Part 4. Oil field Evaluation
Part 5. Sensitivity reporting Part 5. Sensitivity reporting
Case study (Oil asset) Case study (Oil asset)

2
Part 1. Main conceptsPart 1. Main concepts
Production curves Production curves
-- To be induced through the Engineering calculationTo be induced through the Engineering calculation
-- Mainly consider the following factors Mainly consider the following factors
Drilling plan of new wells for production periodDrilling plan of new wells for production period
WorkoversWorkovers’’ plan of repairing the existing wells plan of repairing the existing wells
(New pumps, Restoring wells, Re(New pumps, Restoring wells, Re--completion, etc)completion, etc)
☺☺ The detailed to be except this workshopThe detailed to be except this workshop
Oil (gas) Price Forecasts Oil (gas) Price Forecasts
-- Determine if the crude is marketable or NonDetermine if the crude is marketable or Non--marketablemarketable
Marketable crudeMarketable crude
-- LongLong--term price forecastingterm price forecasting* Non* Non--consecutive forecasts to be modified to be fixedconsecutive forecasts to be modified to be fixed
every yearevery yearex) Yr 2005 : $25, Yr 2010 : $29ex) Yr 2005 : $25, Yr 2010 : $29
Yearly Escalation rate = (29/25)Yearly Escalation rate = (29/25)1/5 -- 1 = 3% 1 = 3%
-- ShortShort--term price forecastingterm price forecasting* Regarding the forecasting as a base price in starting year* Regarding the forecasting as a base price in starting yearof total production period.of total production period.
* Escalating the base price with a growth rate every year* Escalating the base price with a growth rate every yearex) Yr 2005 : $25, Growth rate 5% ex) Yr 2005 : $25, Growth rate 5%
Yr 2004Yr 2004 Yr 2005Yr 2005 Yr 2006Yr 2006 Yr 2007Yr 2007 Yr 2008Yr 2008
$24.3$24.3 $25.0$25.0 $25.8$25.8 $26.5$26.5 $27.3$27.3
3
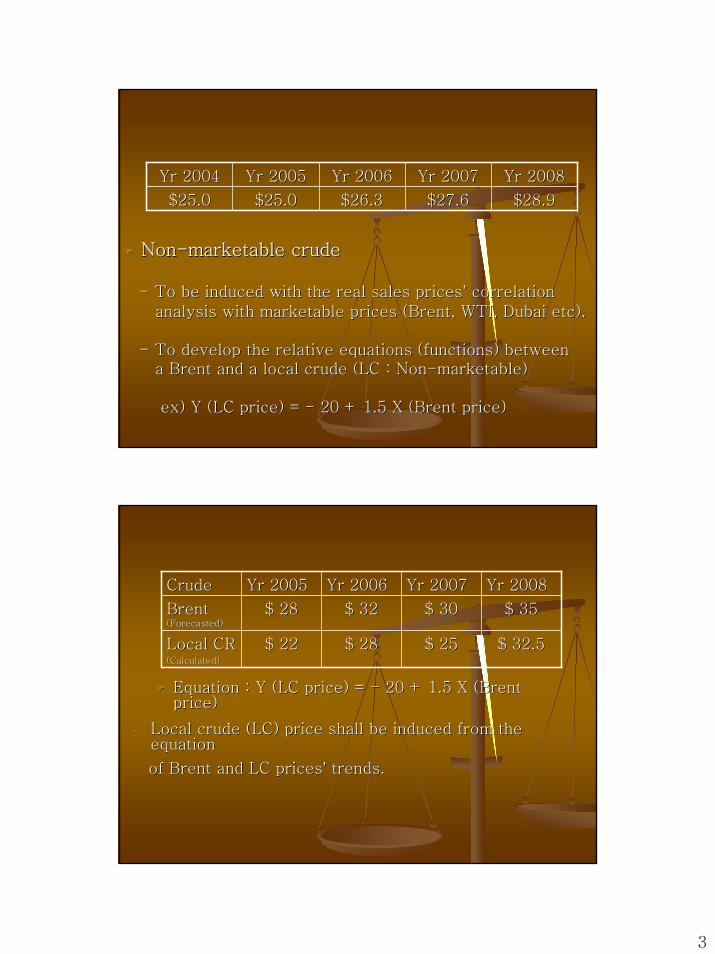
NonNon--marketable crudemarketable crude
-- To be induced with the real sales pricesTo be induced with the real sales prices’’ correlation correlation
analysis with marketable prices (Brent, WTI, Dubai etc).analysis with marketable prices (Brent, WTI, Dubai etc).
-- To develop the relative equations (functions) betweenTo develop the relative equations (functions) betweena Brent and a local crude (LC : Nona Brent and a local crude (LC : Non--marketable) marketable)
ex) Y (LC price) = ex) Y (LC price) = -- 20 + 1.5 X (Brent price) 20 + 1.5 X (Brent price)
Yr 2004Yr 2004 Yr 2005Yr 2005 Yr 2006Yr 2006 Yr 2007Yr 2007 Yr 2008Yr 2008
$25.0$25.0 $25.0$25.0 $26.3$26.3 $27.6$27.6 $28.9$28.9
Equation : Y (LC price) = Equation : Y (LC price) = -- 20 + 1.5 X (Brent 20 + 1.5 X (Brent price) price)
CrudeCrude Yr 2005Yr 2005 Yr 2006Yr 2006 Yr 2007Yr 2007 Yr 2008Yr 2008
Brent Brent (Forecasted)(Forecasted)
$ 28$ 28 $ 32$ 32 $ 30$ 30 $ 35$ 35
Local CRLocal CR(Calculated)(Calculated)
$ 22$ 22 $ 28$ 28 $ 25$ 25 $ 32.5$ 32.5
-- Local crude (LC) price shall be induced from the Local crude (LC) price shall be induced from the equationequation
of Brent and LC pricesof Brent and LC prices’’ trends.trends.
4
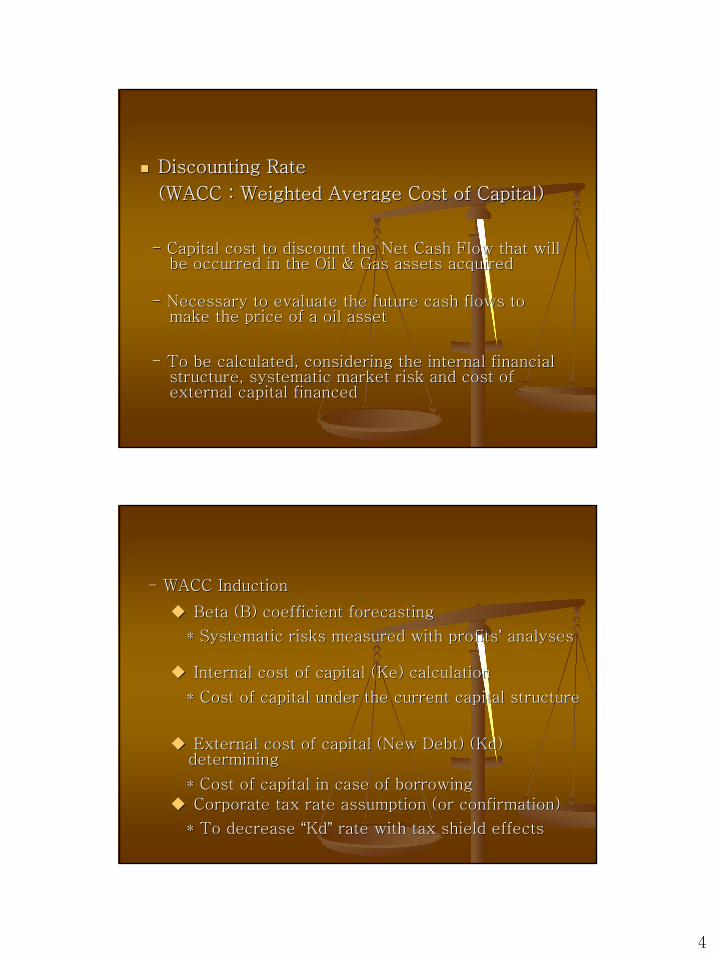
Discounting Rate Discounting Rate
(WACC : Weighted Average Cost of Capital) (WACC : Weighted Average Cost of Capital)
-- Capital cost to discount the Net Cash Flow that will Capital cost to discount the Net Cash Flow that will be occurred in the Oil & Gas assets acquiredbe occurred in the Oil & Gas assets acquired
-- Necessary to evaluate the future cash flows to Necessary to evaluate the future cash flows to make the price of a oil assetmake the price of a oil asset
-- To be calculated, considering the internal financial To be calculated, considering the internal financial structure, systematic market risk and cost of structure, systematic market risk and cost of external capital financedexternal capital financed
-- WACC InductionWACC Induction
Beta (B) coefficient forecasting Beta (B) coefficient forecasting
* Systematic risks measured with profits* Systematic risks measured with profits’’ analyses analyses
Internal cost of capital (Internal cost of capital (KeKe) calculation ) calculation
* Cost of capital under the current capital structure * Cost of capital under the current capital structure
External cost of capital (New Debt) (External cost of capital (New Debt) (KdKd) ) determining determining
* Cost of capital in case of borrowing * Cost of capital in case of borrowing
Corporate tax rate assumption (or confirmation) Corporate tax rate assumption (or confirmation)
* To decrease * To decrease ““KdKd”” rate with tax shield effects rate with tax shield effects
5
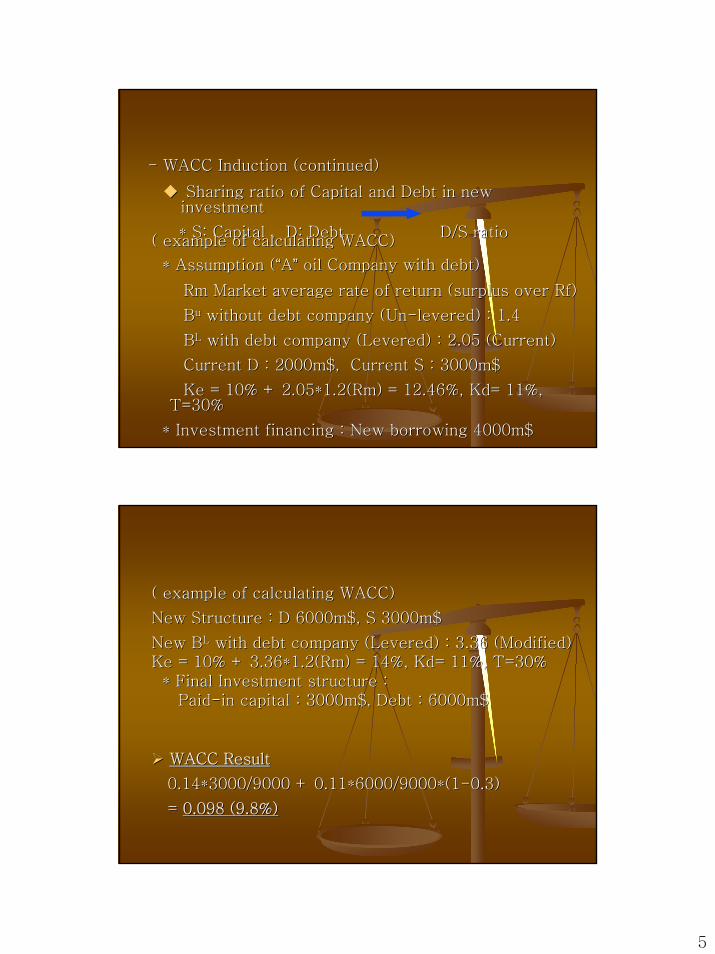
-- WACC Induction (continued)WACC Induction (continued)
Sharing ratio of Capital and Debt in new Sharing ratio of Capital and Debt in new investment investment
* S: Capital , D: Debt D/S ratio* S: Capital , D: Debt D/S ratio( example of calculating WACC)( example of calculating WACC)
* Assumption (* Assumption (““AA”” oil Company with debt)oil Company with debt)
RmRm Market average rate of return (surplus over Market average rate of return (surplus over RfRf) )
BBuu without debt company (Unwithout debt company (Un--levered) : 1.4levered) : 1.4
BBLL with debt company (Levered) : 2.05 (Current)with debt company (Levered) : 2.05 (Current)
Current D : 2000m$, Current S : 3000m$ Current D : 2000m$, Current S : 3000m$
KeKe = 10% + 2.05*1.2(Rm) = 12.46%, = 10% + 2.05*1.2(Rm) = 12.46%, KdKd= 11%, = 11%, T=30% T=30%
* Investment financing : New borrowing 4000m$ * Investment financing : New borrowing 4000m$
( example of calculating WACC)( example of calculating WACC)
New Structure : D 6000m$, S 3000m$New Structure : D 6000m$, S 3000m$
New BNew BLL with debt company (Levered) : 3.36 (Modified)with debt company (Levered) : 3.36 (Modified)KeKe = 10% + 3.36*1.2(Rm) = 14%, = 10% + 3.36*1.2(Rm) = 14%, KdKd= 11%, T=30% = 11%, T=30%
* Final Investment structure : * Final Investment structure : PaidPaid--in capital : 3000m$, Debt : 6000m$ in capital : 3000m$, Debt : 6000m$
WACC ResultWACC Result
0.14*3000/9000 + 0.11*6000/9000*(10.14*3000/9000 + 0.11*6000/9000*(1--0.3)0.3)
= = 0.098 (9.8%)0.098 (9.8%)
6
Costs and Expenses Costs and Expenses
-- To include all of costs that move the produced To include all of costs that move the produced crude from Oil field to the place a buyer crude from Oil field to the place a buyer designateddesignated
-- To be absorbed into a production cost immediatelyTo be absorbed into a production cost immediately
-- Recognize the cost in proportion to productionRecognize the cost in proportion to production
Transport costTransport cost
Costs and Expenses Costs and Expenses
-- All of costs related to drilling a new wells, All of costs related to drilling a new wells, repairing wells, purchasing pumps and rerepairing wells, purchasing pumps and re--completion etccompletion etc
CAPEX (Capital expenditures)CAPEX (Capital expenditures)
-- The costs related with maintaining the current The costs related with maintaining the current capacity or repairing should be absorbed immediatelycapacity or repairing should be absorbed immediately
-- The costs of increasing the production should be The costs of increasing the production should be written off over the usagewritten off over the usage--years (Ex : drilling costs, years (Ex : drilling costs, Pumps etc)Pumps etc)
(Capitalized in purchasing year, Depreciated every (Capitalized in purchasing year, Depreciated every year)year)
7
Costs and Expenses Costs and Expenses
-- All of costs related to operating an oil company, All of costs related to operating an oil company, such as a salaries (service contracts), performance such as a salaries (service contracts), performance compensation, field maintenance fee etc in an oil compensation, field maintenance fee etc in an oil production site production site
OPEX (Operation Expenses)OPEX (Operation Expenses)
-- This costsThis costs’’ function shall be semifunction shall be semi--variable formvariable form
-- Necessary to forecast the cost function and ascertain Necessary to forecast the cost function and ascertain the fixed or the variable from total costs tracing the fixed or the variable from total costs tracing historical data. historical data.
Costs and Expenses Costs and Expenses
-- All of costs related to operating an oil company, All of costs related to operating an oil company, such as a regular salaries, supervisory fee, related such as a regular salaries, supervisory fee, related insurance fee, housing cost and office supplies etc insurance fee, housing cost and office supplies etc
G&A (General Administration expenses)G&A (General Administration expenses)
-- This costsThis costs’’ function shall be semifunction shall be semi--variable form variable form and elevated in proportion to productionand elevated in proportion to production
-- Necessary to forecast the cost function and ascertain Necessary to forecast the cost function and ascertain the minimum level (fixed). the minimum level (fixed).
8
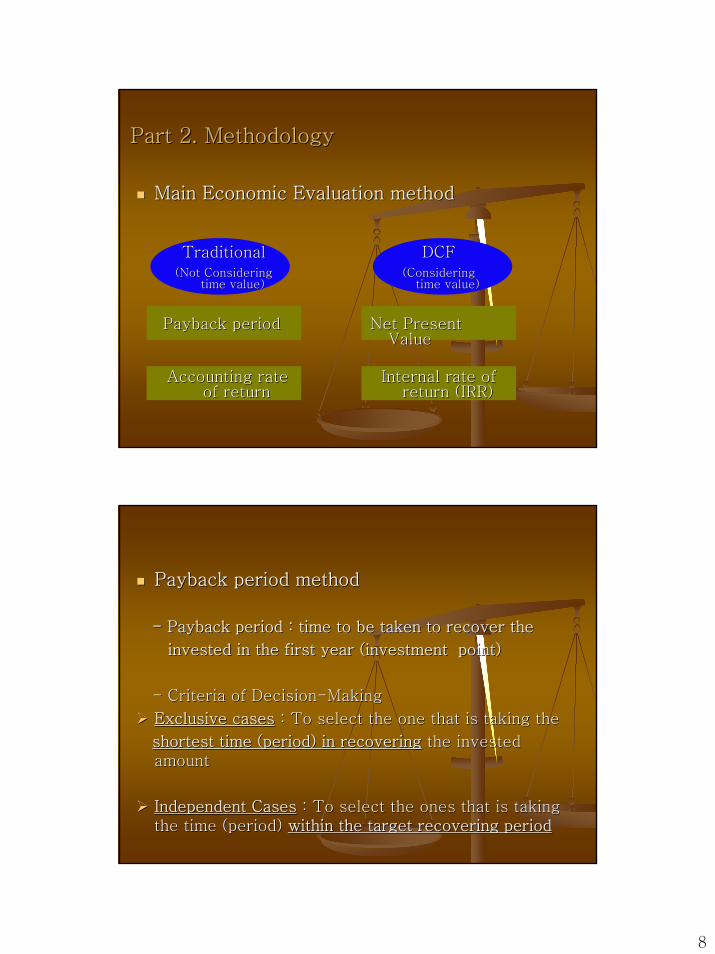
Part 2. MethodologyPart 2. Methodology
Main Economic Evaluation method Main Economic Evaluation method
TraditionalTraditional(Not Considering (Not Considering
time value)time value)
DCFDCF(Considering (Considering
time value)time value)
Payback periodPayback period
Accounting rate Accounting rate of returnof return
Internal rate of Internal rate of return (IRR)return (IRR)
Net Present Net Present ValueValue
Payback period method Payback period method
-- Payback period : time to be taken to recover the Payback period : time to be taken to recover the
invested in the first year (investment point)invested in the first year (investment point)
-- Criteria of DecisionCriteria of Decision--Making Making
Exclusive casesExclusive cases : To select the one that is taking the: To select the one that is taking the
shortest time (period) in recoveringshortest time (period) in recovering the invested the invested amount amount
Independent CasesIndependent Cases : To select the ones that is taking : To select the ones that is taking the time (period) the time (period) within the target recovering periodwithin the target recovering period
9
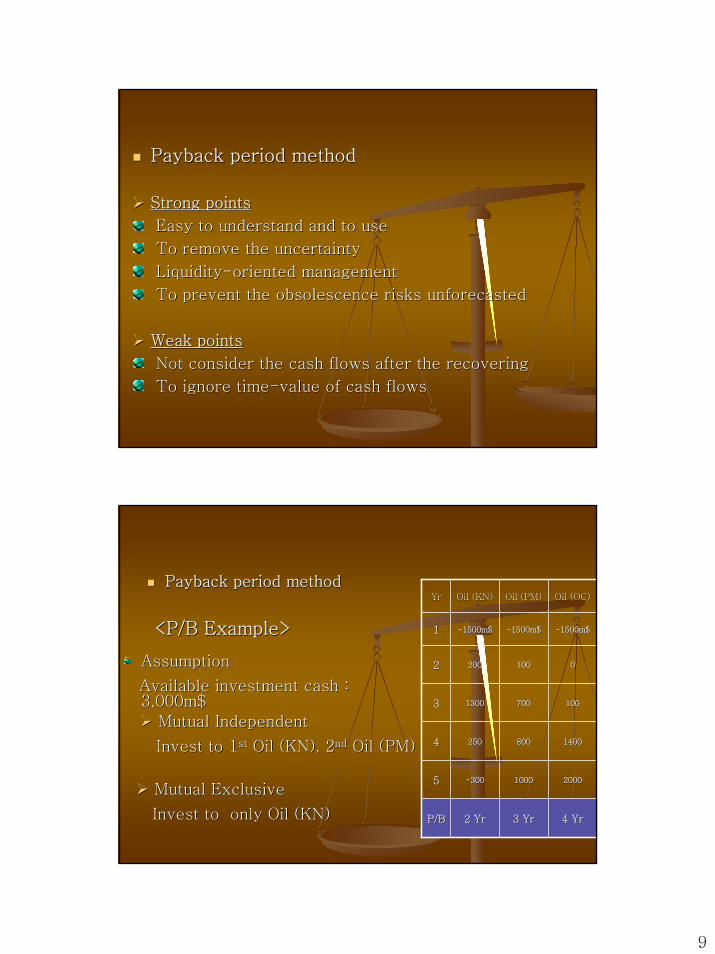
Payback period method Payback period method
Strong pointsStrong points
Easy to understand and to useEasy to understand and to use
To remove the uncertaintyTo remove the uncertainty
LiquidityLiquidity--oriented managementoriented management
To prevent the obsolescence risks To prevent the obsolescence risks unforecastedunforecasted
Weak pointsWeak points
Not consider the cash flows after the recovering Not consider the cash flows after the recovering
To ignore timeTo ignore time--value of cash flowsvalue of cash flows
Payback period method Payback period method
<P/B Example><P/B Example>
YrYr Oil (KN)Oil (KN) Oil (PM)Oil (PM) Oil (OC)Oil (OC)
11 --1500m$1500m$ --1500m$1500m$
100100
700700
800800
10001000
3 Yr3 Yr
--1500m$1500m$
22 200200 00
33 13001300 100100
55 --300300 20002000
44 250250 14001400
P/BP/B 2 Yr2 Yr 4 Yr4 Yr
AssumptionAssumption
Available investment cash : Available investment cash : 3,000m$3,000m$
Mutual IndependentMutual Independent
Invest to 1Invest to 1stst Oil (KN), 2Oil (KN), 2ndnd Oil (PM) Oil (PM)
Mutual ExclusiveMutual Exclusive
Invest to only Oil (KN) Invest to only Oil (KN)
10
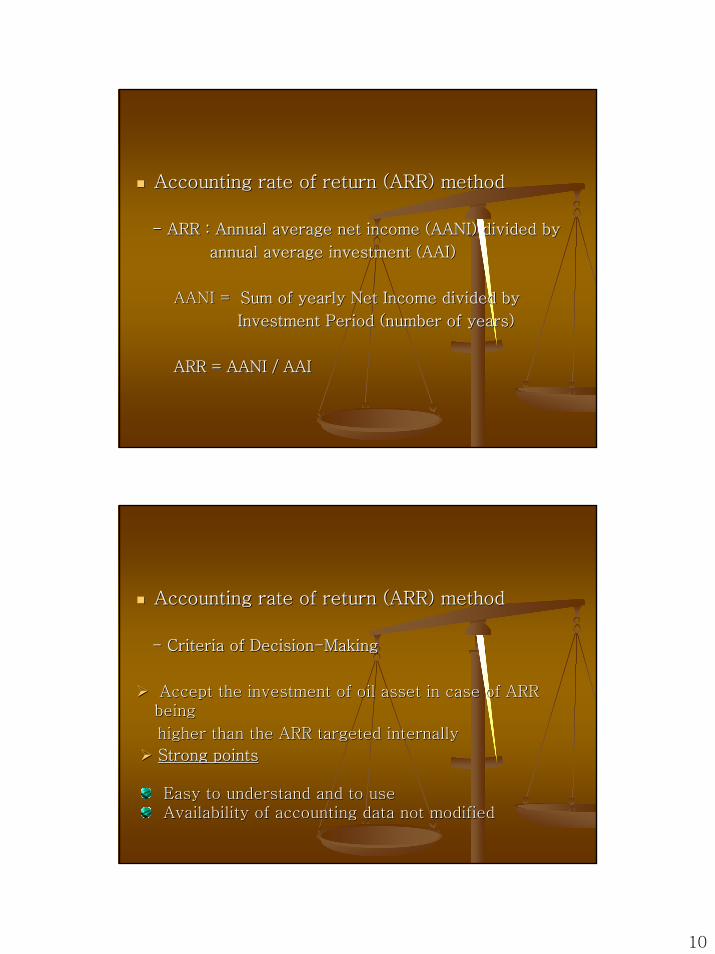
Accounting rate of return (ARR) method Accounting rate of return (ARR) method
-- ARR : Annual average net income (AANI) divided byARR : Annual average net income (AANI) divided by
annual average investment (AAI)annual average investment (AAI)
AANI = AANI = Sum of yearly Net Income divided bySum of yearly Net Income divided by
Investment Period (number of years)Investment Period (number of years)
ARR = AANI / AAIARR = AANI / AAI
Accounting rate of return (ARR) method Accounting rate of return (ARR) method
-- Criteria of DecisionCriteria of Decision--MakingMaking
Accept the investment of oil asset in case of ARR Accept the investment of oil asset in case of ARR beingbeing
higher than the ARR targeted internally higher than the ARR targeted internally
Strong pointsStrong points
Easy to understand and to useEasy to understand and to useAvailability of accounting data not modified Availability of accounting data not modified
11
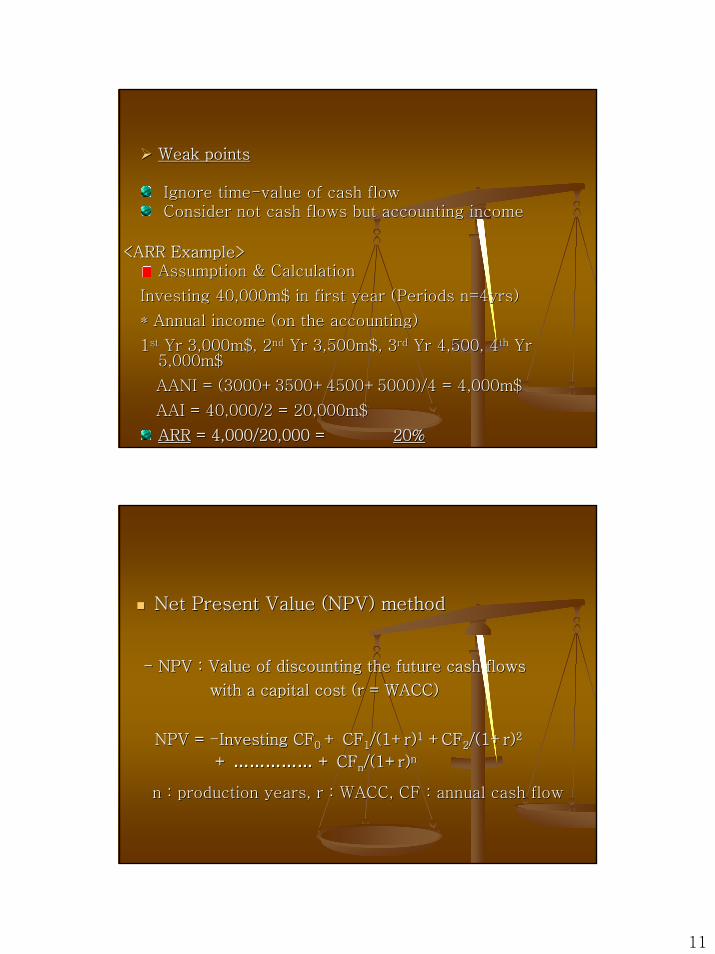
Weak pointsWeak points
Ignore timeIgnore time--value of cash flowvalue of cash flowConsider not cash flows but accounting income Consider not cash flows but accounting income
<ARR Example><ARR Example>Assumption & CalculationAssumption & Calculation
Investing 40,000m$ in first year (Periods n=4yrs)Investing 40,000m$ in first year (Periods n=4yrs)
* Annual income (on the accounting)* Annual income (on the accounting)
11stst Yr 3,000m$, 2Yr 3,000m$, 2ndnd Yr 3,500m$, 3Yr 3,500m$, 3rdrd Yr 4,500, 4Yr 4,500, 4thth Yr Yr 5,000m$5,000m$
AANI = (3000+3500+4500+5000)/4 = 4,000m$AANI = (3000+3500+4500+5000)/4 = 4,000m$
AAI = 40,000/2 = 20,000m$AAI = 40,000/2 = 20,000m$
ARRARR = 4,000/20,000 = = 4,000/20,000 = 20%20%
Net Present Value (NPV) methodNet Present Value (NPV) method
-- NPV : Value of discounting the future cash flows NPV : Value of discounting the future cash flows
with a capital cost (r = WACC)with a capital cost (r = WACC)
NPV = NPV = --Investing CFInvesting CF0 0 + CF+ CF11/(1+r)/(1+r)11 +CF+CF22/(1+r)/(1+r)22
+ + ………………………… + CF+ CFnn/(1+r)/(1+r)nn
n : production years, r : WACC, CF : annual cash flown : production years, r : WACC, CF : annual cash flow
12
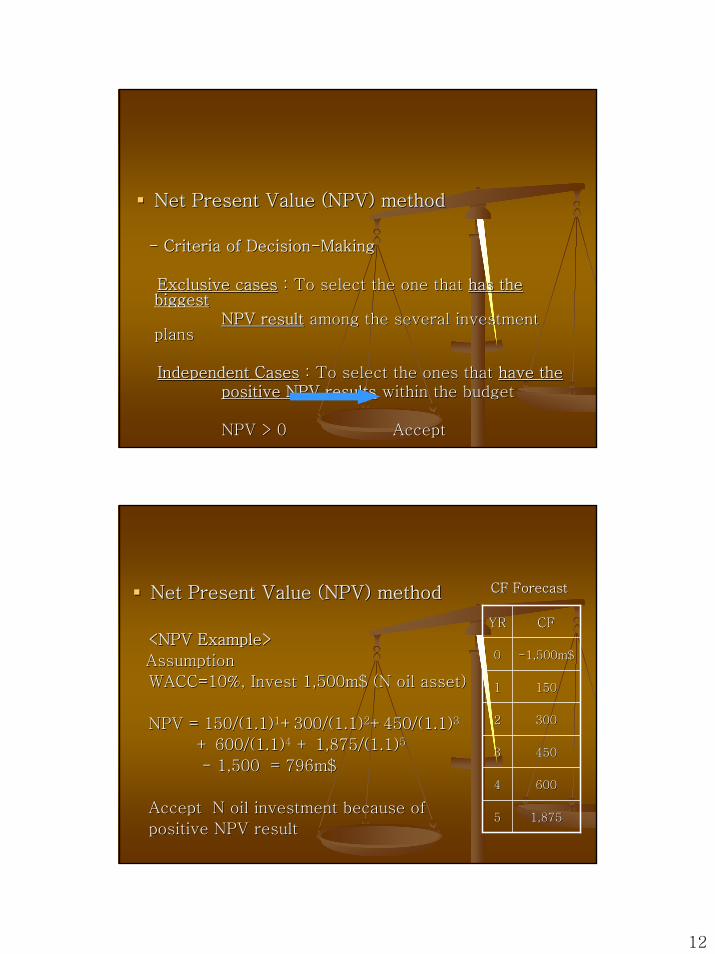
Net Present Value (NPV) method Net Present Value (NPV) method
-- Criteria of DecisionCriteria of Decision--MakingMaking
Exclusive casesExclusive cases : To select the one that : To select the one that has the has the biggestbiggest
NPV resultNPV result among the several investment among the several investment plans plans
Independent CasesIndependent Cases : To select the ones that : To select the ones that have thehave thepositive NPV resultspositive NPV results within the budgetwithin the budget
NPV > 0 AcceptNPV > 0 Accept
Net Present Value (NPV) methodNet Present Value (NPV) method
<NPV Example><NPV Example>
AssumptionAssumption
WACC=10%, Invest 1,500m$ (N oil asset)WACC=10%, Invest 1,500m$ (N oil asset)
NPV = 150/(1.1)NPV = 150/(1.1)11+300/(1.1)+300/(1.1)22+450/(1.1)+450/(1.1)33
+ 600/(1.1)+ 600/(1.1)44 + 1,875/(1.1)+ 1,875/(1.1)55
-- 1,500 = 796m$1,500 = 796m$
Accept N oil investment because of Accept N oil investment because of
positive NPV result positive NPV result
YRYR CFCF
00 --1,500m$1,500m$
11 150150
22 300300
44 600600
33 450450
55 1,8751,875
CF ForecastCF Forecast
13
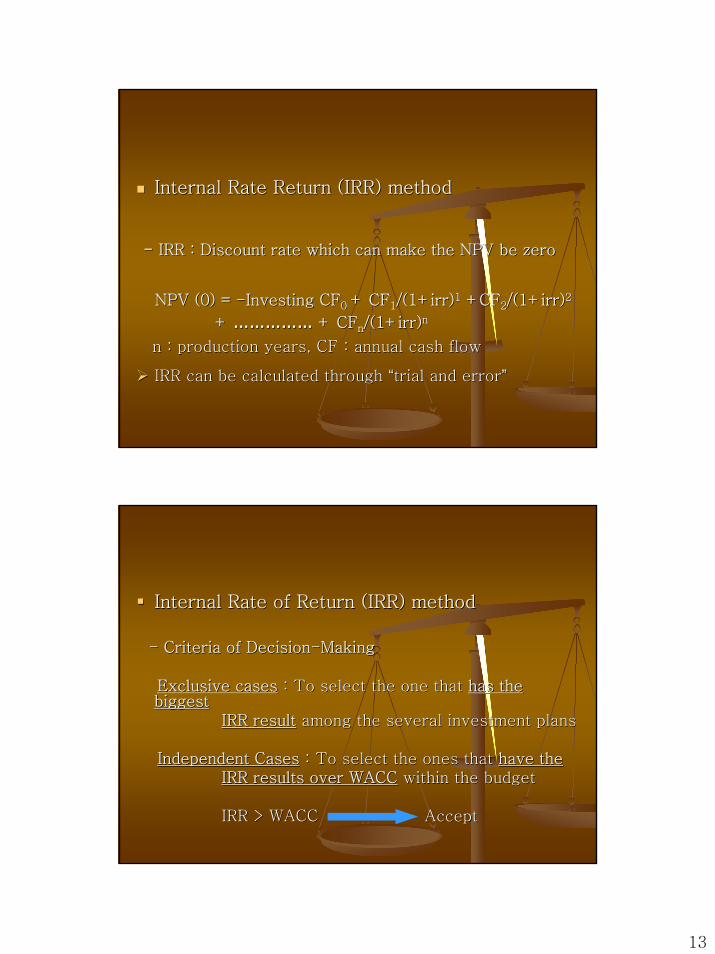
Internal Rate Return (IRR) methodInternal Rate Return (IRR) method
-- IRR : Discount rate which can make the NPV be zeroIRR : Discount rate which can make the NPV be zero
NPV (0) = NPV (0) = --Investing CFInvesting CF0 0 + CF+ CF11/(1+irr)/(1+irr)11 +CF+CF22/(1+irr)/(1+irr)22
+ + ………………………… + CF+ CFnn/(1+irr)/(1+irr)nn
n : production years, CF : annual cash flown : production years, CF : annual cash flow
IRR can be calculated through IRR can be calculated through ““trial and errortrial and error””
Internal Rate of Return (IRR) method Internal Rate of Return (IRR) method
-- Criteria of DecisionCriteria of Decision--MakingMaking
Exclusive casesExclusive cases : To select the one that : To select the one that has the has the biggestbiggest
IRR resultIRR result among the several investment plans among the several investment plans
Independent CasesIndependent Cases : To select the ones that : To select the ones that have thehave theIRR results over WACCIRR results over WACC within the budgetwithin the budget
IRR > WACC AcceptIRR > WACC Accept
14
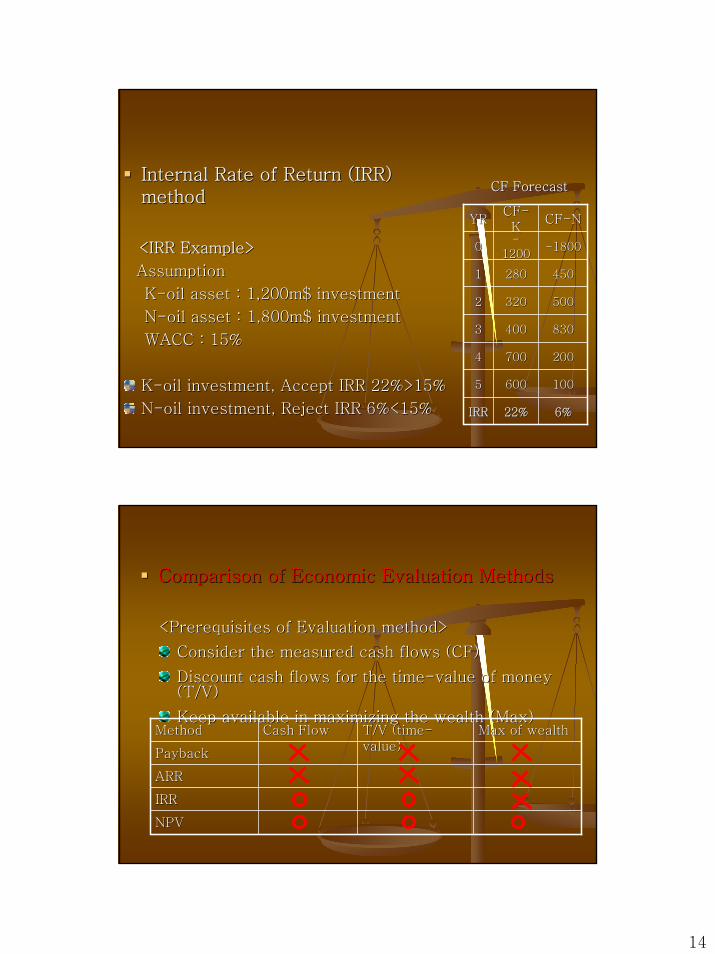
Internal Rate of Return (IRR) Internal Rate of Return (IRR) methodmethod
<IRR Example><IRR Example>
AssumptionAssumption
KK--oil asset : 1,200m$ investmentoil asset : 1,200m$ investment
NN--oil asset : 1,800m$ investmentoil asset : 1,800m$ investment
WACC : 15%WACC : 15%
KK--oil investment, Accept IRR 22%>15%oil investment, Accept IRR 22%>15%
NN--oil investment, Reject IRR 6%<15% oil investment, Reject IRR 6%<15%
YRYRCFCF--KK
CFCF--NN
00--
12001200
280280
320320
400400
700700
55 600600 100100
22%22%
--18001800
11 450450
22 500500
44 200200
33 830830
IRRIRR 6%6%
CF ForecastCF Forecast
Comparison of Economic Evaluation MethodsComparison of Economic Evaluation Methods
<Prerequisites of Evaluation method><Prerequisites of Evaluation method>
Consider the measured cash flows (CF)Consider the measured cash flows (CF)
Discount cash flows for the timeDiscount cash flows for the time--value of money value of money (T/V)(T/V)
Keep available in maximizing the wealth (Max)Keep available in maximizing the wealth (Max)MethodMethod Cash FlowCash Flow T/V (timeT/V (time--
value)value)Max of wealthMax of wealth
PaybackPayback
ARRARR
IRRIRR
NPV NPV
15
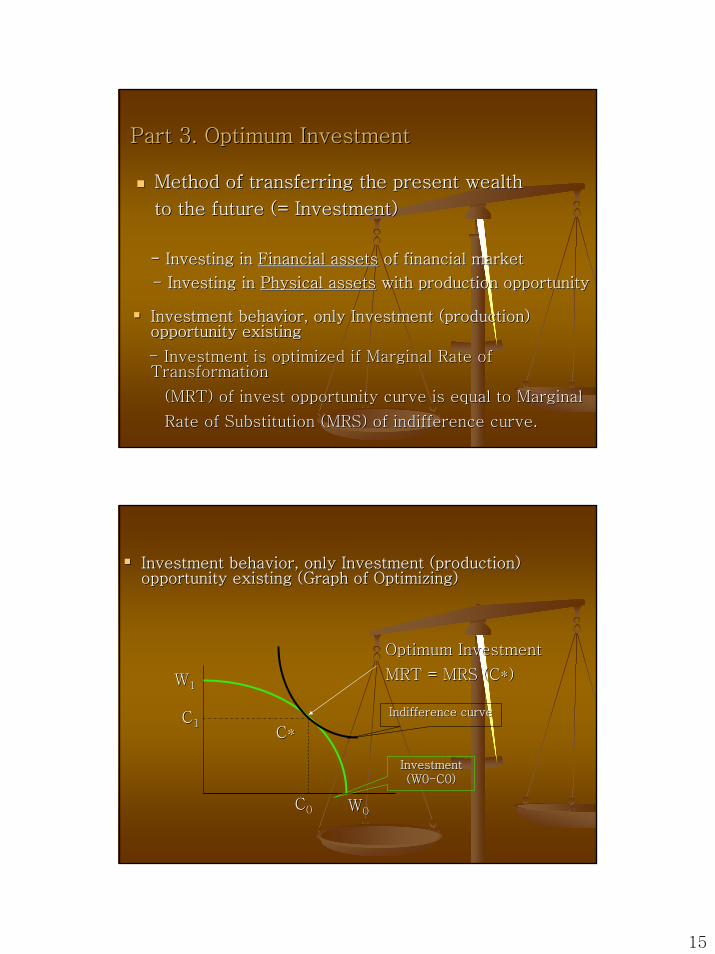
Part 3. Optimum InvestmentPart 3. Optimum Investment
Method of transferring the present wealth Method of transferring the present wealth
to the future (= Investment)to the future (= Investment)
-- Investing in Investing in Financial assetsFinancial assets of financial market of financial market
-- Investing in Investing in Physical assetsPhysical assets with production opportunitywith production opportunity
Investment behavior, only Investment (production) Investment behavior, only Investment (production) opportunity existingopportunity existing
-- Investment is optimized if Marginal Rate of Investment is optimized if Marginal Rate of Transformation Transformation
(MRT) of invest opportunity curve is equal to Marginal (MRT) of invest opportunity curve is equal to Marginal
Rate of Substitution (MRS) of indifference curve.Rate of Substitution (MRS) of indifference curve.
Investment behavior, only Investment (production) Investment behavior, only Investment (production) opportunity existing (Graph of Optimizing)opportunity existing (Graph of Optimizing)
C*C*
Optimum InvestmentOptimum Investment
MRT = MRS (C*)MRT = MRS (C*)
CC00 WW00
CC11
WW11
InvestmentInvestment(W0(W0--C0)C0)
Indifference curveIndifference curve
16
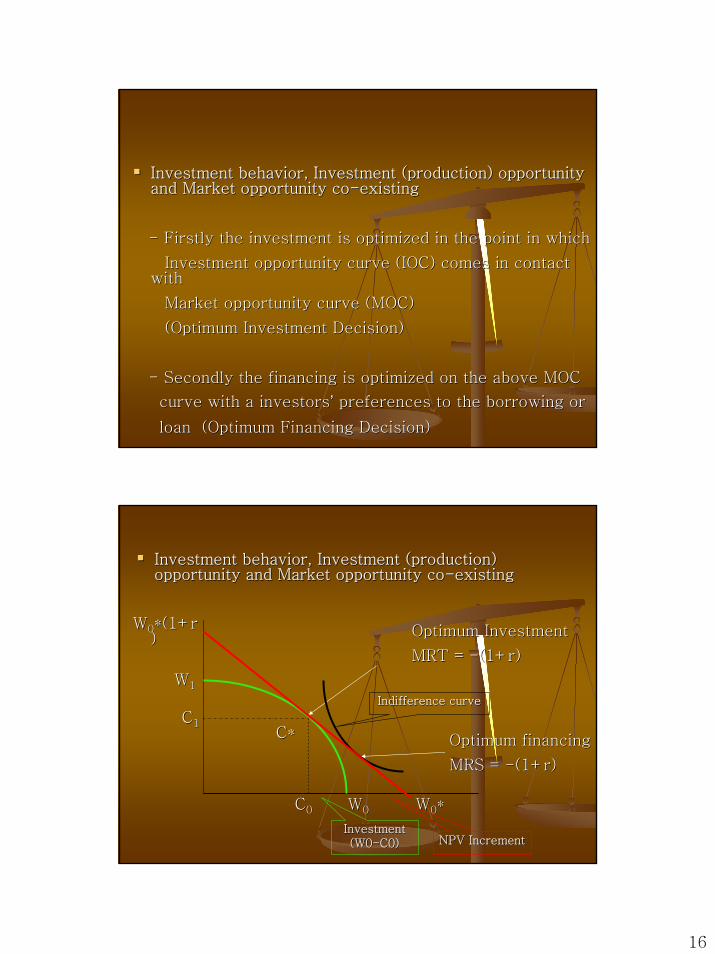
Investment behavior, Investment (production) opportunity Investment behavior, Investment (production) opportunity and Market opportunity coand Market opportunity co--existingexisting
-- Firstly the investment is optimized in the point in whichFirstly the investment is optimized in the point in which
Investment opportunity curve (IOC) comes in contact Investment opportunity curve (IOC) comes in contact with with
Market opportunity curve (MOC)Market opportunity curve (MOC)
(Optimum Investment Decision)(Optimum Investment Decision)
-- Secondly the financing is optimized on the above MOCSecondly the financing is optimized on the above MOC
curve with a investorscurve with a investors’’ preferences to the borrowing orpreferences to the borrowing or
loan (Optimum Financing Decision) loan (Optimum Financing Decision)
Investment behavior, Investment (production) Investment behavior, Investment (production) opportunity and Market opportunity coopportunity and Market opportunity co--existingexisting
C*C*
CC00
CC11
WW11
Optimum InvestmentOptimum Investment
MRT = MRT = --(1+r)(1+r)
WW00
InvestmentInvestment(W0(W0--C0)C0)
Indifference curveIndifference curve
WW00**
WW00*(1+r*(1+r))
Optimum financingOptimum financing
MRS = MRS = --(1+r)(1+r)
NPV IncrementNPV Increment

17
Part 4. Oil Field EvaluationPart 4. Oil Field Evaluation
Practical production curve developmentPractical production curve development
Targeted acquisition area geologic analysisTargeted acquisition area geologic analysis
(OIP)(OIP)
Calculation of Recoverable ReservesCalculation of Recoverable Reserves
(Production scale setting)(Production scale setting)
Reliable Production curve selection Reliable Production curve selection
considering advisory reservesconsidering advisory reserves’’ datadata
Base Oil Price (input price) selectionBase Oil Price (input price) selection
-- Search of marketable crudeSearch of marketable crude having a high correlation having a high correlation
Correlation Testing Correlation Testing MethodMethod
Statistical Statistical methodmethod
Heuristic Heuristic methodmethod
Graph ComparisonGraph Comparison
(dispersion, linear)(dispersion, linear)
Regression analysisRegression analysis
(Linear, logarithmic(Linear, logarithmic
Exponential etc) Exponential etc)
Cost AnalysisCost Analysis
(Local crude)(Local crude)
Direct surveyDirect survey
(Local marketing(Local marketing
Manager interview)Manager interview)
Superior Superior toto
heuristic heuristic testingtesting
18
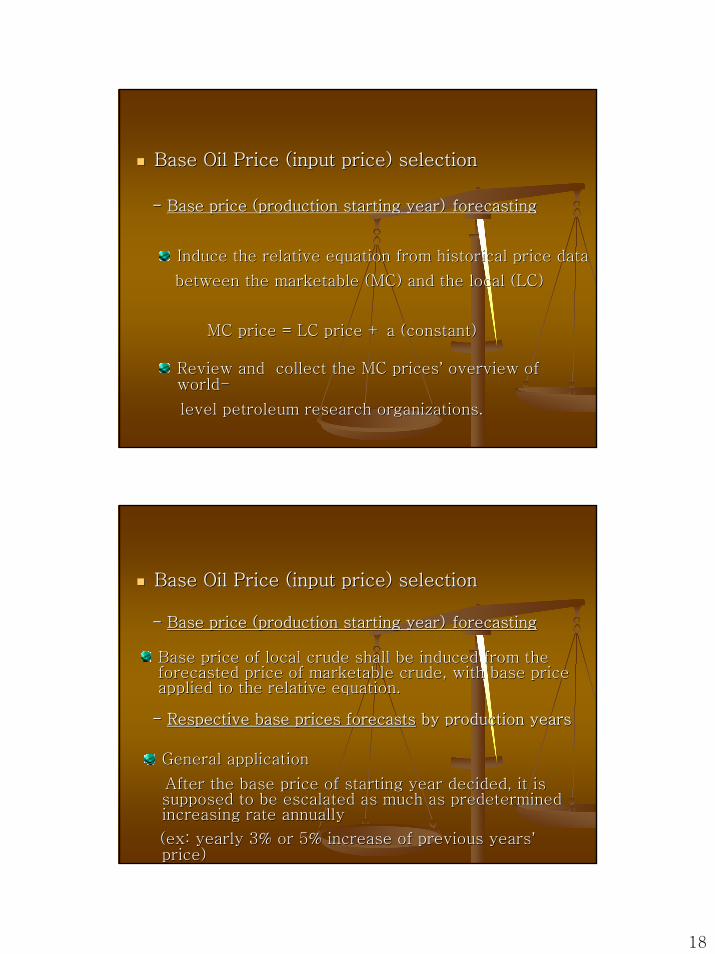
Base Oil Price (input price) selectionBase Oil Price (input price) selection
-- Base price (production starting year)Base price (production starting year) forecasting forecasting
Induce the relative equation from historical price dataInduce the relative equation from historical price data
between the marketable (MC) and the local (LC)between the marketable (MC) and the local (LC)
MC price = LC price + a (constant)MC price = LC price + a (constant)
Review and collect the MC pricesReview and collect the MC prices’’ overview of overview of worldworld--
level petroleum research organizations.level petroleum research organizations.
Base Oil Price (input price) selectionBase Oil Price (input price) selection
-- Base price (production starting year)Base price (production starting year) forecasting forecasting
Base price of local crude shall be induced from the Base price of local crude shall be induced from the forecasted price of marketable crude, with base price forecasted price of marketable crude, with base price applied to the relative equation. applied to the relative equation.
-- Respective base prices forecastsRespective base prices forecasts by production years by production years
General applicationGeneral application
After the base price of starting year decided, it is After the base price of starting year decided, it is supposed to be escalated as much as predetermined supposed to be escalated as much as predetermined increasing rate annually increasing rate annually
(ex: yearly 3% or 5% increase of previous years(ex: yearly 3% or 5% increase of previous years’’price) price)
19
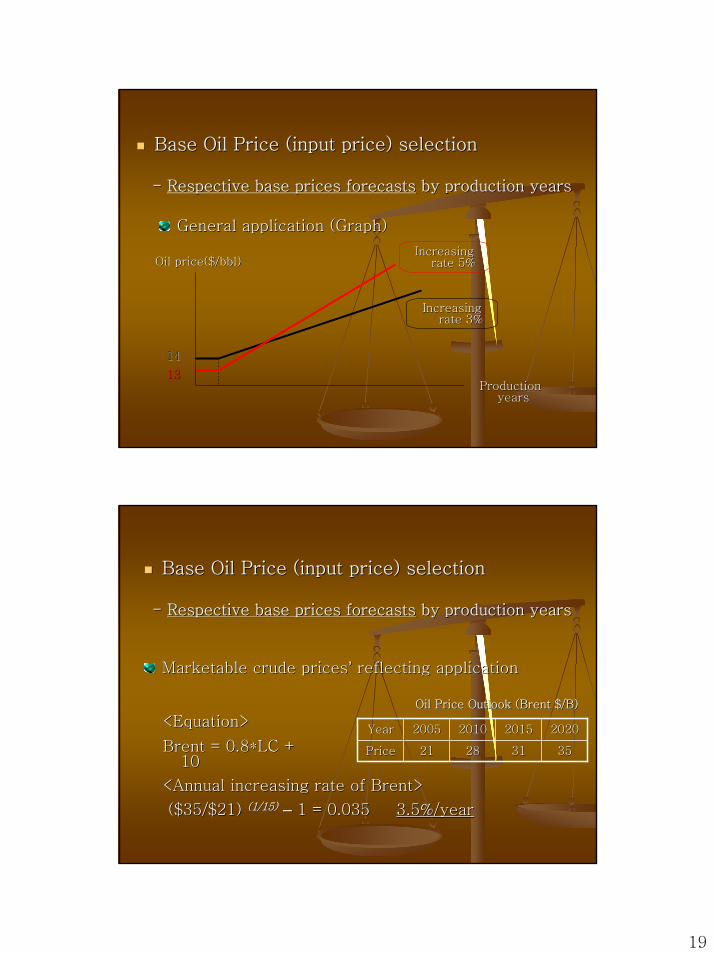
Base Oil Price (input price) selectionBase Oil Price (input price) selection
-- Respective base prices forecastsRespective base prices forecasts by production years by production years
General application (Graph) General application (Graph)
Oil price($/bbl)Oil price($/bbl)
Production Production yearsyears
1414
1313
Increasing Increasing rate 3%rate 3%
Increasing Increasing rate 5%rate 5%
Base Oil Price (input price) selection Base Oil Price (input price) selection
-- Respective base prices forecastsRespective base prices forecasts by production years by production years
Marketable crude pricesMarketable crude prices’’ reflecting application reflecting application
YearYear 20052005 20102010 20152015 20202020
PricePrice 2121 2828 3131 3535
Oil Price Outlook (Brent $/B)Oil Price Outlook (Brent $/B)
<Equation><Equation>
Brent = 0.8*LC + Brent = 0.8*LC + 1010
<Annual increasing rate of Brent><Annual increasing rate of Brent>
($35/$21) ($35/$21) (1/15)(1/15) –– 1 = 0.035 1 = 0.035 3.5%/year3.5%/year

20
Base Oil Price (input price) selectionBase Oil Price (input price) selection
-- Respective base prices forecastsRespective base prices forecasts by production years by production years
Marketable crude pricesMarketable crude prices’’ reflecting application reflecting application
Oil price($/bbl)Oil price($/bbl)
Production Production yearsyears
Local Local $13.75$13.75
(Brent $21)(Brent $21)
IncreasingIncreasingrate 3.5%/yrate 3.5%/y
20020055
20220200
Local Local $31.25$31.25
(Brent $35)(Brent $35)
Calculation of Discounting rate (WACC) Calculation of Discounting rate (WACC)
<Calculation><Calculation>
KwKw (WACC) = 0.15*0.7 + 0.09*0.3*(1(WACC) = 0.15*0.7 + 0.09*0.3*(1--0.2) = 0.1270.2) = 0.127
Discounting rate : 12.7% Discounting rate : 12.7%
<Assumption><Assumption>
New project investment financing planNew project investment financing plan
-- Internal capital (retained earnings, cash) 70%Internal capital (retained earnings, cash) 70%
-- External capital (debt) 30%External capital (debt) 30%
-- Cost of capitalCost of capital
KeKe = 15%, = 15%, KdKd = 9%, Tax = 20% = 9%, Tax = 20%
21
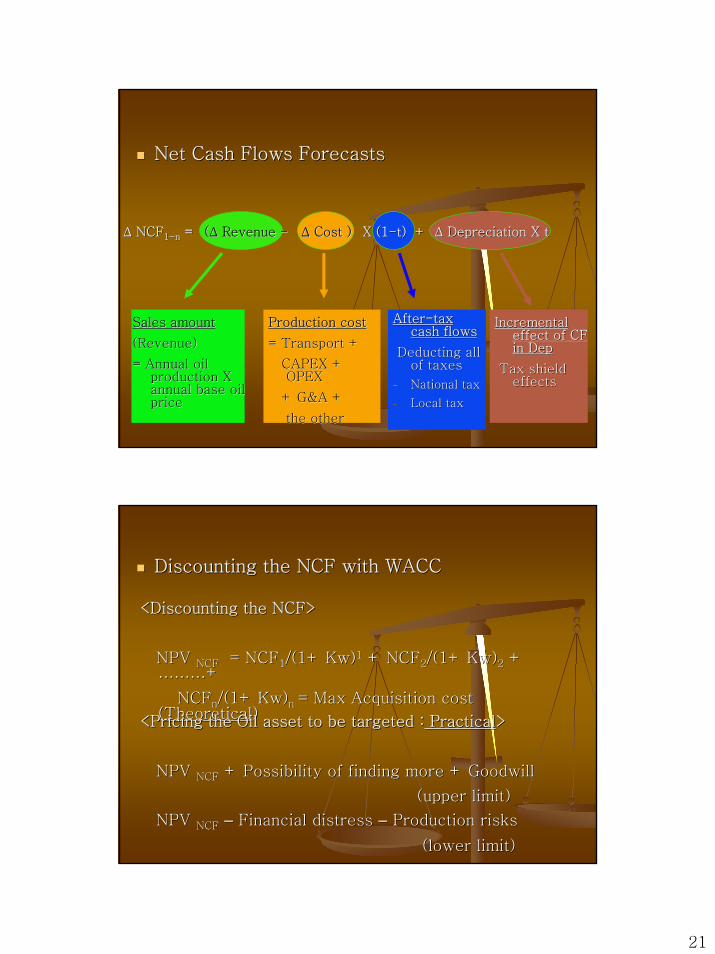
AfterAfter--tax tax cash flowscash flows
Deducting all Deducting all of taxesof taxes
-- National taxNational tax
-- Local taxLocal tax
Net Cash Flows Forecasts Net Cash Flows Forecasts
ΔΔ NCFNCF1~n1~n == ((ΔΔ Revenue Revenue -- ΔΔ Cost )Cost ) X X (1(1--t) + t) + ΔΔ Depreciation Depreciation X tX t
Sales amountSales amount
(Revenue)(Revenue)
= Annual oil = Annual oil production production X X annual base oil annual base oil price price
Production costProduction cost
= Transport += Transport +
CAPEX + CAPEX + OPEXOPEX
+ G&A ++ G&A +
the otherthe other
Incremental Incremental effect of CF effect of CF in in DepDep
Tax shield Tax shield effectseffects
Discounting the NCF with WACC Discounting the NCF with WACC
<Discounting the NCF><Discounting the NCF>
NPV NPV NCFNCF = NCF= NCF11/(1+ Kw)/(1+ Kw)11 + NCF+ NCF22/(1+ Kw)/(1+ Kw)22 + + ………………++
NCFNCFnn/(1+ /(1+ Kw)Kw)nn = Max Acquisition cost = Max Acquisition cost ((TheoreticalTheoretical))<Pricing the Oil asset to be targeted :<Pricing the Oil asset to be targeted : PracticalPractical>>
NPV NPV NCFNCF + Possibility of finding more + Goodwill + Possibility of finding more + Goodwill
(upper limit(upper limit))
NPV NPV NCFNCF –– Financial distress Financial distress –– Production risksProduction risks
(lower limi(lower limit) t)
22
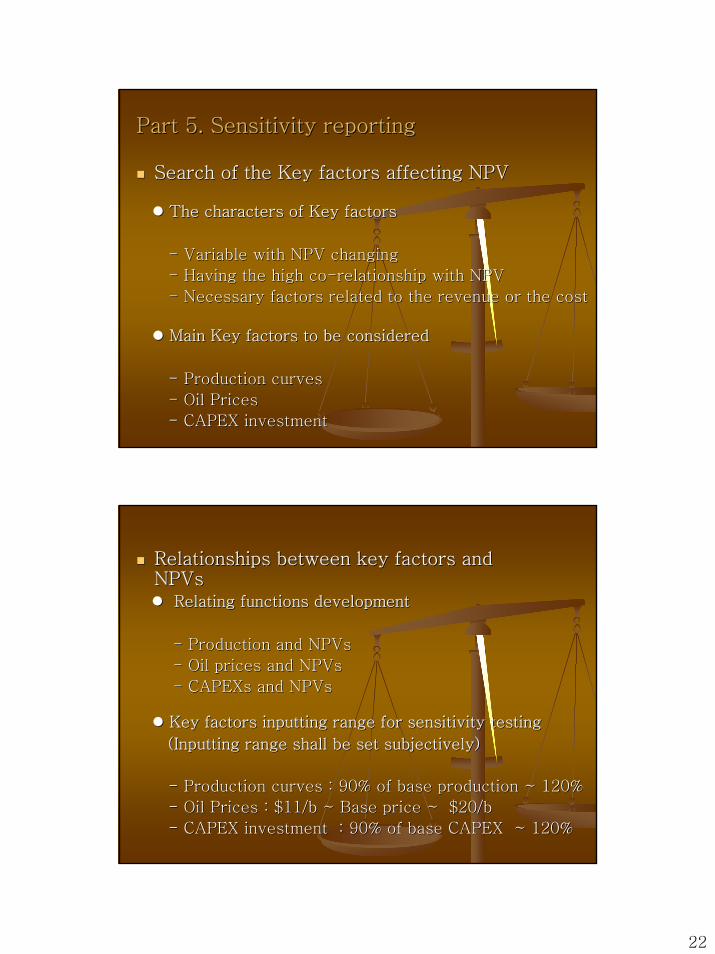
Part 5. Sensitivity reportingPart 5. Sensitivity reporting
Search of the Key factors affecting NPV Search of the Key factors affecting NPV
The characters of Key factorsThe characters of Key factors
-- Variable with NPV changingVariable with NPV changing
-- Having the high coHaving the high co--relationship with NPVrelationship with NPV
-- Necessary factors related to the revenue or the costNecessary factors related to the revenue or the cost
Main Key factors to be consideredMain Key factors to be considered
-- Production curvesProduction curves
-- Oil Prices Oil Prices
-- CAPEX investmentCAPEX investment
Relationships between key factors and Relationships between key factors and NPVsNPVs
Relating functions developmentRelating functions development
-- Production and Production and NPVsNPVs
-- Oil prices and Oil prices and NPVsNPVs
-- CAPEXsCAPEXs and and NPVsNPVs
Key factors inputting range for sensitivity testingKey factors inputting range for sensitivity testing
(Inputting range shall be set subjectively)(Inputting range shall be set subjectively)
-- Production curves : 90% of base production ~ 120%Production curves : 90% of base production ~ 120%
-- Oil Prices : $11/b ~ Base price ~ $20/bOil Prices : $11/b ~ Base price ~ $20/b
-- CAPEX investmentCAPEX investment : 90% of base CAPEX ~ 120%: 90% of base CAPEX ~ 120%
23
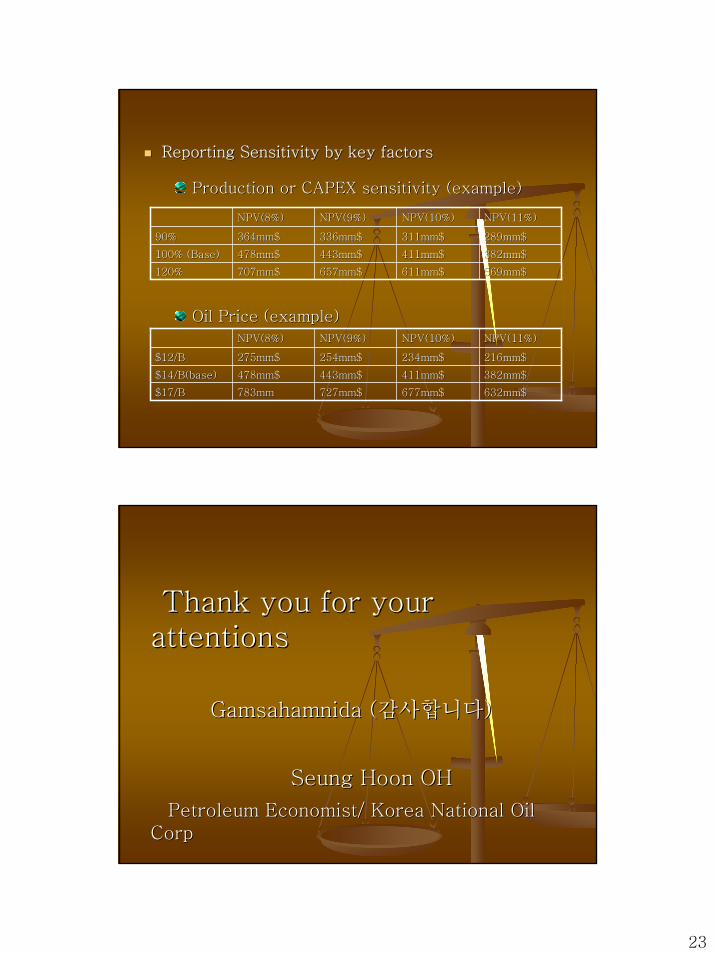
Reporting Sensitivity by key factors Reporting Sensitivity by key factors
NPV(8%)NPV(8%) NPV(9%)NPV(9%) NPV(10%)NPV(10%) NPV(11%)NPV(11%)
90%90% 364mm$364mm$ 336mm$336mm$ 311mm$311mm$ 289mm$289mm$
100% (Base)100% (Base) 478mm$478mm$ 443mm$443mm$ 411mm$411mm$ 382mm$382mm$
120%120% 707mm$707mm$ 657mm$657mm$ 611mm$611mm$ 569mm$569mm$
NPV(8%)NPV(8%) NPV(9%)NPV(9%) NPV(10%)NPV(10%) NPV(11%)NPV(11%)
$12/B$12/B 275mm$275mm$ 254mm$254mm$ 234mm$234mm$ 216mm$216mm$
$14/B(base)$14/B(base) 478mm$478mm$ 443mm$443mm$ 411mm$411mm$ 382mm$382mm$
$17/B$17/B 783mm783mm 727mm$727mm$ 677mm$677mm$ 632mm$632mm$
Production or CAPEX sensitivity (example)Production or CAPEX sensitivity (example)
Oil Price (example)Oil Price (example)
Thank you for your Thank you for your attentionsattentions
GamsahamnidaGamsahamnida ((감사합니다감사합니다))
Seung Hoon OH Seung Hoon OH
Petroleum Economist/ Korea National Oil Petroleum Economist/ Korea National Oil CorpCorp

24


