

Al Azhar Bulletin of Science Vol. 30, No. 1, (June) 2019, pp. 35-45
PHOTODECONTAMINATION OF VAT GREEN 1 AND DIANIX BLUE DYES BY
MWCNTs/x%TiO2 NANOCOMPOSITES SYNTHESIZED USING EVAPORATION
METHOD.
Badr A. El-sayeda,*
, Walied A. A. Mohamedb, Hoda R. Galal
b, H. M. H. Abd El-Bary
a, Mahmoud A.M.
Ahmeda
a Department of Chemistry, Faculty of Science, Al-Azhar University, Nasr City, Cairo, Egypt.
b Department of Inorganic Chemistry, National Research Centre, Giza, Egypt.
ABSTRACT
Multi-walled carbon nanotubes (MWCNTs) were prepared using chemical vapour deposition (CVD)
method. MWCNTs/titanium dioxide nanocomposites (MWCNTs/x%TiO2) with different weight ratios of TiO2 (x
= 3, 6 and 10%) were synthesized using a simple modified evaporation method and used as a photocatalysts.
Their photocatalytic activity investigated by studying the decontamination of two local textile dyes (Vat Green 1
and Dianix Blue Dyes) as an industrial organic pollutants commonly used in dyeing factories. The structure of
the synthesized photocatalysts were characterized using XRD, SEM, diffused reflectance UV-Vis spectroscopic
and N2 adsorption-desorption method. Also, their optical band gaps were estimated, by Kubelka-Munk equation,
as 3.51, 2.89, 2.80, 2.69 eV for MWCNTs and MWCNTs/x%TiO2 respectively. The mineralization of Vat Green
1 and Dianix Blue dyes in presence of MWCNTs and MWCNTs/x%TiO2 nanocomposites were investigated by
determining the decrease in chemical oxygen demand (COD). In addition, the suggested possible mechanism of
the photodegradation processes was studied.
Keywords: MWCNTs/%TiO2 Nanocomposites, Evaporation Method, Photodegradation Process, Vat
Green 1 Dye and Dianix Blue Dye.
1. INTRODUCTION
A novel one-dimensional (1D) carbon
nanotubes (CNTs) have a specific character,
unique mechanical properties and promising
potential applications [1-7]. The uniformity in
diameter, the dearth of purity, chirality and
alignment has hindered searching of the
intrinsic properties such as electronic,
mechanical, sorption properties of CNTs in
addition to their applications in novel electronic
systems [8-12]. In last decades, various
researches have been devoted to study the
structure of CNTs and their high level surface
area, stability toward electrochemical
processes, thermal and electrical properties.
CNTs have been used in removing hazardous
pollutants from wastewater in industrial field
such as leather and textile [13]. Due to its
effectiveness, ideally producing nontoxic end
products and easy operation, photocatalysis has
been commonly used as a technique for the
removing of industrial hazardous pollutants.
TiO2 (anatase) as a semiconductor with direct
band gap of 3.18 eV (wavelength, lower than
388 nm), has been used as an active
photocatalyst. The quick recombination
problem of photogenerated charge carriers
(electron-hole pairs) reduces the quantum
efficiency of the photocatalytic process.
Therefore, in recent years, many authors have
been designed and developed nanocomposites
including TiO2 to avoid this problem and the
pairing effect of MWCNTs with TiO2 has been
presented to provide a synergistic effect which
can enhance the overall reaction of the dyes
photodegradation [14-20], also TiO2 can
combined with other materials to like multi-
nano walled carbon nanotubes to obtain good
performance as photocatalyst. The prepared
nanocomposites were evaluated for the
photodegradation of the Vat Green 1 and
Dianix Blue Dyes under Sunlight, UV and
Xenon sources as well as the degree of
complete degradation of the two dyes were
assessed.
BADR A. EL-SAYED, et al. 36
2. EXPERIMENTAL
2.1. Materials
Dianix Blue Dye (4,8-diamino-1,5-
dihydroxy-2-(4-hydroxyphenyl)-4a,9a-dihydr-
oanthracene-9,10-dione) molecular weight
362.34 g/mol and the molecular formula
C20H14N2O5 and Vat Green 1 Dye
(Anthra[9,1,2-cde] benzo[rst]pentaphene-5,10-
dione, 16,17-dimethoxy) with molecular weight
of 516.54 g/mol and the molecular formula is
C36H20O4, both of these local dyes used in
dyeing process in Egypt. Sulphuric acid
(H2SO4) 3M, nitric acid (HNO3) 2M, Degussa
P25 TiO2 (78% :22% anatase :rutile) and
deionized water. All chemicals purchased from
Merck and SCRC, China, also all chemical
reagents used without further purification and
from analytical grade.
2.2. Measurements techniques
2.2.1. Scanning electron microscopy (SEM)
SEM of MWCNTs and MWCNTs/x%TiO2
nanocomposites were observed using Philips
XL-30 SEM analyzer (JEOL – JSM – T330 A)
with an acceleration voltage 30 KV instrument.
2.2.2. X-ray diffraction (XRD)
X-ray diffraction were recorded by Philips
Holland. Xpert MPD model using Cu-Kα
target. (Cu Kα radiation = 0.154 nm, 40 mA, 50
kV; data recorded at a 0.017° step size and 100
s/step).
2.2.3. UV-Vis spectrophotometers
UV-Vis spectroscopy (Schimadzu) was
conducted to monitor the concentration of the
investigated dyes after photodegradation .
2.2.4. Chemical Oxygen Demand (COD)
The chemical oxygen demand COD is
based on the chemical decomposition of
compounds, dissolved or suspended in water by
using COD Hanna Professional Instrument.
2.2.5. Photoreactors
The experimental setup was employed for
the photocatalytic studies by using both of
photoreactors UV-lamp (80-W) and Xe-lamp
(50-W) (Eng. Co., Ltd., Egypt). Sunlight
intensity for our experimental work was 3.4 lux
for UV light and 1009 lux for visible light,
which was measured by using (Lx-102 light
meter).
2.3. Synthesis of MWCNTs and
MWCNTs/x%TiO2 nanocomposites
2.3.1. Synthesis of MWCNTs
MWCNTs were synthesized according to
the literatures with some modification [21]. In
present paper, MWCNTs were prepared by
CVD method. The reactants were vaporized
into a hydrogen/argon atmosphere at 720°C
The MWCNTs as well as residual iron catalyst
particles were removed by annealing the as-
grown multi-walled carbon nanotubes in argon
at 1760°C for 5 h. The production yield of
MWCNTs in the converted carbon reaches
96%. To activate the surface, 1 gm of the
prepared MWCNTs was dispersed in a mixture
of concentrated acids of HNO3 and H2SO4 with
ratio of 1:3. The suspension kept in ultrasonic
for 7 hr, then washed and dried at 100°C.
2.3.2. Synthesis of MWCNTs/x%TiO2
nanocomposites
MWCNTs/x%TiO2 nanocomposites were
prepared using a simple modified evaporation
method as follow. MWCNTs were dispersed in
a 200 mL of H2O and sonicated for 25 min.
Then TiO2 powder with different ratios of 1, 3,
6 and 10% was added to MWCNTs suspension
during sonication. The suspension was filtered
by using a vacuum evaporator to accelerate the
water evaporation rate at 45°C. Then, the
MWCNTs/x%TiO2 composite were dried at
105°C for 24 h to avoid any probability of
physicochemical changes in the carbon
materials may occurs in the presence of oxygen
at higher temperatures.
2.4. Photocatalytic processes
The photocatalytic processes of Vat green 1
and Dianix blue dyes were carried out using
different light sources such as Sunlight, UV and
Xenon irradiation without photocatalysts, and
with MWCNTs, MWCNTs/3%TiO2-
MWCNTs/6%TiO2-MWCNTs/10%TiO2 nano-
composites for various irradiation times to
identify the economical and suitable process for
PHOTODECONTAMINATION OF VAT GREEN 1 AND DIANIX … 37
complete mineralization of the two textile dyes.
The substrate concentration and the
photocatalytic degradation experiments were
studied to optimize the photocatalyst
concentrations. Dianix Blue dye concentrations
were varied from 2.8×10⁻⁵
M to 2×10⁻⁵
M and
Vat Green 1 dye concentrations were varied
from 2.2×10⁻⁵
M to 1.6×10⁻⁵
M. The
photocatalyst concentrations were 0.1g/100 ml
for all photocatalytic processes. On the other
hand the photocatalytic degradation irradiation
time was reached to 7 h. The photocatalyst
concentration effect was studied by different
the amounts of MWCNTs/%TiO2
nanocomposites under irradiation with
Sunlight, UV and Xenon lamps. The
experimental setups were employed for the
photocatalytic studies by using both of
photoreactors UV-lamp (80-W) and Xe-lamp
(50-W) (Eng. Co., Ltd., Egypt) and sunlight
intensity was 3.4 lux for UV light and 1009 lux
for visible light measured by (Lx-102 light
meter). The concentration of the investigated
dyes after photodegradation were analyzed by
using a UV-Vis spectrophotometer
(Schimadzu) by measuring the change in their
maximum absorbance values at 623 nm for
Dianix Blue dye and at 630 nm for Vat Green 1
dye. Also COD analysis used to confirm the
mineralization of the two dyes.
3. RESULTS AND DISCUSSION
3.1. Characterizations And Measurements
3.1.1. XRD patterns of MWCNTs and
MWCNTs/x%TiO2 nanocomposites
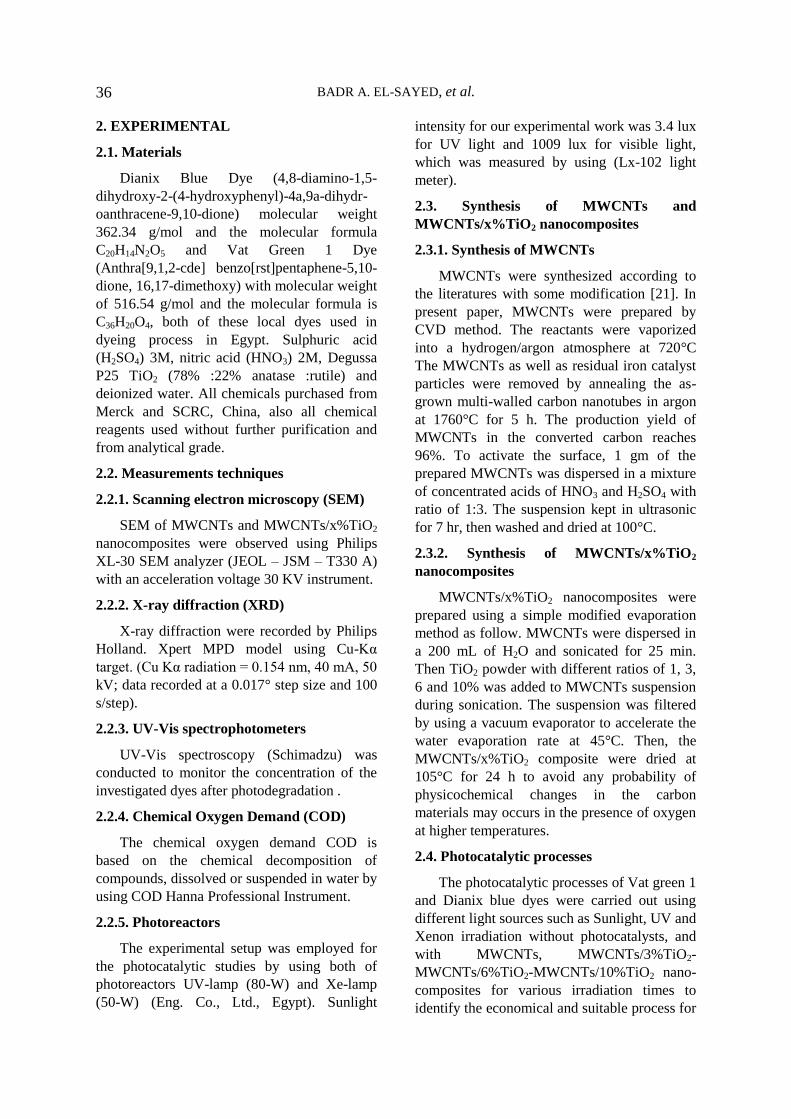
The characteristic peaks around 25.7° and
41.9° appeared in XRD patterns as shown in
(Figure - 1 (a)) were correspond to the (002)
and (100) planes respectively reflected on the
prepared MWCNTs. On the other hand the
characteristic peaks observed in XRD patterns
for MWCNTs/x%TiO2 nanocomposites as
shown in (Figure - 1 (b), (c) and (d)) located at
2Ɵ = 25.17°,36.48°,48.84°,54.66° and 62.37°,
correspond to the (101), (004), (200), (211) and
(204) planes respectively reflected on the
prepared MWCNTs/x%TiO2 nanocomposites.
The shifts of the peaks are a result for trapping
of electrons at the active sites of the
nanocomposites, which results in hindering
electron-hole pair recombination [22,23].
Figure (1) XRD patterns of the synthesized MWCNTs
and MWCNTs/x%TiO2 nanocomposites.
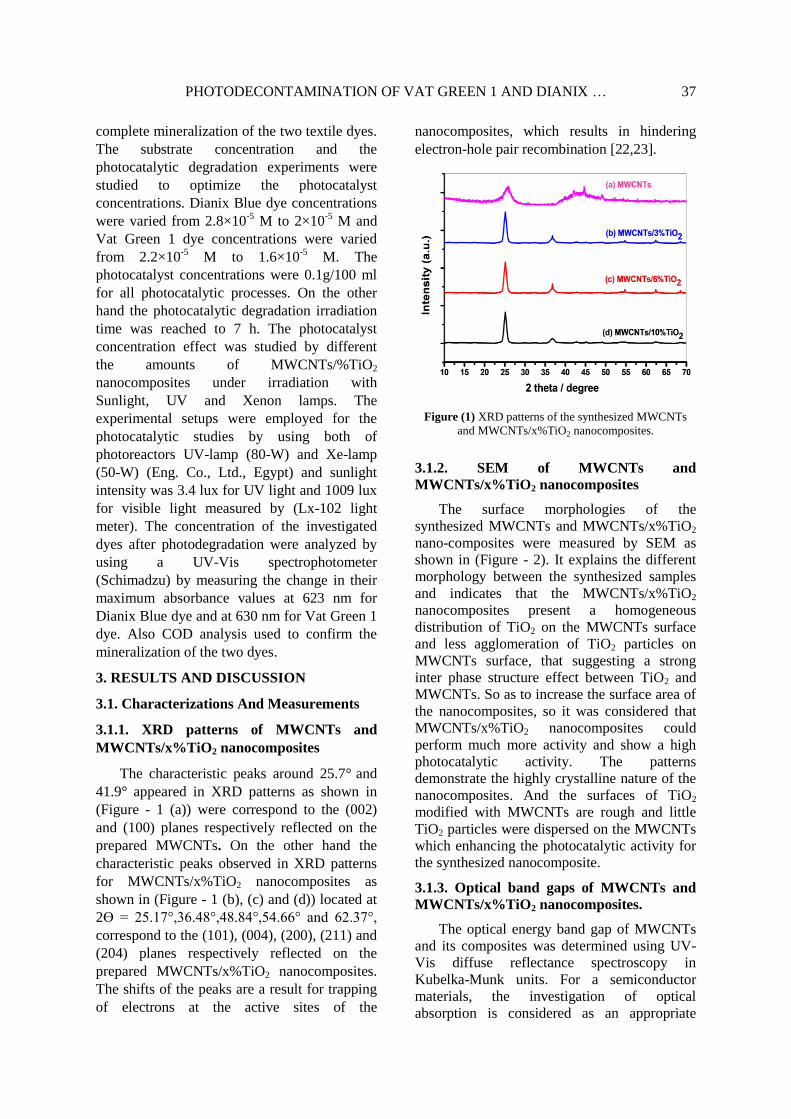
3.1.2. SEM of MWCNTs and
MWCNTs/x%TiO2 nanocomposites
The surface morphologies of the
synthesized MWCNTs and MWCNTs/x%TiO2
nano-composites were measured by SEM as
shown in (Figure - 2). It explains the different
morphology between the synthesized samples
and indicates that the MWCNTs/x%TiO2
nanocomposites present a homogeneous
distribution of TiO2 on the MWCNTs surface
and less agglomeration of TiO2 particles on
MWCNTs surface, that suggesting a strong
inter phase structure effect between TiO2 and
MWCNTs. So as to increase the surface area of
the nanocomposites, so it was considered that
MWCNTs/x%TiO2 nanocomposites could
perform much more activity and show a high
photocatalytic activity. The patterns
demonstrate the highly crystalline nature of the
nanocomposites. And the surfaces of TiO2
modified with MWCNTs are rough and little
TiO2 particles were dispersed on the MWCNTs
which enhancing the photocatalytic activity for
the synthesized nanocomposite.
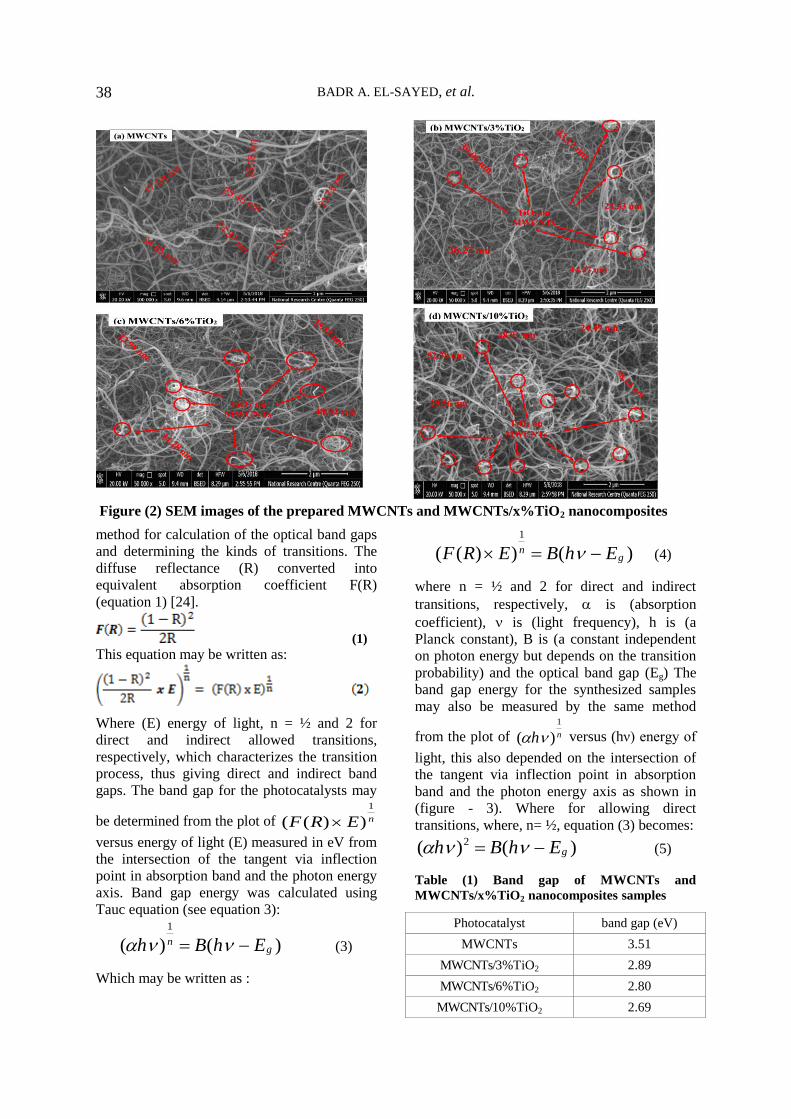
3.1.3. Optical band gaps of MWCNTs and
MWCNTs/x%TiO2 nanocomposites.
The optical energy band gap of MWCNTs
and its composites was determined using UV-
Vis diffuse reflectance spectroscopy in
Kubelka-Munk units. For a semiconductor
materials, the investigation of optical
absorption is considered as an appropriate
BADR A. EL-SAYED, et al. 38
method for calculation of the optical band gaps
and determining the kinds of transitions. The
diffuse reflectance (R) converted into
equivalent absorption coefficient F(R)
(equation 1) [24].
(1) This equation may be written as:
Where (E) energy of light, n = ½ and 2 for
direct and indirect allowed transitions,
respectively, which characterizes the transition
process, thus giving direct and indirect band
gaps. The band gap for the photocatalysts may
be determined from the plot of nERF
1
))((
versus energy of light (E) measured in eV from
the intersection of the tangent via inflection
point in absorption band and the photon energy
axis. Band gap energy was calculated using
Tauc equation (see equation 3):
)()(
1
gn EhBh (3)
Which may be written as :
)())((
1
gn EhBERF (4)
where n = ½ and 2 for direct and indirect
transitions, respectively, is (absorption
coefficient), is (light frequency), h is (a
Planck constant), B is (a constant independent
on photon energy but depends on the transition
probability) and the optical band gap (Eg) The
band gap energy for the synthesized samples
may also be measured by the same method
from the plot of nh
1
)( versus (hν) energy of
light, this also depended on the intersection of
the tangent via inflection point in absorption
band and the photon energy axis as shown in
(figure - 3). Where for allowing direct
transitions, where, n= ½, equation (3) becomes:
)()( 2gEhBh (5)
Table (1) Band gap of MWCNTs and
MWCNTs/x%TiO2 nanocomposites samples
Photocatalyst band gap (eV)
MWCNTs 3.51
MWCNTs/3%TiO2 2.89
MWCNTs/6%TiO2 2.80
MWCNTs/10%TiO2 2.69
Figure (2) SEM images of the prepared MWCNTs and MWCNTs/x%TiO2 nanocomposites
PHOTODECONTAMINATION OF VAT GREEN 1 AND DIANIX … 39
Figure (3) Kubelka-Munk curves for band gap estimation
of )a) MWCNTs and (b, c and d) MWCNTs with different
TiO2 % (3, 6 and 10%), respectively.
The optical band gap energy (Eg) calculated
values are shown in Table-1. The value of Eg
for MWCNTs was 3.51 eV, which decreases to
2.89, 2.80 and 2.69 eV for MWCNTs/3%TiO2,
MWCNTs/6%TiO2 and MWCNTs/10%TiO2
respectively. This effect may be due to two
reasons, an increase in vacancies or chemical
defects present in the intergranular areas, also
due to the chemical interaction between
MWCNTs and TiO2 to create a new energy
level reducing the Eg. MWCNTs/x%TiO2
nanocomposites with less Eg are optically
active and used in photocatalytic degradation
for environmental decontamination. The
decrease in band gap values suggests high
photocatalytic activity of the synthesized
nanocomposites in visible light range. From the
obtained values, it is clear that the band gap
values depend on both MWCNTs support and
the TiO2 percentages in the binary
nanocomposites. The variation of the band gap
with increasing the particle size is an important
role for photocatalytic activity of
MWCNTs/x%TiO2 nanocomposites [25-27].
The functionalization of MWCNTs and TiO2 is
expected to enhance the efficiency of the
photocatalytic activity of the produced
nanocomposites.
3.1.4. BET of MWCNTs and
MWCNTs/x%TiO2 nanocomposites
Table-2 presents the surface area Brunauer-
Emmett-Teller (BET) (m2/g), total pore
volume (cm3/g), average pore diameter (nm)
and monolayer adsorption amount (Vm) of the
MWCNTs and synthesized MWCNTs/x%TiO2
nanocomposites. The surface area of
MWCNTs, MWCNTs/3%TiO2, MWCNTs/
6%TiO2 and MWCNTs/10%TiO2 are 95.201,
98.142, 104.251 and 117.125 m2/g respectively
(see Table-2 ).
Table (2) BET parameters of MWCNTs and MWCNTs/x%TiO2 nanocomposites samples
Photocatalyst MWCNTs MWCNTs/3%TiO2 MWCNTs/6%TiO2 MWCNTs/10%TiO2
BET (m2/g) 95.201 98.142 104.251 117.125
Total pore volume (cm3/g) 0.2139 0.2089 0.2001 0.1939
Average pore diameter (nm) 8.987 9.181 9.301 9.521
Vm (cm3/g) 21.843 22.148 22.800 23.113
BADR A. EL-SAYED, et al. 40
0.0 0.2 0.4 0.6 0.8 1.0
0
100
200
300
400
500
600
Relative Pressure P/P0
Vo
lum
e [
cc
/g]
Ads MWCNT
Ads MWCNT/3% TiO2
Ads MWCNT/6% TiO2
Ads MWCNT/10% TiO2
Des MWCNT
Des MWCNT/3% TiO2
Des MWCNT/6% TiO2
Des MWCNT/10% TiO2
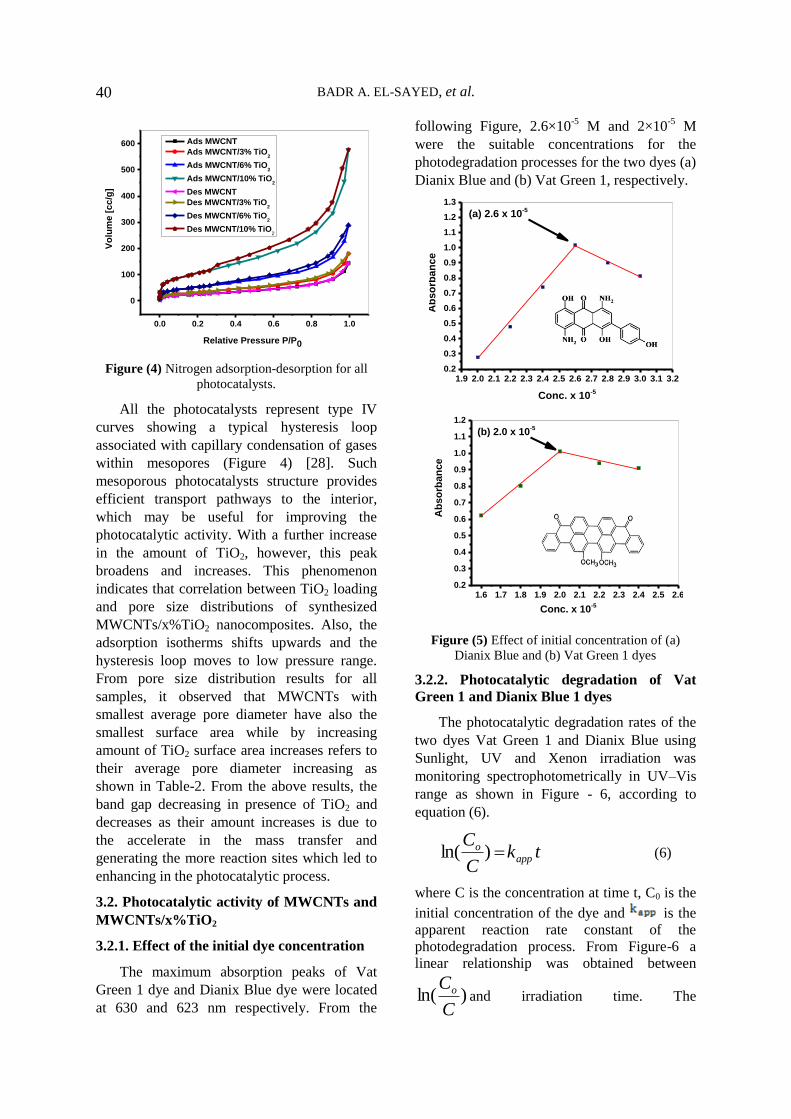
Figure (4) Nitrogen adsorption-desorption for all
photocatalysts.
All the photocatalysts represent type IV
curves showing a typical hysteresis loop
associated with capillary condensation of gases
within mesopores (Figure 4) [28]. Such
mesoporous photocatalysts structure provides
efficient transport pathways to the interior,
which may be useful for improving the
photocatalytic activity. With a further increase
in the amount of TiO2, however, this peak
broadens and increases. This phenomenon
indicates that correlation between TiO2 loading
and pore size distributions of synthesized
MWCNTs/x%TiO2 nanocomposites. Also, the
adsorption isotherms shifts upwards and the
hysteresis loop moves to low pressure range.
From pore size distribution results for all
samples, it observed that MWCNTs with
smallest average pore diameter have also the
smallest surface area while by increasing
amount of TiO2 surface area increases refers to
their average pore diameter increasing as
shown in Table-2. From the above results, the
band gap decreasing in presence of TiO2 and
decreases as their amount increases is due to
the accelerate in the mass transfer and
generating the more reaction sites which led to
enhancing in the photocatalytic process.
3.2. Photocatalytic activity of MWCNTs and
MWCNTs/x%TiO2
3.2.1. Effect of the initial dye concentration
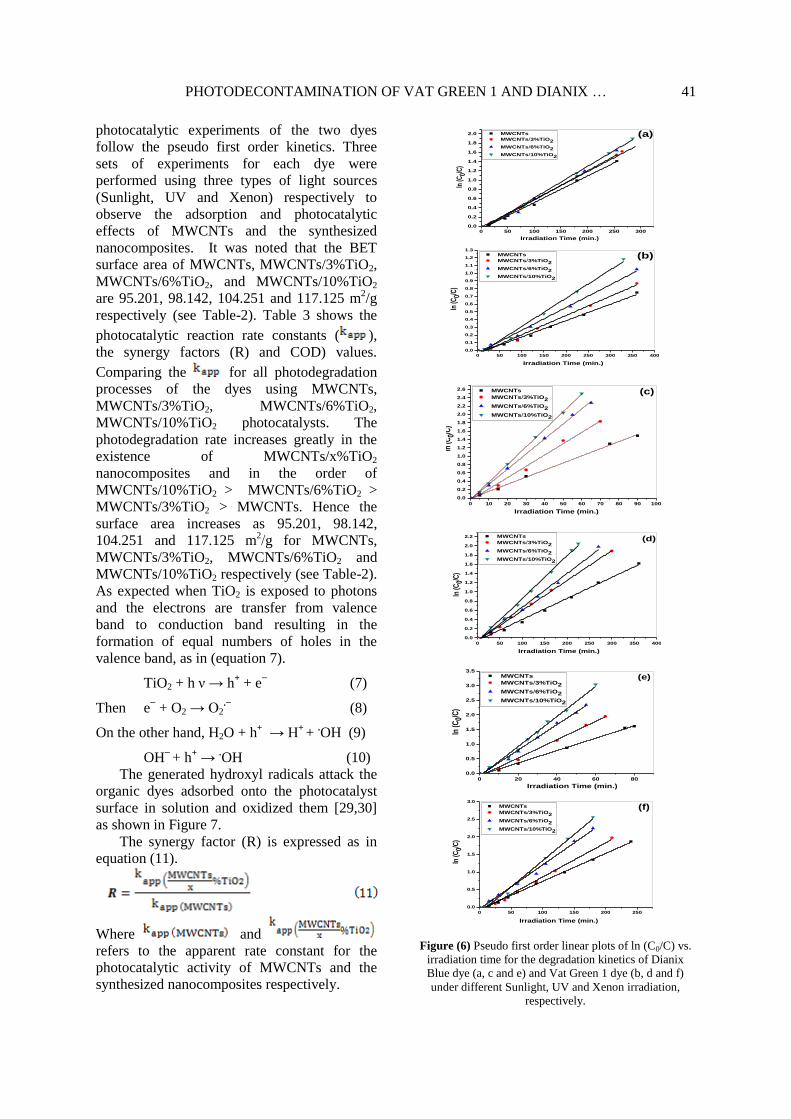
The maximum absorption peaks of Vat
Green 1 dye and Dianix Blue dye were located
at 630 and 623 nm respectively. From the
following Figure, 2.6×10⁻⁵
M and 2×10⁻⁵
M
were the suitable concentrations for the
photodegradation processes for the two dyes (a)
Dianix Blue and (b) Vat Green 1, respectively.
1.9 2.0 2.1 2.2 2.3 2.4 2.5 2.6 2.7 2.8 2.9 3.0 3.1 3.20.2
0.3
0.4
0.5
0.6
0.7
0.8
0.9
1.0
1.1
1.2
1.3
(a) 2.6 x 10⁻⁵
Ab
so
rban
ce
Conc. x 10-5
1.6 1.7 1.8 1.9 2.0 2.1 2.2 2.3 2.4 2.5 2.60.2
0.3
0.4
0.5
0.6
0.7
0.8
0.9
1.0
1.1
1.2
(b) 2.0 x 10⁻⁵
Ab
so
rban
ce
Conc. x 10-5
Figure (5) Effect of initial concentration of (a)
Dianix Blue and (b) Vat Green 1 dyes
3.2.2. Photocatalytic degradation of Vat
Green 1 and Dianix Blue 1 dyes
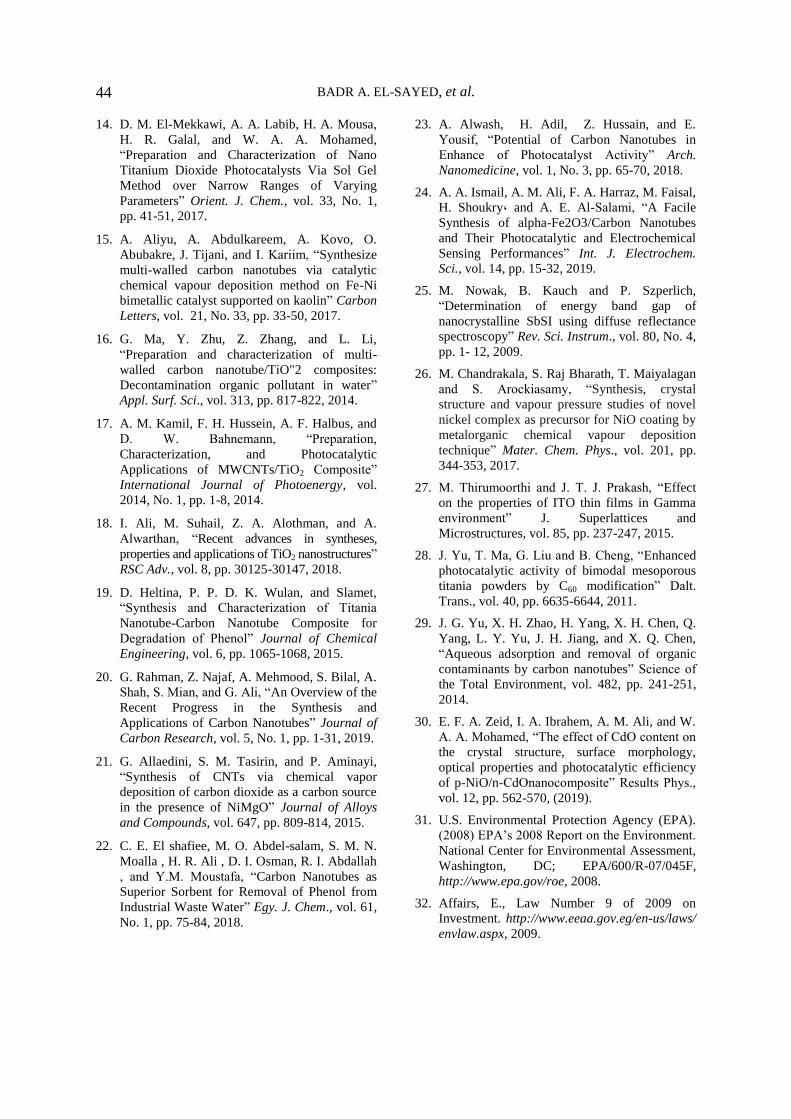
The photocatalytic degradation rates of the
two dyes Vat Green 1 and Dianix Blue using
Sunlight, UV and Xenon irradiation was
monitoring spectrophotometrically in UV–Vis
range as shown in Figure - 6, according to
equation (6).
tkC
Capp
o )ln( (6)
where C is the concentration at time t, C0 is the
initial concentration of the dye and is the
apparent reaction rate constant of the
photodegradation process. From Figure-6 a
linear relationship was obtained between
)ln(C
Coand irradiation time. The
PHOTODECONTAMINATION OF VAT GREEN 1 AND DIANIX … 41
photocatalytic experiments of the two dyes
follow the pseudo first order kinetics. Three
sets of experiments for each dye were
performed using three types of light sources
(Sunlight, UV and Xenon) respectively to
observe the adsorption and photocatalytic
effects of MWCNTs and the synthesized
nanocomposites. It was noted that the BET
surface area of MWCNTs, MWCNTs/3%TiO2,
MWCNTs/6%TiO2, and MWCNTs/10%TiO2
are 95.201, 98.142, 104.251 and 117.125 m2/g
respectively (see Table-2). Table 3 shows the
photocatalytic reaction rate constants ( ),
the synergy factors (R) and COD) values.
Comparing the for all photodegradation
processes of the dyes using MWCNTs,
MWCNTs/3%TiO2, MWCNTs/6%TiO2,
MWCNTs/10%TiO2 photocatalysts. The
photodegradation rate increases greatly in the
existence of MWCNTs/x%TiO2
nanocomposites and in the order of
MWCNTs/10%TiO2 > MWCNTs/6%TiO2 >
MWCNTs/3%TiO2 > MWCNTs. Hence the
surface area increases as 95.201, 98.142,
104.251 and 117.125 m2/g for MWCNTs,
MWCNTs/3%TiO2, MWCNTs/6%TiO2 and
MWCNTs/10%TiO2 respectively (see Table-2).
As expected when TiO2 is exposed to photons
and the electrons are transfer from valence
band to conduction band resulting in the
formation of equal numbers of holes in the
valence band, as in (equation 7).
TiO2 + h ν → h+ + e
− (7)
Then e− + O2 → O2
.− (8)
On the other hand, H2O + h+
→ H+
+ .OH (9)
OH−
+ h+ →
.OH (10)
The generated hydroxyl radicals attack the
organic dyes adsorbed onto the photocatalyst
surface in solution and oxidized them [29,30]
as shown in Figure 7.
The synergy factor (R) is expressed as in
equation (11).
Where and
refers to the apparent rate constant for the
photocatalytic activity of MWCNTs and the
synthesized nanocomposites respectively.
0 50 100 150 200 250 300
0.0
0.2
0.4
0.6
0.8
1.0
1.2
1.4
1.6
1.8
2.0
Irradiation Time (min.)
ln (C
0/C)
MWCNTs
MWCNTs/3%TiO2
MWCNTs/6%TiO2
MWCNTs/10%TiO2
(a)
0 50 100 150 200 250 300 350 400
0.0
0.1
0.2
0.3
0.4
0.5
0.6
0.7
0.8
0.9
1.0
1.1
1.2
1.3
(b)
Irradiation Time (min.)
ln (C
0/C)
MWCNTs
MWCNTs/3%TiO2
MWCNTs/6%TiO2
MWCNTs/10%TiO2
0 10 20 30 40 50 60 70 80 90 100
0.0
0.2
0.4
0.6
0.8
1.0
1.2
1.4
1.6
1.8
2.0
2.2
2.4
2.6 (c)
ln (C
0/C)
Irradiation Time (min.)
MWCNTs
MWCNTs/3%TiO2
MWCNTs/6%TiO2
MWCNTs/10%TiO2
0 50 100 150 200 250 300 350 400
0.0
0.2
0.4
0.6
0.8
1.0
1.2
1.4
1.6
1.8
2.0
2.2 (d)
ln (C
0/C)
Irradiation Time (min.)
MWCNTs
MWCNTs/3%TiO2
MWCNTs/6%TiO2
MWCNTs/10%TiO2
0 20 40 60 80
0.0
0.5
1.0
1.5
2.0
2.5
3.0
3.5
(e)
Irradiation Time (min.)
ln (C
0/C)
MWCNTs
MWCNTs/3%TiO2
MWCNTs/6%TiO2
MWCNTs/10%TiO2
0 50 100 150 200 250
0.0
0.5
1.0
1.5
2.0
2.5
3.0
(f)
Irradiation Time (min.)
ln (C
0/C)
MWCNTs
MWCNTs/3%TiO2
MWCNTs/6%TiO2
MWCNTs/10%TiO2
Figure (6) Pseudo first order linear plots of ln (C0/C) vs.
irradiation time for the degradation kinetics of Dianix
Blue dye (a, c and e) and Vat Green 1 dye (b, d and f)
under different Sunlight, UV and Xenon irradiation,
respectively.

BADR A. EL-SAYED, et al. 42
hν
Pollutant photodegradation
e-
h+ MWCNTs Recombination
OH−, H2O
.OH
CO2+H2O+Inorganic ions
O2
O2.-
Figure (7) Schematic diagram of the proposed
mechanism of photocatalytic degradation over
MWCNTs /TiO2 nanocomposite.
Generally, the organic pollutant dyes can't
degrade completely under Sunlight irradiation
and according to Egyptian Environmental Law
(Law NO.9) [31,32], The COD value allowed is
less than 1000 ppm. From the above table, the
photodegradation of the two dyes in presence
of MWCNTs and MWCNTs/x%TiO2
nanocomposites under Sunlight still had COD
(ppm) values higher than the allowed value
(1000 ppm). While the photodegradation of the
two dyes exposed to both of UV and Xenon
light sources recorded COD values less than
1000 (ppm), especially the MWCNTs/10%TiO2
samples which has COD values less than 1000
(ppm), this indicate that they are used as
excellent photocatalysts. Table-3 indicated that
the photocatalytic degradation process of the
dyes increases with increasing the TiO2 weight
percent in the nanocomposites from 3 to 10%
and reaches its maximum at a 10%TiO2 in the
nanocomposite. Also the highest
photodegradation rate was observed using
Xenon irradiation with MWCNTs/10%TiO2
nanocomposite, where the number of photons
absorbed and the number of dye molecules
adsorbed on the photocatalysts were increased
which promotes the photodegradation rate.
Table (3) Photodegradation rates (kapp), synergy factors (R) and Chemical Oxygen Demand (COD) values of
the two dyes with different photocatalysts in the existence of different irradiation sources.
Sun
lig
ht
irra
dia
tion
Dianix Blue dye
Photocatalyst kapp (s-1
) R COD (ppm)
MWCNTs 0.00571 ± 1.95619E-4 1 2645
MWCNTs/3%TiO2 0.00622 ± 9.45456E-5 1.089 2470
MWCNTs/6%TiO2 0.00658 ± 2.44397E-4 1.152 2108
MWCNTs/10%TiO2 0.00679 ± 1.52953E-4 1.189 1985
Vat Green 1 dye
Photocatalyst kapp (s-1
) R COD (ppm)
MWCNTs 0.00212 ± 7.95952E-5 1 3785
MWCNTs/3%TiO2 0.00248 ± 1.03928E-4 1.169 3205
MWCNTs/6%TiO2 0.00294 ± 1.11411E-4 1.386 2988
MWCNTs/10%TiO2 0.00366 ± 1.36129E-4 1.726 2645
UV
irr
adia
tion
Dianix Blue dye
Photocatalyst kapp (s-1
) R COD ( ppm )
MWCNTs 0.017 ± 3.50919E-4 1 2258
MWCNTs/3%TiO2 0.02711 ± 0.00111 1.594 1310
MWCNTs/6%TiO2 0.03612 ± 5.76817E-4 2.124 1025
MWCNTs/10%TiO2 0.04213 ± 5.54871E-4 2.478 865
Vat Green 1 dye
Photocatalyst kapp (s-1
) R COD ( ppm )
MWCNTs 0.00458 ± 1.21127E-4 1 2185
MWCNTs/3%TiO2 0.00653 ± 1.52995E-4 1.425 1764
MWCNTs/6%TiO2 0.00732 ± 2.23643E-4 1.598 1388
MWCNTs/10%TiO2 0.00929 ± 1.99737E-4 2.028 925
Xen
on i
rrad
iati
on
Dianix Blue dye
Photocatalyst kapp (s-1
) R COD ( ppm )
MWCNTs 0.02114 ± 5.88147E-4 1 2101
MWCNTs/3%TiO2 0.03128 ± 0.00119 1.479 1156
MWCNTs/6%TiO2 0.04332 ± 0.00114 2.049 864
MWCNTs/10%TiO2 0.05126 ± 0.00168 2.424 714
Vat Green 1 dye
Photocatalyst kapp (s-1
) R COD ( ppm )
MWCNTs 0.00795 ± 1.53579E-4 1 1785
MWCNTs/3%TiO2 0.00973 ± 3.45827E-4 1.223 1325
MWCNTs/6%TiO2 0.01251 ± 3.55707E-4 1.573 1080
MWCNTs/10%TiO2 0.01491 ± 5.29326E-4 1.875 897

PHOTODECONTAMINATION OF VAT GREEN 1 AND DIANIX … 43
CONCLUSION
Semiconductor photocatalysis seems to be
a promising technology that encompasses a
range of applications in environmental systems
such as hazardous waste remediation, air
purification. Photocatalytic oxidation using
MWCNTs, MWCNTs/3%TiO2, MWCNTs/
6%TiO2 and MWCNTs/10%TiO2 nano-
composites in the presence of Sunlight, UV and
Xenon lights were effectively applied for the
photodegradation of Vat Green 1 and Dianix
Blue dyes. Also, the percentage of TiO2 in
nanocomposites has a synergistic effect on
MWCNTs, polymorphs of TiO2 due to the
dominant structure which cause high levels of
crystalline of the nanocomposites. So it
concluded that the synthesized nanocomposites
have a good photocatalytic activity especially
the MWCNTs/10%TiO2 sample. Both of the
photodegradation rates k (s-1
) and the synergy
factors (R) were increased, also the
photodegradation processes using COD
analysis revealed a higher degree of complete
mineralization of the two textile dyes especially
by using Xenon irradiation, so these
nanocomposites were an effective for the
removal of the dyes from an aqueous solution
and follow COD limits of Egyptian
Environmental Law (Law NO.9).
REFERENCES
1. A. M. Kamil, H. T. Mohammed, A. A. Balakit,
F. H. Hussein, D. W. Bahnemann, and G. A. El-
Hiti, “Synthesis, Characterization and
Photocatalytic Activity of Carbon
Nanotube/Titanium Dioxide Nanocomposites”
Arab. J. Sci. Eng., vol. 43, No. 1, pp. 199-210,
2018.
2. Y. Huang, R. Li, D. Chen, X. Hu, P. Chen, Z.
Chen, and D. Li, “Synthesis and
Characterization of CNT/TiO2/ZnO Composites
with High Photocatalytic Performance”
Catalysts, vol. 8, No. 4, pp. 151-156, 2018.
3. J. O. Marques Neto, C. R. Bellato, C. H. F. De
Souza, R. C. Da Silva, and P. A. Rocha,
“Synthesis, Characterization and Enhanced
Photocatalytic Activity of Iron Oxide/Carbon
Nanotube/Ag-doped TiO2 Nanocomposites”J.
Braz. Chem. Soc., vol. 28, No. 12, pp. 2301-
2312 ,2017.
4. N. M. Mahmoodi, P. Rezaei, C. Ghotbei, and
M. Kazemeini, Fibers, “Copper oxide-carbon
nanotube (CuO/CNT) nanocomposite:
Synthesis and photocatalytic dye degradation
from colored textile wastewater” Polym., vol.
17, No. 11, pp. 1842-1848 , 2016.
5. M. Shaban, A. M. Ashraf, and M. R.
Abukhadra, “TiO2 Nanoribbons/Carbon
Nanotubes Composite with Enhanced
Photocatalytic Activity; Fabrication,
Characterization, and Application”
Characterization, and Application. Sci. Rep.,
vol. 8, No. 781, 1-17, 2018.
6. A. Salama, A. Mohamed, N. M. Aboamera, T.
A. Osman, and A. Khattab, “Photocatalytic
degradation of organic dyes using composite
nanofibers under UV irradiation”Appl.
Nanosci., vol. 8, pp. 155-161 , 2018.
7. A. Mohamed, S. Yousef, M. Ali Abdelnaby,
T.A. Osman, B. Hamawandi, M.S. Topark, M.
Muhammed and A. Uheida, “Photocatalytic
degradation of organic dyes and enhanced
mechanical properties of PAN/CNTs composite
nanofibers”Sep. Purif. Technol., vol. 182, pp.
219-223, 2017.
8. W. Zhu, Z. Li, C. He, S. Faqian and Y. Zhou,
“Enhanced photodegradation of sulfa-
methoxazole by a novel WO3-CNT composite
under visible light irradiation” J. Alloys
Compd., vol. 754, pp. 153-162, 2018.
9. R. S. Lankone, J. Wang, J. F. Ranville, and D.
H. Fairbrother, “Photodegradation of polymer-
CNT nanocomposites: effect of CNT loading and
CNT release characteristics”Environmental
Science: Nano, vol. 4, 967-982, 2017.
10. W. Yang, L. Lang, X. Yin, and C. Wu,
“Formation mechanism of 0.4-nm single-walled
carbon nanotubes in AlPO4-5 crystals by low-
temperature hydrocracking” Carbon, vol. 115,
pp. 120-127, 2017.
11. D. Eder, “Carbon Nanotube−Inorganic
Hybrids” Chem. Rev., vol. 110, pp. 1348-1385,
2010.
12. J. Moma, J. Baloyi, and T. Ntho, “Synthesis and
characterization of an efficient and stable Al/Fe
pillared clay catalyst for the catalytic wet air
oxidation of phenol”RSC Adv., vol. 8, pp. 30115-
30124, 2018.
13. M. Loginov, N. Lebovka, and E. Vorobiev,
“Hybrid Multiwalled Carbon Nanotube −
Laponite Sorbent for Removal of Methylene
Blue from Aqueous Solutions” Journal of
Colloid and Interface Science, vol. 431, pp.
241-249, 2014.
BADR A. EL-SAYED, et al. 44
14. D. M. El-Mekkawi, A. A. Labib, H. A. Mousa,
H. R. Galal, and W. A. A. Mohamed,
“Preparation and Characterization of Nano
Titanium Dioxide Photocatalysts Via Sol Gel
Method over Narrow Ranges of Varying
Parameters” Orient. J. Chem., vol. 33, No. 1,
pp. 41-51, 2017.
15. A. Aliyu, A. Abdulkareem, A. Kovo, O.
Abubakre, J. Tijani, and I. Kariim, “Synthesize
multi-walled carbon nanotubes via catalytic
chemical vapour deposition method on Fe-Ni
bimetallic catalyst supported on kaolin” Carbon
Letters, vol. 21, No. 33, pp. 33-50, 2017.
16. G. Ma, Y. Zhu, Z. Zhang, and L. Li,
“Preparation and characterization of multi-
walled carbon nanotube/TiO"2 composites:
Decontamination organic pollutant in water”
Appl. Surf. Sci., vol. 313, pp. 817-822, 2014.
17. A. M. Kamil, F. H. Hussein, A. F. Halbus, and
D. W. Bahnemann, “Preparation,
Characterization, and Photocatalytic
Applications of MWCNTs/TiO2 Composite”
International Journal of Photoenergy, vol.
2014, No. 1, pp. 1-8, 2014.
18. I. Ali, M. Suhail, Z. A. Alothman, and A.
Alwarthan, “Recent advances in syntheses,
properties and applications of TiO2 nanostructures”
RSC Adv., vol. 8, pp. 30125-30147, 2018.
19. D. Heltina, P. P. D. K. Wulan, and Slamet,
“Synthesis and Characterization of Titania
Nanotube-Carbon Nanotube Composite for
Degradation of Phenol” Journal of Chemical
Engineering, vol. 6, pp. 1065-1068, 2015.
20. G. Rahman, Z. Najaf, A. Mehmood, S. Bilal, A.
Shah, S. Mian, and G. Ali, “An Overview of the
Recent Progress in the Synthesis and
Applications of Carbon Nanotubes” Journal of
Carbon Research, vol. 5, No. 1, pp. 1-31, 2019.
21. G. Allaedini, S. M. Tasirin, and P. Aminayi,
“Synthesis of CNTs via chemical vapor
deposition of carbon dioxide as a carbon source
in the presence of NiMgO” Journal of Alloys
and Compounds, vol. 647, pp. 809-814, 2015.
22. C. E. El shafiee, M. O. Abdel-salam, S. M. N.
Moalla , H. R. Ali , D. I. Osman, R. I. Abdallah
, and Y.M. Moustafa, “Carbon Nanotubes as
Superior Sorbent for Removal of Phenol from
Industrial Waste Water” Egy. J. Chem., vol. 61,
No. 1, pp. 75-84, 2018.
23. A. Alwash, H. Adil, Z. Hussain, and E.
Yousif, “Potential of Carbon Nanotubes in
Enhance of Photocatalyst Activity” Arch.
Nanomedicine, vol. 1, No. 3, pp. 65-70, 2018.
24. A. A. Ismail, A. M. Ali, F. A. Harraz, M. Faisal,
H. Shoukry, and A. E. Al-Salami, “A Facile
Synthesis of alpha-Fe2O3/Carbon Nanotubes
and Their Photocatalytic and Electrochemical
Sensing Performances” Int. J. Electrochem.
Sci., vol. 14, pp. 15-32, 2019.
25. M. Nowak, B. Kauch and P. Szperlich,
“Determination of energy band gap of
nanocrystalline SbSI using diffuse reflectance
spectroscopy” Rev. Sci. Instrum., vol. 80, No. 4,
pp. 1- 12, 2009.
26. M. Chandrakala, S. Raj Bharath, T. Maiyalagan
and S. Arockiasamy, “Synthesis, crystal
structure and vapour pressure studies of novel
nickel complex as precursor for NiO coating by
metalorganic chemical vapour deposition
technique” Mater. Chem. Phys., vol. 201, pp.
344-353, 2017.
27. M. Thirumoorthi and J. T. J. Prakash, “Effect
on the properties of ITO thin films in Gamma
environment” J. Superlattices and
Microstructures, vol. 85, pp. 237-247, 2015.
28. J. Yu, T. Ma, G. Liu and B. Cheng, “Enhanced
photocatalytic activity of bimodal mesoporous
titania powders by C60 modification” Dalt.
Trans., vol. 40, pp. 6635-6644, 2011.
29. J. G. Yu, X. H. Zhao, H. Yang, X. H. Chen, Q.
Yang, L. Y. Yu, J. H. Jiang, and X. Q. Chen,
“Aqueous adsorption and removal of organic
contaminants by carbon nanotubes” Science of
the Total Environment, vol. 482, pp. 241-251,
2014.
30. E. F. A. Zeid, I. A. Ibrahem, A. M. Ali, and W.
A. A. Mohamed, “The effect of CdO content on
the crystal structure, surface morphology,
optical properties and photocatalytic efficiency
of p-NiO/n-CdOnanocomposite” Results Phys.,
vol. 12, pp. 562-570, (2019).
31. U.S. Environmental Protection Agency (EPA).
(2008) EPA’s 2008 Report on the Environment.
National Center for Environmental Assessment,
Washington, DC; EPA/600/R-07/045F,
http://www.epa.gov/roe, 2008.
32. Affairs, E., Law Number 9 of 2009 on
Investment. http://www.eeaa.gov.eg/en-us/laws/
envlaw.aspx, 2009.

PHOTODECONTAMINATION OF VAT GREEN 1 AND DIANIX … 45
رقاءالزوالديانيكس 1 الخضراءات ڨال يإزالة ضوئية لتلوثات صبغت
ستخدام أنابيب الكربون النانوية متعددة الجدران با
ستخدام طريقة التبخرباالمطعمة بنسب وزنية من ثانى أكسيد التيتانيوم المركبة المحضرة
ــــــــــــــ
1بدرالدين عواد السيد محمد،
2وليد عبدالحليم عبدالغفار محمد،
2 هدى محمد رفعت محمد جالل،
1
لباري، حسن محمد حسن عبدا1
محمود علي محمود احمد
1 جامعة األزهر –كلية العلوم )بنين( -قسم الكيمياء
2 مصر -الجيزة -المركز القومي للبحوث –قسم الكيمياء
الملخص العربي
أكسةةةي ثةةةاني ألنابيةةةل النانواةةةة الكربونيةةةة المتعةةة دة الجةةة را /لمركبةةةاا )ا التحفيةةةز اليةةةو ي نشةةةا دراسةةةة
٪( تةةةم توليف ةةةا 10خ 6, 3)س = TiO2مةةةس نسةةةل أخزا ممتلفةةةة مةةةن MWCNTs/x%TiO2 النةةةانو ( التيتةةةانيوم
خ Vat Green 1) باستم ام راقة تبمر مع لة بسيطة في إزالة التلوث من صبغتين محليتين من أصةبا النسةي خهمةا
Blue Dianix بنيةة المركبةاا خقة تةم توصةي مصةانس الصةبا.ة ( كملوثةاا ضيةواة صةناضية عةا عة ادسةتم ام فةي
باسةتم ام بنسل ممتلفة من الةوز اليو ية المحفزاا ذاا MWCNTs/x%TiO2 خ MWCNTsالنانواة المحيرة
, الماسةةا الميكرخسةةكوبي ارلكترخنةةي , تقنيةةة التحليةةأل الطيفةةي لنعةةعة فةةور البنفسةةجية خالمر يةةة حيةةود األعةةعة السةةينية
-Kubelka معادلةةةةةة كمةةةةةا تةةةةةم تقةةةةة ار فجةةةةةوة النطةةةةةار البصةةةةةر بواسةةةةةطة N2قةةةةةة امتصةةةةةا المنعكسةةةةةة , خ را
Munk لة MWCNTs خ MWCNTs/x%TiO2 إلكتةةرخ فولةة 2.69خ 2.80خ 2.89خ 3.51ممةا اعطةةي قةيم
ضلى التوالي تم قياس مق ار تحواأل الصبغتين لعناصرهم األساسية باستم ام ضملياا قياس النقص فةي محتةوا األكسةجين
خالةة اانيك 1لصةةبغتي التةةاا الميةةراء التحلةةأل اليةةو ي لعمليةةاا الكيميةةا ي بارفةةافة إلةةى حليةةة محتملةةة تةةم اقتراح ةةا
في خجود الحافزاا اليو ية المحيرة الزرقاء
![NANO EXPRESS Open Access Flow-induced voltage ......liquid [1]. Similar experiments were conducted with multi-walled carbon nanotubes (MWCNTs) [3]. The aligned MWCNTs were found to](https://static.documents.pub/doc/80x56/60cc1ccfc265ec2fa524fd51/nano-express-open-access-flow-induced-voltage-liquid-1-similar-experiments.jpg)


