
1PISA in Focus – 2014/04 (April) © OECD 2014
Are 15-year-olds creative problem-solvers?•To do well on PISA’s first assessment of creative problem-solving skills, students need to be
open to novelty, tolerate doubt and uncertainty, and dare to use intuition to initiate a solution.
•Just because a student performs well in core school subjects doesn’t mean he or she is proficient in problem solving. In Australia, Brazil, Italy, Japan, Korea, Macao-China, Serbia, England (United Kingdom) and the United States, students perform significantly better in problem solving, on average, than students in other countries who show similar performance in reading, mathematics and science.
•Many of the best performers in problem solving are Asian countries and economies, where students demonstrate high levels of reasoning skills and self-directed learning. Meanwhile, compared to students of similar overall performance, students in Brazil, Ireland, Korea and the United States perform strongest on interactive problems that require students to uncover useful information by exploring the problem situation and gather feedback on the effect of their actions.
in Focus 38education data education evidence education policy education analysis education statistics education data education evidence education policy
in modern societies, all of life is problem solving. With constant changes in society, the environment, and in technology, what we should know in order for us to live a full life is evolving rapidly too. Adapting, learning, daring to try out new things and always being ready to learn from mistakes are essential for being resilient and successful in an unpredictable world.
Are today’s 15-year-olds acquiring the problem-solving skills needed in the 21st century? new results from the PisA 2012 assessment of problem solving, which was conducted on computer and involved about 85 000 students in 44 countries and economies, help answer this question.
Results show that students in singapore and Korea, followed by students in Japan, score higher in problem solving than students in
all other participating countries and economies. Four more East Asian partner economies rank between 4th and 7th place: Macao-china, Hong Kong-china, shanghai-china, and chinese Taipei (in descending order of their mean scores). canada, Australia, Finland, England (united Kingdom), Estonia, France, the netherlands, italy, the czech Republic, Germany, the united states and Belgium (in descending order of their mean scores) all score above the oEcD average, but below the former group of countries.
Large proportions of 15-year-olds lack basic problem-solving skills.
in Focus
2 © OECD 2014 PISA in Focus – 2014/04 (April)
in the two best-performing countries – Korea and singapore – 15-year-old students are able to engage with moderately complex situations in a systematic way. For example, 56% of students in Korea and singapore but only 31% of students in oEcD countries, on average, can troubleshoot an unfamiliar device that is malfunctioning (a task at Level 4 on the PisA proficiency scale). They grasp the links among the elements of the problem situation; they can plan a few steps ahead and adjust their plans in light of feedback; and they can form a hypothesis about why a device is malfunctioning and describe how to test it. By contrast, in the lowest-performing countries, more than 50% of students are only able to solve very simple problems that do not require them to think ahead and that are cast in familiar settings – such as determining, through trial-and-error, which solution among a limited set of alternatives best meets a single criterion (tasks at Level 1 on the proficiency scale). in Japan and Korea, only 7% of students perform below Level 2. PisA reveals that even in the best-performing countries, significant numbers of 15-year-olds do not have the basic problem-solving skills considered necessary to succeed in today’s – let alone tomorrow’s – world.
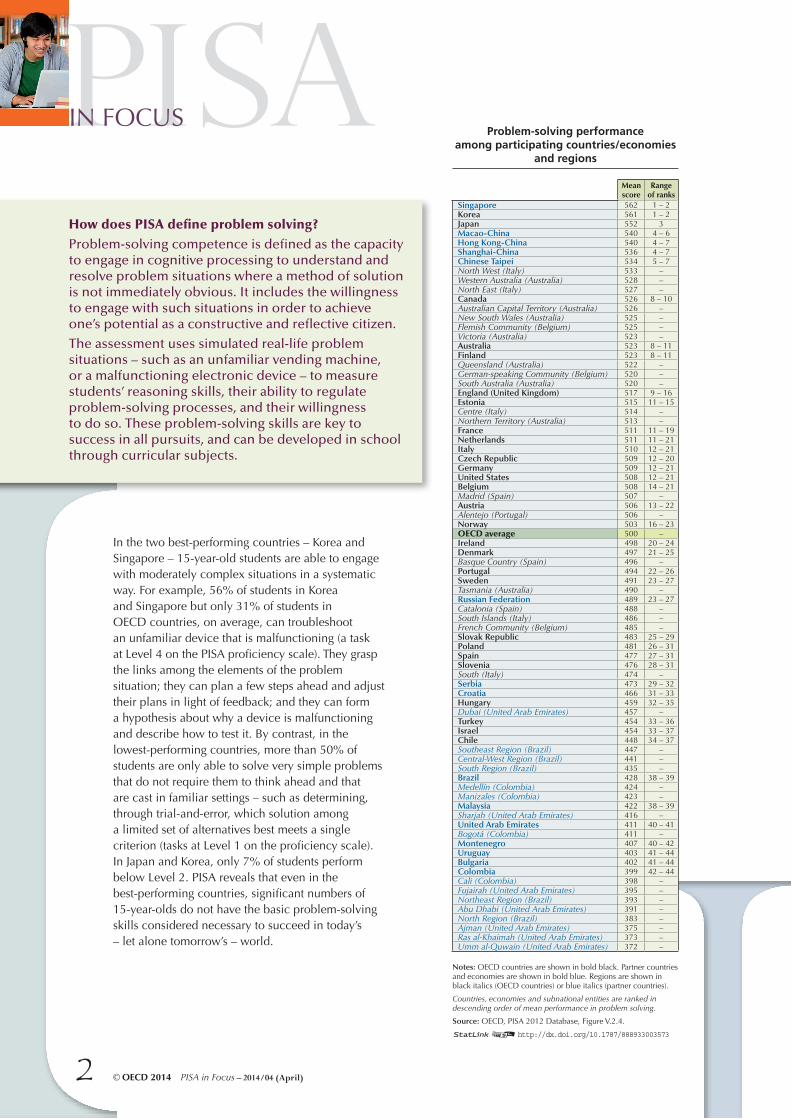
Notes: oEcD countries are shown in bold black. Partner countries and economies are shown in bold blue. Regions are shown in black italics (oEcD countries) or blue italics (partner countries).
Countries, economies and subnational entities are ranked in descending order of mean performance in problem solving.
Source: oEcD, PisA 2012 Database, Figure V.2.4.
12http://dx.doi.org/10.1787/888933003573
Mean score
Range of ranks
Singapore 562 1 – 2Korea 561 1 – 2Japan 552 3Macao-China 540 4 – 6Hong Kong-China 540 4 – 7Shanghai-China 536 4 – 7Chinese Taipei 534 5 – 7North West (Italy) 533 –Western Australia (Australia) 528 –North East (Italy) 527 –Canada 526 8 – 10Australian Capital Territory (Australia) 526 –New South Wales (Australia) 525 –Flemish Community (Belgium) 525 –Victoria (Australia) 523 –Australia 523 8 – 11Finland 523 8 – 11Queensland (Australia) 522 –German-speaking Community (Belgium) 520 –South Australia (Australia) 520 –England (United Kingdom) 517 9 – 16Estonia 515 11 – 15Centre (Italy) 514 –Northern Territory (Australia) 513 –France 511 11 – 19Netherlands 511 11 – 21Italy 510 12 – 21Czech Republic 509 12 – 20Germany 509 12 – 21United States 508 12 – 21Belgium 508 14 – 21Madrid (Spain) 507 –Austria 506 13 – 22Alentejo (Portugal) 506 –Norway 503 16 – 23OECD average 500 –Ireland 498 20 – 24Denmark 497 21 – 25Basque Country (Spain) 496 –Portugal 494 22 – 26Sweden 491 23 – 27Tasmania (Australia) 490 –Russian Federation 489 23 – 27Catalonia (Spain) 488 –South Islands (Italy) 486 –French Community (Belgium) 485 –Slovak Republic 483 25 – 29Poland 481 26 – 31Spain 477 27 – 31Slovenia 476 28 – 31South (Italy) 474 –Serbia 473 29 – 32Croatia 466 31 – 33Hungary 459 32 – 35Dubai (United Arab Emirates) 457 –Turkey 454 33 – 36Israel 454 33 – 37Chile 448 34 – 37Southeast Region (Brazil) 447 –Central-West Region (Brazil) 441 –South Region (Brazil) 435 –Brazil 428 38 – 39Medellín (Colombia) 424 –Manizales (Colombia) 423 –Malaysia 422 38 – 39Sharjah (United Arab Emirates) 416 –United Arab Emirates 411 40 – 41Bogotá (Colombia) 411 –Montenegro 407 40 – 42Uruguay 403 41 – 44Bulgaria 402 41 – 44Colombia 399 42 – 44Cali (Colombia) 398 –Fujairah (United Arab Emirates) 395 –Northeast Region (Brazil) 393 –Abu Dhabi (United Arab Emirates) 391 –North Region (Brazil) 383 –Ajman (United Arab Emirates) 375 –Ras al-Khaimah (United Arab Emirates) 373 –Umm al-Quwain (United Arab Emirates) 372 –
Problem-solving performance among participating countries/economies
and regions
How does PISA define problem solving? Problem-solving competence is defined as the capacity to engage in cognitive processing to understand and resolve problem situations where a method of solution is not immediately obvious. It includes the willingness to engage with such situations in order to achieve one’s potential as a constructive and reflective citizen.
The assessment uses simulated real-life problem situations – such as an unfamiliar vending machine, or a malfunctioning electronic device – to measure students’ reasoning skills, their ability to regulate problem-solving processes, and their willingness to do so. These problem-solving skills are key to success in all pursuits, and can be developed in school through curricular subjects.
in Focus
3PISA in Focus – 2014/04 (April) © OECD 2014
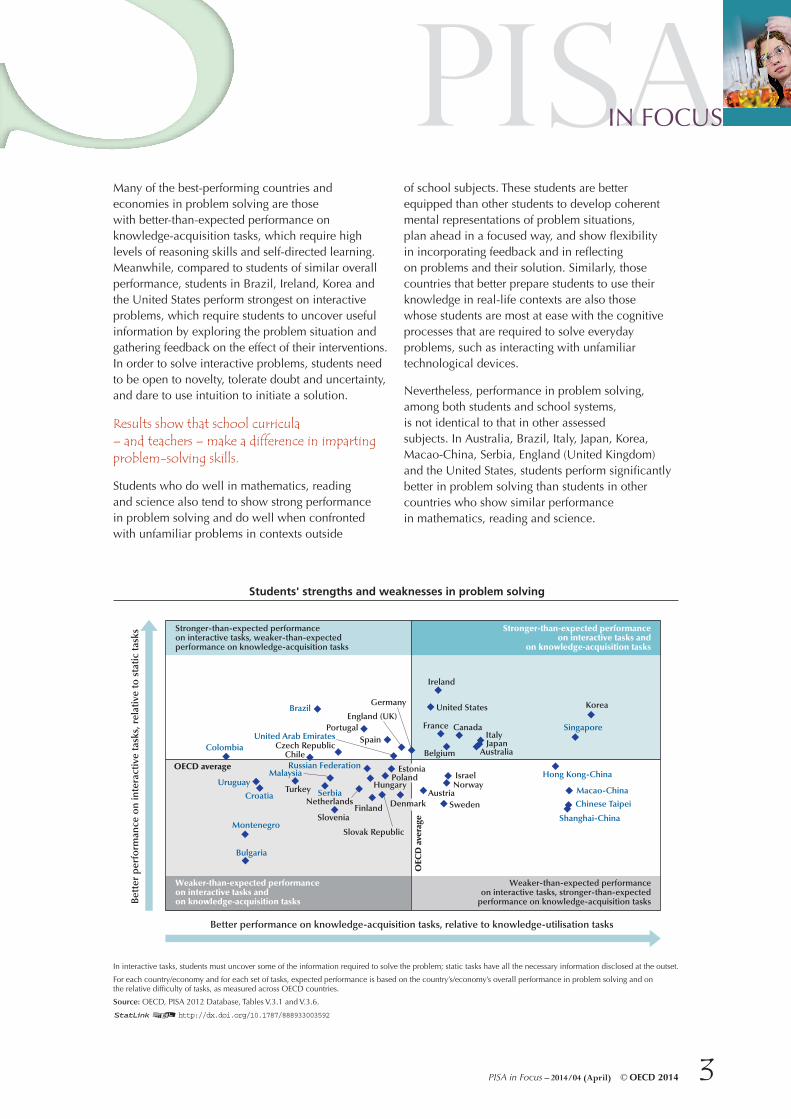
Many of the best-performing countries and economies in problem solving are those with better-than-expected performance on knowledge-acquisition tasks, which require high levels of reasoning skills and self-directed learning. Meanwhile, compared to students of similar overall performance, students in Brazil, ireland, Korea and the united states perform strongest on interactive problems, which require students to uncover useful information by exploring the problem situation and gathering feedback on the effect of their interventions. in order to solve interactive problems, students need to be open to novelty, tolerate doubt and uncertainty, and dare to use intuition to initiate a solution.
Results show that school curricula – and teachers – make a difference in imparting problem-solving skills.
students who do well in mathematics, reading and science also tend to show strong performance in problem solving and do well when confronted with unfamiliar problems in contexts outside
of school subjects. These students are better equipped than other students to develop coherent mental representations of problem situations, plan ahead in a focused way, and show flexibility in incorporating feedback and in reflecting on problems and their solution. similarly, those countries that better prepare students to use their knowledge in real-life contexts are also those whose students are most at ease with the cognitive processes that are required to solve everyday problems, such as interacting with unfamiliar technological devices.
nevertheless, performance in problem solving, among both students and school systems, is not identical to that in other assessed subjects. in Australia, Brazil, italy, Japan, Korea, Macao-china, serbia, England (united Kingdom) and the united states, students perform significantly better in problem solving than students in other countries who show similar performance in mathematics, reading and science.
in interactive tasks, students must uncover some of the information required to solve the problem; static tasks have all the necessary information disclosed at the outset.
For each country/economy and for each set of tasks, expected performance is based on the country’s/economy’s overall performance in problem solving and on the relative difficulty of tasks, as measured across oEcD countries.
Source: oEcD, PisA 2012 Database, Tables V.3.1 and V.3.6.
12http://dx.doi.org/10.1787/888933003592
Students' strengths and weaknesses in problem solving
Bet
ter
per
form
ance
on
inte
ract
ive
task
s, r
elat
ive
to s
tati
c ta
sks Stronger-than-expected performance
on interactive tasks, weaker-than-expected performance on knowledge-acquisition tasks
Stronger-than-expected performance on interactive tasks and
on knowledge-acquisition tasks
Weaker-than-expected performance on interactive tasks, stronger-than-expected
performance on knowledge-acquisition tasks
Weaker-than-expected performance on interactive tasks and on knowledge-acquisition tasks
Better performance on knowledge-acquisition tasks, relative to knowledge-utilisation tasks
United States
Poland
England (UK)
Estonia
Finland
Slovak Republic
Germany
Austria
Czech Republic
France
Japan
Turkey
Sweden
Hungary
Australia
Israel
Canada
Ireland
Chile
Netherlands
Spain
Denmark
Slovenia
Portugal
Norway
Korea
Italy
Hong Kong-China
Brazil
Uruguay
Croatia Chinese Taipei
Bulgaria
Macao-China
United Arab Emirates
Montenegro
Singapore
Colombia
Malaysia
Serbia
Russian Federation
Shanghai-China
Belgium
OECD average
OEC
D a
vera
ge
in Focus
4 © OECD 2014 PISA in Focus – 2014/04 (April)
The bottom line: In countries and economies that rank at the top in problem-solving proficiency, students not only learn the required curriculum, they also learn how to turn real-life problems into learning opportunities – creatively devising solutions and purposely reasoning outside of school contexts. Results from the PISA assessment of problem solving show that teachers and schools can foster
students’ ability to confront – and solve – the kinds of problems that are encountered almost daily in 21st century life.
For more information Contact Francesco Avvisati ([email protected]) See oEcD (2014), PISA 2012 Results: Creative Problem Solving: Students’ Skills in Tackling Real-Life Problems (Volume V), PisA, oEcD Publishing, Paris.
Visitwww.pisa.oecd.orgwww.oecd.org/pisa/infocusEducation Indicators in FocusTeaching in Focus
Coming next month
Do education policies have an impact on students’ motivation to learn?
Photo credit: © khoa vu/Flickr/Getty Images © Shutterstock/Kzenon © Simon Jarratt/CorbisThis paper is published under the responsibility of the Secretary-General of the OECD. The opinions expressed and arguments employed herein do not necessarily reflect the official views of OECD member countries.This document and any map included herein are without prejudice to the status of or sovereignty over any territory, to the delimitation of international frontiers and boundaries and to the name of any territory, city or area.The statistical data for Israel are supplied by and under the responsibility of the relevant Israeli authorities. The use of such data by the OECD is without prejudice to the status of the Golan Heights, East Jerusalem and Israeli settlements in the West Bank under the terms of international law.
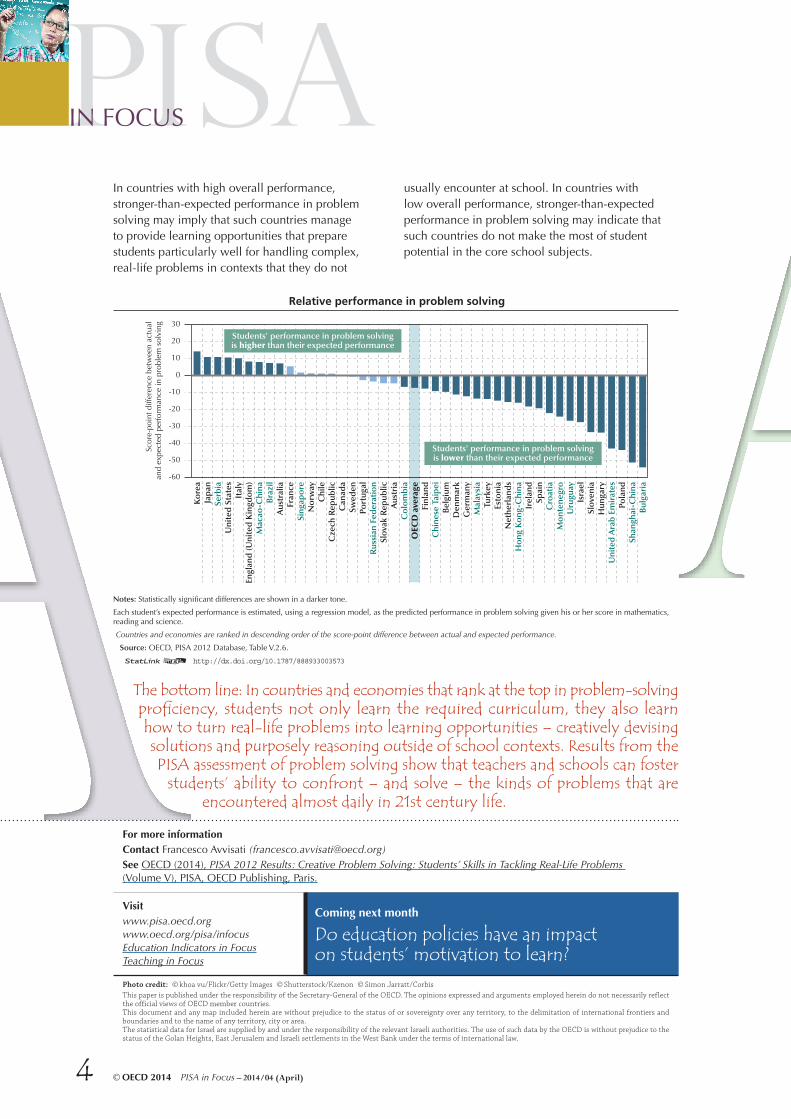
Notes: statistically significant differences are shown in a darker tone.
Each student’s expected performance is estimated, using a regression model, as the predicted performance in problem solving given his or her score in mathematics, reading and science.
Countries and economies are ranked in descending order of the score-point difference between actual and expected performance.
Source: oEcD, PisA 2012 Database, Table V.2.6.
12 http://dx.doi.org/10.1787/888933003573
Relative performance in problem solving
Students' performance in problem solvingis higher than their expected performance
Students' performance in problem solvingis lower than their expected performance
Scor
e-po
int d
iffer
ence
bet
wee
n ac
tual
and
expe
cted
per
form
ance
in p
robl
em s
olvi
ng
-60
-50
-40
-30
-20
-10
0
10
20
30
Ko
rea
Jap
anSe
rbia
Uni
ted
Sta
tes
Ital
yEn
glan
d (U
nite
d K
ingd
om
)M
acao
-Chi
naB
razi
lA
ustr
alia
Fran
ceSi
ngap
ore
No
rway
Chi
leC
zech
Rep
ublic
Can
ada
Swed
enPo
rtug
alR
ussi
an F
eder
atio
nSl
ovak
Rep
ublic
Aus
tria
Co
lom
bia
Chi
nese
Tai
pei
Bel
gium
Den
mar
kG
erm
any
Mal
aysi
aTu
rkey
Esto
nia
Net
herl
and
sH
ong
Ko
ng-C
hina
Irel
and
Cro
atia
Mo
nten
egro
Uru
guay
Slov
enia
Hun
gary
Uni
ted
Ara
b E
mir
ates
Pola
ndSh
angh
ai-C
hina
Bul
gari
a
Finl
and
Spai
n
Isra
el
OEC
D a
vera
ge
in countries with high overall performance, stronger-than-expected performance in problem solving may imply that such countries manage to provide learning opportunities that prepare students particularly well for handling complex, real-life problems in contexts that they do not
usually encounter at school. in countries with low overall performance, stronger-than-expected performance in problem solving may indicate that such countries do not make the most of student potential in the core school subjects.


