
Pollution and urbanization: effects on respiratory health
Catherine H. Miele, MDJohns Hopkins Pulmonary and Critical Care

Disclosures
• No relevant disclosures
Outline
• Background:
– Air pollution and respiratory health
• Our studies in Peru
– COPD
– Chronic Bronchitis

Pollution in urban centers

Components of air pollution• Particulate matter• Sulfur oxides• Oxidants (ozone)• Carbon monoxide• Hydrocarbons• Nitrogen oxide• Lead • Heavy metals• Plastic debris
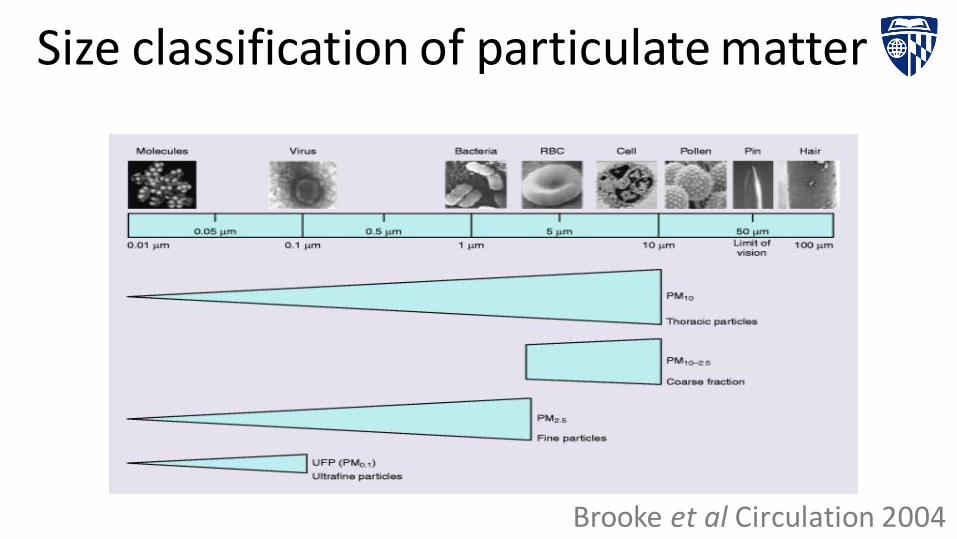
Size classification of particulate matter
Brooke et al Circulation 2004
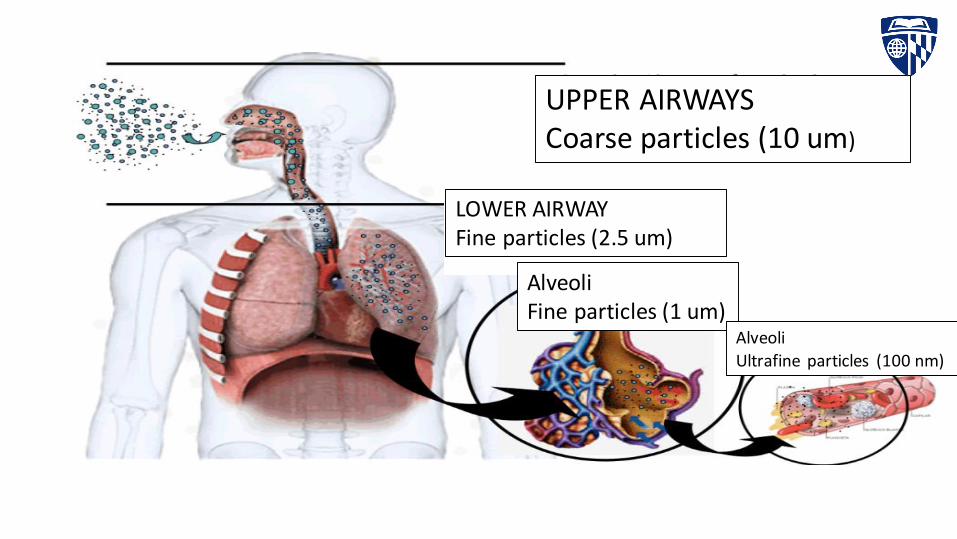
UPPER AIRWAYSCoarse particles (10 um)
AlveoliFine particles (1 um)
Alveoli
Ultrafine particles (100 nm)
LOWER AIRWAYFine particles (2.5 um)

Air pollution and respiratory disease
Rice et al AJRCCM 2014
Traffic related pollution is associated with worse baseline lung function
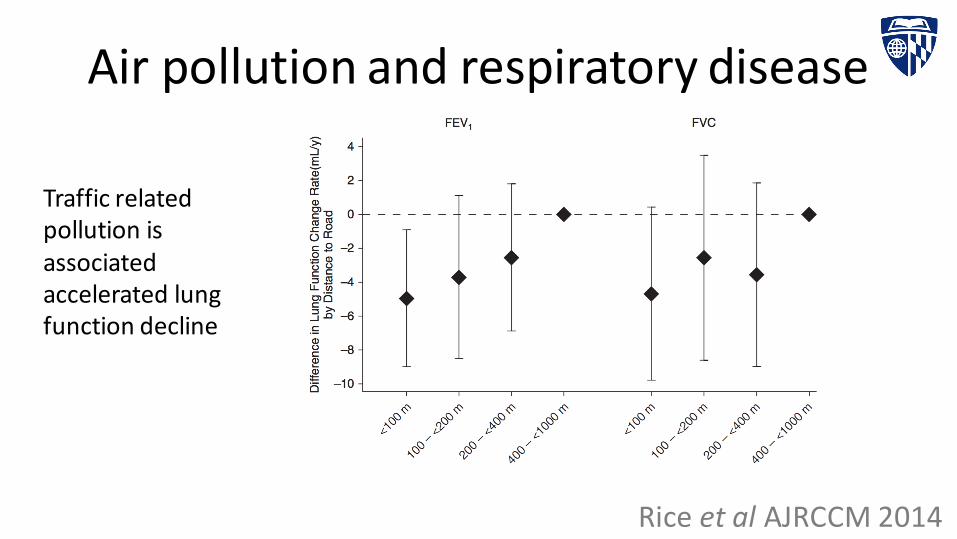
Air pollution and respiratory disease
Rice et al AJRCCM 2014
Traffic related pollution is associated accelerated lung function decline
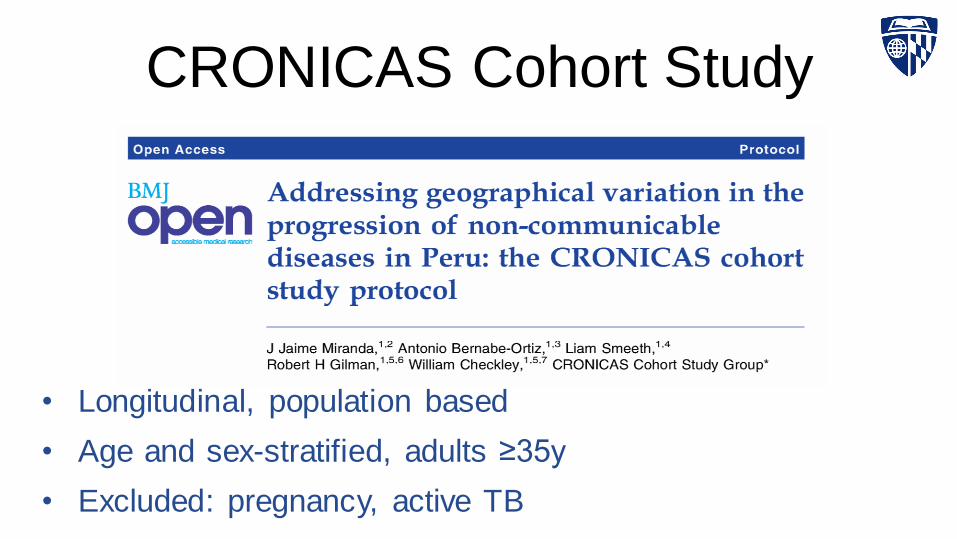
CRONICAS Cohort Study
• Longitudinal, population based
• Age and sex-stratified, adults ≥35y
• Excluded: pregnancy, active TB

PERU
COLOMBIA
BRAZIL
BOLIVIA
ECUADOR
Lima
0 mPuno
3825 m
Sites
Tumbes
0 m
Lima (Urban) Puno (Urban)
Tumbes (Semi-urban) Puno (Rural)
Methods
• Collected demographics, past medical history, family history, respiratory symptoms, smoking, biomass fuel use
• Spirometry
• Prevalence of COPD: FEV1/FVC < 70%
• Prevalence of Chronic Bronchitis base on:
– cough and phlegm production
12
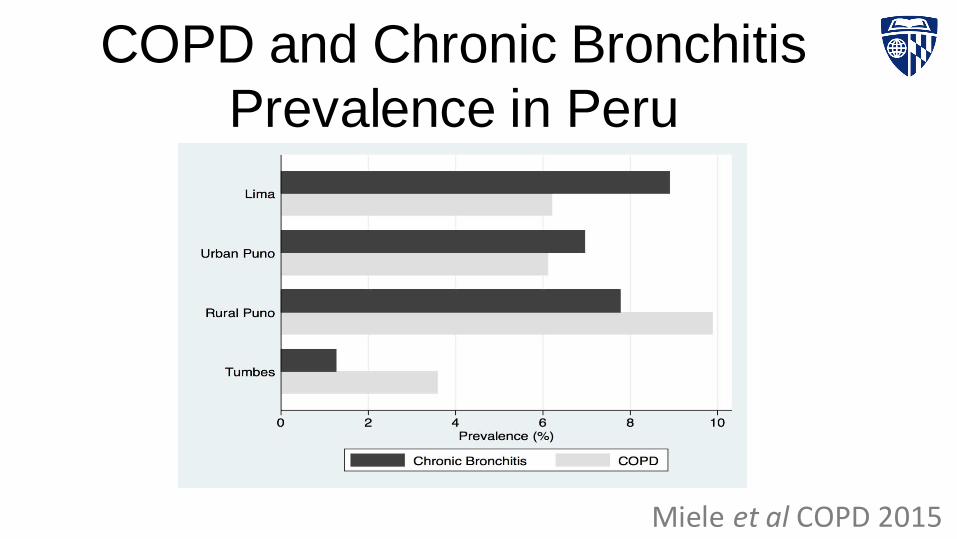
COPD and Chronic Bronchitis
Prevalence in Peru
Miele et al COPD 2015

Risk Factors for COPD
across all sites in women (N=1487)
Prevalence ratio 95% CI P
Age per 10 years 2.51 1.86-3.38 <0.001
High altitude vs. sea-level 1.44 1.05-1.99 0.02
Smoking per 10 pack years 2.39 0.59-9.63 0.22
Post-treatment pulmonary tuberculosis 7.02 3.63-13.59 <0.001
Asthma 2.30 1.12-4.72 0.02
Urbanization
Urban 1.00
Semi-Urban 0.66 0.53-0.82 <0.001
Rural 1.71 1.47-1.99 <0.001
Biomass use at least once daily 2.22 1.02-4.81 0.04
Wealth Index
Low 1.00
Middle 1.78 0.52-6.00 0.36
High 1.44 0.54-3.86 0.47
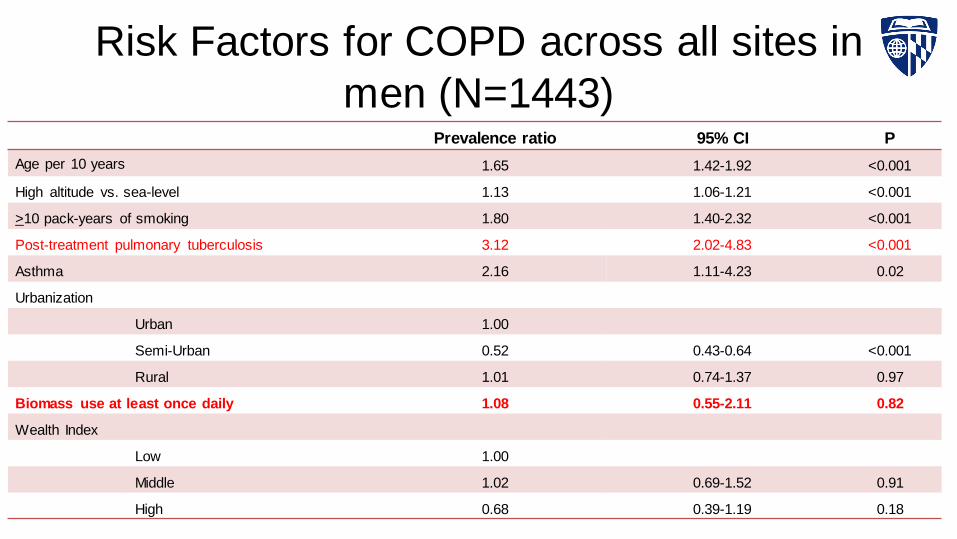
Risk Factors for COPD across all sites in
men (N=1443)` Prevalence ratio 95% CI P
Age per 10 years 1.65 1.42-1.92 <0.001
High altitude vs. sea-level 1.13 1.06-1.21 <0.001
>10 pack-years of smoking 1.80 1.40-2.32 <0.001
Post-treatment pulmonary tuberculosis 3.12 2.02-4.83 <0.001
Asthma 2.16 1.11-4.23 0.02
Urbanization
Urban 1.00
Semi-Urban 0.52 0.43-0.64 <0.001
Rural 1.01 0.74-1.37 0.97
Biomass use at least once daily 1.08 0.55-2.11 0.82
Wealth Index
Low 1.00
Middle 1.02 0.69-1.52 0.91
High 0.68 0.39-1.19 0.18

Population Attributable Risks - Lima
0.0%
10.0%
20.0%
30.0%
40.0%
50.0%
60.0%
TB Asthma Biomass FuelUse Daily
Smoking atleast 10 pack
years
PA
R
Men
Women
Jaganath et al Respiratory Research 2015

0.0%
10.0%
20.0%
30.0%
40.0%
50.0%
60.0%
TB Asthma Biomass FuelUse Daily
Smoking atleast 10 pack
years
PA
R
Men
Women
Jaganath et al Respiratory Research 2015
Population Attributable Risks – Rural Puno
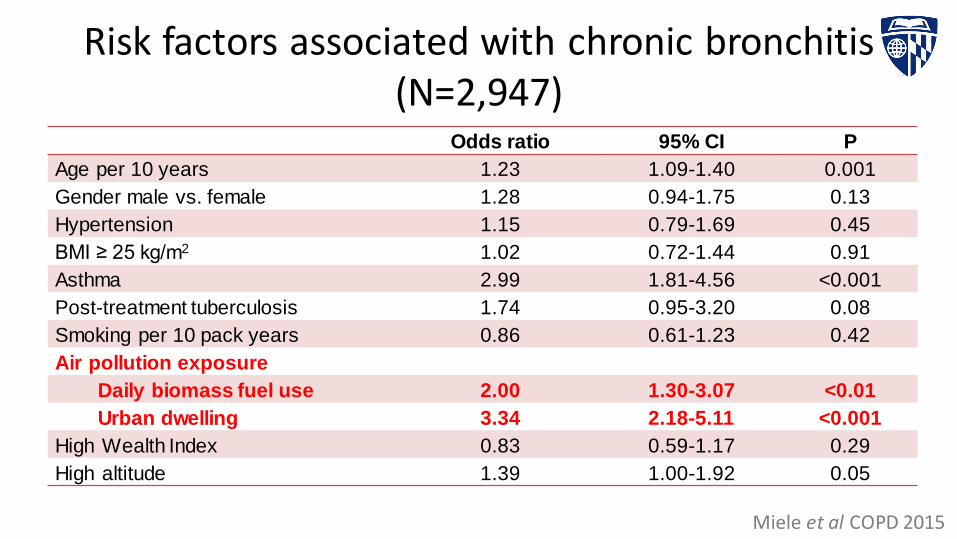
Risk factors associated with chronic bronchitis (N=2,947)
Odds ratio 95% CI P
Age per 10 years 1.23 1.09-1.40 0.001
Gender male vs. female 1.28 0.94-1.75 0.13
Hypertension 1.15 0.79-1.69 0.45
BMI ≥ 25 kg/m2 1.02 0.72-1.44 0.91
Asthma 2.99 1.81-4.56 <0.001
Post-treatment tuberculosis 1.74 0.95-3.20 0.08
Smoking per 10 pack years 0.86 0.61-1.23 0.42
Air pollution exposure
Daily biomass fuel use 2.00 1.30-3.07 <0.01
Urban dwelling 3.34 2.18-5.11 <0.001
High Wealth Index 0.83 0.59-1.17 0.29
High altitude 1.39 1.00-1.92 0.05
Miele et al COPD 2015
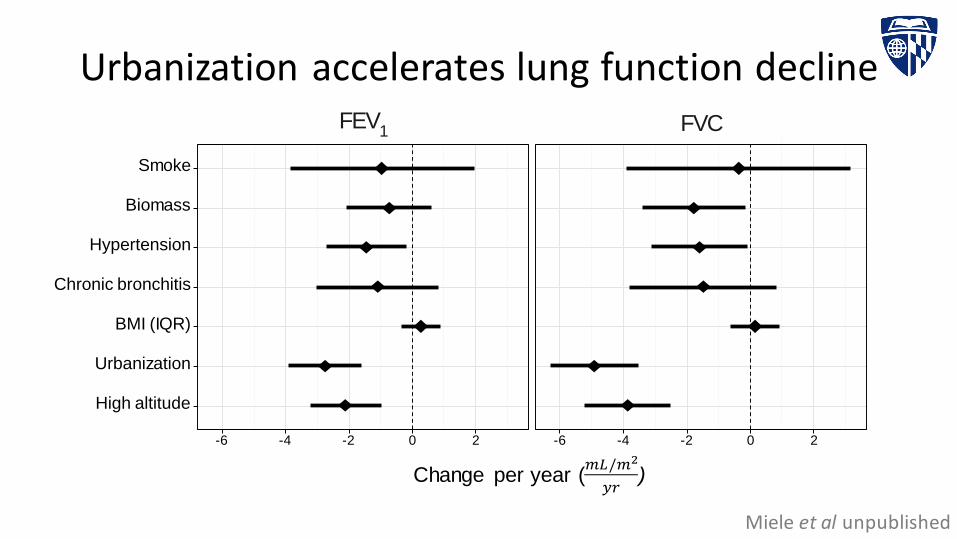
Urbanization accelerates lung function declineFEV
1 FVC
High altitude
Urbanization
BMI (IQR)
Chronic bronchitis
Hypertension
Biomass
Smoke
-6 -4 -2 0 2 -6 -4 -2 0 2
Miele et al unpublished
Change per year (𝑚𝐿/𝑚2
𝑦𝑟)
Summary
• Pollution is one of many risk factors contributing to poor health in urban slums
• There is strong data that indoor and outdoor air pollution directly affect lung disease

Air pollution and risk for heart disease
Evaluating pollution and markers for cardiovascular disease
• Framingham Offspring and Third Generation Cohorts
• 5,112 participants (2,731 (53%) women, mean age 49±14 years).
• Higher average PM2.5 exposure was associated with increased markers of cardiovascular disease.
Wilker EH et al AJC 2014
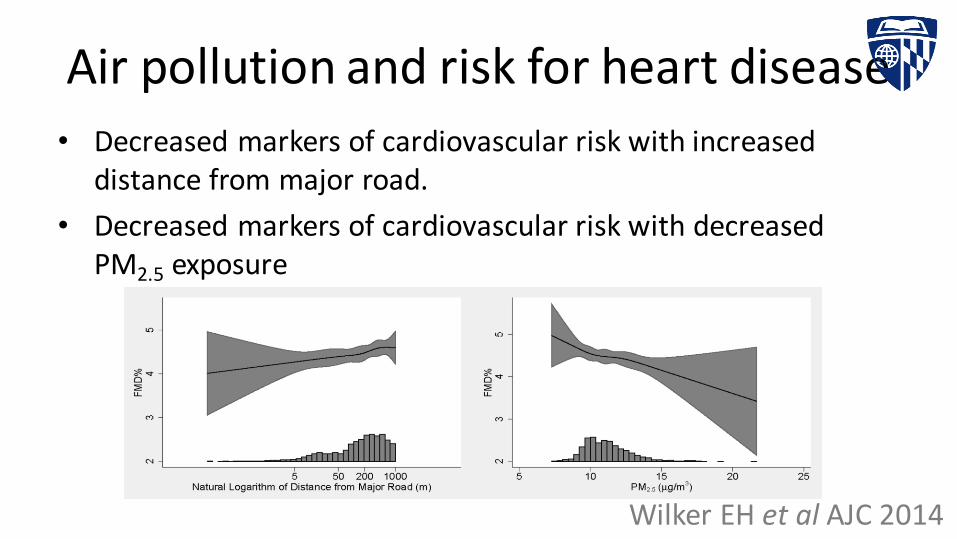
Air pollution and risk for heart disease
• Decreased markers of cardiovascular risk with increased distance from major road.
• Decreased markers of cardiovascular risk with decreased PM2.5 exposure
Wilker EH et al AJC 2014


