

Polycyclic Aromatic Hydrocarbons in Red Snapper, Lutjanus campechanus, and
Sediment Samples After the Deepwater Horizon Oil Spill
by
Claire Elizabeth Roberts
A thesis submitted to the Graduate Faculty of
Auburn University
in partial fulfillment of the
requirements for the Degree of
Master of Science
Auburn, Alabama
May 7, 2016
Keywords: Deepwater Horizon oil spill, Toxicology,
Polycyclic aromatic hydrocarbon analysis,
Condition indices, Lesions
Approved by
Stephen T. Szedlmayer, Chair, Professor of Fisheries, Aquaculture, and Aquatic Sciences
Covadonga R. Arias, Professor of Fisheries, Aquaculture, and Aquatic Sciences
Matt Catalano, Assistant Professor of Fisheries, Aquaculture, and Aquatic Sciences
ii
Abstract
The Deepwater Horizon oil spill occurred on 20 April 2010, which led to
approximately 4.9 million barrels of oil entering the northern Gulf of Mexico. Red
snapper, Lutjanus campechanus, are an important species in the Gulf of Mexico, and
were potentially exposed to polycyclic aromatic hydrocarbons (PAHs) from this oil spill.
To assess this potential PAH exposure, red snapper tissue samples were collected from
2010 to 2014, and analyzed for several PAHs. All red snapper tissue samples showed
mean total PAH concentrations < 10 ppb. Significant differences were observed in total
(± SD) PAH by year, with muscle tissue in 2011 having the highest concentration (5.4 ±
2.5 ppb) among all samples types and years. Sediment samples were also analyzed for
PAHs and these showed no evidence of contamination above background levels. Several
condition indices were used to determine if any physiological changes occurred in red
snapper condition, gonadal tissue, or liver tissue following the oil spill. Significant
differences were observed in gonadosomatic index and Fulton’s K (condition factor);
however these were not attributed to the oil spill and more likely normal yearly variations
due to temperature and nutrition status. Lesions were observed in 10 of 3,934 (0.25%)
red snapper collected during this study. These levels of lesions were at similar levels to
non-oil exposed fishes. Based on low levels of PAH in red snapper and sediment
samples, and low rate of external lesions it is unlikely that adult red snapper in the

iii
northern Gulf of Mexico on the Alabama-Mississippi continental shelf were affected by
the Deepwater Horizon oil spill.
iv
Acknowledgements
I would like to thank M. Albins, T. Beyea, L. Biermann, R. Brewton, J. Herbig, J.
Jaxion-Harm, T. Jeffery, D. Horn, E. Levine, S. Landers, M. McKinzie, P. Mudrak, J.
Williams, and N. Wilson for field and laboratory assistance throughout this study. I also
thank my advisor, S. T. Szedlmayer for his insight and assistance regarding my research,
and my other committee members, M. Catalano and C. Arias for their review and helpful
comments of my thesis. Finally, I thank my family and friends for their support
throughout all of my adventures.

v
Table of Contents
Abstract……………………………………………………………………………………ii
Acknowledgements……………………………………………………………………….iv
List of Tables……………………………………………………………………………..vi
List of Figures……………………………………………………………………………vii
Introduction………………………………………………………………………………..1
Methods……………………………………………………………………………………9
Results……………………………………………………………………………………14
Discussion………………………………………………………………………………..18
Conclusions………………………………………………………………………………28
References………………………………………………………………………………..29
Tables…………………………………………………………………………………….50
Figures……………………………………………………………………………………52

vi
List of Tables
Table 1. Summary of the selection methods for PAH analysis of red snapper, Lutjanus
campechanus, for each sample type……………………………………………………...50
Table 2. Red snapper, Lutjanus campechanus, mean (± SD) and samples size for HSI and
K by year…………………………………………………………………………………51

vii
List of Figures
Figure 1. Study sites (black box) and DWH location (black cross)………….…….……52
Figure 2. Sample locations for red snapper, Lutjanus campechanus, tissue and sediment
PAH analyses following the DWH oil spill…………………………………..53
Figure 3. Red snapper, Lutjanus campechanus, mean (± SD) muscle tissue PAH
concentrations by year. Different letters indicate significant differences……54
Figure 4. Red snapper, Lutjanus campechanus, mean (± SD) liver tissue PAH
concentrations by year. Asterisk indicates significant difference.........………55
Figure 5. Red snapper, Lutjanus campechanus, mean (± SD) gall bladder tissue PAH
concentrations by year………………………………………………………...56
Figure 6. Mean (± SD) sediment PAH concentrations by year. Different letters indicate
significant differences……………………………………………...…………57
Figure 7. Sediment PAH concentrations by site distance from DWH wellhead location.
(n = 103, 𝑅2 = 0.009, P = 0.33)……………………………….………………58
Figure 8. Red snapper, Lutjanus campechanus, mean (± SD) PHEN:ANTH ratios for
tissue (black bars) and sediment (gray bars) by year. Values > 8 ppb indicate
petrogenic sources……………………………………………………..……….59
Figure 9. Red snapper, Lutjanus campechanus, mean (± SD) FLUO:PYRE ratios for
tissue (black bars) and sediment (gray bars) by year. Values < 1 ppb indicate a
petrogenic source…………………………………………………………..….60
Figure 10. Red snapper, Lutjanus campechanus, (black bars) and female (gray bars) mean
(± SD) GSI by year during peak spawning (June-August). For female fish,
significant differences are indicated by an asterisk. For male fish, different
letters indicate significant differences……………………………………...…61
Figure 11. Red snapper, Lutjanus campechanus, mean (± SD) HSI by year……………62
Figure 12. Red snapper, Lutjanus campechanus, mean (± SD) K by year. Different letters
indicate significant differences……………………………………………….63
1
INTRODUCTION
On 20 April 2010 in the northern Gulf of Mexico, the Deepwater Horizon (DWH)
exploratory well exploded, caught fire, and eventually sank in 1500 m of water. This
well is located in Mississippi Canyon Block 252, approximately 77 km southeast of
Louisiana (Atlas and Hazen, 2011). The well leaked for 84 days before the flow was
stopped. Approximately 4.9 million barrels of oil entered the environment, making it the
largest spill in the Gulf of Mexico, and the second largest in the world (Atlas and Hazen,
2011). After cleanup efforts, natural dispersion, and degradation, approximately 26% of
the oil remains in the environment (The Federal Interagency Solutions Group: Oil Budget
Calculator Science and Engineering Team, 2010).
In the Gulf of Mexico (GOM), there are several ways in which petroleum can
enter the aquatic environment. Human input includes platform leaks, tanker spills,
industrial runoff, and river runoff, all of which contribute polycyclic aromatic
hydrocarbons (PAHs) to the GOM. The GOM also has natural seeps, which contribute
about 140,000 tons of petroleum per year, resulting in oil exposure as a natural
component of the environment (National Research Council, 2003). This natural seepage
has allowed microorganisms such as bacteria, fungi, and archaea to adapt and utilize
petroleum hydrocarbons as sources of energy, leading to hydrocarbon degradation (Atlas
and Hazen, 2011). Fortunately, these bacteria have assisted in cleanup efforts, thus
decreasing the amount of oil available to negatively affect other organisms. However,
even in areas that can be considered pristine and oil free, such as in Low Island and
Dallmann Bay, Antarctica, evidence of PAH contamination exists (McDonald et al.,
1992). From these locations in Antarctica, McDonald et al. (1992) reported 13-145 ppb

2
(dry weight) total PAH (tPAH) concentrations in pooled fish tissues. Similarly, Johnson
et al. (1985) reported 18 ppb tPAH concentrations in sediments from an undeveloped area
in Alaska.
Petroleum from the DWH spill was “light Louisiana crude”, and composed of
3.9% PAHs, by weight, with a total of 2.1 x 10¹⁰g being released during the spill (Reddy
et al., 2012). The remainder of the petroleum was composed of various sulfur, oxygen,
and nitrogen-containing organic compounds (Speers and Whitehead, 1969). Polycyclic
aromatic hydrocarbons are toxic to marine life, and previous studies have focused on
these effects (Boehm and Page, 2007). Lighter and medium molecular weight
hydrocarbons tend to remain at the surface and volatilize or degrade over time. In
contrast, heavier molecular weight hydrocarbons sink into the sediment (Wolfe et al.,
1994; Ho et al., 1999; Reed et al., 1999) where they can remain in anoxic environments
for years, retaining their toxic properties (Sammarco et al., 2013).
Polycyclic aromatic hydrocarbons are composed of carbon and hydrogen atoms
arranged in two or more benzene rings (Sims and Overcash, 1983; Eisler, 1987). These
ring structures can vary greatly in size, number of carbon and hydrogen atoms, and
presence or absence of substituted groups (Eisler, 1987). Polycyclic aromatic
hydrocarbons are solid, but partially soluble in water, and have the ability to quickly
absorb into organic and inorganic particulates (Tuvikene, 1995). The highest
concentrations of PAHs are typically found in sediments, with aquatic biota carrying
medium concentrations, and lowest concentrations in the water column (Tuvikene, 1995).
Some of these compounds are toxic, mutagenic and/or carcinogenic to aquatic organisms
3
(Rose et al., 2012). The PAHs of primary concern are those with molecular weights from
128.16 g (naphthalene) to 300.36 g (coronene; Eisler, 1987).
From an environmental standpoint, one of the largest concerns related to oil spills
is how the components of oil will affect aquatic organisms. Oil can affect marine life in a
variety of ways, the most apparent being the detrimental effects of contact with viscous
crude oil from surface slicks (Allan et al., 2012). Another more chronic risk is the
persistence of PAHs in the environment, because they can easily diffuse across cell
membranes to affect organisms (Neff, 1985).
One commonly studied group of organisms after oil spills are fishes, particularly
economically important species. After the Exxon Valdez spill, studies examined oil
effects on survival, growth, feeding, and abundance of herring and salmon (Brown et al.,
1996; Carls et al., 1996a; Carls et al., 1996b; Wertheimer and Celewycz, 1996). Fishes
can also be used to assess potential bioaccumulation of PAHs in chronically polluted
waters (Rose et al., 2012) and to monitor pollution levels in coastal areas (Escartin and
Porte, 1999).
Fish can be exposed to PAHs in several ways; these include contact with
contaminated water or sediments and contaminated food resources. Once exposed, PAHs
can easily diffuse across cell membranes due to their lipophilic nature. Upon entering a
cell, PAHs bind to receptor proteins, causing cytochrome P4501A induction (CYP1A).
Cytochrome P4501A induction catalyzes phase I enzymes, which introduce a polar group
to xenobiotic (pollutant) molecules. Next, phase II enzymes produce water-soluble
conjugates from the phase I metabolites, these conjugates can be easily excreted by fish

4
(Tuvikene, 1995). This process allows fish to expel hydrocarbons two to three days after
exposure (Pointet and Milliet, 2000).
Numerous exogenous and endogenous factors can influence the rates of uptake,
metabolism, and excretion of PAHs in aquatic organisms (McElroy et al., 1989). These
factors include water temperature, sex, life stage, salinity, species, and length and
concentration of exposure (Neff, 1985). Differences in metabolic rates among different
species are most influenced by percent lipid content in tissues (Varanasi et al., 1989).
Decreased water temperature increases bioaccumulation of PAHs (Varanasi et al., 1981)
and increased salinity increases fish sensitivity to PAHs (Levitan and Taylor, 1979). It is
also generally accepted that egg and larval life stages are most vulnerable to potential oil
spill effects and rates of metabolism are shown to vary by life stage (Rosenthal and
Alderdice, 1976). Solbakken et al. (1984) showed that cod eggs could not eliminate
benzo(a)pyrene, whereas larvae actively expelled it. This is likely due to an increase in
the activity of xenobiotic metabolizing enzymes in larval fish compared to the egg stage
(Solbakken et al., 1984). Another route of exposure for eggs is via the transfer of PAHs
from parental fish to developing gametes (Varanasi et al., 1989). This is important to
consider for oil spills occurring during spawning season, such as the DWH, which
occurred during the red snapper, Lutjanus campechanus, spawning season. The juvenile
stages from such spawning may be affected from parental transfer and from exposure to
water-borne PAHs. Gender can also influence PAH metabolism, with males showing
higher mixed-function oxygenase (MFO) activity than females; additionally testosterone
induces CYP1A activity and estrogen inhibits activity (Stegeman and Chevion, 1980;
Vodicnik and Lech, 1983). These two factors lead to greater bioaccumulation of PAHs in
5
female than male fish, particularly during spawning season when estrogen and
testosterone release are high.
Polycyclic aromatic hydrocarbons are lethal to aquatic organisms at
concentrations of 200-10,000 ppb, however sublethal effects can be seen at
concentrations as low as 5 ppb in fishes (Neff, 1985). Sublethal effects include immune
suppression (Payne and Fancey, 1989), decreased reproductive potential (Adams et al.,
1989), reduced juvenile growth (Heintz et al., 2000), and liver lesions (Myers et al.,
1992). The toxicity of PAHs is not from the parent PAHs, but from their metabolites
(Tuvikene, 1995). These metabolites often interfere with cell membrane functions and
associated enzyme systems (Neff, 1985). Residues of PAHs in fish tissues can also pose
health problems for human consumption (Varanasi et al., 1989).
An important aspect of oil spill research is determination of the oil source. This is
particularly true in the Gulf of Mexico where there are a variety of sources of potential
PAH contamination. However, identifying the oil source is complicated due to the oil
weathering over time, which alters the proportion of components in the original oil.
Several studies have suggested the use of PAH ratios to identify if the contaminants come
from petrogenic (derived from petroleum) or pyrogenic (derived from combustion)
sources. Ke et al. (2002) used ratios of phenanthrene to anthracene (PHEN:ANTH) and
fluoranthene to pyrene (FLUO:PYRE) to determine the origin of PAHs shown in
sediment samples and mangrove leaves following an oil spill. Baumard et al. (1998)
suggested that PHEN:ANTH > 8 and FLUO:PYRE < 1 indicated petrogenic sources, and
PHEN:ANTH < 8 and FLUO:PYRE > 1 indicated pyrogenic sources. Fitzgerald and
Gohlke (2014) used ANTH/ANTH+PHEN and FLUO/FLUO+PYRE ratios from fish

6
tissue samples to compare the proportion of petrogenic to pyrogenic hydrocarbon sources
following the Deepwater Horizon oil spill. They showed that the ratios detected in four
samples suggested primarily pyrogenic contamination and six samples suggested
petrogenic contamination
Condition indices have also been used to monitor PAH pollution effects. In
contrast to most PAH analysis techniques, condition indices are rapid and have lower
cost, which makes them beneficial as initial screening biomarkers or useful when funding
is limited. Commonly used indices include gonadosomatic index (GSI), hepatosomatic
index (HSI), and condition factor (K). The hepatosomatic index is a ratio of liver weight
to body weight, and is often used because the liver is responsible for biotransformation
and elimination of xenobiotics (Pointet and Milliet, 2000). Montenegro and González
(2012) showed higher HSI in Labrisomus philippii (chalapo clinid) from a site with high
anthropogenic activity, than from a site with low anthropogenic activity. Condition
factor, a measurement of body weight to length, showed significantly higher values at
control sites than sites influenced by heavy anthropogenic discharge in fish from the
Paraiba do Sul watershed (Linde-Arias et al., 2008). The GSI index is a ratio of gonad
weight to body weight, and has also been affected by chronic exposure to pollutants that
caused gonadic deterioration and reduced GSI values (Linderoth et al., 2006; Marchand
et al., 2008; Louiz et al., 2009).
In the northern Gulf of Mexico, red snapper are one of the most commercially and
recreationally important fishes, valued at $60 million per year (Gallaway et al., 2009).
Due to their economic importance, the stock has been fished extensively in the past and
has been considered overfished (SEDAR 31, 2013). There has been extensive study of
7
this species to help management rebuild the stock. These studies have included
estimations of life history parameters, diets, mortality, habitats, and movements and
productivity (Gallaway et al., 2009). Oil spills have been shown to alter some of these
traits in other fish species. For example, Heintz et al. (2000) found that pink salmon
showed delayed effects on growth and marine survival after exposure to oil from the
Exxon Valdez oil spill as embryos. Weights in oil exposed versus unexposed fish
differed by 5% at the end of the experiment, and exposed salmon showed a 15% decrease
in survival rate compared to unexposed salmon after two years (Heintz et al., 2000).
Previous studies have also examined oil-related contamination in fishes in the
northern Gulf of Mexico. Nulton and Johnson (1981) studied PAH concentrations in
large oil platform-associated fishes (including red snapper) and showed PAH
concentrations between 10-220 ppb (wet weight), with most fish showing < 70 ppb in
tissue samples. Studies have also examined the effects of oil platforms and the
occurrence of lesions on fish. For example, Grizzle (1986) showed gross lesions in 30 of
523 collected fish, but did not detect any oil platform effect. Only limited research has
been conducted examining lesions following the DWH oil spill. Murawski et al. (2014)
reported 0.1 to > 6% skin lesions from long-line collections of several marine fish
species, with about 3.5% of red snapper showing lesions. Arias et al. (2013) concluded
that one of the isolated bacteria from the lesions, Photobacterium damselae, were a part
of the normal microbiota for red snapper, and therefore should not be considered a
pathogen at this time.
Another concern often associated with oil spills is the potential for a year class
failure due to eggs/juveniles being particularly vulnerable to the effects of oil. Red
8
snapper spawn from April through September (Bradley and Bryan, 1975; Futch and
Burger, 1976; Render, 1995; Collins et al., 1996; Jackson et al., 2007) and larvae remain
pelagic until they settle to benthic habitat after approximately 28 days (Szedlmayer and
Conti, 1999; Rooker et al., 2004). Red snapper life history is representative of many
other commercially important fish species in the Gulf of Mexico. To date there are few
reported studies that have examined year class failure or any other detrimental effects of
the DWH incident on red snapper. However, Szedlmayer and Mudrak (2014) have
addressed potential red snapper year class failure, and failed to find a reduction in
postsettlement age-0 red snapper in the fall 2010. Additionally, the authors showed that
age-1 red snapper of the 2010-year class were abundant on reefs sampled in 2011. This
was consistent with a finding of no effects detected from the oil spill on juvenile fish
species within seagrass habitats (Fodrie and Heck, 2011).
To determine if lesions, year class failure, or any other potential changes in red
snapper populations can be attributed to the DWH spill, it is necessary to access the body
burden of PAHs in fish tissues. Thus far, in the northern Gulf of Mexico, there have been
studies published on a variety of coastal fishes (Fodrie and Heck, 2011) and marsh
species (Whitehead et al., 2012; Moody et al., 2013), but fewer on offshores species such
as red snapper (Murawski et al., 2014; Szedlmayer and Mudrak, 2014). In the present
study, gas chromatography/mass spectrometry were used to measure PAHs in red snapper
tissue and sediment samples from fish collected on the Mississippi-Alabama continental
shelf immediate north (103 km) of the DWH spill site. In addition, condition indices were
used to examine if there have been any physiological changes in red snapper following
the DWH spill.
9
METHODS
Study area
Red snapper were collected from randomly selected reefs 20-65 km south of
Mobile Bay, Alabama within three artificial reef permit areas, located 103 to 173 km
from the DWH wellhead (Figure 1). Reefs were located in water depths from 18 to 41 m.
Artificial reef types sampled included small to medium reefs such as steel cages, concrete
pyramids, army tanks, and miscellaneous structures; and larger reefs such as ships,
barges, ship dry-docks and bridge structures (Figure 2).
Capture procedure
Red snapper were caught with hook-and-line and baited fish traps. Fish capture
procedures followed Syc and Szedlmayer (2012). During hook-and-line fishing, two
individuals fished for 30 minutes using double 6/0 J hooks baited with gulf menhaden
(Brevoortia patronus), 27.2 kg test monofilament line, and 45.3 kg test monofilament
leader. Fishing was stopped when there were gear malfunctions, and resumed when two
fishers were ready. After completion of hook-and-line sampling, additional fish were
collected with a baited trap (1.2 × 1.5 × 0.6 m; Collins, 1990). The trap was baited with
gulf menhaden and set for four 15 minutes intervals at each sampled reef. All collected
red snapper were immediately packed on ice and returned to the laboratory for further
analyses (Jaxion-Harm and Szedlmayer, 2015).
10
Laboratory processing
Red snapper size (SL, FL, and TL mm) and weight (0.1 g) were measured in the
laboratory within 48 h of capture. Twenty randomly selected fish had tissue samples
removed (liver, gall bladder, and muscle) for PAH analysis. All tissues were weighed,
wrapped in aluminum foil and placed in individual plastic bags labeled with the fish
number, tissue type, and date collected. All samples were then stored at -20° C until
extraction. For GSI analyses, all fish caught from May 2012 – December 2014 were
identified as male or female and gonads weighed. Fish were visually inspected for any
external skin lesions or abnormalities, and if present photographed.
Sediment Sample Collection
Divers (SCUBA) collected sediment samples at each sample site (Figure 2) using
VWR TraceClean Quality-Assured 250 ml amber glass jars. At the surface they were
packed on ice and returned to the lab and stored frozen at -20° C until extraction.
Extraction and PAH Quantification
We extracted and analyzed the PAHs in fish tissues and sediment samples using a
modified NOAA protocol (Sloan et al., 2004). One modification was the use of
diatomaceous earth as a drying agent after homogenization of fish tissues. A second
modification was the addition of sodium sulfate directly to the extracts to remove water.
We used a control blank (all chemicals but no tissue), a spiked sample (spiked with
known quantities of 20 different PAHs in benzene), and a duplicate sample, in each
pressure extraction procedure (21-22 samples). Lastly, we did not use size exclusion

11
chromatography-high performance liquid chromatography to fractionate chlorinated and
aromatic hydrocarbons. After the extract was filtered through silica/alumina columns,
the solvent was evaporated with a RapidVap Vertex dry evaporator and then analyzed by
gas chromatography/mass spectrometry (GC/MS). Polycyclic aromatic hydrocarbons
were quantified in parts-per-billion (ppb). For all tissue types and sediment, only
samples with weights > 3.0 g were analyzed. Samples were corrected for any analytes >
1 ppb detected in the control blank. The extraction and GC/MS procedures were
considered acceptable if the control blank contained < 5 types of analytes exceeding 2X
limit of detection (LOD). The LOD for the GC/MS used in these analyses was ≤ 1.0 ppb.
All collected sediment samples were analyzed except for duplicates from the
same site, and all muscle tissue samples were analyzed through 27 September 2012. All
2010 pre-spill liver samples (collected prior 01 June 2010) were analyzed, while a
random selection of 20-21 samples were analyzed from June and July 2010. In 2011, all
liver samples were analyzed (n=32). In 2012, 2013, and 2014, 20-21 liver samples per
month were randomly selected for analyses from May, June, and July. Gall bladder
samples were pooled by collection date and site due to small individual weights. All
collection dates and sites with pooled gall bladder weight > 3.0 g were analyzed (Table
1).
Data Analysis
We calculated all statistics using SAS 9.2. (Statistical Analysis System, Cary,
NC). Total PAH (tPAH) included naphthalene, acenaphthylene, acenapthene, fluorene,
phenanthrene, anthracene, fluoranthene, and pyrene including those values < LOD. Total
12
tissue and sediment PAH were compared by Welch’s analysis of variance (Welch’s
ANOVA; Lix et al., 1996). If significant differences were detected a Games-Howell test
was applied to show specific differences (Toothaker, 1992). A linear regression was
applied to examine the relationship between sediment tPAH and distance from the DWH
spill site (Zar, 2010).
In addition, two ratios (phenanthrene:anthracene and fluoranthene:pyrene) of
individual analytes were used to assess potential exposure sources (Baumard et al., 1998).
These ratios were calculated for tissue and sediment by year.
Three different biological indices were used to assess potential oil spill effects on
reproductive organs, liver size, and fish growth. The gonadosomatic index (GSI) was
calculated for each fish (GSI = [gonad weight g/ fish weight g] * 100; Nikolsky, 1963).
A Kruskal-Wallis test was used to compare GSI from 2012, 2013, and 2014, during peak
spawning season (June-August; Zar, 2010). All immature fish and any fish with a size <
200 mm TL were removed from GSI estimates. A hepatosomatic index (HSI) was used
to evaluate any changes in liver size (HSI = [liver weight g/ fish weight g] * 100; Slooff
et al., 1983). Analysis of variance was used to compare HSI by year for pre-spill 2010,
and post-spill 2010, 2011, 2012, 2013, and 2014 (Zar, 2010). Lastly, condition factor
was compared (Fulton’s K = [fish weight g/size mm TL3] *100; Nikolsky, 1963).
Analysis of variance was used to compare K by year for mature fish outside of spawning
season (October – December) from post-spill 2010, 2011, 2012, 2013, and 2014. If
significant differences were detected (p < 0.05), a Tukey-Kramer test was applied after
ANOVA, a Wilcoxon’s rank sum tests with a Bonferroni correction after a Kruskal-
13
Wallis test, or a Games-Howell test after Welch’s ANOVA (Toothacker, 1992; Zar,
2010).

14
RESULTS
Polycyclic Aromatic Hydrocarbons
Muscle tissue
Polycyclic aromatic hydrocarbons were extracted and analyzed for red snapper
muscle samples (total n = 697) from pre-spill 2010 (n = 99), and post-spill: 2010 (n =
121), 2011 (n = 32), and 2012 (n = 445). Significant differences were observed in mean
(±SD) tPAH by year, with pre-spill 2010 = 0.02 ± 0.06 ppb, and post-spill 2010 =
3.89 ± 4.41 ppb, 2011 = 5.42 ± 2.54 ppb, and 2012 = 2.28 ± 3.73 ppb (Welch’s
ANOVA, F3,116.8 =132.2, P < 0.0001; Figure 3). A Games-Howell test indicated that all
years were significantly different from each other except post-spill 2010 and 2011.
Liver
Red snapper liver samples (total n = 349) were analyzed for PAHs from pre-spill
2010 (n = 75), and post-spill: 2010 (n = 52), 2011 (n = 32), 2012 (n = 65), 2013 (n = 63),
and 2014 (n = 62). Significant differences were detected in mean (±SD) tPAH by year.
Pre-spill 2010 tPAH (1.5 ± 2.1 ppb) was significantly less than post-spill 2010 tPAH
(4.6 ± 6.9 ppb). In later years, 2011 tPAH (0.1 ± 0.1 ppb), 2012 tPAH (0.6 ± 2.8
ppb), 2013 tPAH (0.1 ± 0.1 ppb), and 2014 tPAH (0.1 ± 0.2 ppb) were all
significantly lower than pre spill 2010 tPAH (Welch’s ANOVA: F5,150.4 = 11.7, P <
0.0001; Figure 4). A Games-Howell test indicated that post-spill 2010 liver tPAH
was significantly greater than all other years.
15
Gall Bladder
Red snapper gall bladder samples (pooled into 72 samples for extraction) were
analyzed for PAHs from pre-spill and post-spill samples by year. No significant
differences were detected among years for gall bladder samples (Kruskal-Wallis, H5 =
6.1, P = 0.30). Mean (± SD) gall bladder tPAH for pre-spill 2010 = 0.2 ± 0.2 ppb, and
for post-spill years: 2010 = 0.1 ± 0.2 ppb, 2011 = 0.0 ± 0.0 ppb, 2012 = 0.2 ± 0.3 ppb,
2013 = 0.1 ± 0.1 ppb, and 2014 = 0.1 ± 0.1 ppb (Figure 5).
Sediment
Sediment samples were analyzed for PAH from 103 red snapper sample sites (n =
28 in 2011, n = 31 in 2012, n = 20 in 2013, and n = 24 in 2014). Mean (± SD) tPAH for
2011 = 0.03 ± 0.14 ppb was significantly lower than 2012 = 0.69 ± 0.96 ppb, and
significantly higher than 2014 = 0.01 ± 0.01 ppb, but no difference was detected for
2013 = 0.41 ± 0.97 ppb (Welch′s ANOVA: 𝐹3,40.9 = 6.5, P = 0.0011; Figure 6). No
significant distance from spill effects were detected for tPAH (linear regression: n =
103, 𝑅2 = 0.009, P = 0.33; Figure 7).
Ratio comparisons
Phenanthrene:anthracene (PHEN:ANTH) and fluoranthene:pyrene
(FLUO:PYRE) were compared over years in both red snapper tissue and sediment
samples. Mean (±SD) tissue PHEN:ANTH ratios for pre-spill 2010 = 1.76 ± 1.00 (n =
6), post-spill 2010 = 2.60 ± 2.20 (n = 23), 2011 = 1.35 ± 1.38 (n = 9), 2012 = 2.52 ±
2.24 (n = 43; Figure 8). Both PHEN and ANTH were only detected in sediments for

16
2012 (PHEN:ANTH ratio = 2.87 ± 2.36, n = 4; Figure 8). Pre-spill 2010 FLUO:PYRE
ratios = 1.20 (n = 1), and post-spill 2010 = 1.03 ± 0.86 (n = 65), 2011 = 1.12 ± 1.51 (n
= 16), 2012 = 2.20 ± 5.08 (n = 58), and 2013 = 1.00 ± 0.01 (n = 2; Figure 9). For
sediment, 2012 FLUO:PYRE = 0.88 ± 0.33 (n = 15) and 2013 = 0.27 (n = 1; Figure 9).
Biological Indices
Gonadosomatic Index
Gonadosomatic index was calculated for male and female red snapper during
the peak spawning season (June-August) of each year. Mean (± SD) female GSI
during peak spawning in 2012 = 1.2 ± 0.9% (n = 102), 2013 = 1.4 ± 1.2% (n = 35),
and 2014 = 0.6 ± 1.1% (n = 132). Female GSI in 2012 and 2013 were significantly
higher than 2014, but no significant differences were detected between 2012 and
2013(Kruskal-Wallis, H2 = 61.8, P < 0.0001; Figure 11). Male GSI ± SD in 2012 = 1.5
± 1.2% (n = 128), and was significantly higher than 2014 = 1.1 ± 1.4% (n = 107), but
not significantly different from 2013 = 1.4 ± 1.5% (n = 30; Kruskal-Wallis, H2 = 20.9,
P<0.0001; Figure 10).
Hepatosomatic Index
Red snapper HSI (n = 1,663) were compared from pre-spill 2010 to post-spill
2010 to 2014 (Table 2). No significant differences were detected in red snapper HSI
among years (ANOVA, F5, 1657 = 1.0, P = 0.44; Figure 11).
17
Fulton’s K
Fulton’s K was calculated for mature red snapper (n = 1047) outside of spawning
season (October – December) from post-spill 2010 to 2014 (Table 2). There were
significant differences in K among years, with K being the highest for 2014 (ANOVA
F4, 1042 = 60.6, P < 0.0001; Figure 12).
Lesions in Red Snapper
External lesions in red snapper were rare. Among all red snapper collected (n =
3934) from 2010 through 2014, only 10 (0.25 %) showed external lesions or
abnormalities.
18
DISCUSSION
Polycyclic Aromatic Hydrocarbon Analyses
Oil entered our sampling area on 1 June 2010 and remained for approximately 40
days, based on NOAA’s nearshore surface oil forecasts (NOAA OR&R, 2010). This
indicates the potential for hydrocarbon contamination to both sediment and biota.
However, the present study only detected very low levels (means < 6 ppb tPAH) across
all tissue types and sediment samples. This study failed to show any evidence of PAH
contamination above background levels after 2012 in any tissue type or in sediment
samples. Despite finding significant differences in tPAH concentrations among years, all
PAH levels in this study were well below the levels of concern (i.e., 32,700 ppb
naphthalene) set by the EPA and FDA (FDA, 2010), and equal or lower than PAH levels
reported from pristine environments (~2.6 – 26 ppb wet wt; McDonald et al., 1992)
Assessing the effects of acute pollution events is complicated for a variety of
reasons. First, in the Gulf of Mexico, there are historical natural and anthropogenic
sources as well as contemporary natural oil sources that include natural seeps, tanker and
oil rig spills, and run off from the Mississippi River and Mobile Bay. Therefore it is
important to identify the origin of oil contamination before making evaluations on the
effects of the DWH oil spill. Ratios of different PAHs have been used to identify the
source of oil contamination in water, sediment, or tissue (Galarneau, 2008). These
methods have been applied in several studies following the DWH oil spill (Mitra et al.,
2012; Fitzgerald and Gohlke, 2014) and with oil spills in other areas (Ke et al., 2002).
There are several possible ratios that could be used (Tobiszewski and Namieśnik, 2012).
In the present study, ratios of PHEN:ANTH and FLUO:PYRE were used to assess
19
whether the PAH’s detected in samples were petrogenic or pyrogenic origin. According
to Baumard et al. (1998), PHEN:ANTH > 8 and FLUO:PYRE < 1 indicate petrogenic
sources. In this study, for all tissue and sediment samples, PHEN:ANTH ratios were < 8.
All tissue samples had FLUO:PYRE > 1, but in sediment samples FLUO:PYRE < 1.
There were only 81 tissue samples and 4 sediment samples across all years with
detectable levels of PHEN and ANTH, and 142 tissue samples and 16 sediment samples
with detectable levels of FLUO and PYRE. The ratios in the present study suggested that
PAH’s were a mixture of both petrogenic and pyrogenic sources, and were consistent
with another study that reported PAH ratios for reef fish including red snapper, red
grouper (Epinephelus morio), yellowedge grouper (Hyporthodus flavolimbatus), scamp
(Mycteroperca phenax), gag (Mycteroperca microlepis), snowy grouper (Epinephelus
niveatus), and tilefish (Lopholatilus sp.) after the DWH oil spill (Fitzgerald and Gohlke
2014). Most likely, fish sampled in the present study showed contamination from various
sources, based on the PAH ratios. These sources may or may not be related to the DWH
oil spill.
Second, different areas can show different exposure levels. Thus, oil spill effects
cannot be assumed similar across the areas that were exposed. For example, Tronczyński
et al. (2004) reported that if oil slicks wash up on shorelines they can act as a sink for
hydrocarbons, leading to chronic contamination problems. As another example, it might
be expected that the deep sea environment directly surrounding the wellhead would show
more PAH contamination compared to shelf habitat. Diercks et al. (2010) measured the
distribution of deep subsurface hydrocarbons following the DWH oil spill. They reported
that a subsurface oil plume extended as far as 13 km southwest of the wellhead site. The
20
present study sites might be considered in between these two extremes (beach and deep
sea), with a mean distance 138 km from the DWH site. Due to the distance of the present
sample sites from the DWH site, it was not surprising that PAHs were not detected in
sediment samples in the present study (~ 0.3 ppb across all years). The sites in the
present study were primarily exposed to surface oil, which was heavily degraded due to
dissolution and evaporation (Brown et al., 2010; Gong et al., 2010), and sediments were
probably not exposed to significant PAH. In contrast sediment contamination was
reported primarily in samples collected within 2.7 km of the wellhead (Operational
Science Advisory Team, 2010).
Third, different species, life stages, and tissues can show different responses to
PAH contamination. Often invertebrates, such as molluscs and crustaceans, are used to
assess the presence or absence of oil in an environment because they lack efficient
metabolism of hydrocarbons (Law and Biscaya, 1994), while fish can metabolize
hydrocarbons efficiently and may be less suitable for PAH evaluations. However, red
snapper are an important fish to monitor due to their economic importance. If red
snapper have been negatively affected by the oil spill, managers must account for this
additional stressor in setting restrictive regulations. Additionally, red snapper were
actively spawning during the peak oil spill months, and resultant eggs and larvae may be
more susceptible to an oil spill event (Teal and Howarth, 1984).
In this study muscle samples had the highest mean tPAH, in contrast to other
studies that reported the highest PAH contamination in liver samples, due to the liver’s
role in metabolism of PAHs and its high lipid content (Hamelink and Spacie, 1977;
Pritchard, 1993). One possible explanation for this could be that higher PAH in skin

21
tissues contributed to muscle tissue levels (Neff, 1985), as muscle tissues were stored
with attached skin tissue until the extraction process. This may have resulted in the
higher tPAH concentrations in muscle tissue than in liver tissue seen in the present study.
Liver tissue showed contamination in our pre-spill (May 2010) samples. It is
unlikely that oil from the DWH had reached our sites in May, because these samples
were collected on 5 May 2010 and 14 May 2010, and the surface oil was still
approximately 64 km south of our sites at this time (NOAA OR&R, 2010). Also unlikely
is that these fish moved into our sampling array from a more contaminated location, as
red snapper home ranges (radius~ 30 m) are small relative to the distance between the
DWH spill and fish collections (Topping and Szedlmayer, 2011; Piraino and Szedlmayer,
2014), therefore, the PAH levels observed in our pre-spill liver samples were most likely
from a source unrelated to the DWH spill.
Despite the detected trends in muscle and liver tissue PAH, actual concentrations
were very low in both tissue types. There are several potential explanations for the low
PAH levels observed: 1) It could be an artifact of adult fish being less susceptible to
hydrocarbon contamination (Payne et al., 2003), 2) not catching the fish during the two to
three day window prior to metabolism of PAH’s (Pointet and Milliet, 2000), or 3) the
effects of the oil spill were less encompassing than originally suspected (Fodrie and
Heck, 2011; Moody et al., 2013; Szedlmayer and Mudrak, 2014).
Lastly, studies use different levels of PAH’s to assess contamination effects on
physiology. Some studies that showed negative effects of PAH contamination used PAH
levels at much higher levels (parts-per-million) compared to the levels (parts-per-billion)
shown in the present study. For example, Anderson et al. (1974) and Moles (1980)
22
measured acute toxicity effects (mortality of 50% of the test population) in sheepshead
minnow (Cypriondon variegatus) and juvenile coho salmon (Oncorhynchus kisutch).
Sheepshead minnow had 50% mortality within 24 hours with treatment of 2.4 ppm
naphthalene (Anderson et al., 1974) and juvenile coho salmon had 50% mortality within
96 hours of treatment with 3.2 ppm naphthalene (Moles, 1980).
Spotted seatrout (Cynoscion nebulosus) exposed to ~ 0.077 ppm and ~0.725 ppm
total petroleum hydrocarbon concentrations, showed no significant changes in growth
rates for larval fish, but significantly reduced growth rates in juvenile fish after 3 days of
depuration. After four weeks of depuration there were no significant differences in
growth rates (Brewton et al., 2013).
However other studies have used low PAH levels similar to levels measured in
the present study. For example, embryos of yellowfin tuna (Thunnus albacares),
southern bluefin tuna (Thunnus maccoyii), and yellowtail amberjack (Seriola lalandi)
were exposed to artificially weathered source oil and surface-skimmed oil with tPAH
concentrations ranging from ~3-14 ppb (Incardona et al., 2014). These exposures
resulted in gross morphological defects such as accumulation of pericardial edema, lack
of actinotrichia, reduction in the outgrowth of the finfolds or finfold blisters, reduced eye
growth, dorsal curvature of the body axis, and cardiac function defects (Incardona et al.,
2014). In another study, pacific herring (Clupea pallasi) eggs were exposed to varying
concentrations of PAHs from weathered Alaska North Slope crude oil for 16 days. The
authors showed significantly elevated egg mortality after exposure to 7.6 ppb tPAH
(Carls et al., 1999).
23
When comparing among studies, it is important to keep in mind that different
studies assess different suites of PAHs. For example, some studies only examined bile
metabolites (Aas and Klungsøyr, 1998; Aas et al., 2000), others considered parent PAHs
(Fitzgerald and Gohlke, 2014), or a combination of parent and alkylated PAHs
(Tronczyński et al., 2004). What is apparent from these studies is that the effects of oil
exposure can vary over a large range of PAH concentrations in water, sediment, or tissue.
However, for the most part, effects have been detected in larval and juvenile fish with
little evidence for significant effects on adults.
Lesions
An apparent increase in the occurrence of external lesions has been attributed to
the DWH oil spill (Murawski et al., 2014). They reported a high rate of lesions in red
snapper that exceeded 6%, but sample size was low with only 50 red snapper examined.
The present study was based on a large red snapper sample size (n = 3934) and showed
little evidence of increased lesions from the DWH oil spill (lesion occurrence = 0.25 %).
Another difference may be that Murawski’s et al. (2014) samples were from the deeper
De Sota Canyon, while present study samples were from the relatively shallower
continental shelf. In addition the ‘high’ rate of lesions may in fact still be within the
range of naturally occurring rates. For example, Grizzle (1986) collected fish in the
northwestern Gulf of Mexico on two drilling platforms and near the Flower Garden
Banks, and showed no significant differences in lesion prevalence between the
experimental (drilling platforms) and control (Flower Garden Banks) sites and reported a
lesion rate of 5.7% in fish collected.

24
Also, despite experiencing ‘high’ oil exposure on the inner-continental shelf, the
percentage of fish with lesions in this area was very low (0.25 %) in the present study. If
the occurrence of lesions was correlated with increased PAH exposure following the oil
spill, then it would be expected that lesion frequency would be similar in regions exposed
to similar concentrations of oil. To further illustrate this, areas outside of the oil spill
plume, even as far southeast as Tampa, FL had lesion frequencies from 4.1-6.0% and >
6% (Murawski et al., 2014). Lastly, other sources of lesions include physical causes,
environmental stressors, immunological causes, or nutritional deficiencies (Law, 2001);
therefore, it is unlikely that the few fish with lesions in the present study were caused by
the DWH oil spill.
Biological Indices
One of the objectives of this study was to examine whether there have been any
physiological effects on red snapper from the oil spill. The gonadosomatic index is
typically used to assess spawning occurrence in fish species (Collins et al., 1996; Brown-
Peterson et al., 2009; White and Palmer, 2004), but it has also been useful as a quick and
inexpensive method to examine pollution effects (Vandermeulen and Mossman, 1996;
Louiz et al., 2009; Montenegro and González, 2012). Most studies that used GSI to
evaluate pollution effects on fish health examined chronically polluted environments,
rather than short-term accidental oil spills (Louiz et al., 2009; Montenegro and González,
2012). Pollution-related GSI studies typically find decreased GSIs from affected sites,
compared to controls (Linderoth et al., 2006; Marchand et al., 2008).
25
Male red snapper GSI during peak spawning showed significant differences
between 2012 and 2014. Female red snapper during peak spawning showed a significant
decrease in GSI between 2012 and 2014, and 2013 and 2014, but these differences could
be attributed to a multitude of factors. Red snapper are asynchronous spawners, with
spawning events influenced by photoperiod and water temperature (Collins et al., 1996;
Phelps et al., 2009; Woods et al., 2003). Variations in either of these parameters could
explain the differences seen in GSI among years.
Another influence on GSI could be pollution from other sources besides the DWH
oil spill. Rivers contribute approximately 28% of the petroleum hydrocarbon input in the
sea worldwide (Pollino and Holdway, 2002), and the present study sites are heavily
influenced by input from rivers that empty into Mobile Bay and Mississippi Sound
(Rabalais, 1992). Because of these other influencing factors, it is difficult to attribute the
statistically significant differences observed in the present study to the DWH oil spill.
Most likely, the significant differences shown in the present study are normal
annual variation in GSI. This is supported by historical data on red snapper GSI from the
northeastern Gulf of Mexico. One study sampled red snapper in northwestern Florida
from 1991-1993 and reported that females GSI values varied from 0.78% to 1.74% and
males varied from 0.41% to 0.63% during peak spawning (Collins et al., 1996). The
present study GSI estimates were similar to these previous estimates for female red
snapper, and higher than previous values reported for male red snapper. Additionally, the
GSI values in the present study are not consistent with the timeline of the oil spill. Had
GSI been influenced by the oil contamination, there should have been a steady increase in
26
GSI, with the highest values occurring in 2014 which had the greatest time period since
the DWH oil spill, but in fact showed the lowest GSI compared to previous years.
In the present study there were no significant differences in HSI in comparisons
of pre-spill and post-spill red snapper. In contrast, previous studies have reported an
increase in HSI from polluted areas compared to control areas (Montenegro and
González, 2012; Pointet and Milliet, 2000). Little variation in HSI by year indicated that
red snapper liver sizes have remained stable from May 2010 to December 2014, and were
not affected by the DWH oil spill.
The present study detected significant differences in Fulton’s K among years.
This index can be affected by pollution (Amara et al. 2009), but also by water
temperature and several other variables (Nikolsky, 1963). However, in the present study
there was not a decreasing trend, as would be expected if there were a chronic pollution
effect. The pattern in K showed a significant decrease from post-spill 2010 to 2011, there
were no significant differences from 2011 through 2013, then in 2014, K significantly
increased. The significant differences seen in this study are unlikely due to the DWH oil
spill for a number of reasons. First, evidence of decreased K doesn’t occur until 2011, at
which point no residual surface slick was present at the sites in this study, and no
sediment contamination was detected. Juvenile sea bass (Dicentrarchus labrax) kept in
field cages at stations with varying pollutant concentrations showed decreased K within
38 days of deployment (Kerambrun et al., 2012), which indicated that if red snapper had
experienced reduced K in response to the oil spill it would have been detected in the 2010
samples. Second, other studies with similar spill characteristics as it the present study
(i.e., primarily influenced by drifting oil slicks), did not detect decreased fish condition or
27
K values in samples from more heavily contaminated sites (Claireaux et al., 2004;
Lancaster et al., 1998). Third, previous studies showed that variations in fish condition
were more influenced by heavy metal contaminants than PAH pollution (Bervoets et al.,
2009; Fang et al., 2009). Most likely, the significant differences observed in the present
K estimates were normal yearly variations. This inter-annual normal variation was
supported by the low variability among all years at ≤ 0.13%.

28
CONCLUSIONS
The present study concluded that the DWH oil spill had little detrimental effect on
adult red snapper during and following the DWH oil spill. This conclusion was based on
the low levels of PAHs detected in red snapper tissues and the lack of biologically
significant changes in fish condition indices. Additionally, it is unlikely that there will be
any chronic contamination problems in the present study area due to low levels of
detected PAHs in sediment samples in the four years following the spill. However,
monitoring of PAH’s in red snapper and sediments should be continued as the potential
for long term effects caused by lingering oil still exists. This was shown in the Exxon
Valdez oil spill, where the long-term detection continued for several years, and in some
cases more than a decade, following the spill. For example, one long-term monitoring
study showed PAH’s in whole mussel tissue and sediments biannually, in areas that were
impacted by the Exxon Valdez spill, but also locations that undergo potential chronic
contamination from other sources. The authors also showed that PAHs showed
decreasing trends over the course of the study (1993 – 2006), and that any remnants of
Exxon Valdez oil had stabilized or reached levels which no longer appear in mussel
tissue (Payne et al., 2008). Another study showed elevated cytochrome P4501A
expression in masked greenling (Hexagrammos octogrammus) and crescent gunnel
(Pholis laeta) collected in 1999 (ten years after the spill) from sites within the original
spill trajectory (Jewett et al., 2002). So, while it’s possible there will be no evidence of
chronic oil spill effects, the only way to verify this is to continue the monitoring effort.
29
REFERENCES
Aas, E., Klungsøyr, J., 1998. PAH metabolites in bile and EROD activity in North Sea
fish. Marine Environmental Research 46, 229-232.
Aas, E., Baussant, T., Balk, L., Liewenborg, B., Andersen O.K., 2000. PAH metabolites
in bile, cytochrome P4501A and DNA adducts as environmental risk parameters for
chronic oil exposure: a laboratory experiment with Atlantic cod. Aquatic toxicology
51, 241-258.
Adams, S.M., Shepard, K.L., Greeley, M.S., Jimenez, B.D., Ryon, M.G., Shugart, L.R.,
McCarthy, J.F., Hinton, D.E., 1989. The use of bioindicators for assessing the effects of
pollutant stress on fish. Marine Environmental Research 28, 459-464.
Allan, S. E., Smith, B.W., Anderson, K.A., 2012. Impact of the Deepwater Horizon Oil
Spill on Bioavailable Polycyclic Aromatic Hydrocarbons in Gulf of Mexico Coastal
Waters. Environmental Science & Technology 46, 2033-2039.
Amara, R., Selleslagh, J., Billon, G., Minier, C., 2009. Growth and condition of 0-group
European flounder, Platichthys flesus as an indicator of estuarine habitat quality.
Hydrobiologia 627, 87-98.
30
Anderson, J.W., Neff, J.M., Cox, B.A., Tatem, H.E., Hightower, G.M., 1974. Effects of
oil on estuarine animals: Toxicology, uptake and depuration, respiration. In: Vernberg,
F.J., Vernberg, W.B. (eds) Pollution and physiology of marine organisms. Academic.
Arias, C.R., Koenders, K., Larsen, A.M., 2013. Predominant Bacteria Associated with
Red Snapper from the Northern Gulf of Mexico. Journal of Aquatic Animal Health 25,
281-289.
Atlas, R.M., Hazen, T.C., 2011. Oil biodegradation and bioremediation: a tale of the two
worst spills in U. S. history. Environmental Science & Technology 45, 6709-6715.
Baumard, P., Budzinski, H., Michoon, Q., Garrigues, P., Burgeot, T., Belllocq, J., 1998.
Origin and bioavailability of PAHs in the Mediterranean Sea from mussel and sediment
records. Estuarine, Coastal and Shelf Science 47, 77-90.
Bervoets, L., Van Campenhout, K., Reynders, H., Knapen, D., Covaci, A., Blust, R.,
2009. Bioaccumulation of micropollutants and biomarker responses in caged carp
(Cyprinus carpio). Ecotoxicology and Environmental Safety 72, 720-728.
Boehm, P.D., Page, D.S., 2007. Exposure elements in oil spill risk and natural resource
damage assessments: A review. Human and Ecological Risk Assessment 13, 418-448.
31
Bradley, E., Bryan, C.E., 1975. Life history and fishery of red snapper (Lutjanus
campechanus) in the northwestern Gulf of Mexico: 1970-1974. Proceedings of the 22nd
Gulf and Caribbean Fisheries Institute 27, 77-106.
Brewton, R.A., Fulford, R., Griffitt, R.J., 2013. Gene expression and growth as indicators
of effects of the BP Deepwater Horizon oil spill on spotted seatrout (Cynoscion
nebulosus). Journal of Toxicology and Environmental Health, Part A: Current Issues
76(21), 1198-1209.
Brown, E.D., Baker, T.T., Hose, J.E., Kocan, R.M., Marty, G.D., McGurk, M.D.,
Norcross, B.L., Short, J., 1996. Injury to early life history stages of Pacific Herring in
Prince William Sound after the Exxon Valdez oil spill. American Fisheries Society
Symposium 18, 448-462.
Brown, J.S., Beckmann, D., Bruce, L., Mudge, S.M., 2010. PAH depletion ratios,
document the rapid weathering and attenuation of PAHs in oil samples collected after the
Deepwater Horizon incident. Society of Environmental Toxicology and Chemistry North
America 31st Annual Meeting, 380.
Brown-Peterson, N.J., Burns, K.M., Overstreet, R.M., 2009. Regional differences in
Florida red snapper reproduction. Proceedings of the Gulf and Caribbean Fisheries
Institute 61, 149-155.
32
Carls, M.G., Holland, L., Larsen, M., Lum, J.L., Mortensen, D.G., Wang, S.Y.,
Wertheimer, A.C., 1996a. Growth, feeding, and survival of Pink Salmon fry exposed to
food contaminated with crude oil. American Fisheries Society Symposium 18, 608-618.
Carls, M.G., Rice, S.D., Hose, J.E., 1999. Sensitivity of fish embryos to weathered crude
oil: Part I. Low-level exposure during incubation causes malformations, genetic damage,
and mortality in larval pacific herring (Clupea pallasi). Environmental Toxicology and
Chemistry 18 (3), 481-493.
Carls, M.G., Wertheimer, A.C., Short, J.W., Smolowitz, R.M., Stegeman, J.J., 1996b.
Contamination of juvenile Pink and Chum Salmon by hydrocarbons in Prince William
Sound after the Exxon Valdez oil spill. American Fisheries Society Symposium 18, 593-
607.
Claireaux, G., Désaunay, Y., Akcha, F., Aupérin, B., Bocquené, G., Budzinski, H.,
Cravedi, J., Davoodi, F., Galois, R., Gilliers, C., Goanvec, C., Guérault, D., Imbert, N.,
Mazéas, O., Nonnotte, G., Nonnotte, L., Prunet, P., Sébert, P., Vettier, A., 2004.
Influence of oil exposure on the physiology and ecology of the common sole Solea solea:
Experiemental and field approaches. Aquatic Living Resources 17, 335-351.
Collins, M.R., 1990. A comparison of 3 fish trap desings. Fisheries Research 9 (4), 325-
332.
33
Collins, L.A., Johnson, A.G., Keim, C.P., 1996. Spawning and annual fecundity of the
red snapper (Lutjanus campechanus) from the northeastern Gulf of Mexico. In: Arreguin-
Sanches, F., Munro, J.L., Balgos, M.C., Pauly, D. (eds) Biology, fisheries, and culture of
tropical groupers and snapers. ICLARM Conference Proceedings 48.
Diercks, A., Highsmith, R.C., Asper, V.L., Joung, D.J., Zhou, Z., Guo, L., Shiller, A.M.,
Joye, S.B., Teske, A.P., Guinasso, N., Wade, T.L., Lohrenz, S.E., 2010. Characterization
of subsurface polycyclic aromatic hydrocarbons at the Deepwater Horizon site.
Geophysical Research Letters 37, 1-6.
Eisler, R., 1987. Polycyclic aromatic hydrocarbon hazards to fish, wildlife, and
invertebrates: A synoptic review. US Fish and Wildlife Service Biological Report 85.
Escartin, E., Porte, C., 1999. Assessment of PAH pollution in coastal areas from the NW
Mediterranean through the analysis of fish bile. Marine Pollution Bulletin 38, 1200-1206.
Fang, J.K.H., Au, D.W.T., Wu, R.S.S., Chan, A.K.Y., Mok, H.O.L., Shin, P.K.S., 2009.
The use of physiological indices in rabbitfish Siganus oramin for monitoring of coastal
pollution. Marine Pollution Bulletin 58, 1229-1244.
FDA (U.S. Food and Drug Administration), 2010. Protocol for interpretation and use of
sensory testing and analytical chemistry results for re-opening oil-impacted areas closed

34
to seafood harvesting due to the Deepwater Horizon oil spill. Available:
http://www.fda.gov/Food/ucm217601.htm (June 2015).
Fitzgerald, T.P., Gohlke, J.M., 2014. Contaminant levels in Gulf of Mexico reef fish after
the Deepwater Horizon oil spill as measured by a fishermen-led testing program.
Environmental Science & Technology 48, 1993-2000.
Fodrie, F.J., Heck, K.L., 2011. Response of Coastal Fishes to the Gulf of Mexico Oil
Disaster. Plos One 6.
Futch, R.B., Burger, G.E., 1976. Age, growth, and production of red snapper in Florida
waters. In: Bullis Jr., H.R., Jones, A.C. (eds) Proceedings: Colloquim on Snapper-
Grouper Fishery Resources of the Western Central Atlantic Ocean. Texas A&M
University Sea Grand Coll. and Mississippi-Alabama Sea Grant Consortium, Florida Sea
Grant Program Report 17.
Galarneau, E., 2008. Source specificity and atmospheric processing of airborne PAHs:
Implications for source apportionment.
Gallaway, B.J., Szedlmayer, S.T., Gazey, W.J., 2009. A Life History Review for Red
Snapper in the Gulf of Mexico with an Evaluation of the Importance of Offshore
Petroleum Platforms and Other Artificial Reefs. Reviews in Fisheries Science 17, 48-67.
35
Gong, C., Milkov, A.V., Grass, D.B., Sullivan, M.P., Searcy, T., Depret, P., Dzou, L.I.,
2010. The impact of weathering on MC 252 oil chemistry and its fingerprinting. Society
of Environmental Toxicology and Chemistry North America 31st Annual Meeting, 381.
Grizzle, J.M., 1986. Lesions in fishes captured near drilling platforms in the Gulf of
Mexico. Marine Environmental Research 18, 267-276.
Hamelink, J.L., Spacie, A., 1977. Fish and chemicals: the process of accumulation.
Annual Review of Pharmacology and Toxicology 17, 167-177.
Heintz, R.A., Rice, S.D., Wertheimer, A.C., Bradshaw, R.F., Thrower, F.P., Joyce, J.E.,
Short, J.W., 2000. Delayed effects on growth and marine survival of pink salmon
Oncorhynchus gorbuscha after exposure to crude oil during embryonic development.
Marine Ecology Progress Series 208, 205-216.
Ho, K., Patton, L., Latimer, J.S., Pruell, R.J., Pelletier, M., McKinney, R., Jayaraman, S.
1999. The chemistry and toxicity of sediment affected by oil from the North Cape spilled
into Rhode Island Sound. Marine Pollution Bulletin 38, 314-323.
Incardona, J.P., Gardner, L.D., Linbo, T.L., Brown, T.L., Esbaugh, A.J., Mager, E.M.,
Stieglitz, J.D., French, B.L., Labenia, J.S., Laetz, C.A., Tagal, M., Sloan, C.A., Elizur,
A., Benetti, D.D., Grosell, M., Block, B.A., Scholz, N.L., 2014. Deepwater Horizon
36
crude oil impacts the developing hearts of large predatory pelagic fish. PNAS Early
Edition, 1-9.
Jackson, M.W., Cowan Jr., J.H., Nieland, D.L., 2007. Demographic differences in
northern Gulf of Mexico red snapper reproductive maturation: Implications for the unit
stock hypothesis. In: Patterson III, W.F., Cowan Jr., J.H., Fitzhugh, G.R., Nieland, D.L.,
(eds) Red Snapper Ecology and Fisheries in the U.S. Gulf of Mexico. American Fisheries
Society Symposium 60. American Fisheries Society.
Jaxion-Harm J., Szedlmayer, S.T., 2015. Depth and artificial reef type effects on size
and distribution of red snapper in the northern Gulf of Mexico. North American
Journal of Fisheries Management, 35:1, 86-96.
Jewett, S.C., Dean, T.A., Woodin, B.R., Hober, M.K., Stegeman, J.J., 2002. Exposure to
hydrocarbons 10 years after the Exxon Valdez oil spill: Evidence from cytochrome
P4501A expression and biliary FACs in nearshore demersal fishes. Marine
Environmental Research 54 (1), 21-48.
Johnson, A.C., Larsen, P.F., Gadbois, D.F., Humanson, A.W., 1985. The distribution of
polycyclic aromatic hydrocarbons in the surficial sediments of Penobscot Bay (Maine,
USA) in relation to possible sources and to other sites worldwide. Marine Environmental
Research 15, 1-16.
37
Ke, L., Wong, T.W.Y., Wong, Y.S., Tam, N.F.Y., 2002. Fate of polycylic aromatic
hydrocarbon (PAH) contamination in a mangrove swamp in Hong Kong following an oil
spill. Marine Pollution Bulletin 45, 339-347.
Kerambrun, E., Henry, F., Courcot, L., Gevaert, F., Amara, R., 2012. Biological
responses of caged juvenile sea bass (Dicentrarchus labrax) and turbot (Scophtalmus
maximus) in a polluted harbour. Ecological Indicators 19, 161-171.
Lancaster, J.E., Pawson, M.G., Pickett, G.D., Jennings, S., 1998. The impact of the 'Sea
Empress' oil spill on seabass recruitment. Marine Pollution Bulletin 36 (9), 677-688.
Law, R.J., Biscaya, J.L., 1994. Polycyclic aromatic hydrocarbons (PAH) - Problems and
progress in sampling, analysis and interpretation. Marine Pollution Bulletin 29, 235-241.
Law, M., 2001. Differential diagnosis of ulcerative lesions in fish. Environmental Health
Perspectives 109, 681-686.
Levitan, W.M., Taylor, M.H., 1979. Physiology of salinity-dependent naphthalene
toxicity in Fundulus heteroclitus. Journal of the Fisheries Research Board of Canada
36(6), 615-620.
38
Linde-Arias, A.R., Inácio, A.F., Novo, L.A., de Alburquerque, C., Moreira, J.C., 2008.
Multibiomarker approach in fish to assess the impact of pollution in a large Brazilian
river, Paraiba do Sul. Environmental Pollution 156, 974-979.
Linderoth, M., Hansson, T., Liewenborg, B., Sundberg, H., Noaksson, E., Hanson, M.,
Zebühr, Y., Balk, L., 2006. Basic physiological biomarkers in adult female perch (Perca
fluviatilis) in a chronically polluted gradient in the Stockholm recipient (Sweden). Marine
Pollution Bulletin 53, 437-450.
Lix, L.M., Keselman, J.C., Keselman, H.J., 1996. Consequences of assumption violations
revisited: A quantitative review of alternatives to the one-way analysis of variance "F"
test. Review of Educational Research 66 (4), 579-619.
Louiz, I., Ben-Attia, M., Ben-Hassine, O.K., 2009. Gonadosomatic index and gonad
histopathology of Gobius niger (Gobiidea, Teleost) from Bizerta lagoon (Tunisia):
Evidence of reproduction disturbance. Fisheries Research 100, 266-273.
Lovell, D.P., 2013. Biological importance and statistical significance. Journal of
Agricultural and Food Chemistry 61, 8340-8348.
Marchand, M.J., Pieterse, G.M., Barnhoorn, I.E.J., 2008. Preliminary results on perm
motility and testicular histology of two feral fish species, Oreochromis mossambicus and

39
Clarias gariepinus, from a currently DDT-sprayed area, South Africa. Journal of Applied
Ichthyology 24, 423-429.
McDonald, S.J., Kennicutt, M.C., Brooks, J.M., 1992. Evidence of polycyclic aromatic
hydrocarbon (PAH) exposure in fish from the Antarctic Peninsula. Marine Pollution
Bulletin 25, 313-317.
McElroy, A.E., Farrington, J.W., Teal, J.M., 1989. Bioavailability of polycyclic aromatic
hydrocarbons in the aquatic environment. In: Varanasi, U. (eds) Metabolism of
Polycyclic Aromatic Hydrocarbons in the Aquatic Environment. CRC Press.
Mitra S., Kimmel, D.G., Snyder, J., Scalise, K., McGlaughon, B.D., Montoya, J.P.,
Rosenbauer, R.J., Lorenson, T.D., Wong, F.L., Campbell, P.L., 2012. Macondo-1 well
oil-derived polycyclic aromatic hydrocarbons in mesozooplankton from the northern Gulf
of Mexico. Geophysical Research Letters 39, 1-7.
Moles, A., 1980. Sensitivity of parasitized coho salmon fry to crude oil, toluene, and
naphthalene. Transactions of the American Fisheries Society 109(3), 293-297.
Montenegro, D., González, M.T., 2012. Evaluation of somatic indexes, hematology and
liver histopathology of fish Labrisomus philippii from San Jorge Bay, northern Chile, as
associated with environmental stress. Revista de Biología Marina y Oceanografía 47(1),
99-107.
40
Moody, R.M., Cebrian, J., Heck, K.L., 2013. Interannual Recruitment Dynamics for
Resident and Transient Marsh Species: Evidence for a Lack of Impact by the Macondo
Oil Spill. Plos One 8.
Murawski, S.A., Hogarth, W.T., Peebles, E.B., Barbeiri, L., 2014. Prevalence of external
skin lesions and polycyclic aromatic hydrocarbon concentrations in Gulf of Mexico
fishing, post-Deepwater Horizon. Transactions of the American Fisheries Society 143,
1084-1097.
Myers, M.S., Olson, O.P., Johnson, L.L., Stehr, C.S., Hom, T., Varanasi, U., 1992.
Hepatic lesions other than neoplasms in subadult flatfish from Puget Sound, WA;
Relationships with indices of contaminant exposure. Marine Environmental Research 34,
45-51.
National Research Council, 2003. Oil in the Sea III: Inputs, Fates, and Effects. The
National Academies Press, Washington, DC.
Neff, J.M., 1985. Polycyclic Aromatic Hydrocarbons. In: Rand, G.M., Petrocelly, S.R.,
(eds) Fundamentals of aquatic toxicology. Taylor and Francis.
Nikolsky, G.V., 1963. The ecology of fishes. Acadmeic Press.
41
NOAA (National Oceanic and Atmospheric Administration) OR&R (Office of Response
and Restoration), 2010. Deepwater Horizon oil spill trajectory maps. Available:
http://archive.orr.noaa.gov/topic_subtopic_entry.php?RECORD_KEY%28entry_subtopic
_topic%29=entry_id,subtopic_id,topic_id&entry_id(entry_subtopic_topic)=831&subtopi
c_id(entry_subtopic_topic)=2&topic_id(entry_subtopic_topic)=1 (May 2015).
Nulton, C.P., Johnson, D.E., 1981. Aromatic-hydrocarbons in marine tissues from the
central Gulf of Mexico. Journal of Environmental Science and Health Part a-
Environmental Science and Engineering & Toxic and Hazardous Substance Control 16,
271-288.
Operational Science Advisory Team, 2010. Summary report for sub-sea and sub-surface
oil and dispersant detection: Sampling and monitoring. New Orleans: Unified Area
Command. Available:
http://www.restorethegulf.gov/sites/default/files/documents/pdf/OSAT_Report_FINAL_1
7DEC.pdf (August 2015).
Payne, J.R., Driskell, W.B., Short, J.W., Larsen, M.L., 2008. Long term monitoring for
oil in the Exxon Valdez spill region. Marine Pollution Bulletin 56 (12), 2067-2081.
Payne, J.F., Fancey, L.F., 1989. Effect of polycyclic aromatic-hydrocarbons on immune-
responses in fish - change in melanomacrophage centers in flounder (Pseudopleuronectes
42
americanus) exposed to hydrocarbon-contaminated sediments. Marine Environmental
Research 28, 431-435.
Payne, J.F., Mathiew, A., Collier, T.K., 2003. Ecotoxicological studies focusing on
marine and freshwater fish. In: Douben, P.E.T., (eds) PAHs: An Ecotoxicological
Perspective. Wiley.
Phelps, R.P., Papanikos, N., Bourque, B.D., Bueno, F.T., Hastey, R.P., Maus, D.L.,
Ferry, A., Davis, D.A., 2009. Spawning of red snapper (Lutjanus campechanus) in
response to hormonal induction or environmental control in a hatchery setting. Reviews
in Fisheries Science 17(2), 149-155.
Piraino, M.N., Szedlmayer, S.T., 2014. Fine-scale movments and home ranges of red
snapper around artificial reefs in the northern Gulf of Mexico. Transactions of the
American Fisheries Society 143(4), 988-998.
Pointet, K., Milliet, A., 2000. PAHs analysis of fish whole gall bladders and livers from
the National Reserve of Camargue by GC/MS. Chemosphere 40, 293-299.
Pollino, C.A., Holdway, D.A., 2002. Reproductive potential of crimson-spotted
rainbowfish (Melanotaenia fluviatilis) following short-term exposure to Bass Strait crude
oil and dispersed crude oil. Environmental Toxicology, 138-145.
43
Pritchard, J.B., 1993. Aquatic toxicology: past, present, and prospects. Environmental
Health Perspectives 100, 249-257.
Rabalais, 1992. An updated summary of status and trends in indicators of nutrient
enrichment in the Gulf of Mexico. EPA/ 800-R-92-004.
Reddy, C.M., Arey, J.S., Seewald, J.S., Sylva, S.P., Lemkau, K.L., Nelson, R.K.,
Carmichael, C.A., McIntyre, C.P., Fenwick, J., Ventura, G.T., Van Mooy, B.A.S.,
Camilli, R., 2012. Composition and fate of gas and oil released to the water column
during the Deepwater Horizon oil spill. Proceedings of the National Academy of
Sciences of the United States of America 109, 20229-20234.
Reed, M., Johansen, O., Brandvik, P.J., Daling, P., Lewis, A., Fiocco, R., Mackay, D.,
Prentki, R., 1999. Oil spill modeling towards the close of the 20th century: Overview of
the state of the art. Spill Science & Technology Bulletin 5, 3-16.
Render, J.H., 1995. The life history (age, growth and reproduction) of red snapper
(Lutjanus campechanus) and its affinity for oil and gas platforms. Ph.D Dissertation,
Louisiana State University, Baton Rouge, Louisiana USA.
Rooker, J.R., Landry, A.M., Geary, B.W., Harper, J.A., 2004. Assessment of a shell bank
and associated substrates as nursery habitat of postsettlement red snapper. Estuarine
Coastal and Shelf Science 59, 653-661.
44
Rose, A., Ken, D., Kehinde, O., Babjide, A., 2012. Bioaccumulation of polycyclic
aromatic hydrocarbons in fish and invertebrates of Lagos Lagoon, Nigeria. JETEAS 3,
287-296.
Rosenthal, H., Alderdice, D.F., 1976. Sublethal effects of environmental stressors, natural
and pollutional, on marine fish eggs and larvae. Journal of Fisheries Research Board of
Canada 33(9), 2047-2065.
Sammarco, P.W., Kolian, S.R., Warby, R.A.F., Bouldin, J.L., Subra, W.A., Porter, S.A.,
2013. Distribution and concentrations of petroleum hydrocarbons associated with the
BP/Deepwater Horizon Oil Spill, Gulf of Mexico. Marine Pollution Bulletin 73, 129-143.
SEDAR 31, 2013. Stock Assessment of Red Snapper in the Gulf of Mexico SEDAR
Update Assessment. Miami, FL.
Sims, R.C., Overcash, M.R., 1983. Fate of polynuclear aromatic-compounds (PNAS) in
soil-plant systems. Residue Reviews 88, 1-68.
Sloan, C.A., Brown, D.W., Pearce, R.W., Boyer, R.H., Bolton, J.L., Burrows, D.G.,
Herman, D.P., Krahn, M.M., 2004. Extraction, cleanup, and gas chromatography/mass
spectrometry analysis of sediments and tissues for organic contaminants. U.S. Dept.
Commer., NOAA Tech. Memo., NMFS-NWFSC-59.
45
Slooff, W., Van Kreijl, C.F., Baars, A.J., 1983. Relative liver weights and xenobiotic-
metabolizing enzymes of fish from polluted surface waters in the Netherlands. Aquatic
Toxicology 4, 1-14.
Solbakken, J.E., Tilseth, S., Palmork, K.H., 1984. Uptake and elimination of aromatic
hydrocarbons and a chlorinated biphenyl in eggs are larvae of cod Gadus morhua. Marine
Ecology Progress Series 16, 297-301.
Speers, G.C., Whitehead, E.V., 1969. Crude petroleum. In: Eglinton, G., Murphy, M.R.J.,
(eds) Organic geochemistry: Methods and Results. Springer Verlag.
Stegeman, J.J., Chevion, M., 1980. Sex differences in cytochrome P-450 and mixed-
function oxygenase activity in gonadally mature trout. Biochemical Pharacology 29(4),
553-558.
Syc, T.S., Szedlmayer, S.T., 2012. A comparison of size and age of red snapper (Lutjanus
campechanus) with the age of artificial reefs in the northern Gulf of Mexico. Fishery
Bulletin 110 (4), 458-469.
Szedlmayer, S.T., Conti, J., 1999. Nursery habitats, growth rates, and seasonality of age-0
red snapper, Lutjanus campechanus, in the northeast Gulf of Mexico. Fishery Bulletin 97,
626-635.

46
Szedlmayer, S.T., Mudrak, P.A., 2014. Influence of age-1 conspecifics, sediment type,
dissolved oxygen, and the Deepwater Horizon oil spill on recruitment of age-0 red
snapper in the northeast Gulf of Mexico during 2010 and 2011. North American Journal
of Fisheries Management 34(2), 443-452.
Teal, J.M., Howarth, R.W., 1984. Oil spill studies: A review of ecological effects.
Environmental Management 8(1), 27-43.
The Federal Interagency Solutions Group: Oil Budget Calculator Science and
Engineering Team, 2010. Oil budget calculator technical documentation. Available:
http://www.restorethegulf.gov/sites/default/files/documents/pdf/OilBudgetCalc_Full_HQ
-Print_111110.pdf. (February 2015).
Tobiszewski, M., Namieśnik, J., 2012. PAH diagnostic ratios for the identification of
pollution emission sources. Environmental Pollution 162, 110-119.
Toothacker, L.E., 1992. Multiple Comparison Procedures. SAGE Publications, Inc.
Topping, D.T., Szeldmayer, S.T., 2011. Home range and movement patterns of red
snapper (Lutjanus campechanus) on artificial reefs. Fisheries Research 112, 77-84.
47
Tronczyński, J., Munschy, C., Héas-Moisan, K., Guiot, N., Truquet, I., Olivier, N., Men,
S., Furaut, A., 2004. Contamination of the Bay of Biscay by polycyclic aromatic
hydrocarbons (PAHs) following the T/V "Erika" oil spill. Aquatic Living Resources 17,
243-259.
Tuvikene, A., 1995. Responses of fish to polycyclic aromatic-hydrocarbons (PAHS).
Annales Zoologici Fennici 32, 295-309.
Vandermeulen, J.H., Mossman, D., 1996. Sources of variability in seasonal hepatic
microsomal oxygenase activity in winter flounder (Pleuronectes americanus) from a coal
tar contaminated estuary. Canadian Journal of Fisheries and Aquatic Sciences 53, 1741-
1753.
Varanasi, U., Gmur, D.J., Reichert, W.L., 1981. Effect of environmental temperature on
naphthalene metabolism by juvenile starry flounder (Platichthys stellatus). Archives of
Environmental Contamination and Toxicology 10(2), 203-214.
Varanasi. U., Stein, J.E., Nishimoto, M., 1989. Biotransformation and disposition of
polycyclic aromatic hydrocarbons (PAH) in fish. In: Varanasi, U., (eds) Metabolism of
Polycyclic Aromatic Hydrocarbons in the Aquatic Environment. CRC Press.
48
Vodicnik, M.J., Lech, J.J., 1983. The effect of sex steroids and pregnenolone-16α-
carbonitrile on the hepatic microsomal monooxygenase system of rainbow trout (Salmo
gairdneri). Journal of Steroid Biochemistry 18(3), 323-328.
Wertheimer, A.C., Celewycz, A.G., 1996. Abundance and growth of juvenile Pink
Salmon in oiled and non-oiled locations of Western Prince William Sound after the
Exxon Valdez oil spill. American Fisheries Society Symposium 18, 518-532.
White, D.B., Palmer, S.M., 2004. Age, growth, and reproduction of the red snapper,
Lutjanus campechanus, from the Atlantic waters of the southeastern US. Bulletin of
Marine Science 75(3), 335-360.
Whitehead, A., Dubansky, B., Bodinier, C., Garcia, T.I., Miles, S., Pilley, C.,
Raghunathan, V., Roach, J.L., Walker, N., Walter, R.B., Rice, C.D., Galvez, F., 2012.
Genomic and physiological footprint of the Deepwater Horizon oil spill on resident
marsh fishes. Proceedings of the National Academy of Sciences of the United States of
America 109, 20298-20302.
Wolfe, D.A., Hameedi, M.J., Galt, J.A., Watabayashi, G., Short, J., Oclaire, C., Rice, S.,
Michel, J., Payne, J.R., Braddock, J., Hanna, S., Sale, D., 1994. The fate of the oil spilled
from the Exxon-Valdez. Environmental Science & Technology 28, A560-A568.

49
Woods, M.K., Fischer, A.J., Cowan Jr., J.H., Nieland, D.L., 2003. Size and age at
maturity of female red snapper Lutjanus campechanus in the northern Gulf of Mexico.
Proceedings of the Gulf and Caribbean Fisheries Institute 54, 526-537.
Zar, J.H., 2010. Biostatistical Analysis (5th ed.). Pearson.

50
Table 1. Summary of the selection methods for PAH analysis of red snapper, Lutjanus campechanus, for each sample type.
Type Method
Muscle
All samples analyzed from May 2010-September 2012.
Liver
All samples analyzed from May 2010. 20 samples randomly selected from both June and July 2010. All samples from 2011. 20 samples randomly selected from each month, May, June, and July from 2012-2014.
Gall Bladder
All samples were pooled by collection date and site, except those with insufficient sample.
Sediment
All sites except duplicates and those with insufficient sample.
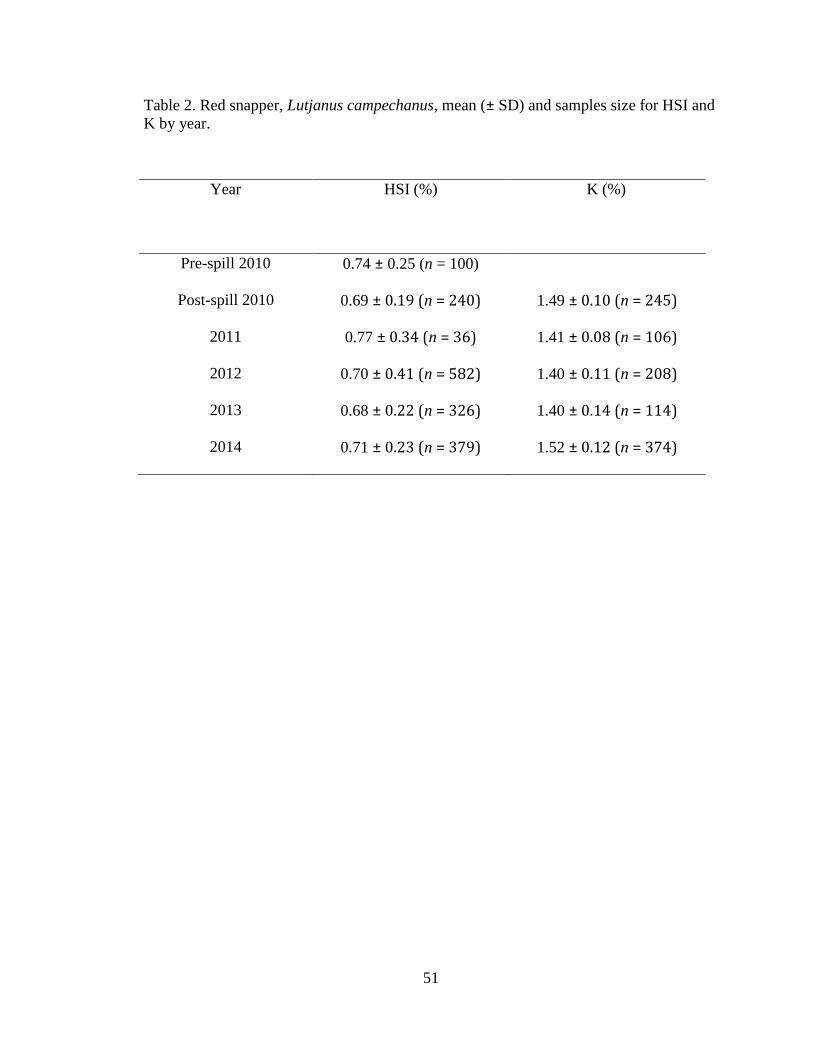
51
Table 2. Red snapper, Lutjanus campechanus, mean (± SD) and samples size for HSI and
K by year.
Year
HSI (%) K (%)
Pre-spill 2010
0.74 ± 0.25 (n = 100)
Post-spill 2010
0.69 ± 0.19 (n = 240) 1.49 ± 0.10 (n = 245)
2011
0.77 ± 0.34 (n = 36) 1.41 ± 0.08 (n = 106)
2012
0.70 ± 0.41 (n = 582) 1.40 ± 0.11 (n = 208)
2013
0.68 ± 0.22 (n = 326) 1.40 ± 0.14 (n = 114)
2014
0.71 ± 0.23 (n = 379) 1.52 ± 0.12 (n = 374)
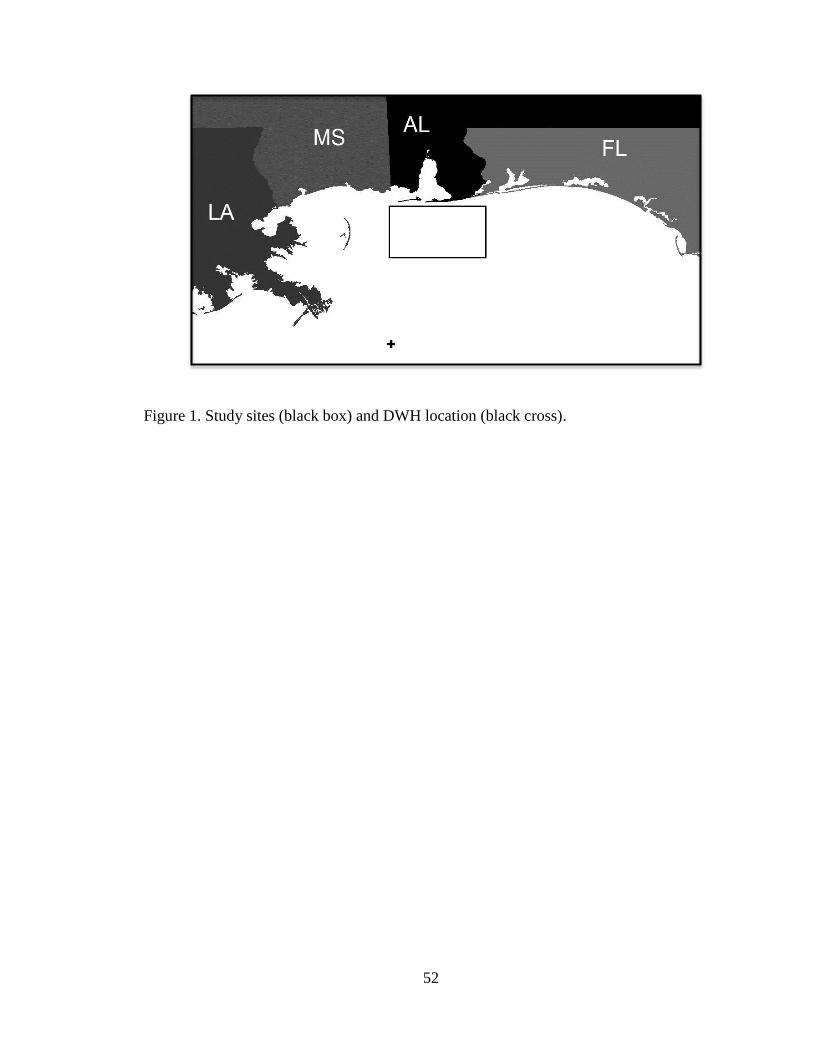
52
Figure 1. Study sites (black box) and DWH location (black cross).

53
Figure 2. Sample locations for red snapper, Lutjanus campechanus, tissue and sediment
PAH analyses following the DWH oil spill.

54
Figure 3. Red snapper, Lutjanus campechanus, mean (± SD) muscle tissue PAH
concentrations by year. Different letters indicate significant differences.
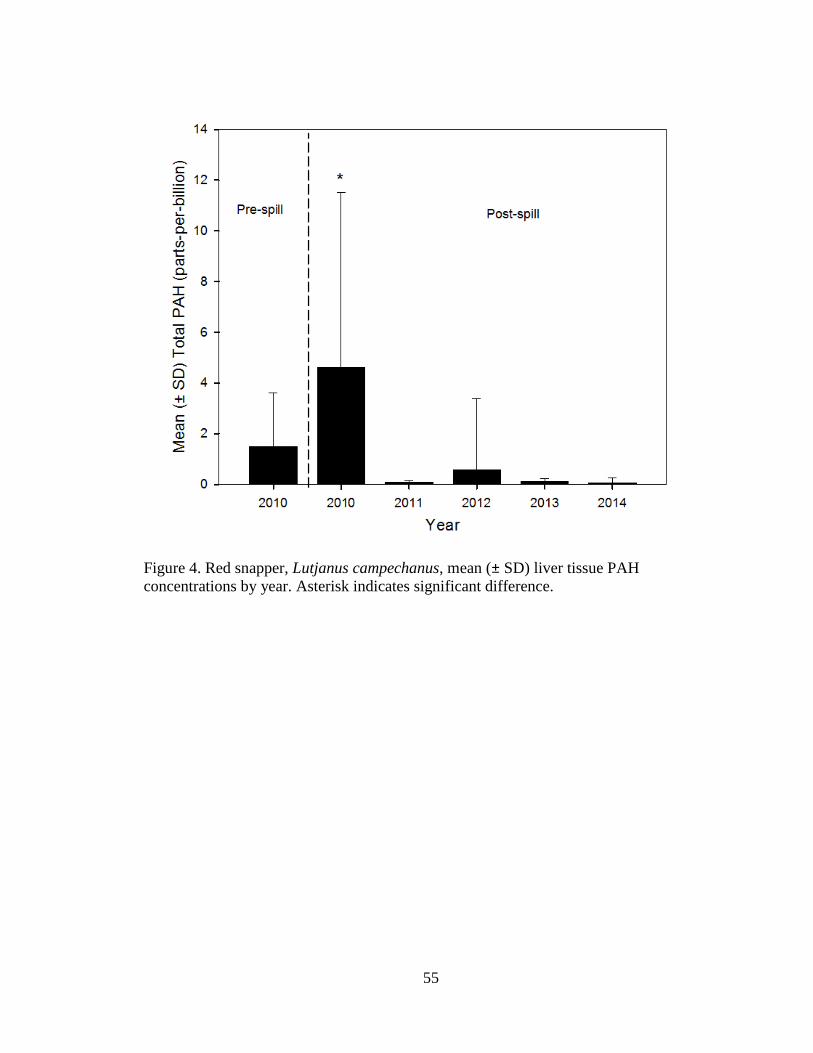
55
Figure 4. Red snapper, Lutjanus campechanus, mean (± SD) liver tissue PAH
concentrations by year. Asterisk indicates significant difference.

56
Figure 5. Red snapper, Lutjanus campechanus, mean (± SD) gall bladder tissue PAH
concentrations by year.
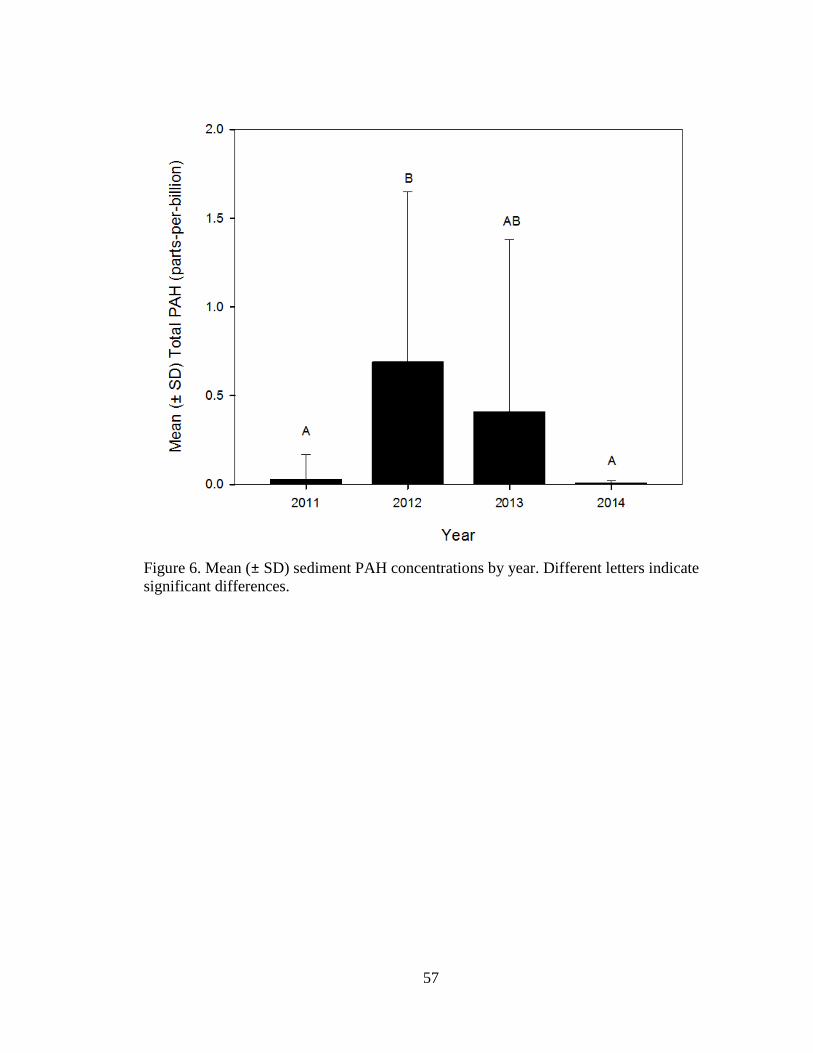
57
Figure 6. Mean (± SD) sediment PAH concentrations by year. Different letters indicate
significant differences.

58
Figure 7. Sediment PAH concentrations by site distance from DWH wellhead location.
(n = 103, 𝑅2 = 0.009, P = 0.33).

59
Figure 8. Red snapper, Lutjanus campechanus, mean (± SD) PHEN:ANTH ratios for
tissue (black bars) and sediment (gray bars) by year. Values > 8 ppb indicate petrogenic
sources.
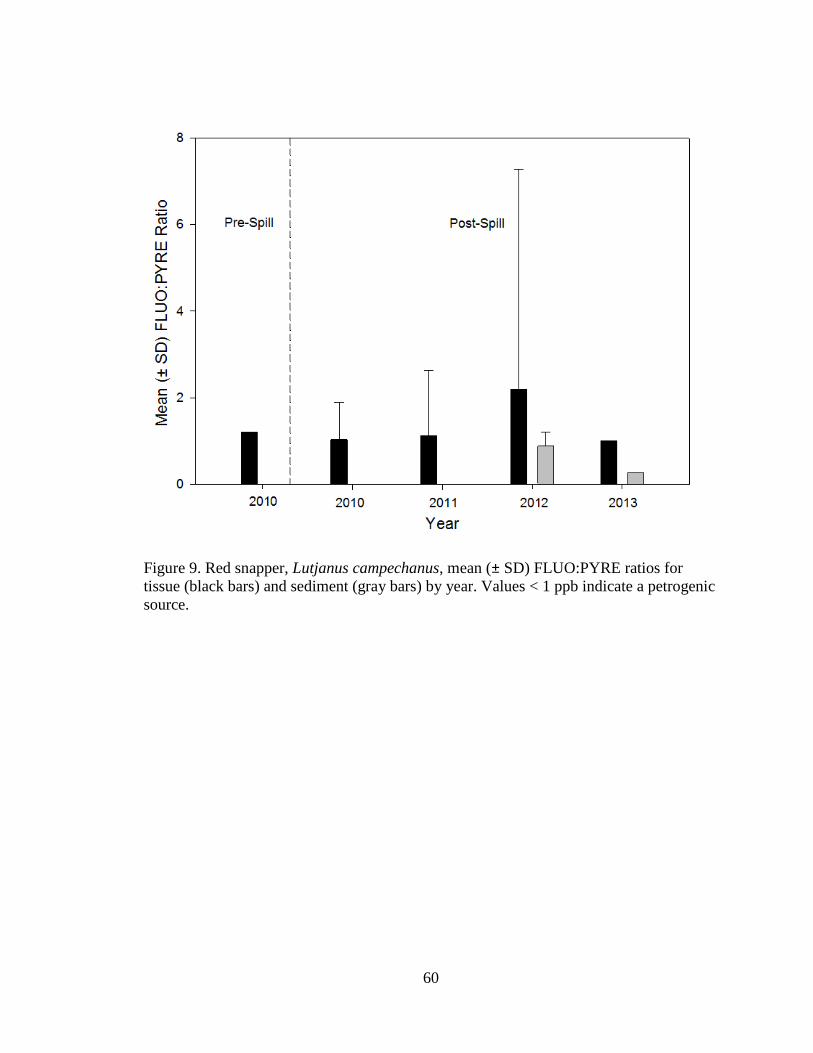
60
Figure 9. Red snapper, Lutjanus campechanus, mean (± SD) FLUO:PYRE ratios for
tissue (black bars) and sediment (gray bars) by year. Values < 1 ppb indicate a petrogenic
source.
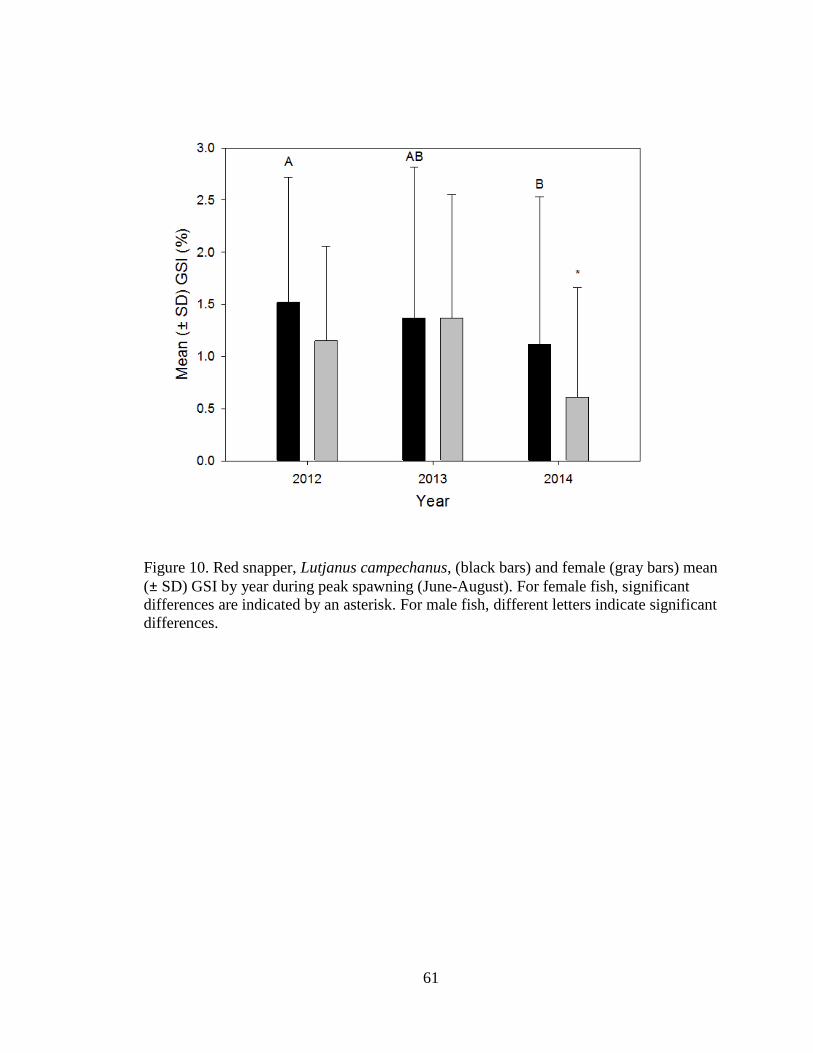
61
Figure 10. Red snapper, Lutjanus campechanus, (black bars) and female (gray bars) mean
(± SD) GSI by year during peak spawning (June-August). For female fish, significant
differences are indicated by an asterisk. For male fish, different letters indicate significant
differences.
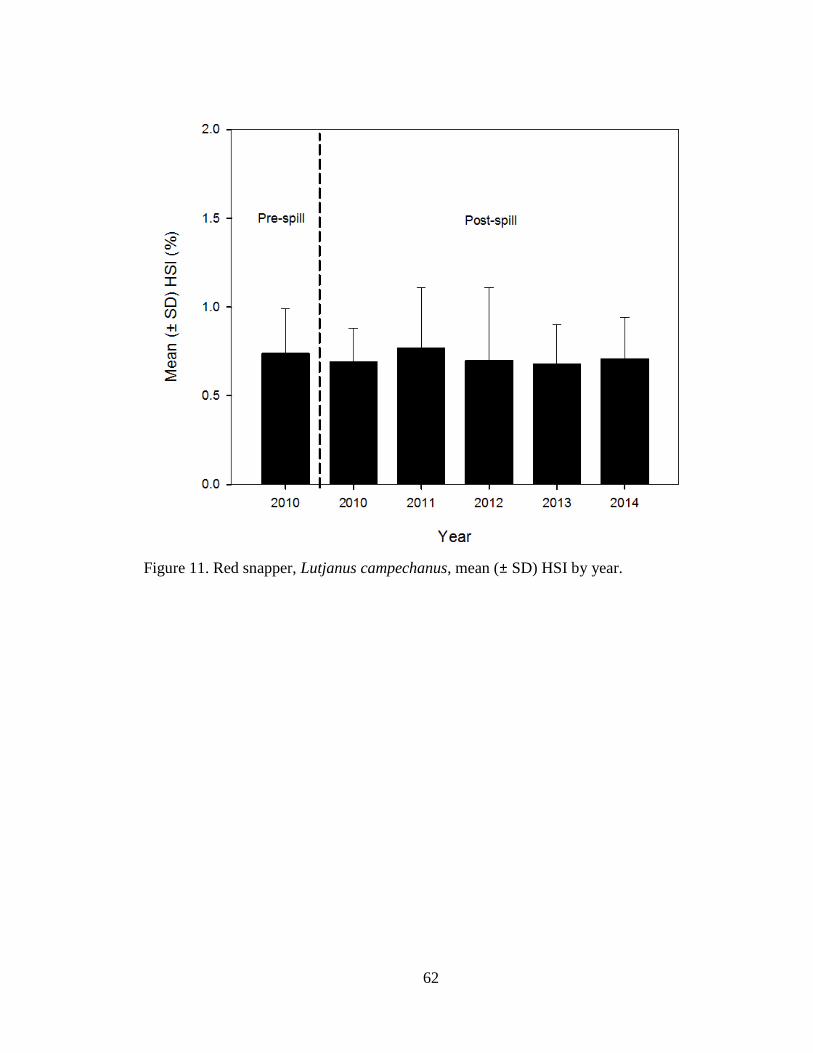
62
Figure 11. Red snapper, Lutjanus campechanus, mean (± SD) HSI by year.
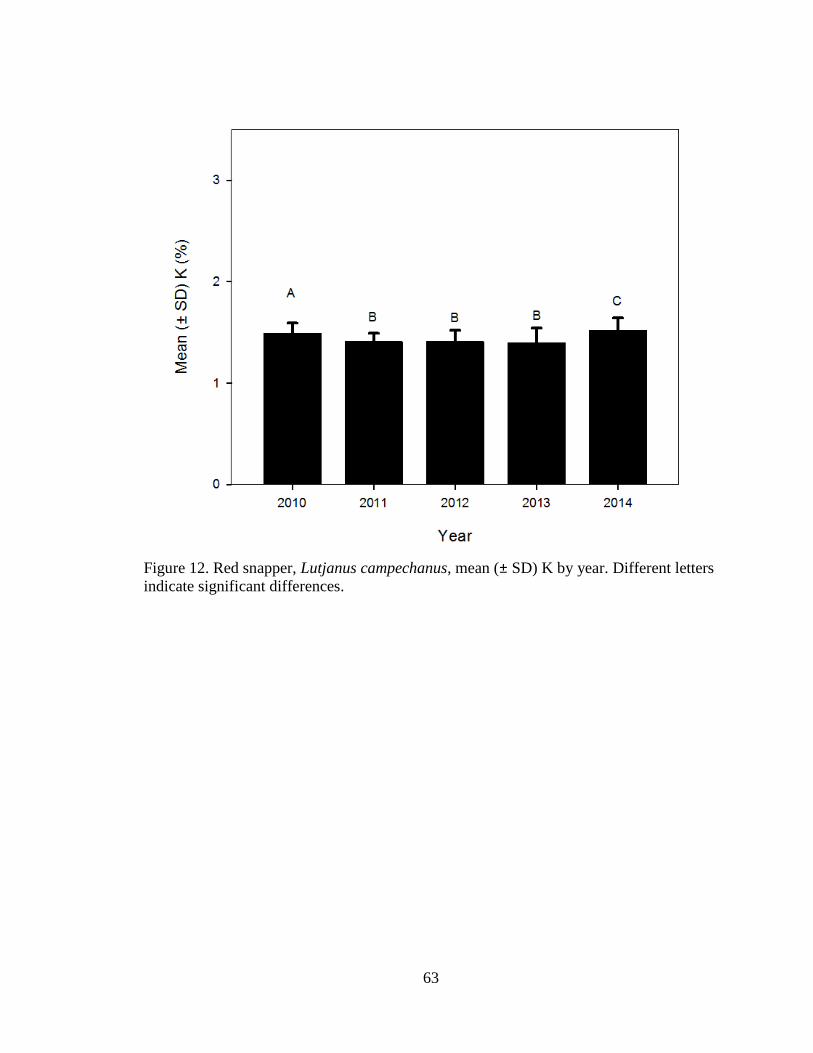
63
Figure 12. Red snapper, Lutjanus campechanus, mean (± SD) K by year. Different letters
indicate significant differences.


