

GRIPS Discussion Paper 14-09
Population Pressure, Rural-to-Rural Migration and Evolution of Land Tenure
Institutions: The Case of Uganda
Francis Mwesigye
Tomoya Matsumoto
Keijiro Otsuka
June 2014
National Graduate Institute for Policy Studies
7-22-1 Roppongi, Minato-ku,
Tokyo, Japan 106-8677

1
Population Pressure, Rural-to-Rural Migration and Evolution of Land Tenure
Institutions: The Case of Uganda
Francis Mwesigye*, Tomoya Matsumoto
†, Keijiro Otsuka
‡
National Graduate Institute for Policy Studies (GRIPS)
June 2014
Abstract
While customary land tenure systems are still prevalent in most African countries, they are
believed to be evolving to private land ownership. However, questions about how they are
evolving and what determines this evolution remain un-answered. This study contributes to
the literature by empirically analyzing the process of the evolution of land tenure systems in
Uganda using community-, household-, and parcel-level data. By tracing rural-to-rural
migration patterns, we found that immigrant-dominated and ethnically diverse communities
have a higher incidence of private land ownership. As an implication of the evolution of
land tenure system, we found that land markets are more active in immigrant communities,
which enhances efficiency in land allocation through land transactions. In fact, we found a
large and significant inverse relationship between farm size and productivity in
communities with communal land ownership, and an insignificant relationship in
communities with more privately owned land. These findings suggest that rural-to-rural
migration, through weakening traditional social systems, promotes the shift from communal
to individual land ownership which, in turn, boosts land transactions and efficient land use.
Keywords: migration, population1 density, institutions, evolution, land rights, agriculture
JEL Classification Codes: D23, J15, K11, N01, O12, O13, Q15, Q18
* Address: 7-22-1 Roppongi, Minato-ku, Tokyo106-8677, Japan; email: [email protected]
† Address :7-22-1 Roppongi, Minato-ku, Tokyo 106-8677, Japan ; email: [email protected]
‡ Address :7-22-1 Roppongi, Minato-ku, Tokyo 106-8677, Japan ; email: [email protected]
This work was supported in part by Global COE Program "The Transferability of East Asian Development
Strategies and State Building," MEXT, Japan and JSPS KAKENHI Grant Numbers 25101002.

1
1. Introduction
There is a large and growing body of literature on the role of private land rights and
land tenure security in stimulating agricultural development and hence improving the
wellbeing of landholders in developing countries (Feder & Feeny, 1991; Besley, 1995;
Otsuka & Place, 2001; Goldstein & Udry, 2008; Fenske, 2011; Bellemare, 2013). It is
believed that private land ownership and tenure security facilitate transactions in land rental
and sales markets by reducing transaction costs, stimulate land investment by securing
investment returns, and improve credit access as land can be used as collateral (Brasselle,
Gaspart, & Platteau, 2002; Otsuka & Place, 2013; Holden & Otsuka, 2014). However,
customary land tenure systems, characterized by communal or collective land ownership as
opposed to private land ownership, are still prevalent in Africa (Migot-Adholla, et al.,
1991; Otsuka & Place, 2001; Goldstein & Udry, 2008; Fenske, 2011). There is, thus, a
concern that the current communal land institutions discourage efficient land use,
investment in land and productivity growth.
The existing studies argue that land tenure institutions endogenously evolve towards
individual land ownership in response to population pressure and economic dynamics. For
instance, the theory of induced institutional innovation contends that population pressure,
through altering relative factor scarcities, promotes institutional changes toward secure
private property rights institutions (Hayami & Ruttan, 1985; Lin, 1989; Feder and Feeny,
1991). These studies are in line with Boserupian theory of agriculture intensification which
argues that population growth leads to the adoption of labor-intensive farming systems to
enhance land productivity (Boserup, 1965). Since the adoption of new farming systems

2
requires land investments such as terracing, irrigation and tree planting, secure land rights
must be established. Thus, the evolution theory of land rights (ETLR) stipulates that
population pressure in Africa leads to evolution of land rights towards secure individualized
land ownership (Ault & Rutman, 1979; Atwood, 1990; Place & Hazell, 1993; Platteau,
1996, Otsuka & Place, 2001).
However, our empirical knowledge about the process of evolution of land
institutions in Africa is exceedingly scant. Descriptive studies suggest that the incidence of
individual land ownership is high in communities with many immigrants in sub-Saharan
Africa (Migot-Adholla et al., 1991). This may be relevant in Africa because migration
across rural communities appears to have increased recently following the rapid population
explosion.4
Since migration leads to changes in the population density and ethnic
composition in host communities, it may affect the costs and benefits of maintaining
traditional communal land ownership systems or establishing private land ownership
systems and hence cause a change in land tenure arrangements.
Customary land in Africa is administered based on traditional land arrangements
that discourage the functioning of land rental and sales markets, while focusing on
preserving cultural identity. Indeed, many studies in Africa have observed that indigenous
inhabitants oppose to sales of land to “strangers” for fear that clan lands will go to hands of
immigrants (Plateau, 1996; Fred-Mensah, 1999; Donge & Pherani, 1999). These traditional
practices and attachments to land are strongly established in traditional communities where
4 Due to initial un-equal distribution of land across communities, rural-rural migration increased following
population explosion in recent decades. The population growth in the region is 2.53% higher than the world
average of 2.1%.

3
inhabitants share the same ethnic identity, cultural norms, and practices. Through migration
process, however, these traditional institutions may be weakened in host communities. We
hypothesize that since migration and ethnic diversity weaken traditional customary
institutions, land tenure systems have evolved from communal to private ownership in
immigrant communities. We also hypothesize that high population density increases land
scarcity, hence, raises social cost of communally owning land, and, consequently, induces
the demand for private land rights. Lastly, we postulate that migrations and population
density stimulates land rental and sales markets that in turn enhances production efficiency.
This study explores the evolution of land tenure systems with a particular focus on
rural-to-rural migration, ethnic diversity and population density. First of all, we explore if
there is a higher incidence of private land ownership in ethnically diverse communities with
many immigrants than homogenous communities with fewer immigrants. Second, we
examine whether households in densely populated communities are more likely to own land
privately than those in sparsely populated communities. Third, we inquire what the
implication of changes in land tenure arrangements is on land transactions and agriculture
performance.
The reminder of the paper is organized as follows. Section 2 provides an overview
of the land tenure institutions in Uganda. Section 3 discusses the data and the descriptive
statistics. Section 4 presents a conceptual framework on how rural-rural migration
influences changes in land ownership status and presents hypotheses. Section 5 outlines our

4
empirical strategy. Econometric results are presented and discussed in section 6 and section
7 concludes.
2. Land in Ugandan Context
2.1. Agriculture, land tenure systems and migration in rural Uganda
As in other countries in sub-Saharan Africa (SSA), agricultural land is an essential
pillar of human development and economic growth in Uganda since agriculture is the
‘backbone’ of the economy. Agriculture employs 73% of the working population and
contributes to 24% of gross domestic product in Uganda (Ministry of Agriculture, 2010).
However, communal land ownership and tenure insecurity amidst dwindling agriculture
performance have raised concern over rising food insecurity and increasing poverty
incidence.5 Given an increasingly land scarcity due to the country’s high population
growth rate, current traditional farming system needs to be transformed to more intensive
system.6 We hypothesize that individual land ownership and tenure security would be the
key driver for the institutional transformation as they are expected to give higher incentives
to invest in land improvement and to facilitate more efficient land allocation through land
transactions in the rental and sales markets.
Land is owned by the citizens in Uganda who can choose how to manage their land
either individually or communally in accordance with customary norms and practices. This
is unlike some other SSA countries where land is owned by the government and individuals
5 The yield of major cereals in Uganda have been declining since the early 1990s thereby raising threats of
food insecurity (Pender et al., 2004) 6 The annual population growth rate is 3.2 percent in 2012, which is the second highest in the world (World
Bank, 2012).
5
are only granted use rights. 7
There are four legally recognized land tenure systems in
Uganda; freehold, leasehold, customary and Mailo.8 Customary system is the dominant
land tenure arrangement under which individuals’ use of land is subject to regulations and
sanctions determined by the community, clan or family specific norms and practices. Prior
to the Buganda agreement of 1900, customary land tenure arrangement was the only land
tenure arrangement in Uganda and it involved communal land ownership where the village
chief or king’s agents were in charge of allocating and administering land use among
community members. Land use norms and practices varied by ethnicity and society but one
common characteristic was that land was owned communally (West, 1965; Lastarria
Cornhiel, 2003). Community members in customary land areas were regarded as tenants at
sufferance who only had use rights and land access was by descent clan membership,
holding political position or both (West, 1965).
Corresponding to high population growth and increasing land scarcity, residents
started out-migration from regions and communities with high population density. Land
transactions, as a new mode of land acquisition, increased as emigrants wanted to sell off
their occupied land before migrating and to purchase land from large land-owners in
7 The land reform of 1975 in Uganda had put land in hands of government as stipulated by 1975 land decree
where people would only acquire use rights through land leases. This directive was however never
implemented as the country was in turmoil with successive wars. The 1995 constitution reversed the
stipulations of land decree and put land in hands of the citizens again. 8 Mailo tenure arrangement was introduced by colonialists. Under 1900 Buganda agreement, 19,600 square
miles of land was divided into mile blocks (hence Mailo) and given to chiefs and other officials with their
titles in Buganda kingdom (West, 1965; Rugadya, 1999). Former peasants who were cultivating the land
never got a share and instead became tenants, obliged to pay rent to title holders. We drop parcels under this
externally imposed tenure regime in our analysis since this tenure arrangement is not flexible and has not
evolved over time.
6
destination areas. Indeed, Baland et al. (2007) provide evidence that land transactions have
been increasing in Uganda. Moreover, customary tenure has been evolving towards private
land ownership where individuals can transfer and decide on land use practices without
seeking consent from clan heads. Currently, customary tenure can be categorized into
communal and individual customary tenure (Busingye, 2002). Private customary
arrangement is more efficiency-oriented than communal ownership because it facilitates
land investment, land transactions and, where financial institutions, such as micro-finance
institutions and Saving and Credit Co-operatives (SACCO), allow untitled land as collateral,
use of land for credit access. Communal tenure system is concentrated in northern and far
eastern Uganda, while private customary is more common in near eastern and western
regions of Uganda. The persistence of communal customary land arrangements in the north
can be explained by high level of insecurity due to internal wars in the region. While
resettlement programs are on-going, large chunks of communal lands are still un-occupied.
Other existing tenure systems, though on a very small scale, are leasehold and
freehold. Leasehold grants leasehold title and full ownership rights such as use rights,
transfer rights and the right to bequeath over the tenure of the lease; usually 49 and 99 years.
Land is held in perpetuity and the owner is issued with a title under freehold tenure. A very
small proportion of land in Uganda belongs to either freehold or leasehold, so this study
does not pay attention to these land tenure systems.

7
3. Data and Descriptive Evidence
3.1. Data
We use community-, household-, and parcel-level data collected as part of the
Research on Poverty, Environment, and Agricultural Technology (RePEAT) panel studies
from rural Uganda, and the latest round of RePEAT survey was conducted in 2012/2013.9
The RePEAT survey covers 29 districts and 94 Local Council ones (LC1s), which are the
smallest administrative units in Uganda.10
From each LC1, 10 households were selected to
make a total of 940 sample households (Yamano et al., 2004). The RePEAT surveys were
jointly conducted by Makerere University, the Foundation for Advanced Studies on
International Development (FASID), and the National Graduate Institute for Policy Studies
(GRIPS) in 2003, 2005, 2009, and by Makerere University and GRIPS in 2012/2013.
In the RePEAT survey, community-level interviews were conducted along with the
household surveys. In the household surveys, information was solicited on basic household
composition and demographics, ethnicity, wealth, and economic activities. Parcel-level
information was also collected on land tenure systems, acquisition mode, land use, and
inputs and outputs of crop production for the two seasons (e.g., the second cropping season
in 2011 and the first cropping season in 2012). The community survey elicited information
on the migration history of the community inhabitants for two generations (current and the
9 The sample for the RePEAT survey builds upon and complements a completed research project on policies
for improved land management in Uganda, conducted by the International Food Policy Research Institute
(IFPRI) and Makerere University from 1999 to 2001 (Pender et al., 2004). The latter involved a survey of 107
Local Council ones (LC1s), selected from two-thirds of the regions in Uganda, including the more densely
populated areas and areas that were free from wars in the southwest, central, east, and parts of northern
Uganda and representing seven of the nine major farming systems of the country. Because of insecurity in the
north and northeastern parts of the country, LC1s in this region were excluded from the surveyed samples. 10
We use “LC1”, “village”, or “community” interchangeably.

8
parents’ generation), the number of tribes in the community and the quality of roads to
district headquarters as a measure of market access.
3.2. Community Categorization
For the exposition, we classify our study communities into “receiving” and “sending”
communities based on the community survey where we solicited information on the
proportion of households that immigrated. This was done for both current generation and
parents’ generation. Particularly, we asked the following questions: (i) out of the total
households in this village (current generation), how many were not born here (or
immigrated)?; (ii) out of those who were born in the village, how many of their parents
(second generation) were not born in this village? A community is defined as “receiving” if
at least 30% of the households from both generations immigrated, and it is defined as
“sending” if there were emigrations but less than 30% immigrant households for both
current and parents’ generations. We considered two generations because migration
induced by land scarcity is a recent phenomenon in Uganda: at least from our focus group
interviews and available historical studies, noticeable within-country migrations started in
late 1946 in the form of kingdom resettlement arrangements (Ngologoza, 1998). We set the
threshold at 30% because immigrations from neighboring villages sometimes happen and
these can set the number of immigrant households above zero, yet such migrations do not
affect land tenure arrangements as customary land arrangements cut across neighboring

9
communities11
. Also, if immigrants are very few, they remain the minority and thus do not
influence the functioning of village-specific land arrangements, even if those immigrants
are of a different ethnicity.
3.3. Descriptive statistics
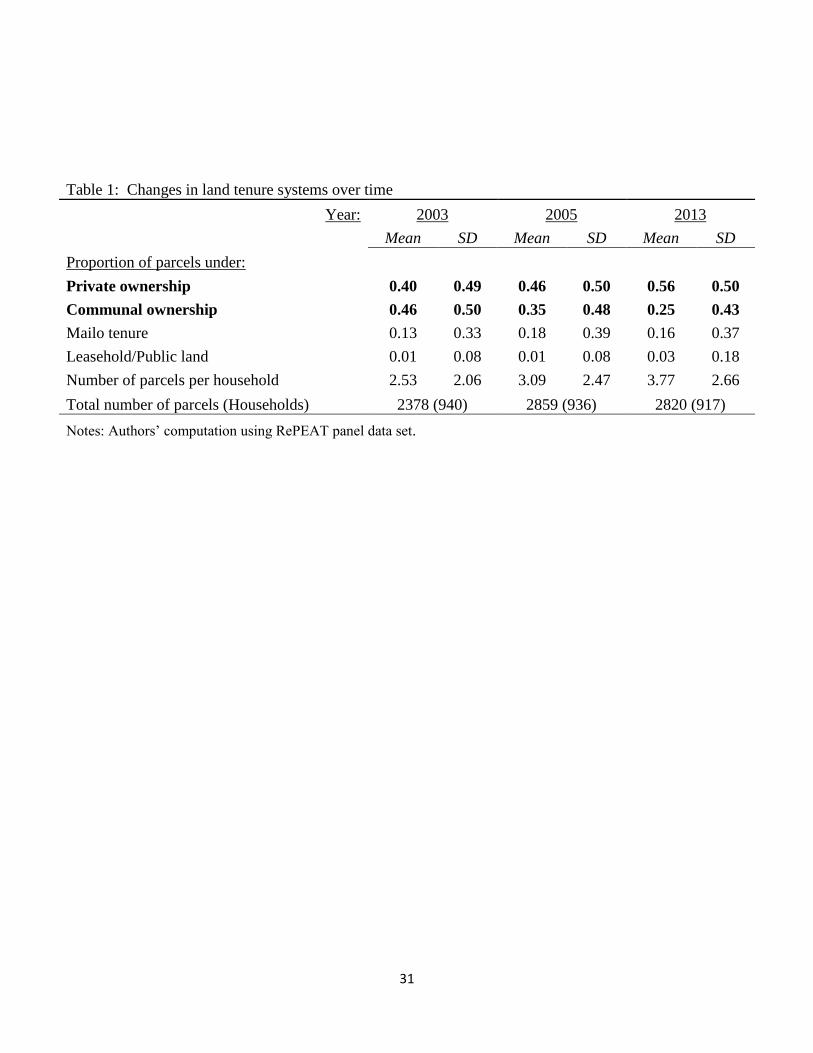
Table 1 presents the distribution of land tenure systems in Uganda from 2003 to
2012 using the RePEAT data set. The proportion of land under private ownership increased
from 40% in 2003 to 46% in 2005 and further to 56% in 2012. Conversely, land under
communal ownership declined from 46% to 35% and to 25% during the same periods.
There are no systematic changes in other tenure regimes over the same period. However,
the number of parcels operated by the household increased from 2.5 to 3.8 between 2003
and 2012, which suggests that land scarcity induces land fragmentation.
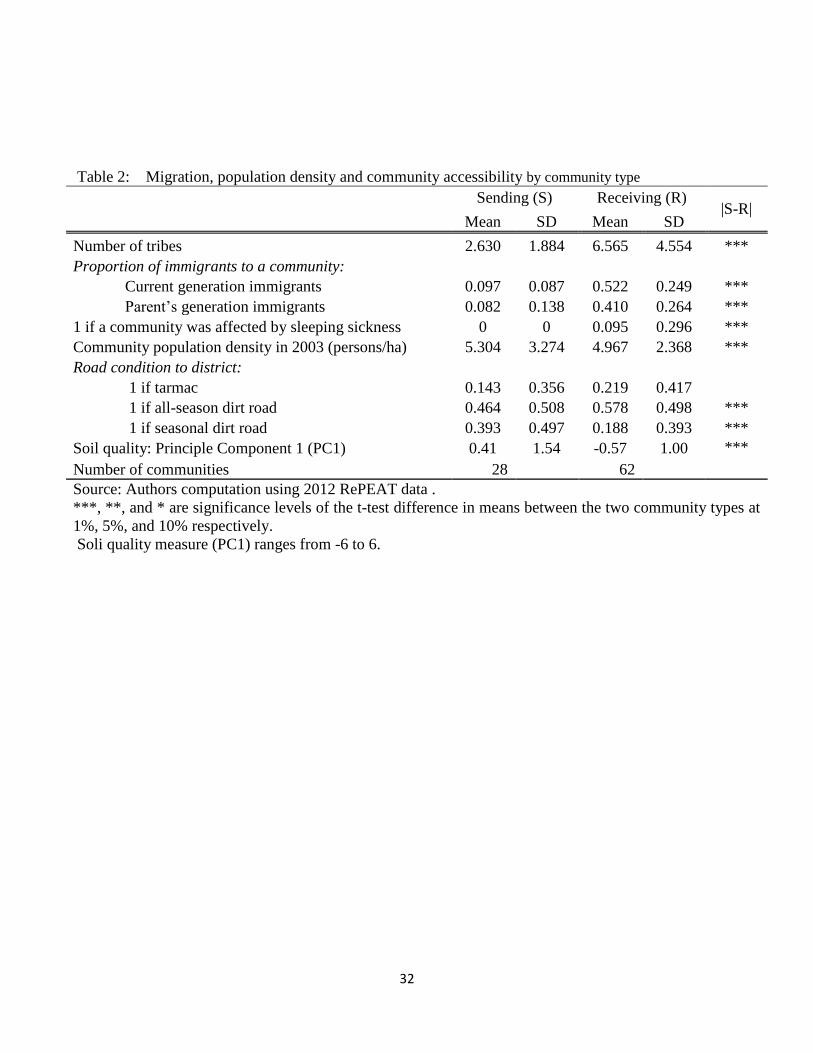
Table 2 presents community characteristics using the RePEAT data sets. There are
higher proportions of both current and parents’ generation immigrant households in
receiving than in sending communities. In receiving communities, 52% of the current-
generation and 41% of the parents’-generation households immigrated. In the sending
communities, the proportion of current and parents’-generation households that immigrated
is 10% and 8%, respectively. The population density is higher in sending communities (5.3
persons per hectare) than in receiving communities (4.6 persons per hectare). This suggests
that land is scarcer in sending than in receiving communities.
11
A community in our study is a village that comprises the smallest unit of administration in Uganda. Some
clans can occupy more than one village and, in many cases, land arrangements can cover many villages to a
level of a parish, the second level of administration from a village.

10
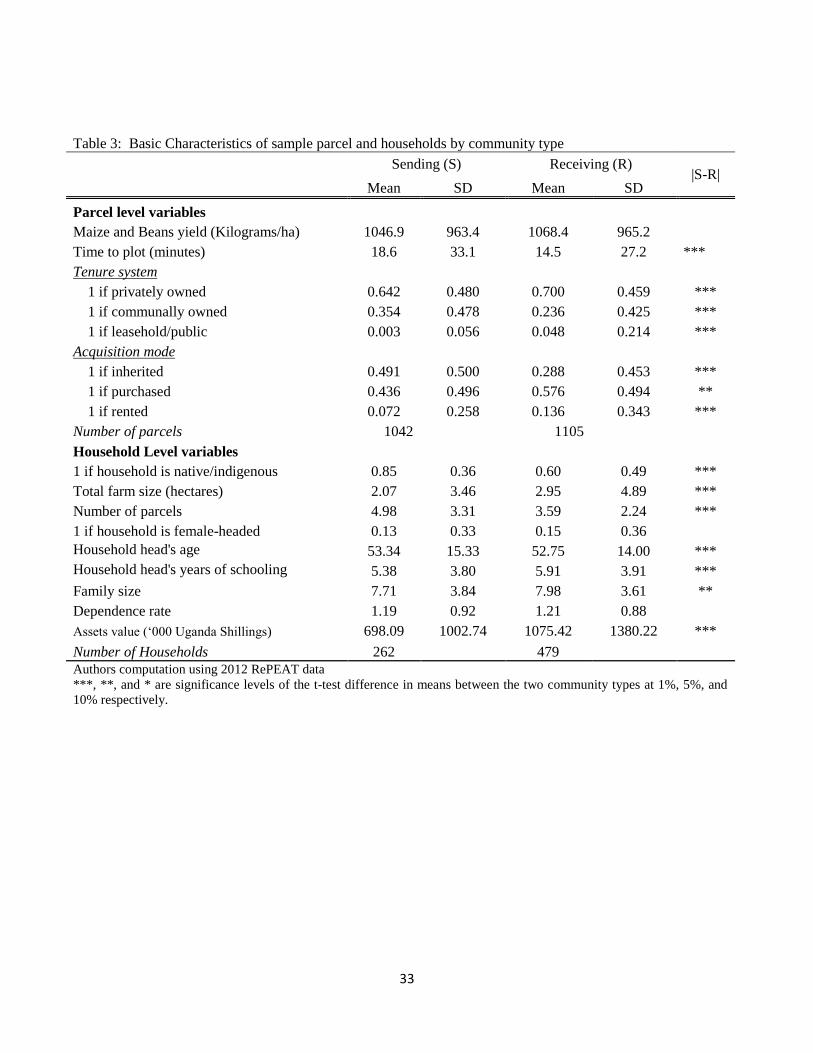
In Table 3, we present basic characteristics of sample parcels and households. The
yield is almost the same between sending and receiving communities. The distance to the
parcels is longer in sending (19 minutes) than in receiving communities (15 minutes). This
is presumably because land scarcity makes households operate on plots far from the
homestead in sending communities. Indeed, the land size is smaller (2 ha) and the number
of operated parcels larger (4.9 parcels/household) in sending communities than in receiving
communities (3 ha and 3.3 parcels/household, respectively). The proportion of privately-
owned land is higher in receiving communities, while that under communal ownership is
higher in sending communities. In receiving communities, 70% of the parcels are privately
owned and 23% are communally owned. On the other hand, in sending communities, the
proportion of privately owned land is lower and that of communally owned land is higher
than in receiving communities. The main mode of land acquisition in sending communities
is inheritance, while it is purchasing in receiving communities. Land renting in receiving
community is twice as common as in sending community. At the household level, 85% of
households in sending communities are indigenous or native which is significantly higher
than 60% in receiving communities.
4. Conceptual framework
In this section we present a conceptual framework which will shape our hypotheses.
We describe how land tenure arrangements evolve in response to high population density
and rural-to-rural migration.

11
4.1. Population density, migration, and the evolution of land institutions
In this framework we examine how increasing population density and rural-to-rural
migration lead to the changes in customary land institutions from communal towards
private land ownership. While the existing studies have theorized that population growth
induces changes in land tenure arrangements (Hayami & Ruttan, 1985), the role of internal
migration is ignored. These factors, population growth and internal migration, are closely
linked, because population pressure leads to land scarcity and consequently causes out-
migration to areas with low population density and available land, especially if population
was un-equally distributed across communities. However, migration can also be influenced
by other factors such as natural disasters, conflicts and government resettlement programs.
In customary land tenure arrangements, the powers to administer and allocate land,
and resolve conflicts are vested in the hands of the community heads; in African setting
these are Kings, chiefs and elders. Individuals have use rights, and the main mode of land
acquisition is through inheritance and allocation among family members which is
conditional on being a member of the community by descent (West 1965). At the initial
stages of the evolution, communities are homogenous in terms of ethnic composition and
are closely knit. Moreover, land is abundant, and the expansion of crop land is through
clearing forests and other uncultivated land. These characteristics are well documented for
most agrarian societies by Boserup (1965). As population increases land gets scarce and
land value appreciates. The social cost resulting from the communal land tenure system
which does not allow for market transactions increases with increasing land scarcity. Also,

12
when there is no more unutilized land, the need to adopt land-saving technologies and to
increase agriculture investment renders communal land ownership inappropriate. People
would respond to such situation by demanding for individualized land rights so as to be
able to secure investment returns accrued to new farming systems.
The cost of maintaining communal land ownership is higher when communities are
ethnically diverse because it is complex to harmonize different tribes’ institutional
arrangements in a communal setting. Rural-to-rural migration, in addition to increasing
population density in the host communities, leads to the mixing of tribes, clans and families
from various backgrounds. This diversity in host communities weakens or sometimes leads
to the breakdown of pre-existing informal land arrangements. In addition, inter-community
migration increases land transactions since immigrants have to purchase or rent in land
from the land owners. It is, therefore, likely that land tenure arrangements in host
communities are likely to evolve towards land ownership faster than those in non-migrant
communities.
4.2. Testable hypotheses
We postulate the following main hypotheses based on the conceptual framework;
Hypothesis 1: Ethnically diverse communities with a higher proportion of immigrants have
a higher incidence of privately-owned land than those homogenous communities with
fewer in-migrants.
13
Hypothesis 2: At the household level, parcels operated by immigrants have a higher
likelihood of being privately owned than similar parcels operated by native or indigenous
households.
Hypothesis 3: There are more privately-owned parcels in densely-populated communities
than in their sparsely-populated counterparts.
Private land ownership is expected to activate land transactions through reducing
transaction costs. Land transactions in turn equalize factor proportions among farming
households which promotes efficiency in land use and production. In addition, when land
markets are functioning, the land-poor households acquire land from the land-abundant
households through purchase or renting, which promotes equity (Baland et al., 2007;
Songqing & Jayne, 2013). Therefore, we expect to observe no relationship between farm
size and productivity among households with privately-owned land. On the other hand, we
may observe the inverse relationship between farm size and productivity among households
with communally-owned land, because of the more intensive use of land by smaller land
holders.12
Hypothesis 4: We expect to observe the inverse relationship between farm size and
productivity in communities where communal land ownership prevails but not so in
communities where private land ownership dominates.
12
According to Larson et al. (2014), the inverse relationship between farm size and land productivity has
emerged in sub-Saharan Africa.

14
5. Empirical strategy
Our empirical analysis consists of two parts. First, we examine how migration,
ethnic diversity, and population density affect the incidence of private land ownership.
Specifically, we look at how the incidence of private land ownership changes as the
proportion of immigrants and the number of tribes in a community, and the communal
population density increase. We also use a dummy variable of whether a household is
native or in-migrated in the analysis to identify who among the immigrants and indigenous
households are likely to privately own land. Due to potential endogeneity concerns with
migration variables, we instrument migrations with sleeping sickness occurrence. We
discuss in the following sub-section why we think it is a plausible instrument.
In the second part, we examine the determinants of different land acquisition modes,
in particular land inheritance, purchases and renting with the expectation that land markets
are better functioning in communities with many immigrants and densely populated
communities. Applying community- and season-fixed effect models, we conclude the
second part by analyzing the farm size-productivity relationship. As the hypothesis 4
suggests, we expect to find a significant inverse relationship between farm size and
productivity in sending communities and those communities with communal land
ownership, but a smaller or insignificant relationship in host communities and those
communities with a higher incidence of private land ownership.

15
5.1. Rural-to-rural migration, population density and private land ownership
We consider an empirical specification that identifies the determinants of private
ownership of the parcels to which our sample farm households have access. Denote parcel
by p, household by i, and village by j. The community in our analysis is the village (LC1)
which is the smallest administration unit in Uganda. Let be a dummy variable that takes
1 if parcel p is individually or privately owned by household i and 0 if it is collectively
owned by the clan, or village or extended family. We define private ownership from the
household responses regarding various forms of land use and transfer rights over the
operated parcels. The parcel is privately owned if the household can sell it, give it away or
rent it out without consulting any one. It is communally owned if the household must seek
clan, village or extended family consent before selling, giving away or renting out the
accessed parcel.13
Formally, we estimate a linear probability equation of the form:
where represents the proportion of immigrants and is the number of tribes in
community j; is a dummy variable that takes 1 if the parcel owner is a native
inhabitant in the community and 0 if he or his descendants immigrated14
; is the
13 For this analysis, we drop rented and borrowed parcels from the data set since by contractual arrangement
the person renting or borrowing a parcel cannot transfer it. In other words, we analyze land rights status only
for collectively or individually owned parcels. 14
In the survey, we captured the ethnicity of the households surveyed. We use this information to construct
the indicator variable of whether the household is indigenous or immigrant. Historically, in Uganda specific
kingdoms and small chiefdoms occupied different areas and regions. To date, regions are referred to by the
kingdom they fall in or the original tribe occupying them. For instance Central region is referred to as
Buganda because it is under the Buganda kingdom and was historically occupied by the Baganda tribe;
western is sub-divided into Bunyoro for Banyoro tribe, Ankole for Banyankole tribe, Kigezi for Bakiga,
among others; while near eastern is Busoga for Basoga plus many other regions.

16
population density in the community; is a vector of parcel controls such as whether
the parcel is on public land or under leasehold arrangement; is a vector of household
characteristics, including head age, square of head age, gender of the household head,
head’s years of schooling, squared years of schooling, family size, and the value of
household assets (per 1000 Uganda shillings); and is a vector of other village controls,
e.g., whether the road to the district capital is tarmac, all-season dirt, or season dirt road
which are expected to capture the impact of accessibility/remoteness on land tenure
arrangements. Improved access to markets has a potential to change land tenure
arrangements from communal to individual land ownership, as it increases the value of land.
In terms of quality, tarmac road is best, followed by all-season dirt road and season dirt
road. As a community variable we also include the average of the principle component one
(PC1) collected from each sample household to capture the effect of soil quality on private
land rights. It is possible that people may demand for private land rights to protect their
fertile parcels. is the idiosyncratic error term.
The estimate from equation (1) tells us about the relationship between the
proportion of migrants in a community and private land ownership but may not offer us
sufficient evidence to claim causality. This is because there might be other competing
hypotheses: for example, better defined individual land rights may attract migrants to host
communities, or host communities may have other attributes that attract immigrants and
influence the demand for private land rights. On the other hand, the coefficient on
( ) may better capture the causal relationship from migration to land ownership status than

17
the migration coefficient. If we can find that, in the same community, parcels owned by
immigrants are more often under private ownership while those accessed by indigenous
households are collectively owned, it could be that rural-to-rural migration influences
changes in land tenure arrangements. However, there still remains a concern that the
impact of migration is underestimated, because native households in host communities may
learn the importance of privately owning land from immigrants which will promote private
land ownership in migrant communities.
To address the endogeneity concerns, we exploit a natural experiment that occurred
in eastern Uganda, in the then Iganga district which was later subdivided into Mayuge,
Bugiri, Namayingo, Namutumba, and Luuka districts.15
In 1898, there was an outbreak of
sleeping sickness in Iganga district, in Bunya County (currently Mayuge district), killing
most of the inhabitants and displacing a few remnants (Picozzi, et al., 2005). From the
focus group discussions, it was reported that the first phase of the sickness ended in 1910
but the epidemic later resurfaced in the 1940s killing those people that had returned to their
original lands. By 1956, the whole of southern Busoga (mainly Bunya) and some
neighboring areas had been greatly affected. It is now more than 50 years since the
epidemic was eradicated, and the affected, and the then vacant, communities have been
settled by immigrants from many regions of Uganda. Currently the affected areas are fully
occupied to the extent that land scarcity is one of the major concerns.
15
In Uganda, until the population exploded in certain areas and rural-rural migration ensued, regions were
homogenous. Iganga district is in Busoga region and was originally occupied by the Basoga. Most parts of the
region are now ethnically diverse though with varying levels depending on the proportion of immigrants.
Therefore, if we find a Muganda in Ankole it means either he or his ancestors immigrated to that area.

18
We use sleeping sickness occurrence as an instrument for the proportion of
immigrants (PM) in equation (1) above. The key assumption underlying our empirical
approach is that sleeping sickness across communities was exogenous to the land tenure
arrangements. In other words, sleeping sickness occurrence and private land ownership are
linked through migration. We expect to find that communities affected by sleeping sickness
attracted many immigrants, which, in turn, led to the emergence of land tenure
arrangements that favor private land ownership.
5.2. Rural-to-rural migration, population density and land acquisition
As discussed in Section 4.2, we hypothesize that land rental and sales markets are
more active in the immigrant communities and the densely populated areas where private
ownership is more common. To test this hypothesis, we use the information on acquisition
modes of parcels to which farmers currently have access, and examine their relationship
with the migration patterns and population density of the communities. There are three
modes of land acquisition: land inheritance, renting, and purchase. We expect that land
renting and purchase would be observed more often as the acquisition mode than
inheritance in immigrant communities.
We adopt an unordered multinomial logit in the analysis of land acquisition. Let A
denote a categorical variable representing different parcel acquisition modes taking a value,
0, 1 or 2 corresponding to inheritance, purchase, or renting, respectively. Let X denote a set
of conditioning variables including the proportion of immigrants in the community,
population density and other household and community controls. The probability that A
takes m {0,1,2} can be written as;

19
|
[ ∑ ]
The coefficients are estimated by the maximum likelihood method.16
The heteroscedasticity
robust standard errors are used.
5.3. Farm size-productivity relationship by community type
As hypothesized, we expect the private land rights to enhance efficient land
allocation and investment. Land transactions and land investment should be higher in
communities with a high incidence of private land ownership. In this sub-section we test
the differences in production efficiency between communities with a high incidence of
private land ownership and those with a higher incidence of communal land ownership by
comparing the farm size-productivity relationship. We expect to find a more significant
inverse relationship in sending than in receiving communities. We run the same
regressions separately for different community types depending on whether the community
is receiving or sending, and whether all the household land is privately or communally
owned.
To test for the farm size-productivity relationship, we look at maize and bean yields,
the widely grown cereals in Uganda. We run the community fixed effects regression using
a two-season (the second cropping season in 2011 and the first cropping season in 2012)
16
Since the probabilities must sum to unity, P(A=0|X) is calculated as
|
[ ∑ ]
after and are estimated.

20
semi-panel data set. Letting be the yield from parcel p, belonging to household i in
season s and community j, we run the following regression:
where is the farm size in hectares of household i in season s and in community
j. is a vector of parcel controls such as the distance to the parcel from farmers’
residence (in minutes), whether the parcel is on a public or leasehold land. is a vector
of household controls including household head gender, age, and years of schooling,
household assets, Thompson index (a measure of land fragmentation), and the dependence
rate (the ratio of family members below 15 and above 65 years to the family work force;
those between 15 and 65 years). captures the community and season fixed effects, while
is an error term that may be heteroskedastic and correlated within a community and
season. We adjust for this by using the robust standard errors and covariance matrices that
allow for the clustering of the error terms at the community and season groups (Wooldridge,
2010, Chapter 20).
For comparative purposes, we run the same regression separately for the receiving
and sending communities. We also run the same regression for households with private
land ownership and those whose land is communally owned.

21
6. Results
6.1. Rural-to-rural migration, population density and private land ownership
Table 4 reports the estimation results on the determinants of private land ownership.
The results show that there are many privately owned parcels in immigrant-dominated and
ethnically diverse communities. Column 1 suggests that when the proportion of immigrant
households in a community increases by 0.8 (which corresponds to the difference in the
total proportion of immigrants between receiving and sending communities, presented in
Table 2) the probability of a household privately owning a parcel increases by about 8%
(which is equivalent to the regression coefficient, 0.101, multiplied by 0.8). In Column 2,
an increase in the number of tribes in a community by 1 leads to a 0.02% increase in the
probability of privately owning land. In column 3, we use another proxy for migration:
whether a household or its descendants are native or indigenous in the community or
whether they immigrated. The results show that the probability of privately owning a parcel
is about 8% lower if the parcel-holder is a native household than if the holder is an
immigrant. The results remain significant even when the proportion of immigrants and the
number of tribes are included in the same specification (column 5). In all regressions we
include the village population density as of 2003 as an explanatory variable and find no
significant effect on private land ownership. The coefficient has a negative sign and is of
small magnitude when migration is not controlled for (column 4). The coefficient, however,
remains negative and becomes significant when we control for the proportion of
immigrants in a community (columns 1, 5 and 6). We conjecture that the negative sign may

22
capture what we find in the descriptive statistics that sending communities are densely
populated and have a high incidence of communal land ownership.
In Section 5, we noted the concern that our results may be capturing other
competing hypotheses, e.g., the reverse causality. However, the native household dummy
we included in column 3 downplays this concern since native households even in host
communities have a lower probability of privately owning land compared to immigrants.
To further rule out the endogeneity concerns, we use sleeping sickness as an instrument for
the proportion of immigrants in a community. The results, shown in column 6, remain
consistent with those presented in columns 1 and 5, but the magnitude becomes larger in
the instrumental variable (IV) specification: : increasing the proportion of immigrants in a
community by 0.8 leads to a 46% (which is equivalent to the regression coefficient, 0.578,
multiplied by 0.8) increase in the probability of privately owning land. The instrument
passes all tests including the weak instrument test.
While we do not find the positive effect of population density on private land
ownership, the first stage regression reveals that population density leads to migration
(column 7). This suggests that whereas we do not find a direct effect of population density
on land tenure arrangements (column 4), it works indirectly through influencing rural-to-
rural migrations.
6.2. Rural-to-rural migration, population density and land acquisition
Table 5 reports the average marginal effects computed from the multinomial log-
odd ratios. We find that immigration increases land purchases and land renting but
23
decreases land inheritance as modes of land acquisition. Column 1 suggests that a 0.8
increase in the proportion of immigrants in a community is associated with 12% (which is
equivalent to the regression coefficient multiplied by 0.8) lower probability of acquiring
land through inheritance. On the other hand, increasing the proportion of immigrants in a
community by 0.8 is associated with 6.2% (column 2) and 5.5% (column 3) significantly
higher probability of acquiring land through purchase and renting, respectively. Although
the signs of the coefficient are as expected, we do not find a significant effect of population
density on any of the modes of land acquisition, again suggesting that rural-to-rural
migration, through diluting social cohesion and weakening informal institutions, enhances
land transactions in host communities.
6.3. Farm size-productivity relationship by community type
Table 6 presents the estimates of the relationship between farm size and yield. The results
are presented by ownership type: whether the households’ parcels are privately or
communally owned, and by community type: whether the household is in the sending or
receiving community. Since private land ownership is more common in receiving
communities, the results should be consistent in the two classification categories. Columns
1 and 3 confirms hypothesis 4. We do not find the inverse relationship between farm size
and yield in households that have privately owned land and in communities with many
immigrants, whereas we find a strongly significant inverse relationship in households that
own land communally and in sending communities. Doubling farm size is associated with
19% lower yield lower yield on communally-owned land as shown in column 2 and by

24
27% in sending communities as shown in column 4. In all specifications, we include crop
dummies, community and seasonal fixed effects.
Table 7 presents robustness checks where we run the same specifications but define
receiving and sending community differently. This is to address the concerns that the way
we defined the communities may be influencing our results. So far, we defined all
communities as receiving if more than 30% of either the current generation or the second
generation immigrated and as sending if at most 30% of the households immigrated. We
adjust the cutoff points to 10%, 20% and 40% and check whether our results are sensitive
to these changes. We find that our results remain robust to these modifications. We
consistently do not find any inverse relationship in receiving communities and find a strong
and significant relationship in sending communities.
7. Conclusion and Policy Implications
In this study, we used community, household and parcel data from rural Uganda to
test the hypotheses that (1) ethnic diverse communities have a higher incidence of privately
owned land than the homogenous communities with fewer migrants, (2) densely populated
communities introduce private land ownership systems than sparsely populated
communities and (3) land markets are efficient in immigrant, ethnically diverse and densely
populated areas which reduce or remove the commonly observed inverse relationship
between farm size and productivity. We found that land tenure systems have evolved in the
last decade or so in Uganda. Whereas our results confirm hypotheses 1 and 2, we do not
find the evidence to support hypothesis 3 corresponding to the positive effect of population
25
density on private land ownership. Moreover, when we control for the proportion of
immigrants in a community, the coefficient of population density becomes negative and
even significant. We found, however, that population density positively and significantly
determine out-migrations, suggesting that whereas population density does not directly
affect the evolution of land tenure arrangements towards private land ownership, it
indirectly affects the evolution through influencing inter- community migrations.
We also found that the probability of renting and purchasing a parcel is higher and
that of land inheritance is lower in the immigrant communities. The functioning of land
markets in turn translates into lower and insignificant inverse relationship between farm
size and productivity in host communities. In other words, there is a significantly lower
yield per hectare on larger-farms in non-immigrant communities (referred to as sending
communities) while we did not find such relationship between farm size and yield in
immigrant communities (also referred to as receiving/host communities).
Our findings suggested inter-community migration promotes private land ownership which
enhances land transactions. Land transactions, in turn, enhance equity, and production
efficiency as land is transferred from less efficient large farms to more efficient small farms
(Heltberg, 1998; Otsuka, 2007; Songqing & Jayne, 2013). However, land markets remain
inactive if land is owned communally because of high transaction costs due to communal
restrictions. In order to promote efficient and equitable land transactions, deliberate policies
should be designed to transform land ownership arrangements from communal to private
land ownership so as to improve the performance of land markets, which would in turn

26
increase production efficiency, boost agriculture performance, and reduce poverty in the
rural areas. Nonetheless, they should be implemented with caution so that they would not
cause land disputes and conflicts among residents. Land conflicts reduce the agricultural
productivity significantly (Mwesigye & Matsumoto, 2013).
27
References
Andre, C., & Plateau, J.-P. (1998). Land relations under unbearable stress: Rwanda caught in the
Malthusian trap. Journal of Economic Behavior & Organization, 34, 1-47.
Atwood, D. (1990). Land Registration in Africa: The Impact on Agriculture Production. World
Development, 18(5), 659-671.
Ault, D. E., & Rutman, G. L. (1979, April). The Development of Individual Rights to Property in Tribal
Africa. Journal of Law and Economics, 22(1), 163-182.
Baland, J.-M., Gaspart, F., Platteau, J.-P., & Place, F. (2007). The Distributive Impact of Land
Markets in Uganda. Economic Development and Cultural Change, 55(2), 283-311.
Bellemare, M. F. (2013). The Productivity Impacts of Formal and Informal Land Rights: Evidence
from Madagascar. Land Economics, 89(2), 89:272-290.
Besley, T. (1995, October). Property Rights and Investment Incentives:Theory and Evidence from
Ghana. Journal of Political Economy, 103(5), 903-937.
Boserup, E. (1965). The conditions of agricultural growth: The economics of agrarian change under
population pressure. London: Earthscan Publication Limited.
Brasselle, A.-S., Gaspart, F., & Platteau, J.-P. (2002). Land tenure security and investment
incentives:puzzling evidence from Burkina Faso. Journal of Development Economics, 67,
373–418.
Busingye, H. (2002). Customary Land Tenure Reform in Uganda: Lessons for South Africa.
International Symposium on Communal Tenure Reform. Johannesburg: Programme for
Land and agrarian Studies (PLAAS).
Donge, J. K., & Pherani, L. (1999). Law and Order as a Developent Issue: Land Conflicts and the
Creation of Social Order in Southern Malawi. The Journal of Development Studies, 36(2),
48-70.
Feder, G., & Feeny, D. (1991). Land Tenure and Property Rights: Theory and Implications for
Development Policy. World Bank Economic Review, 5(1), 135-153.
Fenske, J. (2011). Land tenure and investment incentives: Evidence from West Africa. Journal of
Development Economics, 95, 137–156.
Fred-Mensah, B. K. (1999). Capturing Ambiguities: Communal Conflict Management Alternative in
Ghana. World Development, 27(6), 951-965.

28
Goldstein, M., & Udry, C. (2008, December). The Profits of Power: Land Rights and Agricultural
Investment in Ghana. Journal of Political Economy, 116(6), 981-1022.
Government of Uganda. (1998). The Land Act, 1998. . Entebbe: Uganda Government Printing and
Publishing Corporation.
Hayami, Y., & Ruttan, V. W. (1985). Agriculture Development: An International Perspective.
Baltimore: The Johns Hopkins University Press.
Heltberg, R. (1998). Rural Market Imperfections and the Farm Size-Productivity Relationship:
Evidence from Pakistan. World Development, 26(10), 1807-1826.
Holden, S. T., & Otsuka, K. (2014). The roles of land tenure reforms and land markets in the
context of population growth and land use intensification in Africa. Food Policy, . Article in
Press. http://dx.doi.org/10.1016/j.foodpol.2014.03.005.
Jean-Philippe Platteau. (1996). The Evolutionary Theory of Land Rights as Applied in Sub-Saharan
Africa: A critical Assessment. Development and Change, 27, 29-86.
Larson, D. F., Otsuka, K., Matsumoto, T., & Kilic, T. (2014). Should African rural development
strategies depend on smallholder farms? An exploration of the inverse-productivity
hypothesis. Agricultural Economics(45), 355–367.
Lastarria-Cornhiel, S. (2003). Uganda Country Brief: Property Rights and land Markets. Land Tenure
Center,University of Wisconsin-Madison.
Lin, J. Y. (1989). An Economic Theory of Institutional Change: Induced and Imposed Change. Cato
Journal, 9(1), 1-33.
Migot-Adholla, S., Hazell, P., Blarel, B., & Place, F. (1991). Indigenous Land Rights Systems in Sub-
Saharan Africa: A Constraint of Productivity? The World Bank Economic Review, 5(1), 155-
175.
Ministry of Agriculture, Animal Industry & Fisheries (MAAIF). (2010). Agriculture for Food and
Income Security. Agriculture Sector Development Strategy and Investment Plan:2010/11-
2014/15. Entebbe: Uganda.
Ministry of Lands, Housing and Urban Development (MLHUD). (2011). The Uganda National Land
Policy. Final Draft. Kampala: Century Building. Plot No. 13/15, Parliament Avenue.
Mwesigye, F., & Matsumoto, T. (2013). Rural-rural Migration and Land Conflicts: Implications on
Agricultural Productivity in Uganda. GRIPS Discussion Paper 13 -17.
Ngologoza, P. (1998). Kigezi and its People. Kampala: Fountain publishers Ltd.

29
Otsuka, K. (2007). Efficiency and Equity Effects of Land Markets. In H. o. AgriculturalEconomics, R.
Evenson, & P. Pingali (Eds.), Agricultural Development: Farmers, Farm Production and
Farm Markets (Vol. 3, pp. 2671–2703). Amsterdam: Elsevier.
Otsuka, K., & Place, F. (2001). Land Tenure and Natural Resource Management: A Comparative
Study of Agrarian Communities in Asia and Africa. Baltimore: The John Hopkins University
Press.
Otsuka, K., & Place, F. (2013, November). Evolutionary Changes in Land Tenure and Agricultural
Intensification in Sub-Sharan Africa. GRIPS Discussion Paper 13-22.
Pender, J., Nkonya, E., Jagger, P., Serunkuuma, S., & Ssali, H. (2004). Strategies to increase
agricultural productivity and reduce land degradation: Evidence from Uganda. Agricultural
Economics(31), 181-195.
Picozzi, K., Fèvre, E. M., Odiit, M., Carrington, M., Eisler, M. C., Maudlin, I., & Welburn, S. C. (2005,
November). Sleeping sickness in Uganda: a thin line between two fatal diseases. BMJ, 331,
1238–42.
Place, F., & Hazell, P. (1993, February). Productivity Effects Of Indigenous Land Tenure Systems in
Sub-Saharan Africa. American Journal of Agricultural Economics, 75(1), 10-19.
Platteau, J.-P. (1996). The Evolution Theory of Land Rights as Applied to Sub-Saharan Africa: A
Critical Assessment. Development and Change, 27, 29-86.
Rugadya, M. (1999). Land Reform: The Ugandan Experience. Land use and villagisation workshop
Hotel de mille Collines, Kigali.
Songqing, J., & Jayne, T. S. (2013, May). Land Rental Markets in Kenya: Implications for Efficiency,
Equity, Household Income, and Poverty. Land Economics, 89(2), 246–271.
West, H. (1965). The Mailo System in Buganda. Entebbe: The government Printer, Uganda.
Wooldridge, J. M. (2010). Econometric Analysis of Cross Section and Panel Data (Second ed.).
Cambridge, MA: MIT Press.
World Bank. (2008). Agriculture for Development. Washington DC.
World Bank. (2012).
http://databank.worldbank.org/Data/Views/Reports/TableView.aspx?IsShared=true&IsPo
pular=series.

30
Yamano, T., Sserunkuuma, D., Otsuka, K., Omiat, G., Ainembabazi, J. H., & Shimamura, a. Y. (2004).
The 2003 REPEAT Survey in Uganda: Results. FASID development database, National
Graduate Institute for Policy Studies.
31
Table 1: Changes in land tenure systems over time
Year: 2003 2005 2013
Mean SD Mean SD Mean SD
Proportion of parcels under:
Private ownership 0.40 0.49 0.46 0.50 0.56 0.50
Communal ownership 0.46 0.50 0.35 0.48 0.25 0.43
Mailo tenure 0.13 0.33 0.18 0.39 0.16 0.37
Leasehold/Public land 0.01 0.08 0.01 0.08 0.03 0.18
Number of parcels per household 2.53 2.06 3.09 2.47 3.77 2.66
Total number of parcels (Households) 2378 (940) 2859 (936) 2820 (917)
Notes: Authors’ computation using RePEAT panel data set.
32
Table 2: Migration, population density and community accessibility by community type
Sending (S) Receiving (R) |S-R|
Mean SD Mean SD
Number of tribes 2.630 1.884 6.565 4.554 ***
Proportion of immigrants to a community:
Current generation immigrants 0.097 0.087 0.522 0.249 ***
Parent’s generation immigrants 0.082 0.138 0.410 0.264 ***
1 if a community was affected by sleeping sickness 0 0 0.095 0.296 ***
Community population density in 2003 (persons/ha) 5.304 3.274 4.967 2.368 ***
Road condition to district:
1 if tarmac 0.143 0.356 0.219 0.417
1 if all-season dirt road 0.464 0.508 0.578 0.498 ***
1 if seasonal dirt road 0.393 0.497 0.188 0.393 ***
Soil quality: Principle Component 1 (PC1) 0.41 1.54 -0.57 1.00 ***
Number of communities 28 62
Source: Authors computation using 2012 RePEAT data .
***, **, and * are significance levels of the t-test difference in means between the two community types at
1%, 5%, and 10% respectively.
Soli quality measure (PC1) ranges from -6 to 6.
33
Table 3: Basic Characteristics of sample parcel and households by community type
Sending (S) Receiving (R) |S-R|
Mean SD Mean SD
Parcel level variables
Maize and Beans yield (Kilograms/ha) 1046.9 963.4 1068.4 965.2
Time to plot (minutes) 18.6 33.1 14.5 27.2 ***
Tenure system
1 if privately owned 0.642 0.480 0.700 0.459 ***
1 if communally owned 0.354 0.478 0.236 0.425 ***
1 if leasehold/public 0.003 0.056 0.048 0.214 ***
Acquisition mode
1 if inherited 0.491 0.500 0.288 0.453 ***
1 if purchased 0.436 0.496 0.576 0.494 **
1 if rented 0.072 0.258 0.136 0.343 ***
Number of parcels 1042
1105
Household Level variables
1 if household is native/indigenous 0.85 0.36 0.60 0.49 ***
Total farm size (hectares) 2.07 3.46 2.95 4.89 ***
Number of parcels 4.98 3.31 3.59 2.24 ***
1 if household is female-headed 0.13 0.33 0.15 0.36
Household head's age 53.34 15.33 52.75 14.00 ***
Household head's years of schooling 5.38 3.80 5.91 3.91 ***
Family size 7.71 3.84 7.98 3.61 **
Dependence rate 1.19 0.92 1.21 0.88
Assets value (‘000 Uganda Shillings) 698.09 1002.74 1075.42 1380.22 ***
Number of Households 262 479
Authors computation using 2012 RePEAT data
***, **, and * are significance levels of the t-test difference in means between the two community types at 1%, 5%, and
10% respectively.

34
Table 4: Determinants of private land ownership
Dependent variable takes 1 if the parcel is privately owned
IV First-Stage
(1) (2) (3) (4) (5) (6) (7)
Proportion of total immigrants in
a community 0.101***
0.0575** 0.578**
(4.178)
(2.271) (1.962)
Number of tribes in a community
0.0188***
0.0167***
(5.829)
(4.931)
1 if household is native
-0.0825***
(-3.729)
Community population density in
2003 (persons/ha) -0.00940* -0.00871 -0.00551 -0.00499 -0.0108** -0.0301** 0.0431***
(-1.740) (-1.643) (-1.045) (-0.938) (-2.039) (-2.099) (8.027)
Road condition to district
capitala:
1 if tarmac 0.122*** 0.0252 0.104*** 0.111*** 0.0410 0.175*** -0.142***
(3.479) (0.671) (2.955) (3.133) (1.076) (3.573) (-4.009)
1 if all-season dirt road 0.0512 0.0202 0.0471 0.0576 0.0207 0.0213 0.0534*
(1.450) (0.572) (1.337) (1.624) (0.586) (0.501) (1.805)
Soil quality measure: PC1 0.00229 0.00897 -0.00600 -0.00839 0.0131 0.0525* -0.0949***
(0.259) (0.975) (-0.682) (-0.946) (1.448) (1.696) (-11.02)
1 if leasehold/public -0.850*** -0.853*** -0.851*** -0.861*** -0.848*** -0.796*** -0.103*
(-18.58) (-19.31) (-18.67) (-18.79) (-19.20) (-12.60) (-1.753)
1 if hh is female-headed 0.0566* 0.0537* 0.0585** 0.0587** 0.0531* 0.0466 0.0268
(1.908) (1.811) (1.996) (1.981) (1.787) (1.308) (0.759)
Head age 0.00833* 0.00775 0.00570 0.00711 0.00838* 0.0141** -0.0110**
(1.759) (1.638) (1.195) (1.478) (1.779) (2.287) (-2.155)
Head age squared -7.57e-05* -7.46e-05* -5.20e-05 -6.67e-05 -7.88e-05** -0.000118** 7.71e-05*
(-1.885) (-1.845) (-1.276) (-1.626) (-1.969) (-2.374) (1.728)
Head years of schooling 0.00787 0.00779 0.00844 0.00658 0.00839 0.0140 -0.0122
(1.088) (1.063) (1.158) (0.899) (1.151) (1.621) (-1.458)
Head years of schooling squared -0.000752 -0.000737 -0.000642 -0.000587 -0.000813 -0.00152** 0.00153***
(-1.444) (-1.383) (-1.235) (-1.125) (-1.529) (-2.144) (2.874)
Family size -0.0110*** -0.0110*** -0.0106*** -0.0115*** -0.0108*** -0.00867** -0.00556*
(-3.218) (-3.262) (-3.074) (-3.301) (-3.217) (-2.305) (-1.892)
Log of assets value (‘000 Uganda
SHS) 0.0449*** 0.0400*** 0.0469*** 0.0499*** 0.0382*** 0.0209 0.0477***
(4.391) (3.941) (4.559) (4.848) (3.772) (1.123) (4.455)
1 if a community was affected by
sleeping sickness
0.223***
(6.311)
Constant 0.0337 0.0775 0.183 0.0761 0.0533 -0.166 0.401***
(0.234) (0.546) (1.266) (0.525) (0.375) (-0.852) (2.582)
Region dummies Y Y Y Y Y Y Y
Observations 1,408 1,408 1,408 1,408 1,408 1,408 1,408
R-squared 0.385 0.395 0.383 0.378 0.396 0.239 0.377
Cragg-Donald F-statistic (Weak identification test): 22.160
Numbers in parentheses are t-statistics computed using robust standard errors. *** shows significance at 1%, ** at 5% and * at 10%. a The reference category for tarmac and all season dirt road is season dirt road

35
Table 5: Determinants of land acquisition mode
Multinomial: Average Marginal effects
Inherited=1 Purchased=1 Rented=1
(1) (2) (3)
Proportion of total immigrants in a community -0.147*** 0.0783** 0.0687***
(-4.770) (2.366) (3.121)
Community population density in 2003 (persons/ha) -0.00614 0.00448 0.00166
(-0.982) (0.709) (0.427)
Road condition to districta:
1 if tarmac 0.122*** -0.167*** 0.0446
(3.213) (-4.156) (1.644)
1 if all-season dirt road -0.0274 0.0100 0.0174
(-0.790) (0.279) (0.736)
Soil quality measure: PC1 -0.00391 -0.000234 0.00415
(-0.371) (-0.0205) (0.550)
1 if leasehold/public -0.0397 0.000449 0.0393
(-0.435) (0.00503) (0.667)
1 if hh is female-headed -0.0169 0.0234 -0.00654
(-0.462) (0.600) (-0.249)
Head age -0.0106* 0.00754 0.00302
(-1.845) (1.184) (0.680)
Head age squared 7.23e-05 -2.34e-05 -4.88e-05
(1.449) (-0.419) (-1.188)
Head years of schooling 0.0151 -0.0105 -0.00465
(1.606) (-1.067) (-0.698)
Head years of schooling squared -0.000773 0.000542 0.000230
(-1.234) (0.832) (0.540)
Family size -0.00614* 0.00210 0.00405**
(-1.679) (0.569) (2.082)
Log of assets value (‘000 Uganda Shs) -0.0561*** 0.0726*** -0.0165**
(-4.377) (5.508) (-2.157)
Region dummies Y Y Y
Observations 1,579 1,579 1,579
Notes: Numbers in parentheses are z-statistics computed using robust standard errors.
*** shows significance at 1%, ** at 5%, and * at 10%. a The reference category for tarmac and all season dirt road is season dirt road

36
Table 6: Relationship between farm-size and yield by ownership type and by community type
Dependent Variable: Log of yield
Ownership type Community type
Private Communal Receiving Sending
(1) (2) (3) (4)
Log of farm size (ha) -0.0729 -0.191* -0.0519 -0.272**
(-0.781) (-1.702) (-0.719) (-2.192)
Time to plot (minutes) -0.00105 -0.00195 -0.00195 -0.000688
(-0.886) (-0.657) (-1.526) (-0.518)
Acquisition modea: Rented -0.0117 -0.182 -0.0528 -0.305**
(-0.0852) (-0.875) (-0.406) (-2.172)
Inherited 0.105 0.0513 -0.0589 0.148
(1.019) (0.362) (-0.573) (1.519)
1 if household is native 0.0943 0.0382 -0.0422 0.277
(0.704) (0.127) (-0.380) (0.887)
Thompson Index 0.0460 0.251 0.0822 0.264
(0.181) (0.836) (0.411) (0.673)
1 if hh is female-headed -0.277** -0.132 -0.230* -0.311
(-2.268) (-0.464) (-1.983) (-1.670)
Head Age -0.00779* -0.00594 -0.00619 -0.00730
(-1.758) (-1.068) (-1.447) (-1.562)
Head years of schooling -0.00649 0.000269 -0.00510 -0.00104
(-0.437) (0.0139) (-0.415) (-0.0734)
Family size -0.0171 -0.0131 -0.00998 -0.0237**
(-1.137) (-0.778) (-0.602) (-2.128)
Dependence rate -0.113** -0.0492 -0.130** -0.0531
(-2.188) (-0.490) (-2.577) (-0.717)
Log of assets value (‘000 Uganda SHS) 0.142** 0.106 0.156** 0.125*
(2.526) (1.164) (2.473) (1.889)
Constant 6.079*** 5.833*** 5.906*** 5.836***
(11.36) (7.667) (12.22) (7.944)
Community*Season FE Y Y Y Y
Observations 1,670 1,006 1,640 1,094
R-squared 0.174 0.171 0.186 0.186 Notes: In parentheses are t-statistics computed using robust standard errors. Standard errors are clustered at the
community level. *** shows significance at 1%, ** at 5%, and * at 10%. Crop dummies are included in all
specifications. a The reference of the parcel acquisition mode is purchased.

37
Table 7: Robustness check: Relationship between farm-size and yield in communities with different immigrant
proportions
Dependent Variable: Log of yield
Percentage of current and past generation immigrants in a community
>10% >20% >40 <10% <20% <40%
(1) (2) (3) (4) (5) (6)
Log of farm size (ha) -0.0523 -0.0256 -0.0291 -0.219* -0.307** -0.250**
(-0.750) (-0.379) (-0.407) (-1.774) (-2.179) (-2.509)
Time to plot (minutes) -0.00167 -0.00169 -0.00155 -0.00109 -0.000281 -0.000862
(-1.566) (-1.463) (-1.206) (-0.729) (-0.186) (-0.686)
Acquisition modea: Rented -0.158 -0.111 -0.0506 0.143 -0.277 -0.249*
(-1.487) (-0.933) (-0.362) (0.511) (-1.442) (-1.876)
Inherited 0.00992 0.0402 -0.0154 0.190 0.0748 0.132
(0.115) (0.433) (-0.147) (1.650) (0.563) (1.285)
Household is native -0.0184 -0.00746 -0.0444 0.680 0.256 0.211
(-0.173) (-0.0668) (-0.383) (0.827) (0.575) (0.838)
Thompson Index 0.130 0.169 0.0646 -0.298 -0.144 0.0308
(0.743) (0.875) (0.314) (-0.626) (-0.423) (0.120)
1 if hh is female-headed -0.183* -0.223** -0.226** -0.625** -0.343 -0.323
(-1.843) (-2.137) (-2.014) (-2.774) (-1.428) (-1.707)
Head Age -0.00693* -0.00636 -0.00592 -0.00930* -0.00827* -0.00850*
(-1.945) (-1.614) (-1.402) (-2.227) (-1.788) (-1.888)
Head years of schooling -0.00359 -0.00834 -0.00814 -0.0350 -0.00421 -3.41e-05
(-0.354) (-0.742) (-0.663) (-1.795) (-0.268) (-0.00240)
Family size -0.0241* -0.0262* -0.0127 -0.0176 -0.0122 -0.0259**
(-1.921) (-1.928) (-0.775) (-1.307) (-0.776) (-2.352)
Dependence rate -0.0873* -0.0993** -0.128** -0.178 -0.125 -0.0819
(-1.984) (-2.104) (-2.474) (-1.331) (-1.208) (-1.081)
Log of assets value (‘000 Uganda
SHS) 0.130** 0.143** 0.178*** 0.0916 0.0942 0.0719
(2.618) (2.641) (2.904) (0.656) (1.063) (1.123)
Constant 6.115*** 5.991*** 5.771*** 6.430*** 6.426*** 6.451***
(14.96) (13.98) (12.34) (6.490) (7.915) (12.01)
Community*Season FE Y Y Y Y Y Y
Observations 2,242 1,940 1,620 422 724 1,044
R-squared 0.190 0.205 0.179 0.212 0.168 0.232
Notes: In parentheses are t-statistics computed using robust standard errors. Standard errors are clustered at the community level.
*** shows significance at 1%, ** at 5%, and * at 10%. Crop dummies are included in all specifications. a The reference for parcel acquisition modes: rented and inherited is purchased.


