
Portfolio Choice, Background Risk, and University Endowment Funds
Stephen G. Dimmock
Abstract Using a unique dataset of university endowment fund holdings I test the implications of theories of portfolio choice in incomplete markets. I find that the standard deviation of the growth rate of non-endowment income affects risk taking by endowments. Universities with riskier non-financial income invest significantly more in fixed income and less in alternative assets such as hedge funds. There is also evidence that revenue flexibility, fixed costs, liquidity, cost structure flexibility, and credit constraints have a significant effect on asset allocation. I find no evidence that the correlation of non-endowment income with asset returns affects portfolio allocations to asset classes or to equity styles. JEL Classifications: G11, D52, I22 Keywords: Portfolio Choice, Background Risk, Incomplete Markets, Endowment Funds
* Michigan State University, 306 Eppley Center, East Lansing, MI, 48824, phone: 517-432-7133, [email protected]. I would like to thank Keith C. Brown, Kurt Butler, Long Chen, Zoran Ivkovich, Deborah Lucas, Luis Viceira, James Wiggins, and seminar participants at Michigan State University and the NTU International Conference on Finance for helpful comments. I thank Neslihan Yilmaz for research assistance. The usual disclaimer applies.

1
In a world with perfect markets portfolio choice is simple. Investors determine
their level of risk aversion and then choose the appropriate combination of the risk free
asset and the market portfolio. However, this simple argument collapses if there are
market imperfections. If investors are endowed with non-tradable risks, or background
risks, then all investor should optimally choose unique portfolios which best hedge their
personal risks.
There is a large and growing body of theory which shows that market
imperfections should have a large impact on portfolio choice, and that there are
significant welfare costs for investors who ignore this. The most ubiquitous finding is
that investors with a high standard deviation of non-financial income should hold safer
portfolios1. Similarly, a high correlation between risky assets and labor income reduces
the optimal allocation to risky assets. Other factors which may affect portfolio choice
include credit constrains2, labor supply flexibility3, liquidity4, and habits5.
A number of studies have tested background risk theory using household portfolio
data. Guiso, Jappelli and Terlizesse (1996), Massa and Simonov (2006), and Vissing-
Jorgensen (2002) show that a higher standard deviation of labor income leads to lower
equity ownership. Massa and Simonov (2006) and Vissing-Jorgensen (2002) both find
no evidence to suggest that households consider the correlation between security returns
and their labor income when forming portfolios.
1 For example Campbell and Viceira (2002), Cocco, Gomes and Maenhout (2005), Gollier (2001), Heaton and Lucas (2000), Kimball (1993) and Viceira (2000). 2 Cocco, Gomes and Maenhout(2005) and Davis, Kubler and Willen (2005). 3 Bodie, Merton and Samuelson (1992), Chan and Viceira (2000) and Jagannathan and Kocherlakota (1996) 4 Faig and Shum (2002). 5 Heaton and Lucas (1997).

2
While much of the theory tested in this paper is developed in the context of
household portfolio choice it applies equally to endowment funds6. There are, however,
advantages to testing these theories on endowment fund data. First, universities are
infinitely lived and do not have a life cycle. This greatly simplifies matters, as the value
of human capital diminishes with age implying that many effects should vary over the life
cycle7. Second, endowments are professionally managed so there is less likely to be the
ignorance and inertia exhibited by households. Third, endowments and universities are
tax exempt which reduces the complexity of the portfolio problem. Fourth, endowment
funds and universities produce audited financial statements ensuring data accuracy.
Fifth, endowments invest in a much wider range of asset classes than households,
including hedge funds and venture capital. Finally, most theories of household portfolio
choice were specifically developed to explain the known empirical facts of household
portfolios. As a result endowment fund data provides an opportunity to test these
theories in a way which is independent of the data that inspired the theory.
Another key advantage to studying endowment funds is that they receive new
money from external sources and are generally legally prohibited from spending more
than the return on investment. This means that endowment fund size is exogenous,
unlike the case of households, which simultaneously determine portfolio allocations and
savings8. As wealth is empirically the most important determinant of household portfolio
choice its endogeneity is a major problem in interpreting these studies.
6 Campbell and Viceira (2002 pg. 162) note that some aspects of household portfolio choice theories in the presence of background risk apply equally to university endowment funds. Merton (1992) models optimal endowment fund investment in a world with background risk. 7 See Cocco, Gomes and Maenhout (2005) for an excellent discussion of this point. 8 See Gomes and Michaelides (2005).

3
The results show that the standard deviation of non-endowment income has a
significant effect on the portfolio choices of endowment funds. Universities with greater
income risk invest more in fixed income assets and avoid alternative assets such as
venture capital. However, there is no evidence that universities take the correlation
between their non-financial income and asset returns into account when investing.
There is strong evidence of fixed costs to investing in certain asset classes. Large
funds invest significantly more in alternative assets such as hedge funds. However, there
is no evidence that the size of the endowment fund relative to total revenues affects
portfolio choice.
Endowment funds need to provide regular cash flows to their affiliated
universities. As a result portfolio liquidity can be a concern. Universities with greater
selectivity, a proxy for the elasticity of demand, hold significantly less liquid portfolios as
they have a greater ability to raise cash through tuition changes. Universities with a high
ratio of donations to endowment fund size also hold significantly less liquid portfolios.
As theory predicts credit constrained universities hold significantly safer
portfolios. A high ratio of debt-to-assets results in a relatively large allocation to fixed
income securities. Public universities also invest more in fixed income securities and
generally invest more in transparent asset classes.
Research intensive universities hold significantly safer portfolios than liberal arts
colleges. This suggests that there are costs associated with fluctuations in research
funding and universities attempt to hedge these costs through their endowment funds.
The remainder of the paper is structured as follows. Section I reviews the existing
literature and develops testable hypotheses. Section II describes the data. Section III

4
examines allocations to risky assets. Section IV examines asset allocation at the level of
individual asset classes. Section V examines equity investment style. Section VI
concludes.
I. Theory and Hypotheses
Each endowment portfolio manager faces a unique problem when selecting
investments. While all endowments have the same investment opportunity set, each
endowment fund is inextricably linked to a specific university. Each university has its
own unique set of institutional features and financial risks. To form an optimal portfolio
these factors must be considered as part of the investment allocation process. In this
section I discuss the existing literature on portfolio choice and specific hypotheses for
endowment funds.
A. Standard Deviation of Non-Endowment Income
A number of authors9 have shown that if an economic agent is endowed with a
non-tradable risk, or background risk, this should decrease their appetite for other risks
even if all sources of risk are statistically independent. Cocco, Gomes and Maenhout
(2005), Heaton and Lucas (2000), and Viceira (2001) show that risky labor income
should lead to smaller portfolio allocations to equity. Empirically Guiso, Jappelli and
Terlizzese (1996), and Vissing-Jorgensen (2002) have shown that a high standard
deviation of labor income leads to lower equity investment.
9 Eeckhoudt, Gollier and Schlesinger (1996), Gollier and Pratt (1996), Kimball (1993), and Pratt and Zeckhauser (1987) all discuss the problem of background risk. Gollier (2001) devotes several chapters to the issue of background risk and provides a good review of existing work.
5
For university endowment funds there is a clear testable empirical implication.
Universities with a higher standard deviation of non-endowment income should hold
safer portfolios.
B. Correlations Between Asset Classes and Non-Endowment Income
If an investor’s background risk is positively correlated with the returns of an
asset class, that asset class will be a particularly unattractive investment. Cocco, Gomes
and Maenhout (2005), Heaton and Lucas (2000) and Viceira (2001) show that households
with a high positive correlation between labor income and equity returns should allocate
less of their wealth to equity. Empirically Massa and Simonov (2006) and Vissing-
Jorgensen (2002) find that there is no significant relationship between the correlation of
household income with equity returns and portfolio choice.
In the context of university endowment funds a high correlation between an asset
class and non-endowment income should lead to lower portfolio allocations. Since total
allocations must sum to 100% a high correlation between a given asset class and non-
endowment income should also lead to higher investment in other asset classes.
C. Fund Size
In the context of household portfolio choice Halliassos and Bertaut (1995) and
Vissing-Jorgensen (2002) argue that limited equity market participation can be partially
explained by the presence of a fixed cost of entry. The endowment funds in this study are
large enough to overcome the direct financial costs of entering equity or fixed income
markets. However, the cost of selecting and monitoring alternative asset investments is

6
high. Larger funds have a greater ability to afford fund managers and consultants with
expertise in hedge funds, private equity, and venture capital partnerships.
D. Relative Fund Size
Bodie, Merton and Samuelson (1992), Chan and Viceira (2000), and Jagannathan
and Kocherlakota (1996), argue that the relative size of financial wealth versus human
capital can explain a popular investment adage. Households are frequently advised that
they should invest heavily in stocks when they are young, and decrease their allocation as
they age. Younger households hold a higher proportion of their total wealth in the form
of human capital. Since the return on human capital is relatively safe younger
households effectively have a large position in a low risk asset. As a result young
households can invest their financial wealth in riskier securities such as stocks. As
households age the net present value of their human capital declines and they must invest
more of their financial assets in bonds to maintain their portfolio’s overall risk profile.
As universities have infinite lives they do not have a life cycle. However,
universities vary considerably in the percentage of their total wealth which is held in their
endowment. For some universities the majority of their income comes from endowment
returns; for others the endowment is relatively unimportant. This leads to the hypothesis
that universities with a large proportion of total revenues from their endowment should
hold less risky portfolios.

7
E. Revenue Flexibility
Bodie, Merton and Samuelson (1992) and Chan and Viceira (2000) show that
when a household has greater flexibility to vary their labor supply they should choose to
take on greater financial risk. Since labor supply flexibility allows households to replace
financial losses through increased labor earnings, investors with greater flexibility should
be willing to assume greater financial risk.
While universities do not make a leisure-labor tradeoff they face an analogous
situation. Universities control their tuition income and their portfolio of programs
offered. Typically, universities do not maximize tuition revenue but instead balance the
need for funds with their desire for quality students. Across universities, however, the
ability to raise tuition and to introduce new, profitable programs, without negatively
impacting university quality, varies with demand for entrance. This leads to a clear
implication for portfolio choice. Universities which are more selective can take on
greater portfolio risk as the excess demand for entrance allows these institutions to
smooth portfolio fluctuations via their revenue flexibility.
F. Donations and Liquidity
Portfolio liquidity is a concern for endowment managers for two reasons. First,
endowments must make transfers to university operating budgets. Second, portfolio
liquidity affects the ability of endowment funds to periodically rebalance. As Lerner and
Schoar (2004) document, alternative assets such as private equity funds are typically
highly illiquid. Donations allow endowments to invest in illiquid assets as these
donations provide a direct source of liquid cash. Faig and Shum (2002) demonstrate that

8
liquidity should directly affect risk taking. This leads to the hypothesis that universities
with a high ratio of donations to endowment fund size will choose to invest a higher
proportion of their portfolio in alternative assets.
G. Research and Teaching
Universities have two mandates, to teach and to conduct research, with different
universities focusing on these activities in varying proportions. Differences in
institutional focus may affect portfolio choice for a number of reasons. First, research
and teaching activities drive costs. If some costs are less flexible than others this should
affect optimal portfolio choice. Second, research insensitivity is directly related to
reputational capital. A university with greater reputational capital will desire to preserve
this capital and so will exhibit greater risk aversion. As a result the proportion of a
universities budget spent on research may significantly affect risk taking by endowments.
H. Fund Governance
Lakonishok, Shleifer and Vishny (1992) argue that institutional governance
affects portfolio decision making10. One measurable governance differences between
universities is that some are public and others private. As more detailed information
about fund governance is not available I use an indicator variable that equals one for
public universities. Public universities answer to a wider constituency and there is likely 10 University endowments typically have a governance committee responsible for the funds investments and one or more employees to implement their decisions. Unfortunately the NACUBO NES survey does not report fund governance information for individual universities. Summary statistics show that investment committees average 10 members (with a range of 3-50) and usually have one full time staff member whose primary responsibility is investment management. Slightly fewer than 75% of the funds employ an outside consultant. See Brown, Garlappi and Tiu (2006) for a detailed discussion of fund governance.
9
to be political oversight of the fund which could lead to less risk taking. Alternatively
however, government ownership creates the moral hazard problem of free implicit
insurance which could cause excess risk taking.
I. Credit Constraints
Universities can use credit to smooth their spending from year to year. Cocco,
Gomes and Maenhout (2005) and Davis, Kubler and Willen (2005) argue that credit
constraints should affect portfolio choice. Empirically, Guiso, Jappelli and Terlizzese
(1996) show that credit constrained households hold safer portfolios. Similarly, credit
constrained universities should hold relatively safer portfolios.
II. Data
A. Endowment Funds
Hansmann (1990) argues that endowments exist to: serve as a financial buffer,
ensure the survival of the institutions reputational capital, and protect universities’
intellectual freedom. To achieve these goals endowment funds11 are held separate from
other university funds and are managed to maintain their purchasing power while
providing funds for current operations12.
The main source of information about university endowment funds comes from
the 2003 National Endowment Survey (NES). This survey is conducted and prepared by 11 In legal jargon the term “endowment funds” refers only to funds which are donated with explicit legal restrictions preventing the university from spending any portion of the principal. Frequently university endowments include donations which were given without any such restrictions. These funds are legally termed quasi-endowments. Endowment and quasi-endowment funds are reported pooled together in the NACUBO data. Throughout this paper “endowment funds” refers to both true and quasi endowment s. 12 The most common system is to spend 5% of a moving average of fund value (often the average value over the last 12 quarters).

10
TIAA-CREF under the direction of the National Association of College and University
Business Officers (NACUBO).
Out of 880 institutions invited to participate, 723 responded to the 2003 wave of
the survey for a response rate of 82%. The 2003 study was conducted in the fall of 2003
and gathered data about the 2002-2003 academic year. Survey information includes:
portfolio holdings, returns, and endowment size. Returns and some other information are
reported by a confidential numeric code while other information, such as portfolio
holdings, is reported by university name. Confidentiality of return information is
provided to encourage participation.
The 723 initial observations are reduced to 677 observations for a variety of
reasons. Some institutions only partially respond to the survey and do not report their
asset allocations. I drop Canadian universities as I do not have information about their
incomes. Other institutions report their foundations separately from their university’s
endowment information. In these cases I aggregate the foundation and university
information to form a single observation. Some universities in the same system report
information at the campus level, but portfolio holdings are identical across campuses. In
these cases I aggregate information to the university system level. In the statistical tests
reported in subsequent sections some observations are lost due to missing explanatory
variables.
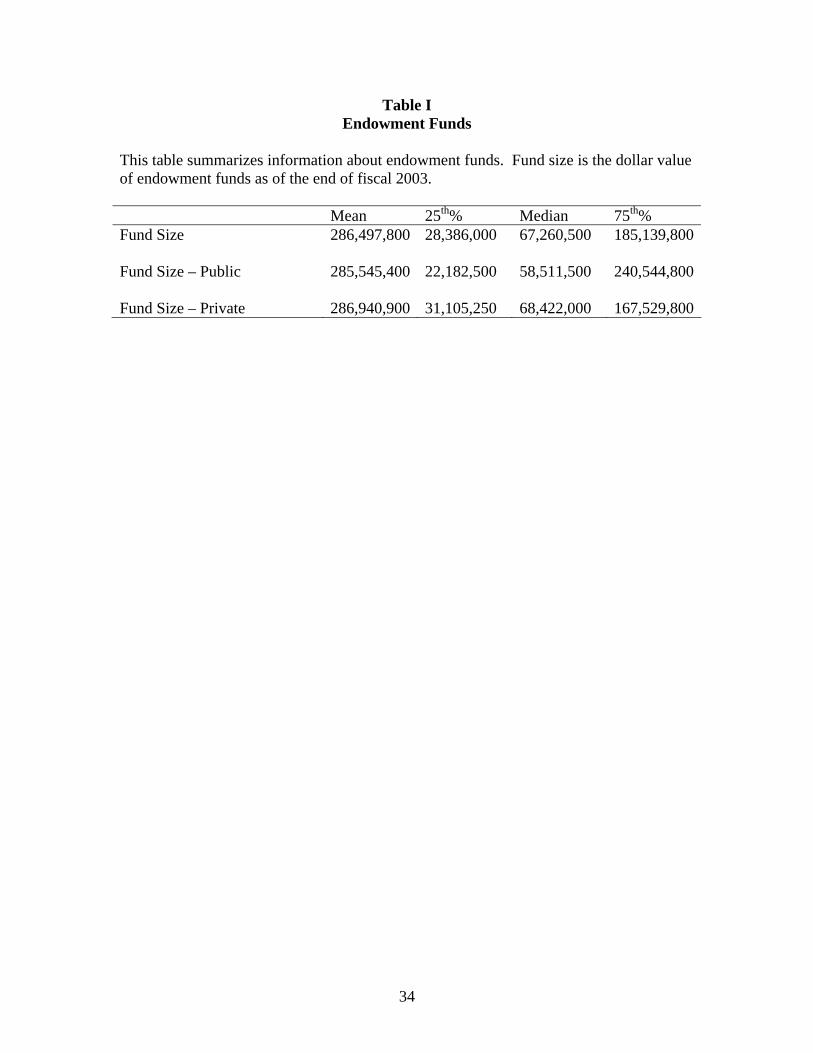
Table I shows summary statistics about university endowment funds. The
average endowment fund size13 in this study is a little over a quarter of a billion dollars.
13 Data is reported as of fiscal year end. 89.3% of the sample has a June 30 year end. 10.7% of the endowment funds in this sample report data have a different year end, usually May 31.

11
However, as the percentiles show, fund size is highly skewed. Average endowment size
is similar between public and private universities.
B. Portfolio Allocation Data
The NES data contains rich and detailed information about portfolio holdings. In
most cases I can see the exact funds held by each university. The style of each fund held
is categorized by TIAA-CREF. For example, the single largest equity investment made
by Michigan State University is managed by WP Stewart & Company, is classified as a
US, large growth fund, and comprises 11.6% of the total value of the endowment fund.
Panel A of Table II shows ownership across broad asset classes. Virtually all
endowment funds own both equity and fixed income. However, the allocations vary
widely. For example, equity allocations across equity owning institutions vary from
1.6% to 100%, while bond ownership varies from 0.3% to 91.5%.
Panel B shows the equity allocations broken down into styles. Almost all funds
own at least some large cap equity and this usually comprises a large proportion of the
endowment fund. Value is slightly more popular than growth but core investments are
larger than either.
Panel C shows that slightly over half of all endowment funds own at least some
real estate although the amount is usually quite low. Universities typically own their
campus, the buildings on it, and student housing. This represents a substantial investment
in real estate, albeit one held outside of endowment funds, and may explain the low
allocations to real estate.

12
Just over 70% of endowment funds own at least some alternative assets. As Panel
D shows, almost half of endowment funds own hedge funds and the allocations are
typically substantial. Private equity and venture capital are both popular but the
allocations are quite modest. Oil and gas partnerships, commodities, and timber are held
by a small minority of funds and allocations are small.
C. University Statistics
The main source of university financial data is the Department of Education’s
National Center for Education Statistics (NCES) 14. The NCES gathers data on all U.S.
based postsecondary education institutions through surveys. Participation in these
surveys is mandatory for all institutions that participate in, apply for, or wish their
students to be eligible for, any form of funding from the federal government.
Universities which fail to complete all required surveys by the mandated deadline may be
fined or barred from accessing federal funds. This ensures high participation and
accurate reporting.
From the NCES data I find total 2002-2003 fiscal year non-endowment income15,
referred to as Income for the remainder of this paper (variable names and definitions used
in this paper may be found in Table III). As Table IV shows average university revenues
were a little over $300 million16. As with most financial variables in this study this is
highly skewed with the mean larger than the 75th percentile.
14 I am grateful to Cathy Statham of the NCES for assistance using IPEDS. 15 NCES data is submitted separately for each campus while endowment data is sometimes reported at the university system level. In cases where the endowment data is reported at the university system level I aggregate campus level data prior to merging. Frequently the university system is composed of only one campus and this is not an issue. 16 This variable is winsorized at the 99th%. Highly skewed variables are winsorized at the 99th% and, if unbounded at the lower end of the distribution, at the 1st% as well.

13
As Table IV shows university revenues come from a variety of sources. Tuition,
Rev_Tuition, is the largest source of revenue at 41.1%. Government appropriations,
Rev_Gov, are a large source of funds for public universities. As the majority of
university in this sample are private (63.9%) this is not a large source of funds on
average. Revenues from private gifts and grants, Rev_Private, includes donations made
directly to current revenues (donations not designated for endowment purposes) as well
as research funding from private foundations and companies. Revenue from government
grants and contracts, Rev_Grants, comes from all levels of government but the majority
comes from federal research funding. The final category, Rev_Other, is composed of:
hospital revenues, sales of services and educational activities, and auxiliary enterprises
(including student housing and food services).
The proportion of Income spent on research, Prop_Research, is based on self-
reported information provided to the National Science Foundation and compiled by
TheCenter at the University of Florida17. Their definition of research spending is very
narrow and likely underreports true research spending but it is consistent across
universities.
Data on donations comes from the NCES dataset. As annual donations are highly
variable across years I use a 5-year average of donations taken over the period ending
17 NCES data on research spending uses definitions of research that differ depending on if the university reports using GASB or FASB accounting standards. Despite the accounting differences NCES and TheCenter research spending figures have a correlation coefficient of 0.83 with a p-value of less than 0.0001.
14
June 200318. Average annual donations are $23,576,020 and the average ratio of giving
to total endowment fund assets, Donate_Size, is 16.6%19.
A university’s financial flexibility should affect their portfolio choice. I proxy for
each university’s credit constraints using their debt-to-assets ratio20, Debt_Assets. A high
debt load implies greater financial constraints. As can be seen in Table IV Debt_Assets is
around 30% for an average university but this ranges from less than 1% to greater than
150%.
I use university selectivity as a measure of university quality. Selectivity is
defined as the ratio of accepted applicants to total applicants21, Prop_Admit. A typical
university accepts 68% of applicants but this varies widely. Some universities have an
open admissions policy while others accept fewer than 10% of applicants.
D. Background Risk
The primary source of background risk for a university endowment fund comes
from the university’s non-endowment income. Using revenue data from the NCES I
construct the non-endowment income of each institution in this study from fiscal year
2002-2003 through the 1983-1984 fiscal year, the first fiscal year the NCES data is
18 Donations for all years are inflation adjusted to June 2003 dollars using the all items CPI index for all urban consumers. 19 This contains some both true and quasi-endowment giving as well as some gifts to current spending (i.e. donations used to construct new buildings). Data from the VSE dataset compiled by the Council for Aid to Education shows that the IPEDS measure of donations has a correlation of 0.897 with endowment donations. Unfortunately the VSE dataset covers only 70% of the firms in the NES dataset. 20 60.4% of universities in this sample have Moody’s credit ratings. The correlation between debt to assets and ranks based on credit ratings is 0.21 and is highly significant (p-value of less than 0.0001). Because debt-to-assets is available for all universities, while credit ratings are not, I use debt-to-assets throughout the remainder of this paper. 21 The correlation between the proportion of applicants admitted and the U.S. News academic rankings is 0.74 for national universities and 0.78 for liberal arts colleges. In both cases the correlation has a p-value less than 0.0001. Only 63% of the universities reporting endowment fund data are ranked by US News.

15
available. From this time-series of non-endowment income I calculate the annual
percentage change in the growth rate of non-endowment income.
Table IV shows summary statistics of the standard deviation of the time-series of
percentage changes in non-endowment income, Stdev. The average Stdev is 10.6% and
there is considerable variation across universities. By comparison Carroll and Samwick
(1997) report an average standard deviation of household income growth is 18.8%.
Table V shows the average value of different variables within four standard
deviation sorted groups. In general large, research intensive, public universities have the
lowest standard deviations. Private universities, particularly liberal arts schools, have the
highest standard deviations.
Correlations between changes in non-endowment income and various asset return
indexes are also shown in Table IV22. The average correlation with the CRSP value
weighted market index, Corr_CRSP, is low and close to zero but there is wide variation
across universities. The correlations with the Fama-French HML and SMB factors,
Corr_HML and Corr_SMB respectively, indicate that on average university finances
move with larger growth firms. However, the average correlations are not large and there
is considerable variation across institutions. The final measure of background risk is the
ratio of the endowment size to non-endowment income, Size_Income. The average
endowment is about twice the size of annual non-endowment income.
22 I assume that university budgets are set by the beginning of the fiscal year, and transfers from endowment funds are available at the start of the fiscal year. The change in non-endowment income between the prior fiscal year and the forthcoming fiscal year is lined up with the index return. For example, the index return from June 1999 to June 2000 would be lined up with the change in non-endowment income between the academic fiscal years July 1999 to June 2000 and July 2000 to June 2001.

16
III. Allocation to Risky Assets
Most theoretical models of portfolio choice with background risk assume a single
risky asset and a risk free asset. In this section I divide assets into risky and safe
categories and estimate a Tobit model where the dependent variable is the percentage of
the portfolio allocated to risky assets. Because the line between safe and risky assets is
not always as clear in practice as it is in the world of theory I use two definitions of risky
assets. With either definition the results are similar. In the first two columns of Table VI
risky assets are defined as the sum of alternative assets (commodities, hedge funds,
private equity, and venture capital) and equity. The last two columns show results when
risky assets are defined as the sum of: alternative assets, equity, high yield bonds, and
real estate.
Stdev is significant in all cases. Consistent with the most basic prediction of
background risk theory universities with greater income risk allocate less of their
portfolios to risky assets. This provides evidence that non-financial risk affects the level
of financial risk investors assume. I find no support for the second major prediction of
background risk theory. The coefficient on Corr_CRSP is insignificant in all cases.
While this contradicts the theoretical predictions it is consistent with empirical studies of
household portfolios such as Massa and Simonov (2006) and Vissing-Jorgensen (2002).
The results show that large endowment funds allocate a greater proportion of their
investment pool to risky assets. In the next section I will show that this is mainly driven
by the fact that larger endowments allocate much more of their portfolios to alternative
assets. Brown, Garlappi and Tiu (2006) show that large endowments have considerably
17
higher risk adjusted returns, consistent with the idea that there are sizable fixed costs to
effective investment management.
The ratio of fund size to university income is not significant. This is a surprising
result as it suggests that the financial importance of the endowment fund to the university
does not affect investment policy. The proportion of applicants admitted, the ratio of
five-year average donations to endowment fund size, and the indicator variable for public
universities are all not significant. These results indicate that university selectivity,
donation patterns, and governance do not directly affect risk choices in this sample.
The debt-to-assets ratio is significant as predicted by theory papers such as Cocco,
Gomes and Maenhout (2005) and Davis, Kubler and Willen (2005). Universities with
greater debt levels invest in safer portfolios. Greater amounts of debt lead to safer
investments due to the financial risk the university faces and concerns about exhausting
borrowing capacity.
The coefficient on the proportion of revenue spent on research is significantly
negative in all specifications, suggesting that research intensive universities hold
relatively safe portfolios. A successful research program involves a large number of
implicit contracts about resource availability. Thus a research program creates a financial
commitment to provide stable funding. While these implicit contracts are not legally
enforceable, failure to meet these commitments could seriously damage a university’s
reputation.
Revenue sources also have a significant effect on portfolio choice. A higher
proportion of revenues from tuition is associated with higher risk taking. This is likely
because tuition is a very stable source of funds which is under the university’s direct
18
control. Revenue from government appropriations is insignificant which is somewhat
surprising, as this tends to be one of the safest and most stable forms of funding. Funding
from private and public groups has a significant positive relationship with risky asset
investment. This is also somewhat surprising as these tend to be the most volatile income
sources.
The evidence shows that some theoretically important factors affect portfolio
choice in this sample, but other hypothesized effects are not significant. However, in
dividing assets into only two categories considerable information is lost. In the next
section I look at allocations across a wider range of asset classes.
IV. Asset Class Allocations
A. Methodology
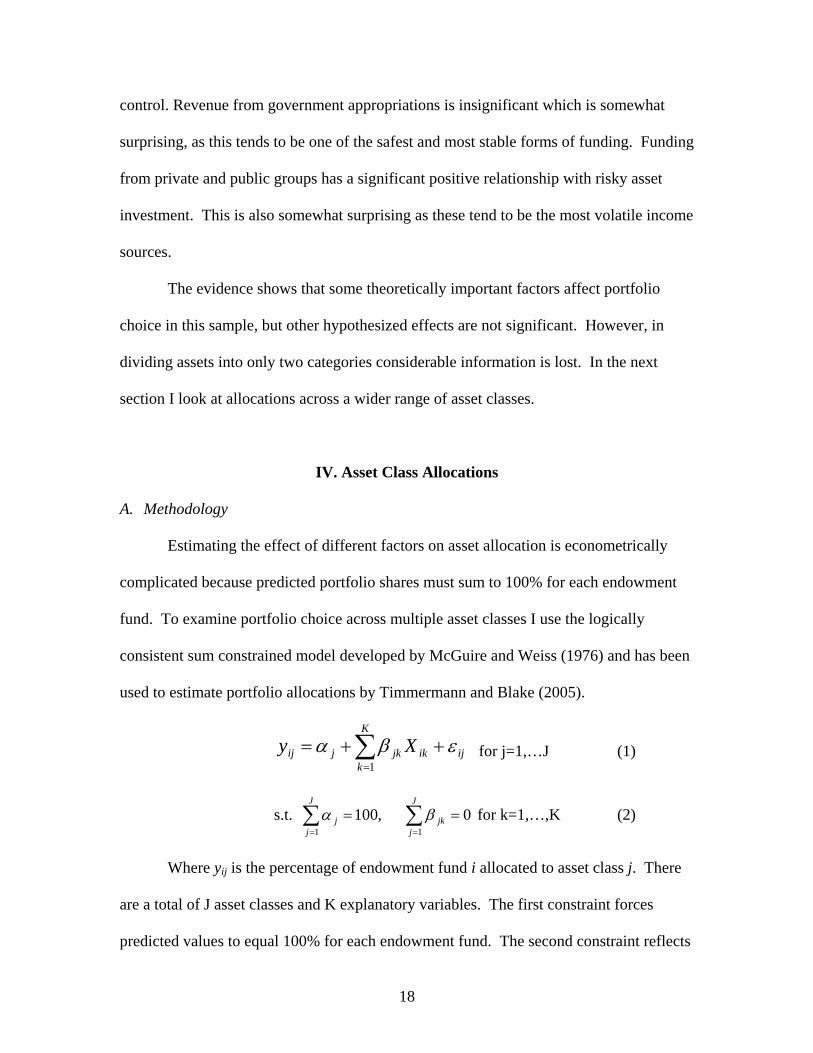
Estimating the effect of different factors on asset allocation is econometrically
complicated because predicted portfolio shares must sum to 100% for each endowment
fund. To examine portfolio choice across multiple asset classes I use the logically
consistent sum constrained model developed by McGuire and Weiss (1976) and has been
used to estimate portfolio allocations by Timmermann and Blake (2005).
∑=
++=K
kijikjkjij Xy
1εβα for j=1,…J (1)
s.t. ∑ ∑= =
==J
j
J
jjkj
1 10,100 βα for k=1,…,K (2)
Where yij is the percentage of endowment fund i allocated to asset class j. There
are a total of J asset classes and K explanatory variables. The first constraint forces
predicted values to equal 100% for each endowment fund. The second constraint reflects
19
the fact that if a given variable causes an X% increase in equity allocations it must cause
exactly an X% decrease in the allocations to other asset classes23.
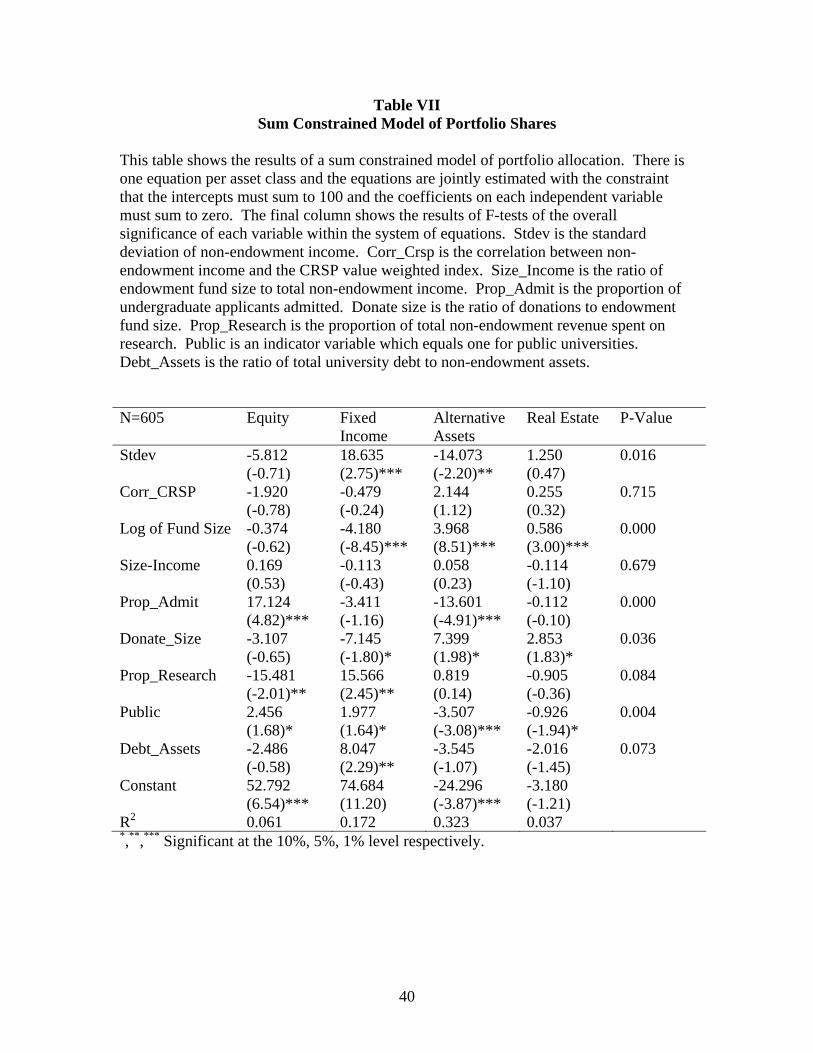
B. Asset Allocation: All Funds
To examine asset allocation I place all assets into one of four categories: equities,
fixed income and cash, alternative assets, and real estate. Table VII shows the sum-
constrained model estimates of allocations to these asset classes. The final column
contains the p-value from F-tests which show the overall significance of each variable
within the overall system of equations.
Compared to the Tobit regressions in the previous section the R2s are much
higher. While the Tobit regressions’ R2s were all below 0.03, here they range from 0.04
to 0.32. The increase in predictive ability is most striking for alternative assets and fixed
income.
Stdev is highly significant, primarily affecting allocations to fixed income and
alternative assets. As predicted by background risk theory greater non-financial risk
leads to safer portfolio choices. That higher background risk leads to higher investment
in fixed income is unsurprising. However, it is surprising that background risk affects
risk taking through alternative assets and not equity. Possibly this is due to the greater
risk of venture capital, private equity, and some types of hedge funds. Alternatively, it
may be that alternative assets are directly affected by background risk because alternative
23 One drawback to this methodology is that it is possible for predicted values to be negative. However, as a practical matter this problem is limited. Predicted equity, fixed income, and real estate allocations are never negative. However, around 5% of the predicted values for alternative assets are negative. Typically the negative predicted values are close to zero but there are seven observations with predicted values less than -5% ranging to -9.6%.
20
asset’s risks are more malleable than equity risk, and this allows endowments to better
customize the correlation structure of their portfolio without sacrificing return.
While Stdev is statistically significant its economic effect is modest. An increase
in the standard deviation from the 10th percentile to the 90th percentile decreases the
allocations to equity and alternative assets by 1% and 2.5% respectively. The allocation
to fixed income increases by 3.3%.
The correlation between non-endowment income and the CRSP value weighted
market index does not have a statistically significant effect on allocations to any of the
asset classes. This is disappointing as theory identifies this as an extremely important
factor. However, correlation risk is subtler and more difficult for fund boards to grasp
than standard deviation risk. Consequently it may not have the same affect on the
decision making process.
Endowment fund size is statistically and economically the most important factor
affecting asset allocation. Larger funds allocate a much higher proportion of their assets
to alternative assets and real estate, supporting the notion that there are fixed costs of
entering certain markets. Since alternative assets and private real estate (which
comprises the majority of real estate investment in the sample) require greater expertise,
smaller endowments are unable to participate in these asset classes. Moving from the
10th percentile of fund size to the 90th percentile results in an increase of 15.1% invested
in alternative assets and a decrease of 15.9% in fixed income. There is also a 2.2%
increase in the allocation to real estate.
The Size_Income ratio is not significant. Theoretically a university with a large
proportion of total revenues derived from the endowment fund should hold a safer

21
portfolio than a university where the endowment is relatively unimportant. Empirically
this does not appear to be the case24.
The proportion of applicants admitted is highly statistically significant. Selective
universities allocate a greater proportion of their portfolio to alternative assets instead of
equities. The hypothesis is that more selective universities should take on greater risk as
they have greater flexibility to replace financial losses through revenue flexibility. Since
the effect is concentrated in allocations to equity and alternative assets rather than fixed
income this significance does not appear to be directly related to portfolio risk. There are
two potential explanations. First it is possible that more selective universities are willing
to hold less liquid investments because they can readily generate liquid cash through
revenue flexibility. Second, since endowment fund boards are primarily composed of
alumni it is possible that selective universities have higher quality board members with
greater financial sophistication. In either case, moving from the 10th percentile of
selectivity to the 90th percentile increases the allocation to alternative assets by 6.2% and
decreases allocations to equity by 7.8%.
The ratio of average donations to fund size, Donate_Size, is significant at the 10%
level in the manner predicted. Universities with a higher donation levels invest allocate
more to less liquid asset classes, such as private equity funds which typically have
stringent lock-up provisions. Since donations provide cash directly portfolio investments
can be less liquid while still maintaining the ability to make regular cash transfers to the
university operating budget and periodically rebalance.
24 In work not reported here I find that an interaction term between this variable and the standard deviation of non-endowment income is significant, but this result is sensitive to the inclusion of the most extreme observations.
22
The proportion of the budget spent on research is significant at the 10% level25.
Research intensive universities hold less equity and more fixed income products. This
suggests that there are important costs to fluctuations in research funding and universities
invest in a manner that reduces the impact of these costs. This variable is far more
significant when the percentage of revenue from different sources is included as seen in
Table VIII. This is because, while there appear to be substantial costs associated with
fluctuating research funding, research funding itself is typically quite volatile. Research
grants from both public and private sources are far more variable than revenues from
tuition and government appropriations. A university on the 10th percentile of research
funding holds 3.5% less fixed income than a university on the 90th percentile, with a
correspondingly higher allocation to equity.
An indicator variable which equals one for public universities is highly
significant. Public universities hold less alternative assets and real estate, and more
equity and fixed income. Since public universities hold more of both equity and fixed
income this does not appear to be a risk effect. It appears to be a governance effect
where public universities prefer to hold more liquid, transparent investments26. However,
as Table VIII shows, the indicator variable for Public is not significant when the
proportion of revenue from government appropriations is included.
The debt-to-assets ratio is significant at the 10% level and shows that, consistent
with theory, universities with a greater debt load tend to invest more in fixed income and
25 In work not reported here I include indicator variables for Carnegie Classifications of Institutes of Higher Education. Including the proportion of the budget spent on research eliminates the significance of these indicator variables. It appears that the effect of research spending on portfolio choice operates mainly through doctoral universities holding relatively safe portfolios. 26 Among real estate investments there is a sharp difference between public and private universities’ investments. Public universities primarily invest in REITs while private universities invest mainly in private real estate.
23
cash. This result is consistent with the idea that credit constraints result in a safer
investment policy27. An increase in Debt_Assets from the 10th percentile to the 90th
percentile results in a 3.0% increase in allocations to fixed income and a 1.3% decrease in
allocations to alternative assets.
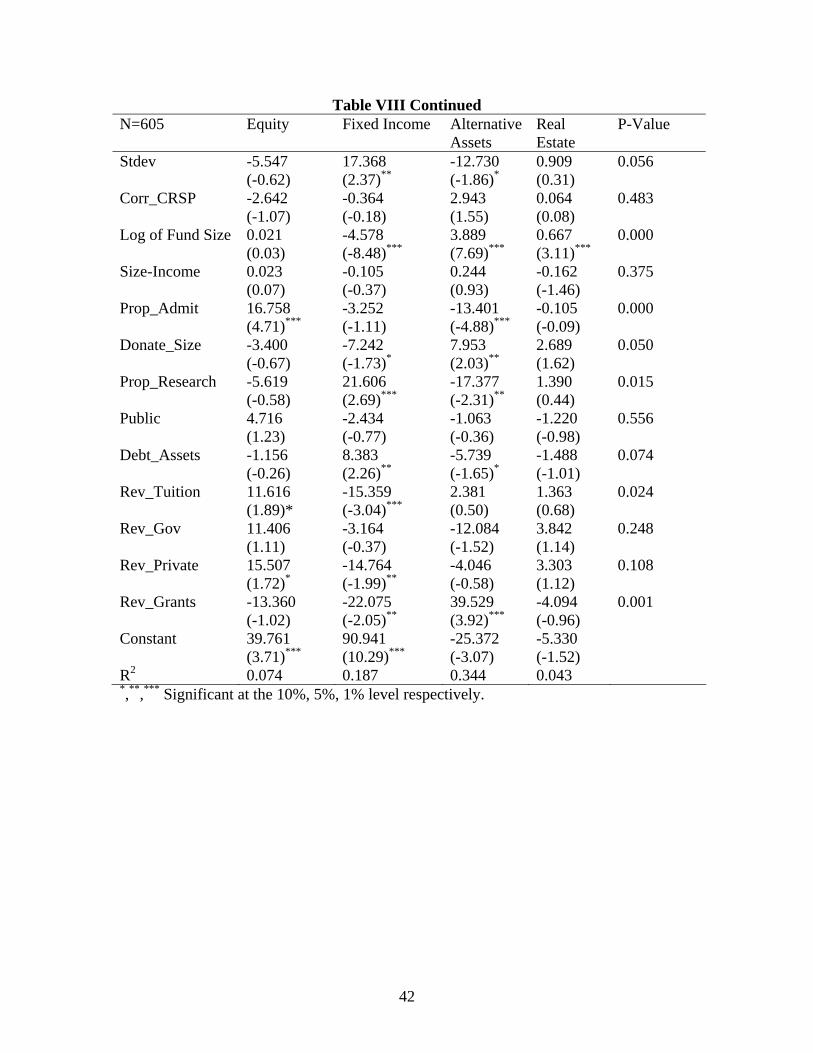
Table VIII is similar to Table VII but also includes the percentage of total revenue
derived from various sources. Controlling for revenue source is an important robustness
test because revenue sources differ not only in their risk, but also in their spending
flexibility which is potentially important. The results for the other variables are generally
similar except for the percentage of the budget spent on research, and the indicator
variable for public universities. The significance of the coefficient on the standard
deviation of non-endowment income is reduced, because a large proportion of Stdev is
explained by revenue source mix.
C. Asset Allocation: Large and Small Funds
This section discusses results for sum-constrained regressions where the sample is
divided based on fund size. Funds with at least $100 million in assets are considered
“large” while the remaining funds are considered “small”. Results for these funds are
reported in Tables IX and X respectively. There are major differences in the R2s across
these two tables; the R2s for the large funds are several times the size of the smaller
fund’s R2s, and in general results are much clearer for large funds. There are two reasons
to expect large and small funds to invest differently. First, minimum investment sizes
27 If a credit constrained university invests a portion of their endowment in fixed income, and simultaneously borrows money at the same terms, they have effectively spent endowment principal without breaching any legal constraints. It is possible that this strategy is reflected in the positive coefficient on fixed income.

24
and other frictions may constrain the portfolio choices of smaller funds. Second, there
are important governance differences between large and small funds.
The 2003 NACUBO NES report shows28 that all funds with $100 million or
more in assets have at least one full time employee working on investment management.
Funds with less than $100 million usually have zero full time employees working on
investment management. As a result it seems reasonable to expect larger funds to invest
in a more sophisticated and professional manner.
The coefficient on the Stdev is highly significant for large funds but completely
insignificant for small funds29. For large funds an increase from the 10th percentile to the
90th percentile of Stdev results in an increase allocation to fixed income of 5.0% and a
decrease in equity and alternative asset investment of 3.3% and 1.9% respectively. Since
background risk is a subtle concept it may be that smaller funds lack the sophistication to
understand and properly implement investment strategies to minimize total university
risk.
Fund size remains significant for both large and small funds. In both cases larger
funds allocate a greater proportion of their endowments to alternative assets and less to
fixed income. This suggests that the selection and monitoring costs of investing in
alternative assets are very large as economies of scale still exist for funds larger than
$100 million.
The ratio of fund size to university income, Size_Income, is significant at the 10%
level for large funds but insignificant for small funds. The hypothesis is that universities
with a large proportion of income derived from the endowment fund will hold safer
28 See Table 13, Part Two, of the 2003 report. Results in this section are reported in aggregate, and aggregated within size categories, but not at the individual fund level. 29 The average Stdev for large funds is 10.1% and 10.9% for small funds.
25
portfolios. Empirically, a high ratio of fund size to income results in higher equity
holdings and lower alternative asset holdings. This is more consistent with a preference
for liquidity by those funds with the greatest dependence on their endowments for a
steady cash flow, than it is with a risk based effect.
The proportion of applicants admitted is highly significant for large funds, but
insignificant for smaller funds. Large selective schools allocate less wealth to equity and
more to alternative assets. Highly selective schools may allocate more to alternative
assets because of either greater financial sophistication or liquidity concerns. However,
there it is not clear why these reasons would not also apply to small endowment funds.
The ratio of donations to fund size is the only variable which is significant for
small funds but not large funds. Universities with greater donations invest less in fixed
income and more in alternative assets suggesting that they are willing to bear greater risk.
Since the ratio of donations to fund size is both larger and more variable for smaller funds
it is not surprising that this principally affects small funds.
Public universities with large endowment funds hold significantly more fixed
income and less alternative assets. Since government funding is one of the safest revenue
sources this appears to be a governance effect and not risk driven. If small funds are
unable to overcome the fixed costs of investing in alternative assets, governance may be
less relevant.
Large funds attached to universities with high debt-to-assets ratio invest
significantly less in alternative assets and more in both equity and fixed income. Since
these funds invest more in both equity and fixed income this cannot be interpreted as a
26
risk effect unless endowment managers consider equity to be safer than alternative assets.
Thus this result appears more consistent with liquidity concerns than direct financial risk.
Overall the results in this section suggest that there are large differences in the
behavior of large and small endowment funds. The allocations of large funds, which can
afford higher quality employees and consultants, are more consistent with the hypotheses
outlined in Section I. These results suggest that while the numerous factors identified by
financial theorists are important it requires considerable sophistication to successfully
implement these theories.
IV. Equity Investment Style
While most portfolio choice theory has been developed under the assumption that
there is a single risky asset, several recent papers have considered equity investment
style. Davis and Willen (2002) show that the correlation between labor income and
equity styles should have a dramatic effect on household portfolio choice. Investors
whose labor income correlates strongly with a particular equity style should avoid or
short that style. Jurek and Viceira (2006) show that there are substantial welfare gains for
investors who explicitly consider investment style.
The NACUBO dataset provides a significant amount of information about all
equity funds including their size category and their value/growth orientation. I break
equity style down into: large growth, large core, large value, mid-cap, and small cap. I
do not break the small and mid-cap stocks into value/growth styles to keep the number of

27
equity styles manageable and to ensure that all styles comprise at least a minimum
amount of total portfolio allocations30.
As in the previous section I estimate a sum constrained system of equations with
one equation for each equity style, as well as one equation for the remaining asset classes.
This allows for a deeper look at equity styles while still meeting the requirement of
logical consistency.
As the intercepts in Table XI show the default equity investment style is large
core but there is substantial ownership of other equity styles. For all the different equity
styles the R2s are very low indicating that it is difficult to predict equity style allocations.
Stdev is not significant; likely this is because, compared to other asset classes, all equity
styles have similar risk characteristics.
Despite the theoretical importance of non-endowment income’s correlations I do
not find any evidence that these correlations affect equity investment. Not only are the
correlation between non-endowment income and both the SMB and HML factors
insignificant – in many cases the signs on the point estimates are opposite to theory’s
predictions. While insignificant results are typically given short shrift in the finance
literature because of the theoretical importance of correlation risk I think this is one case
where insignificant results are both interesting and informative.
Only three variables are significant within the system of equations: fund size, the
proportion of applicants admitted, and the proportion of the budget spent on research.
Larger funds invest less in large core and more in small stocks. Possibly this is driven by
the fact that large funds typically invest in a larger number of distinct equity styles. The
30 All of these equity styles comprise at least 5% of average portfolio allocations except for mid-cap equity which makes up 4.81% of portfolio allocations on average.
28
proportion of applicants admitted is highly significant suggesting that higher quality
universities invest less in large value and small stocks, and more in alternative assets.
This could be a liquidity effect. Since lower quality universities appear to place a higher
value on liquidity they attempt to diversify across equity styles rather than through less
liquid alternative assets. Research intensive universities hold less small stocks and more
fixed income. Small firms are the riskiest of all equity styles so this result is likely driven
by the high risk-aversion of research intensive universities.
Many variables are insignificant in this specification including the correlations
between non-endowment income and both SMB and HML. Overall these results suggest
only very limited ability to explain the equity style allocations of university endowment
funds. It is worth noting however that many of the variables included in this section are
motivated by theoretical models concerned with asset class allocations rather than style
allocations within asset classes. Perhaps as portfolio theory develops to include more
precise theoretical predictions for style allocation it will identify new variables with
greater empirical power.
V. Conclusion
In this paper I use a unique dataset of university endowment fund portfolio
holdings to test the effect of non-tradable risks on these endowment fund’s investment
choices. The results show that many of these non-tradable risks have a significant effect
on portfolio choice.
As predicted by theory, the standard deviation of the growth rate of non-
endowment income has a significant effect on endowment fund portfolio choice.

29
Universities with higher background risk allocate a larger proportion of their portfolio to
fixed income and less to riskier asset classes. However, background risk theory predicts
that the correlations between non-endowment income and asset returns should have a
significant effect on portfolio allocations. I do not find support for this hypothesis at
either the asset class level or across equity styles.
There is strong evidence of large fixed costs associated with investing in
alternative asset classes such as hedge funds, private equity, and venture capital. Large
funds invest a much higher proportion of their wealth in alternative assets. However,
contrary to theory there is no evidence that universities at which the endowment fund
provides a large proportion of revenue invest more conservatively.
Highly selective universities invest less in equities and more in alternative asset
classes. This could be a liquidity effect possibly by the greater revenue flexibility of
highly selective universities due to lower tuition elasticity. Alternatively, as endowment
boards are typically composed of alumni, this could be driven by the greater financial
sophistication of elite university graduates. There is also weaker evidence that a higher
ratio of donations to endowment assets results in less liquid portfolio holdings.
Research intensive universities hold safer portfolios, investing more in fixed
income and less in equities. This suggests that there are high costs associated with
variable research funding that universities are anxious to avoid. There is also significant
evidence of a governance effect in portfolio choice as public universities hold more
transparent assets like equity and fixed income, and less alternative assets.
Universities with a higher ratio of debt-to-assets hold significantly more fixed
income suggesting that credit constraints significantly affect portfolio risk taking. There

30
is also evidence that revenue composition is important. The proportion of revenues from
tuition, as well as public and private grants, significantly affect risk taking.
Overall the results strongly support the hypothesis that background risk and other
non-tradable risks have a significant effect on endowment fund portfolio choices.
Endowment funds take actions that lower the overall risk of the entire university entity
including both its endowment fund and its non-investment operations. However, there is
no evidence that endowment funds take in to account correlation risk and endowment
fund dependence. This suggests that endowments are not currently optimizing their
portfolios with respect to all forms of institutional risk.

31
References
Bodie, Zvi, Robert C. Merton and William F. Samuelson, 1992, Labor Supply Flexibility and Portfolio Choice in a Life-Cycle Model, Journal of Economic Dynamics and Control 16, 427-449. Brown, Keith C., Lorenzo Garlappi and Christian Tiu, 2006, The Troves of Academe: Asset Allocation, Risk Budgeting, and Investment Performance in University Endowment Funds, Working Paper, University of Texas at Austin. Campbell, John Y. and Luis M. Viceira, 2002, Strategic Asset Allocation, Oxford University Press, New York, NY. Carroll, Christopher D. and Andrew A. Samwick, 1997, The Nature of Precautionary Wealth, Journal of Monetary Economics 40, 41-71. Chan, Y. Lewis and Luis M. Viceira, 2000, Asset Allocation with Endogenous Labor Income: The Case of Incomplete Markets, Working Paper, Harvard University. Cocco, Joao F., Francisco J. Gomes and Pascal J. Maenhout, 2005, Consumption and Portfolio Choice over the Life Cycle, Review of Financial Studies 18, 491-533. Davis, Steven J., Felix Kubler and Paul Willen, 2005, Borrowing Costs and the Demand for Equity Over the Life Cycle, Working Paper, University of Chicago. Davis, Steven J. and Paul Willen, 2002, Income Shocks, Asset Returns, and Portfolio Choice, in Olivia S. Mitchell, Zvi Bodie, P. Brett Hammond, and Stephen Zeldes eds.: Innovations in Retirement Financing (University of Pennsylvania Press, Philadelphia, PA). Eeckhoudt, Louis, Christian Gollier and Harris Schlesinger, 1996, Changes in Background Risk and Risk Taking Behavior, Econometrica 64, 683-689. Faig, Miquel and Pauline Shum, 2002, Portfolio Choice in the Presence of Personal Illiquid Projects, Journal of Finance 57, 303-328. Fama, Eugene F. and Kenneth R. French, 1993, Common Risk Factors in the Returns on Stocks and Bonds, Journal of Financial Economics 33, 3-56. Gollier, Christian, 2001, The Economics of Risk and Time, MIT Press, Cambridge, MA. Gollier, Christian and John W. Pratt, 1996, Risk Vulnerability and the Tempering Effect of Background Risk, Econometrica 64, 1109-1123 Gomes, Francisco and Alexander Michaelides, 2005, Optimal Life-Cycle Asset Allocation: Understanding the Empirical Evidence, Journal of Finance 60, 869-904.

32
Guiso, Luigi, Tullio Jappelli and Daniele Terlizzese, 1996, Income Risk, Borrowing Constraints, and Portfolio Choice, American Economic Review 86, 158-172. Haliassos, Michael and Carol C. Bertaut, 1995, Why do so Few Hold Stocks?, Economic Journal 105, 1110-1129. Hansmann, Henry, 1990, Why Do Universities Have Endowments?, Journal of Legal Studies 19, 3-42. Heaton, John and Deborah Lucas, 1997, Market Frictions, Savings Behavior, and Portfolio Choice, Macroeconomic Dynamics 1, 76-101. Heaton, John and Deborah Lucas, 2000, Portfolio Choice in the Presence of Background Risk, Economic Journal 110, 1-26. Jagannathan, Ravi and Narayana R. Kocherlakota, 1996, Why Should Older People Invest Less in Stocks Than Younger People?, Federal Reserve Bank of Minneapolis Quarterly Review 20, 11-23. Jurek, Jakub W. and Luis M. Viceira, 2006, Optimal Value and Growth Tilts in Long-Horizon Portfolios, Working Paper, Harvard University. Kimball, Miles S., 1993, Standard Risk Aversion, Econometrica 61, 589-611. Lakonishok, Josef, Andrei Shleifer and Robert W. Vishny, 1992, The Structure and Performance of the Money Management Industry, Brookings Papers on Economic Activity: Microeconomics, 339-391. Lerner, Josh and Antoinette Schoar, 2004, The Illiquidity Puzzle: Theory and Evidence from Private Equity, Journal of Financial Economics 72, 3-40. Massa, Massimo and Andrei Simonov, 2006, Hedging, Familiarity and Portfolio Choice, Review of Financial Studies 19, 633-685. McGuire, Timothy W. and Doyle L. Weiss, 1976, Logically Consistent Market Share Models II, Journal of Marketing Research 13, 296-302. Merton, Robert C., 1992, Optimal Investment Strategies for University Endowment Funds, in C.T. Clotfelter and M. Rothschild, eds.: The Economics of Higher Education, (University of Chicago Press, Chicago, Ill). Pratt John W., and Richard J. Zeckhauser, 1987, Proper Risk Aversion, Econometrica 55, 143-154.

33
Timmermann, Allan and David Blake, 2005, International Asset Allocation with Time-Varying Investment Opportunities, Journal of Business 78, 71-98. Viceira, Luis M., 2001, Optimal Portfolio Choice for Long-Horizon Investors with Nontradable Labor Income, Journal of Finance 56, 433-470. Vissing-Jorgenson, Annette, 2002, Towards an Explanation of Household Portfolio Choice Heterogeneity: Nonfinancial Income and Participation Cost Structures, Working Paper, University of Chicago.
34
Table I Endowment Funds
This table summarizes information about endowment funds. Fund size is the dollar value of endowment funds as of the end of fiscal 2003. Mean 25th% Median 75th% Fund Size
286,497,800 28,386,000 67,260,500 185,139,800
Fund Size – Public
285,545,400 22,182,500 58,511,500 240,544,800
Fund Size – Private 286,940,900 31,105,250 68,422,000 167,529,800

35
Table II Endowment Fund Summary Statistics
This table summarizes the holdings of endowment funds. The first column shows the percentage of institutions that hold a given asset. The second column shows the value weighted average allocation conditional on ownership. Value weighting uses the dollar value of each university’s endowment fund as of the end of fiscal 2003. Column three shows the equal weighted average allocation across institutions conditional on ownership.
Panel A: Asset Allocation Percent Holding
Asset Value Weighted Average
Equal Weighted Average
Equities 99.6% 48.7% 57.4% Fixed Income 98.7% 20.7% 26.1% Real Estate 54.2% 5.2% 5.0% Alternative Assets 70.6% 22.9% 14.1% Cash 72.4% 2.7% 5.5%
Panel B: Equity
Percent Holding Asset
Value Weighted Average
Equal Weighted Average
Large Cap 97.6% 39.2% 46.3% Mid Cap 43.0% 9.2% 11.2% Small Cap 62.6% 8.5% 10.4% Micro Cap 5.0% 4.5% 12.8% Growth 64.3% 15.0% 18.9% Core 91.3% 30.7% 34.7% Value 66.6% 17.0% 20.0% Large Growth 54.2% 10.8% 15.5% Large Core 87.4% 28.4% 31.9% Large Value 55.1% 13.0% 16.0%
Panel C: Real Estate
Percent Holding Asset
Value Weighted Average
Equal Weighted Average
Public (REITS) 25.1% 3.5% 3.9% Private 39.9% 4.3% 4.3%
Panel D: Alternative Assets
Percent Holding Asset
Value Weighted Average
Equal Weighted Average
Hedge Funds 45.8% 16.9% 13.2% Venture Capital 34.0% 3.2% 2.2% Private Equity 34.5% 4.8% 3.6% Oil & Gas 12.6% 2.3% 2.2% Commodities 4.3% 4.0% 3.4%

36
Table III Variable Definitions
Variable Name Definition Fund Size The dollar value of endowment funds as of the end of fiscal 2003
Income Total non-endowment income
Rev_Tuition Total revenue from tuition and fees
Rev_Gov Total revenue from government appropriations
Rev_Private Total revenues from non-government grants, non-endowment gifts,
and contracts
Rev_Grants Total revenues from government grants and contracts
Rev_Other All non-endowment revenue that does not belong in another category
Prop_Research The proportion of Income spent on research
Avg_Donate The annual inflation adjusted dollar value of donations averaged over the previous five years
Donate_Size The ratio of Avg_Donate to Fund Size
Debt_Assets The ratio of total debts to university total non-endowment assets
Prop_Admit The percentage of undergraduate applicants admitted to the university
Stdev Standard Deviation of the growth rate of non-endowment income
Corr_CRSP Correlation with CRSP Value Weighted Index
Corr_HML Correlation with HML
Corr_SMB Correlation with SMB
Size-Income Endowment Size to Non-Endowment Income
Public An indicator variable which equals one for public universities

37
Table IV University Summary Statistics
This table contains summary statistics about universities’ finances and background risk. Panel A shows information on financial information. Endowment fund size is the total reported dollar value of the endowment fund as of the end of the 2003 fiscal year. Average donations-previous 5 years is the average annual donation amount over the last 5-years. Non-endowment income is the 2002-2003 academic year university total revenue, less revenue received from the endowment fund. Panel B shows information about the background risk of universities in the sample. Standard deviation of non-endowment income is the standard deviation of the percentage change in non-endowment income calculated from the 1983-1984 academic year through the 2002-2003 academic year. Correlations are calculated between the return on various market indexes and the percentage change in non-endowment income.
Panel A: Financial Information Mean 25th% Median 75th% Income 312,630,200 36,586,250 75,547,540 238,149,700 Rev_Tuition 41.1% 0.230 0.422 0.574 Rev_Gov 11.5% 0.0% 0.0% 26.9% Rev_Private 15.1% 4.4% 11.9% 22.0% Rev_Grants 8.6% 2.2% 5.3% 13.3% Rev_Other 23.6% 16.3% 21.8% 27.4% Prop_Research 6.1% 0.0% 0.2% 7.9% Avg_Donate 24,665,480 4,087,941 8,928,014 19,758,800 Donate_Size 0.166 0.072 0.118 0.204 Debt_Assets 0.310 0.204 0.298 0.398 Prop_Admit 0.683 0.591 0.725 0.813
Panel B: Background Risk Information Mean 25th% Median 75th% Stdev 10.6% 5.70% 8.30% 12.0% Corr_CRSP -0.011 -0.182 -0.001 0.159 Corr_HML -0.024 -0.207 -0.037 0.150 Corr_SMB -0.053 -0.228 -0.042 0.130 Size-Income 2.04 0.325 0.811 1.89

38
Table V Average Variable Values by Standard Deviation Quartiles
This table shows the average values of different variables within each quartile of standard deviation. The sample is split into four groups based on the standard deviation of non-endowment income. The table shows the average value of each variable within each standard deviation sorted group. Variable Lowest
Quartile 25% - 50% 50% - 75% Top Quartile
Fund Size 333,266,500 197,761,100 206,706,500 405,233,700 Corr_CRSP 0.026 -0.073 -0.035 0.038 Size-Income 0.703 1.088 1.729 3.248 Prop_Admit 0.666 0.701 0.7003 0.663 Donate_Size 0.156 0.167 0.164 0.176 Prop_Research 0.114 0.046 0.029 0.055 Public 0.714 0.280 0.143 0.133 Debt_Assets 0.333 0.329 0.308 0.271 Income 577,597,100 257,662,200 190,191,700 227,105,100 Rev_Tuition 0.293 0.455 0.499 0.397 Rev_Gov 0.251 0.108 0.055 0.047 Rev_Private 0.138 0.078 0.063 0.065 Rev_Grants 0.067 0.124 0.161 0.253 Rev_Other 0.251 0.235 0.221 0.238

39
Table VI Allocation to Risky Assets
This table shows Tobit estimates of allocations to risky assets. In the first two columns risky assets is defined as the sum of equity and alternative assets (hedge funds, venture capital, alternative assets, and commodities). In columns three and found risky assets is defined as the sum of equity, alternative assets, real estate and high-yield bonds. N = 605 Equity and Alternative
Assets Equity, Alternative Assets, Real
Estate and High-Yield Bonds
Model 1 Model 2
Model 1
Model 2
Stdev -19.235 (-2.56)***
-19.186 (-2.36)**
-17.973 (-2.47)**
-18.314 (-2.33)**
Corr_CRSP -0.097 (-0.04)
-0.141 (-0.06)
0.150 (0.07)
-0.087 (-0.04)
Log of Fund Size 3.819 (6.95)***
4.121 (6.86)***
4.412 (8.30)***
4.794 (8.25)***
Size-Income 0.117 (0.40)
0.091 (0.29)
-0.000 (-0.00)
-0.076 (-0.25)
Prop_Admit 2.813 (0.86)
2.713 (0.83)
2.680 (0.85)
2.589 (0.82)
Donate_Size 2.573 (0.59)
2.112 (0.45)
5.377 (1.26)
4.734 (1.05)
Prop_Research -14.328 (-2.03)**
-22.153 (-2.48)**
-15.220 (-2.23)**
-20.720 (-2.39)**
Public -1.033 (-0.77)
3.387 (0.97)
-1.959 (-1.51)
2.161 (0.64)
Debt_Assets -7.847 (-2.01)**
-7.931 (-1.92)*
-9.902 (-2.62)***
-9.429 (-2.36)**
Rev_Tuition 13.152 (2.34)**
14.484 (2.66)***
Rev_Gov 0.637 (0.07)
4.512 (0.49)
Rev_Private 14.750 (1.79)*
18.144 (2.27)**
Rev_Grants 24.582 (2.05)**
20.403 (1.76)*
Constant 26.062 (3.52)***
12.120 (1.23)
22.803 (3.18)***
6.727 (0.71)
R2 0.020 0.022 0.026 0.028 *,**,*** Significant at the 10%, 5%, 1% level respectively.
40
Table VII Sum Constrained Model of Portfolio Shares
This table shows the results of a sum constrained model of portfolio allocation. There is one equation per asset class and the equations are jointly estimated with the constraint that the intercepts must sum to 100 and the coefficients on each independent variable must sum to zero. The final column shows the results of F-tests of the overall significance of each variable within the system of equations. Stdev is the standard deviation of non-endowment income. Corr_Crsp is the correlation between non-endowment income and the CRSP value weighted index. Size_Income is the ratio of endowment fund size to total non-endowment income. Prop_Admit is the proportion of undergraduate applicants admitted. Donate size is the ratio of donations to endowment fund size. Prop_Research is the proportion of total non-endowment revenue spent on research. Public is an indicator variable which equals one for public universities. Debt_Assets is the ratio of total university debt to non-endowment assets. N=605 Equity Fixed
Income Alternative Assets
Real Estate P-Value
Stdev -5.812 (-0.71)
18.635 (2.75)***
-14.073 (-2.20)**
1.250 (0.47)
0.016
Corr_CRSP -1.920 (-0.78)
-0.479 (-0.24)
2.144 (1.12)
0.255 (0.32)
0.715
Log of Fund Size -0.374 (-0.62)
-4.180 (-8.45)***
3.968 (8.51)***
0.586 (3.00)***
0.000
Size-Income 0.169 (0.53)
-0.113 (-0.43)
0.058 (0.23)
-0.114 (-1.10)
0.679
Prop_Admit 17.124 (4.82)***
-3.411 (-1.16)
-13.601 (-4.91)***
-0.112 (-0.10)
0.000
Donate_Size -3.107 (-0.65)
-7.145 (-1.80)*
7.399 (1.98)*
2.853 (1.83)*
0.036
Prop_Research -15.481 (-2.01)**
15.566 (2.45)**
0.819 (0.14)
-0.905 (-0.36)
0.084
Public 2.456 (1.68)*
1.977 (1.64)*
-3.507 (-3.08)***
-0.926 (-1.94)*
0.004
Debt_Assets -2.486 (-0.58)
8.047 (2.29)**
-3.545 (-1.07)
-2.016 (-1.45)
0.073
Constant 52.792 (6.54)***
74.684 (11.20)
-24.296 (-3.87)***
-3.180 (-1.21)
R2 0.061 0.172 0.323 0.037 *,**,*** Significant at the 10%, 5%, 1% level respectively.
41
Table VIII Sum Constrained Model of Portfolio Shares
This table shows the results of a sum constrained model of portfolio allocation. There is one equation per asset class and the equations are jointly estimated with the constraint that the intercepts must sum to 100 and the coefficients on each independent variable must sum to zero across the system. The final column shows the results of F-tests of the overall significance of each variable within the system of equations. Stdev is the standard deviation of non-endowment income. Corr_Crsp is the correlation between non-endowment income and the CRSP value weighted index. Size-Income is the ratio of endowment fund size to total non-endowment income. Prop_Admit is the proportion of undergraduate applicants admitted. Donate size is the ratio of donations to endowment fund size. Prop_Research is the proportion of total non-endowment revenue spent on research. Public is an indicator variable which equals one for public universities. Debt_Assets is the ratio of total university debt to non-endowment assets. The last four variables are the proportion of total non-endowment revenue from: tuition; government appropriations; private gifts, grants and contracts; and government grants and contracts.
42
Table VIII Continued N=605 Equity Fixed Income Alternative
Assets Real Estate
P-Value
Stdev -5.547 (-0.62)
17.368 (2.37)**
-12.730 (-1.86)*
0.909 (0.31)
0.056
Corr_CRSP -2.642 (-1.07)
-0.364 (-0.18)
2.943 (1.55)
0.064 (0.08)
0.483
Log of Fund Size 0.021 (0.03)
-4.578 (-8.48)***
3.889 (7.69)***
0.667 (3.11)***
0.000
Size-Income 0.023 (0.07)
-0.105 (-0.37)
0.244 (0.93)
-0.162 (-1.46)
0.375
Prop_Admit 16.758 (4.71)***
-3.252 (-1.11)
-13.401 (-4.88)***
-0.105 (-0.09)
0.000
Donate_Size -3.400 (-0.67)
-7.242 (-1.73)*
7.953 (2.03)**
2.689 (1.62)
0.050
Prop_Research -5.619 (-0.58)
21.606 (2.69)***
-17.377 (-2.31)**
1.390 (0.44)
0.015
Public 4.716 (1.23)
-2.434 (-0.77)
-1.063 (-0.36)
-1.220 (-0.98)
0.556
Debt_Assets -1.156 (-0.26)
8.383 (2.26)**
-5.739 (-1.65)*
-1.488 (-1.01)
0.074
Rev_Tuition 11.616 (1.89)*
-15.359 (-3.04)***
2.381 (0.50)
1.363 (0.68)
0.024
Rev_Gov 11.406 (1.11)
-3.164 (-0.37)
-12.084 (-1.52)
3.842 (1.14)
0.248
Rev_Private 15.507 (1.72)*
-14.764 (-1.99)**
-4.046 (-0.58)
3.303 (1.12)
0.108
Rev_Grants -13.360 (-1.02)
-22.075 (-2.05)**
39.529 (3.92)***
-4.094 (-0.96)
0.001
Constant 39.761 (3.71)***
90.941 (10.29)***
-25.372 (-3.07)
-5.330 (-1.52)
R2 0.074 0.187 0.344 0.043 *,**,*** Significant at the 10%, 5%, 1% level respectively.

43
Table IX Sum Constrained Model of Portfolio Shares: Funds Larger than $100 Million
This table shows the results of a sum constrained model of portfolio allocation. There is one equation per asset class and the equations are jointly estimated with the constraint that the intercepts must sum to 100 and the coefficients on each independent variable must sum to zero across the system. The final column shows the results of F-tests of the overall significance of each variable within the system of equations. Stdev is the standard deviation of non-endowment income. Corr_Crsp is the correlation between non-endowment income and the CRSP value weighted index. Size-Income is the ratio of endowment fund size to total non-endowment income. Prop_Admit is the proportion of undergraduate applicants admitted. Donate size is the ratio of donations to endowment fund size. Prop_Research is the proportion of total non-endowment revenue spent on research. Public is an indicator variable which equals one for public universities. Debt_Assets is the ratio of total university debt to non-endowment assets. N=259 Equity Fixed
Income Alternative Assets
Real Estate
P-Value
Stdev -18.925 (-1.75)*
28.815 (3.67)***
-10.635 (-1.02)
0.745 (0.25)
0.002
Corr_CRSP -3.463 (-1.00)
0.432 (0.17)
3.781 (1.13)
-0.750 (-0.80)
0.539
Log of Fund Size -1.738 (-1.60)
-3.862 (-4.90)***
4.737 (4.52)***
0.863 (2.91)***
0.000
Size-Income 0.868 (2.26)**
-0.020 (-0.07)
-0.685 (-1.85)*
-0.163 (-1.55)
0.081
Prop_Admit 19.662 (4.10)***
-2.883 (-0.83)
-16.358 (-3.53)***
-0.421 (-0.32)
0.001
Donate_Size 1.791 (0.17)
9.189 (1.21)
-9.746 (-0.96)
-1.234 (-0.43)
0.603
Prop_Research -3.704 (-0.42)
9.300 (1.46)
-4.520 (-0.53)
-1.076 (-0.45)
0.542
Public 3.103 (1.38)
3.946 (2.42)**
-5.863 (-2.71)***
-1.185 (-1.94)*
0.007
Debt_Assets 14.327 (1.82)*
10.650 (1.86)*
-21.587 (2.84)***
-3.390 (1.58)
0.014
Constant 60.624 (4.05)***
66.574 (6.13)***
-21.640 (-1.50)
-5.557 (-1.36)
R2 0.166 0.198 0.282 0.076 *,**,*** Significant at the 10%, 5%, 1% level respectively.

44
Table X Sum Constrained Model of Portfolio Shares: Funds Smaller than $100 Million
This table shows the results of a sum constrained model of portfolio allocation. There is one equation per asset class and the equations are jointly estimated with the constraint that the intercepts must sum to 100 and the coefficients on each independent variable must sum to zero across the system. The final column shows the results of F-tests of the overall significance of each variable within the system of equations. Stdev is the standard deviation of non-endowment income. Corr_Crsp is the correlation between non-endowment income and the CRSP value weighted index. Size-Income is the ratio of endowment fund size to total non-endowment income. Prop_Admit is the proportion of undergraduate applicants admitted. Donate size is the ratio of donations to endowment fund size. Prop_Research is the proportion of total non-endowment revenue spent on research. Public is an indicator variable which equals one for public universities. Debt_Assets is the ratio of total university debt to non-endowment assets. N=346 Equity Fixed Income Alternative
Assets Real Estate
P-Value
Stdev -3.857 (-0.31)
5.783 (0.52)
3.863 (-0.53)
1.937 (0.43)
0.886
Corr_CRSP -2.141 (-0.61)
0.795 (0.25)
0.452 (0.22)
0.894 (0.70)
0.879
Log of Fund Size 1.750 (1.49)
-5.099 (-4.83)***
2.671 (3.85)***
0.678 (1.58)
0.000
Size-Income 0.733 (0.91)
-0.610 (-0.84)
-0.083 (-0.17)
-0.040 (-0.14)
0.830
Prop_Admit 6.559 (1.12)
-7.470 (-1.42)
0.121 (0.04)
0.789 (0.37)
0.538
Donate_Size -0.529 (-0.09)
-12.002 (-2.37)**
8.937 (2.68)***
3.594 (1.74)*
0.004
Prop_Research -34.721 (-2.18)**
28.964 (2.03)**
4.272 (0.45)
1.484 (0.26)
0.164
Public 2.751 (1.25)
-1.392 (-0.71)
-0.666 (-0.51)
-0.693 (-0.87)
0.602
Debt_Assets -4.620 (-0.89)
5.080 (1.09)
1.067 (0.35)
-1.526 (-0.81)
0.559
Constant 38.755 (2.78)***
91.573 (7.32)***
-25.131 (-3.05)***
-5.197 (-1.02)
R2 0.026 0.082 0.065 0.028 *,**,*** Significant at the 10%, 5%, 1% level respectively.
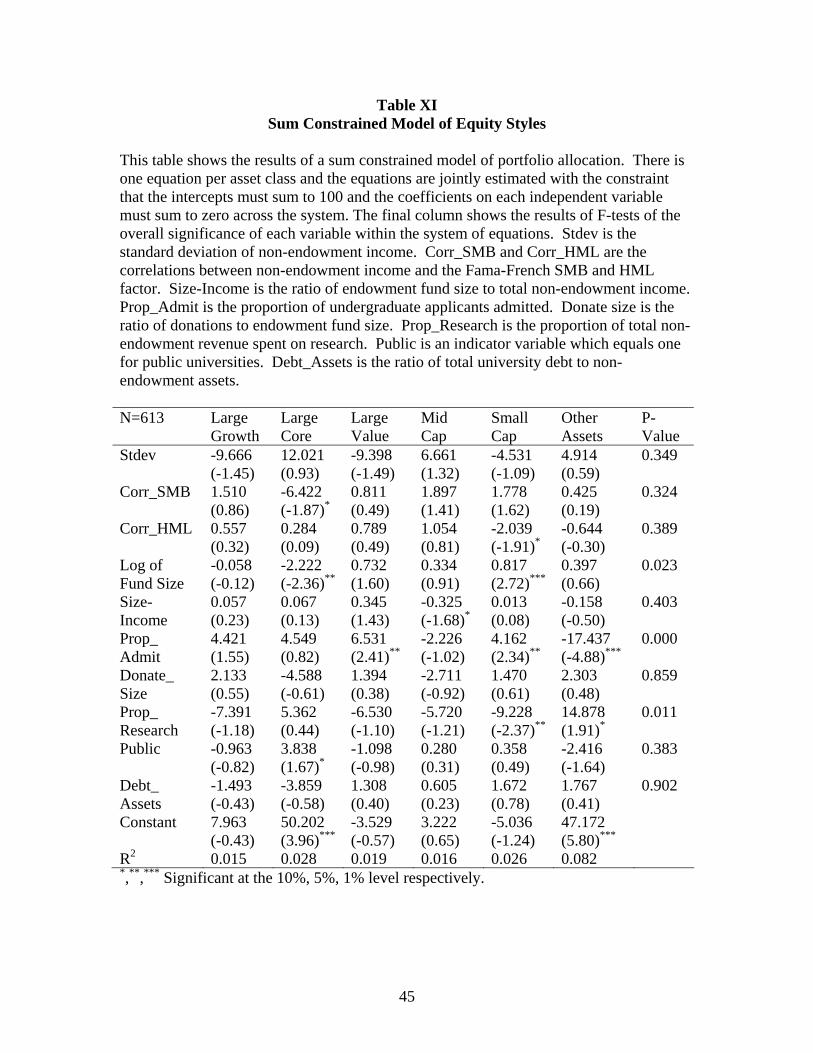
45
Table XI Sum Constrained Model of Equity Styles
This table shows the results of a sum constrained model of portfolio allocation. There is one equation per asset class and the equations are jointly estimated with the constraint that the intercepts must sum to 100 and the coefficients on each independent variable must sum to zero across the system. The final column shows the results of F-tests of the overall significance of each variable within the system of equations. Stdev is the standard deviation of non-endowment income. Corr_SMB and Corr_HML are the correlations between non-endowment income and the Fama-French SMB and HML factor. Size-Income is the ratio of endowment fund size to total non-endowment income. Prop_Admit is the proportion of undergraduate applicants admitted. Donate size is the ratio of donations to endowment fund size. Prop_Research is the proportion of total non-endowment revenue spent on research. Public is an indicator variable which equals one for public universities. Debt_Assets is the ratio of total university debt to non-endowment assets. N=613 Large
Growth Large Core
Large Value
Mid Cap
Small Cap
Other Assets
P-Value
Stdev -9.666 (-1.45)
12.021 (0.93)
-9.398 (-1.49)
6.661 (1.32)
-4.531 (-1.09)
4.914 (0.59)
0.349
Corr_SMB 1.510 (0.86)
-6.422 (-1.87)*
0.811 (0.49)
1.897 (1.41)
1.778 (1.62)
0.425 (0.19)
0.324
Corr_HML 0.557 (0.32)
0.284 (0.09)
0.789 (0.49)
1.054 (0.81)
-2.039 (-1.91)*
-0.644 (-0.30)
0.389
Log of Fund Size
-0.058 (-0.12)
-2.222 (-2.36)**
0.732 (1.60)
0.334 (0.91)
0.817 (2.72)***
0.397 (0.66)
0.023
Size-Income
0.057 (0.23)
0.067 (0.13)
0.345 (1.43)
-0.325 (-1.68)*
0.013 (0.08)
-0.158 (-0.50)
0.403
Prop_ Admit
4.421 (1.55)
4.549 (0.82)
6.531 (2.41)**
-2.226 (-1.02)
4.162 (2.34)**
-17.437 (-4.88)***
0.000
Donate_ Size
2.133 (0.55)
-4.588 (-0.61)
1.394 (0.38)
-2.711 (-0.92)
1.470 (0.61)
2.303 (0.48)
0.859
Prop_ Research
-7.391 (-1.18)
5.362 (0.44)
-6.530 (-1.10)
-5.720 (-1.21)
-9.228 (-2.37)**
14.878 (1.91)*
0.011
Public -0.963 (-0.82)
3.838 (1.67)*
-1.098 (-0.98)
0.280 (0.31)
0.358 (0.49)
-2.416 (-1.64)
0.383
Debt_ Assets
-1.493 (-0.43)
-3.859 (-0.58)
1.308 (0.40)
0.605 (0.23)
1.672 (0.78)
1.767 (0.41)
0.902
Constant 7.963 (-0.43)
50.202 (3.96)***
-3.529 (-0.57)
3.222 (0.65)
-5.036 (-1.24)
47.172 (5.80)***
R2 0.015 0.028 0.019 0.016 0.026 0.082 *,**,*** Significant at the 10%, 5%, 1% level respectively.


