
1
PHYTOREMEDIATION OF POLLUTED SOILS: RECENT PROGRESS AND 1
DEVELOPMENTS 2
3
Assessment of trace elements phytoavailability in compost amended soils using 4
different methodologies 5
6
Lisa Ciadamidaro a, Markus Puschenreiter
b, Jakob Santner
b, Walter W. Wenzel 7
b, Paula Madejón
a*, Engracia Madejón
a 8
9
a Instituto de Recursos Naturales y Agrobiología de Sevilla (IRNAS), CSIC, Avenida 10
Reina Mercedes, 10. P.O. Box 1052, 41080- Seville, Spain. 11
b BOKU, University of Natural Resources and Life Sciences Vienna, Department of 12
Forest and Soil Sciences, Konrad Lorenz Straße 24, A-3430 Tulln, Austria 13
14
* e-mail: [email protected] 15
16
Postprint of: Journal of Soils and Sediments 17(5): 1251-1261 (2017)
2
Abstract 17
Purpose: This study evaluates the effects of two soil amendments and the growth of two 18
plant species on labile trace elements (TE) fractions in two different contaminated soils. 19
Materials and methods: We studied the effects of two organic amendments (biosolid 20
compost and alperujo compost) and two plant species (Medicago polymorpha and Poa 21
annua) on pH, total organic carbon (TOC) and TE availability, by three extraction 22
methods (CaCl2 aqueous solution, Soil Pore Water-SPW and Diffusive Gradient in Thin 23
Film-DGT), in two contaminated soils with contrasting pH values (Aznalcázar, 6.32 and 24
Vicario, 3.23) in a 118-days pot experiment. The effects of the composts on labile TE 25
fractions were compared with elements concentrations in plants. 26
Results and discussion: No relevant effects of amendments and plants were found on the 27
physical and chemical characteristics of the Aznalcázar soil. However, the addition of 28
amendments was essential for plant species growing in the acid Vicario soil. In this soil, 29
amendments and plant growth increased pH and TOC and reduced substantially TE 30
bioavailability. Although absolute values of bioavailable TE contents obtained by the 31
three methods were very different and followed the trend CaCl2 extraction>SPW>DGT, 32
these values follow a similar behavior in the two studied soils and for the two species. 33
Conclusions: the results demonstrate that the application of organic amendments are 34
suitable for remediating acid TE-contaminated soils, for the establishment of a 35
vegetation cover on previously bare soils for reducing wind and water erosion and for 36
reducing labile TE fractions to prevent leaching of pollutants into subsoil or 37
groundwater layers. Moreover the results obtained in this study pointed out that under 38
microcosm conditions the three methods tested (CaCl2 extraction, SPW and DGT) to 39
predict TE bioavailability were highly correlated. 40
Keywords CaCl2 extraction • DGT • Soil pore water • Soil remediation 41
42
3
1 Introduction 43
In the last century the human activity has been responsible for the contamination of a 44
vast number of sites worldwide (He et al. 2005). Trace elements (TE) have been 45
deposited in soils through agricultural and industrial activities and have subsequently 46
led to considerable detrimental effects on the environment and human health (Adriano 47
2001). 48
Trace elements remain in soils for very long periods of time (Brookes 1995). The extent 49
of TE contamination is typically characterized by the total concentration of TE. 50
However, this is a poor indicator of potential metal toxicity, since it does not give 51
information on the ability of the elements to be absorbed by plants or the transfer of 52
toxic elements through the food chain (Morel 1997). Bioavailable TE concentrations 53
reflect the greatest potential risks for the ecosystem (Adriano et al. 2004). The 54
bioavailable contaminant fraction in soil, typically, refers to the most labile fraction 55
(sum of soluble and weakly absorbed fractions) (Adriano 2001). Numerous procedures 56
have been developed to estimate labile TE fractions in soils. Extraction with weak 57
neutral salt solutions (0.01 mol L-1
CaCl2; 0.1 mol L-1
NaNO3) is commonly used for 58
the assessment of the exchangeable fraction of TE in soils. In addition, the extraction of 59
interstitial soil pore water (SPW) is considered a valid alternative for the assessment of 60
TE availability (Beesley et al. 2010; Clemente et al. 2008; Ciadamidaro et al. 2013) as it 61
isolates the aqueous phase to which plant roots and microorganisms are exposed (Nolan 62
et al. 2003). Moreover, SPW extraction does not require highly invasive or destructive 63
procedures and allows repeated sampling (Clemente et al. 2008). However, several 64
authors have shown that extractable or soluble TE fractions often show poor correlation 65
with concentrations in organisms like plants (Zhang et al. 2001; Degryse et al. 2009; 66
Tandy et al. 2011). A holistic method, the diffusive gradient in thin films (DGT), was 67
4
proposed by Zhang and Davison (1995) as a tool for quantifying exchange between the 68
solid phase and the soil solution. This technique, which is a diffusion driven passive 69
sampling device developed and used for quantitative determination of labile metal 70
fractions, has been reported to measure satisfactorily metal bioavailability (Zhang et al. 71
2001; Degryse et al. 2009; Zhang and Davison 2006). The DGT is a more mechanistic 72
surrogate of diffusion controlled plant uptake since it acts as a sink, like plant roots, and 73
accounts for diffusion of elements to the root surface, driven by depletion and 74
subsequent resupply from the solid phase (Degryse et al. 2009). 75
The objective of this study was to evaluate the short-term effects of two soil 76
amendments and the growth of two plant species, Medicago polymorpha L. and Poa 77
annua L., on the labile TE fractions in two different contaminated soils. To assess 78
which of the amendments and plant species were better improved soil quality, available 79
TE concentrations were determined by using three different procedures (0.01 mol L-1
80
CaCl2 extraction, SPW and DGT). We also compared these results with the response of 81
plants to the changed TE bioavailability upon amendment addition. This study 82
hypothesized that the addition of the amendments and the growth of plant species would 83
influence available TE fractions by changing soil pH and organic C contents. It was also 84
hypothesized that the different methods to predict TE availability to plant could be 85
comparable and correlated with plant uptake. 86
87
2 Materials and methods 88
2.1 Soil and compost characterization 89
The experiment was carried out using two TE contaminated soils with different pH 90
values, Aznalcázar (AZ) and Vicario (V) (Table 1). Both soils were collected in an area 91
affected by a mine sludge spill, (Aznalcóllar mine accident; Grimalt et al. 1999). Soils 92
5
were collected from the upper 25 cm of soil. Soil AZ was a sandy loam with neutral pH 93
and relatively high TOC concentrations; whereas soil V was a very acid loam with 94
relatively low TOC concentrations. 95
Two different composts were used as amendments: Biosolid compost (BC) and 96
“alperujo” compost (AC), since they were locally available at low cost and were already 97
successfully applied in the affected area (Burgos et al. 2010). Biosolid compost was 98
collected from the composting plant “EMASESA” (Seville, Spain) and was produced 99
from sewage and pruning from parks and gardens in the city of Seville. The “alperujo 100
compost” was prepared by the cooperative "Coto Bajo" Guadalcázar (Córdoba, Spain) 101
by mixing legume residues and manure from organic farming. The alperujo compost 102
was more alkaline but contained lower total N concentrations than the biosolids 103
compost (Table 1). 104
Compost samples were analysed following standard procedures for soil improvers and 105
growing media of the European Committee for Standardization (CEN). Moisture was 106
determined and results were expressed on a dry matter basis. Fresh compost samples 107
were used for the determination of electrical conductivity and pH in a 1:5 (V:V) aqueous 108
extract. The organic matter content (OM) was determined by dry combustion at 450 °C 109
and total N content was determined by distillation after Kjeldahl digestion. Water-110
soluble organic carbon was determined using a TOC analyser (Simadzu TOC-VCSCH) 111
after water extraction. Nutrients and TE contents were determined after aqua regia 112
digestion in a microwave oven by ICP–OES. Compost samples from the WEPAL 113
programs were also analyzed for quality control of analytical procedures. The results 114
obtained for these samples agreed ±5% with the certified results. 115
116
2.2 Experimental design and samplings 117
6
The experiment was carried out in a greenhouse using pots (3 L of volume each) that 118
were filled with the experimental soils. A factorial design was used consisting of the 119
two soil types, two plant species, and three compost treatments (control with no 120
compost (control, CO), biosolid compost, BC, and alpurujo compost, AC) with three 121
replications for a total of 36 pots. The pots were distributed following a randomized 122
block design. The amendments were added in the upper layer of the pots and mixed 123
with the top 10-15 cm of soil. The application rate was 26 g kg-1
, corresponding to a 124
field dose of 50,000 kg ha-1
. No fertilizers were added to the pots during the whole 125
experiment. 126
Two plant species were selected for the experiment: ME, Medicago polymorpha 127
(Leguminosae) and PO, Poa annua (Poaceae). Both species are common in the 128
Mediterranean area and also occur in the region where the soils were obtained (Madejón 129
et al. 2006). 130
At the beginning of the experiment, ‘Rhizon’ samplers (MOM 10 cm, Eijkelkamp 131
Agrisearch Equipment, The Netherlands) were inserted laterally in three pots per soil, 132
species and treatment (total of 36 pots). 133
Four days after the addition of amendments, bulk soil samples (initial sampling) were 134
collected from the top 10 cm of each pot using an auger. Immediately after this 135
sampling the seeds were sown. Plant germination was relatively consistent for all the 136
plants and treatments, excepted in control pots with the acid soil (V) without 137
amendments where no successful seed germination occurred. Plants were grown in the 138
pots from November 2011 to March 2012, and the pots were regularly irrigated with tap 139
water from the bottom (about twice a week) to meet the water demand of the plants 140
(water holding capacity 32.4 % for AZ soil and 29.6 % for V soil). The greenhouse 141
temperature was maintained between 19 ºC and 29 ºC. Minimum temperatures occurred 142
7
between 6 a.m. and 7 a.m. (19–19.5 ºC) and maximum temperatures between 5 p.m. and 143
6 p.m. (28.6–29 ºC). 144
Plant biomass was estimated by two harvests: 68 and 118 days after the sowing. In both 145
samplings biomass was weighted. Plant shoots were washed for 15 s with a 0.1 mol L-1
146
HCl (30 %, Suprapur) solution then for 10 s with deionised water. Washed samples 147
were oven dried at 70 °C. Dried plant material was ground and passed through a 500 μm 148
mesh stainless-steel sieve (MF 10 basic, IKA Labortechnik) prior to analysis. After 118 149
days of plant growing SPW was sampled using removable needles attached by a Luer-150
Lock connection to the sampler and vacuum tubes. Finally soil samples at 0–10 cm 151
depth were also taken. 152
Soil samples were air-dried and passed through a 2 mm mesh sieve, homogenized and 153
oven-dried at 40 ºC for at least 48 h for chemical analyses. Dry samples were ground to 154
< 60 μm for pseudo-total TE analysis. 155
156
2.3 Plant analyses 157
Trace elements (As, Cd, Cu, Mn, Pb and Zn) concentrations in plant tissues were 158
determined by ICP-OES (Varian ICP 720-ES) after wet oxidation with concentrated 159
HNO3 (65 %, trace analysis grade) under pressure in a microwave digester. The samples 160
were then diluted to 50 ml with deionized water and then filtered (pore diameter < 45 161
μm). The recovery efficiencies during digestion were determined using a certified 162
reference material (INCT-TL-1, Tea leaves). The limits of quantification, (LOQ) of the 163
method used were: As 0.1 mg kg−1
, Cd 0.03 mg kg−1
, Cu 0.03 mg kg−1
, Pb 0.3 mg kg−1
, 164
and Zn 0.03 mg kg−1
. Recoveries for TE concentrations in the reference plant samples 165
ranged between 90 and 110 %. Total TE uptake by plant species (shoots) was calculated 166
in both samplings having dry biomass values and TE concentrations. 167

8
2.4 Soil chemical analyses 168
Soil pH was measured in 1 mol L-1
KCl extracts (1:2.5, m/V) after shaking for 1 h 169
(Hesse 1971) using a pH meter (CRISON micro pH 2002). Total organic carbon (TOC) 170
in soil was analyzed by wet oxidation using dichromate (K2Cr2O7) and titration with 171
diammonium iron (II) bis(sulfate) (Walkley and Black 1934). 172
Pseudo-total element concentrations in the soils (< 60 μm) were determined by ICP-173
OES (Varian ICP 720-ES) following aqua regia digestion in a microwave oven (ISO 174
1995). The quality of the analysis was assessed using the reference soil sample BCR-175
143R (sewage sludge amended soil EUR 15284 EN). Obtained recoveries ranged from 176
96.7% (Mn) to 103% (Zn). 177
178
2.5 Trace elements availability analysis 179
The 0.01 mol L-1
CaCl2-extractable TE concentrations in soils were determined in 0.01 180
mol L-1
CaCl2 (1:10, m/V) extracts after shaking for 3 h (Houba et al. 2000), then 181
filtered through Whatman No. 2 (pores diameter < 25 μm) filters. Analysis of TE 182
concentrations in soil extracts was performed using ICP-OES. 183
Soil pore water (SPW) samples were analyzed for pH, and for elements using ICP-OES. 184
The limits of quantification (LOQ) were as follows: Cd 0.1 μg L−1
, Cu 0.1 μg L−1
, Mn 185
1.0 μg L−1
, Pb 3.0 μg L−1
, and Zn 0.2 μg L−1
. 186
Diffusive fluxes of metals in soil samples were determined according to Zhang et al. 187
(2005) using DGT fitted with Chelex-100-resin-impregnated gels. Diffusive gradient in 188
thin films devices were prepared according to the procedure described by Zhang et al. 189
(2005). Air-dried soil samples (from final soil sampling) were moistened by adding 190
sufficient deionized water to adjust the soil moisture to 80 % of water-holding capacity. 191
The samples were placed in an incubator (Cooled Incubators IPP with Peltier-192

9
technology, IPP 500, Memmert) at 20 °C for 24 h for equilibration. Approximately 5 g 193
of moist soil sample (three replicates per sample) were placed on the top of the DGT 194
devices, stored in closed plastic boxes containing a water-saturated atmosphere, and 195
kept in an incubator at 20 °C for 4 h. After incubation, DGT devices were washed with 196
deionized water to remove residual soil. Subsequently, the metals adsorbed to the 197
chelex resin gels were eluted in 10 mL of 1 mol L-1
HNO3. The eluate was analysed for 198
TE by ICPMS (Perkin Elmer 9000 DRCe). The time-averaged interfacial concentrations 199
(CDGT) were calculated according to Zhang et al. (2005). 200
The concentration of all TE were referred to the total amount of soil contained in the 201
pot. For that reason the results of TE availability are presented as amount (µg of each 202
TE in the pot at the end of the experiment). 203
204
2.6 Statistical analysis 205
All statistical analyses were carried out with the program SPSS 20.0 for Windows. 206
Comparisons of treatment means were performed using post-hoc tests following a one-207
factorial ANOVA. The Tukey's test was performed in case of homogeneity of variance 208
between the three subgroups, or Student's t test only if there were only two subgroups. 209
Correlation analysis was performed to determine the relationship between the different 210
parameters methods assayed. The significance level reported (p < 0.01 and p < 0.05) is 211
based on Pearson’s coefficients. 212
213
3 Results and discussion 214
3.1 Effect of compost on plant performance and elements uptake 215
In soil AZ the addition of amendments had no significant influence on plant yield 216
(except in P. annua first harvest) (Table 2). In the acid soil V, addition of amendments 217
10
was essential for the growth of plant, especially for M. polymorpha and the treatment 218
with BC, for which significantly higher biomass values were obtained, compared to AC 219
treatment (Table 2). No plant growth was observed on V control soils. The amendment 220
addition was the key factor on the growth of plants in this soil. In the amended V soils 221
the plant biomass was similar to that obtained in soil AZ (except in M. polymorpha first 222
harvest). The improvement of biomass production found in V soil seems apparently 223
related to the increase of soil pH and a corresponding reduction of labile TE fractions 224
(Pérez de Mora et al. 2011). 225
In general, in AZ soil for both species, Cd, Cu, Mn and Zn concentrations in plant were 226
in the background range for plants on neutral soils (Table 3) (Chaney 1989). However, 227
the addition of amendments had no relevant effect on TE concentrations in plant tissues; 228
a significant decrease in TE in plant tissues due to BC was only observed in the first 229
harvest for M. polymorpha for Cd and in the second harvest for both species in case of 230
Zn (Table 3). 231
In the acid soil V, TE concentrations in shoots tended to be higher than normal levels in 232
plants (even with the addition of amendments) (Table 3), especially in case of P. annua. 233
Manganese concentrations were much higher in plant tissues of P. annua (~ 2000 mg 234
kg-1
) than those observed in M. polymorpha and those found by Madejón et al. (2006) 235
for the same species in the same soil under field conditions. The enhanced Mn 236
concentrations in plant shoots were reflecting an increase of the labile Mn fractions 237
(Table 3). 238
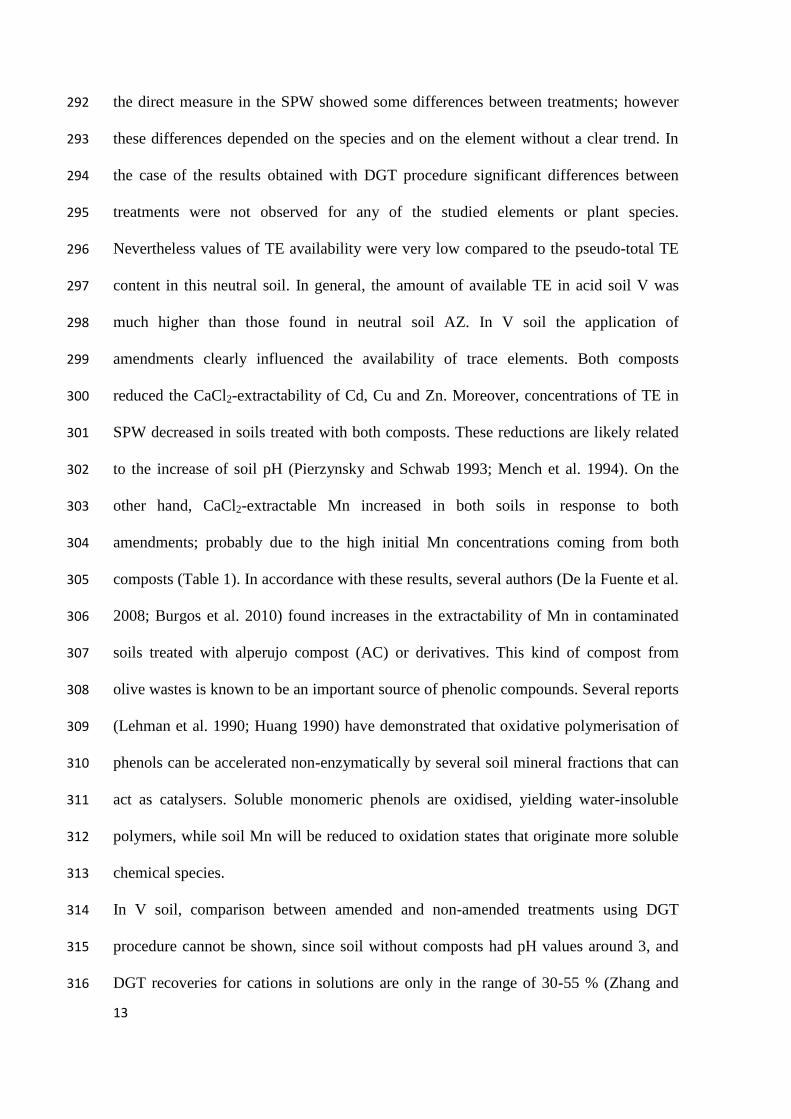
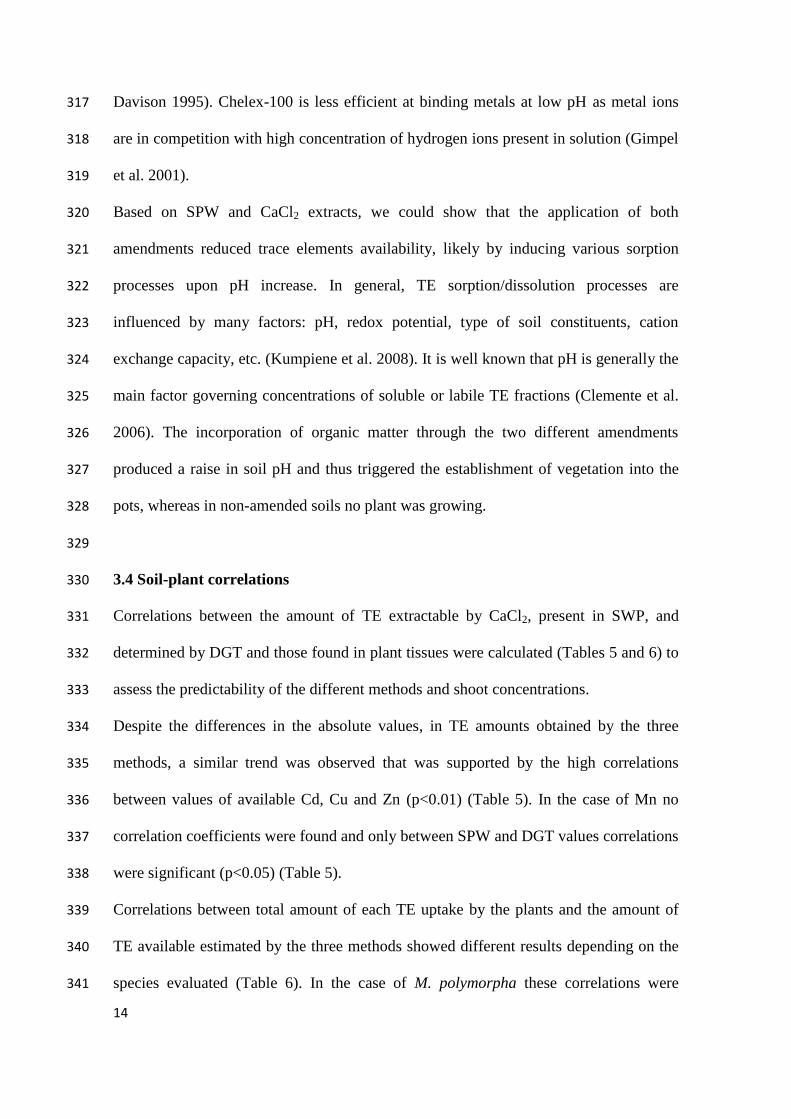
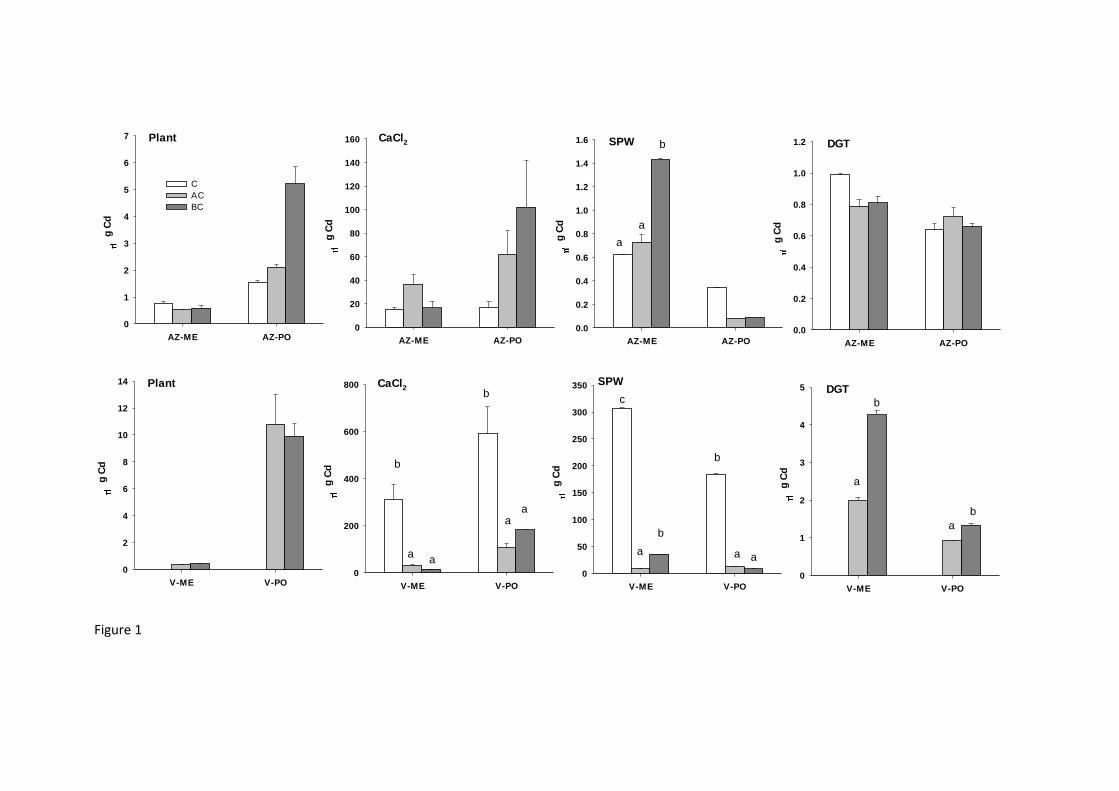
Figures 1, 2, 3 and 4 (a, e) showed the amount of TE uptake for both plant species in 239
both soils with different treatments. As plant biomass was similar for both species in 240
each soil and treatment, P. annua uptook more amount of TE (except for Cu) than M. 241
polymorhpa due to the higher concentration of these elements in the Gramineae family 242
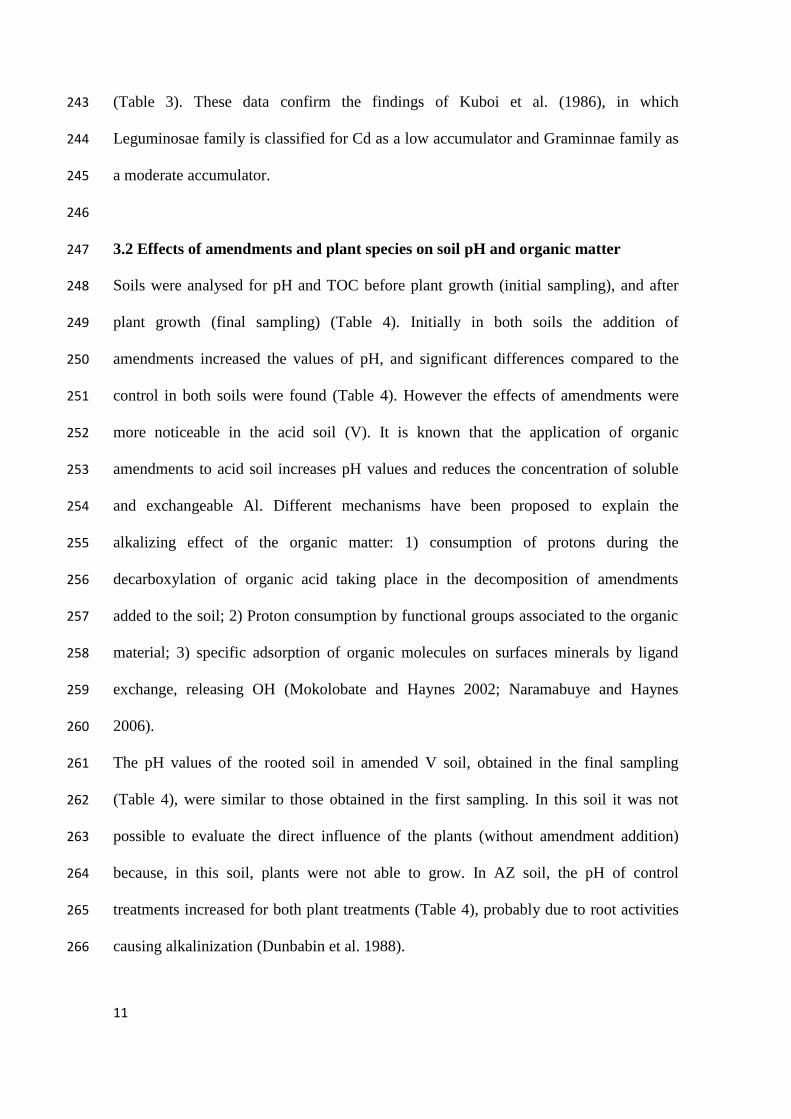
11
(Table 3). These data confirm the findings of Kuboi et al. (1986), in which 243
Leguminosae family is classified for Cd as a low accumulator and Graminnae family as 244
a moderate accumulator. 245
246
3.2 Effects of amendments and plant species on soil pH and organic matter 247
Soils were analysed for pH and TOC before plant growth (initial sampling), and after 248
plant growth (final sampling) (Table 4). Initially in both soils the addition of 249
amendments increased the values of pH, and significant differences compared to the 250
control in both soils were found (Table 4). However the effects of amendments were 251
more noticeable in the acid soil (V). It is known that the application of organic 252
amendments to acid soil increases pH values and reduces the concentration of soluble 253
and exchangeable Al. Different mechanisms have been proposed to explain the 254
alkalizing effect of the organic matter: 1) consumption of protons during the 255
decarboxylation of organic acid taking place in the decomposition of amendments 256
added to the soil; 2) Proton consumption by functional groups associated to the organic 257
material; 3) specific adsorption of organic molecules on surfaces minerals by ligand 258
exchange, releasing OH (Mokolobate and Haynes 2002; Naramabuye and Haynes 259
2006). 260
The pH values of the rooted soil in amended V soil, obtained in the final sampling 261
(Table 4), were similar to those obtained in the first sampling. In this soil it was not 262
possible to evaluate the direct influence of the plants (without amendment addition) 263
because, in this soil, plants were not able to grow. In AZ soil, the pH of control 264
treatments increased for both plant treatments (Table 4), probably due to root activities 265
causing alkalinization (Dunbabin et al. 1988). 266
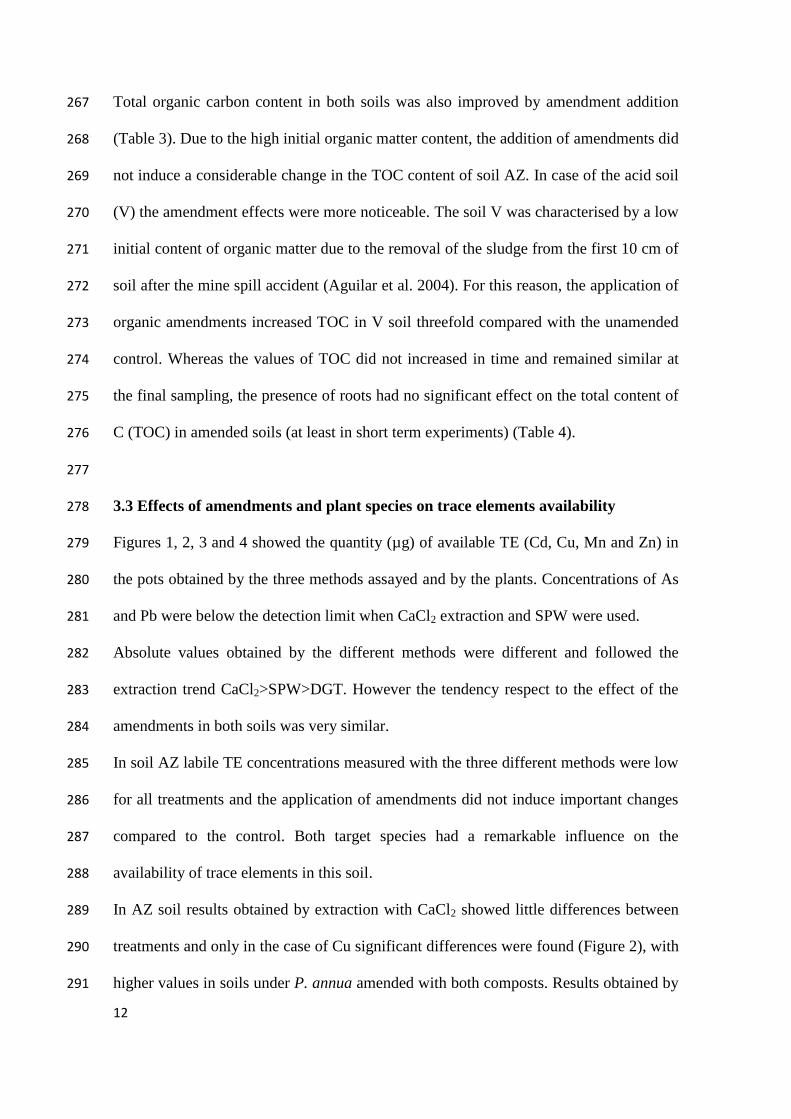
12
Total organic carbon content in both soils was also improved by amendment addition 267
(Table 3). Due to the high initial organic matter content, the addition of amendments did 268
not induce a considerable change in the TOC content of soil AZ. In case of the acid soil 269
(V) the amendment effects were more noticeable. The soil V was characterised by a low 270
initial content of organic matter due to the removal of the sludge from the first 10 cm of 271
soil after the mine spill accident (Aguilar et al. 2004). For this reason, the application of 272
organic amendments increased TOC in V soil threefold compared with the unamended 273
control. Whereas the values of TOC did not increased in time and remained similar at 274
the final sampling, the presence of roots had no significant effect on the total content of 275
C (TOC) in amended soils (at least in short term experiments) (Table 4). 276
277
3.3 Effects of amendments and plant species on trace elements availability 278
Figures 1, 2, 3 and 4 showed the quantity (µg) of available TE (Cd, Cu, Mn and Zn) in 279
the pots obtained by the three methods assayed and by the plants. Concentrations of As 280
and Pb were below the detection limit when CaCl2 extraction and SPW were used. 281
Absolute values obtained by the different methods were different and followed the 282
extraction trend CaCl2>SPW>DGT. However the tendency respect to the effect of the 283
amendments in both soils was very similar. 284
In soil AZ labile TE concentrations measured with the three different methods were low 285
for all treatments and the application of amendments did not induce important changes 286
compared to the control. Both target species had a remarkable influence on the 287
availability of trace elements in this soil. 288
In AZ soil results obtained by extraction with CaCl2 showed little differences between 289
treatments and only in the case of Cu significant differences were found (Figure 2), with 290
higher values in soils under P. annua amended with both composts. Results obtained by 291
13
the direct measure in the SPW showed some differences between treatments; however 292
these differences depended on the species and on the element without a clear trend. In 293
the case of the results obtained with DGT procedure significant differences between 294
treatments were not observed for any of the studied elements or plant species. 295
Nevertheless values of TE availability were very low compared to the pseudo-total TE 296
content in this neutral soil. In general, the amount of available TE in acid soil V was 297
much higher than those found in neutral soil AZ. In V soil the application of 298
amendments clearly influenced the availability of trace elements. Both composts 299
reduced the CaCl2-extractability of Cd, Cu and Zn. Moreover, concentrations of TE in 300
SPW decreased in soils treated with both composts. These reductions are likely related 301
to the increase of soil pH (Pierzynsky and Schwab 1993; Mench et al. 1994). On the 302
other hand, CaCl2-extractable Mn increased in both soils in response to both 303
amendments; probably due to the high initial Mn concentrations coming from both 304
composts (Table 1). In accordance with these results, several authors (De la Fuente et al. 305
2008; Burgos et al. 2010) found increases in the extractability of Mn in contaminated 306
soils treated with alperujo compost (AC) or derivatives. This kind of compost from 307
olive wastes is known to be an important source of phenolic compounds. Several reports 308
(Lehman et al. 1990; Huang 1990) have demonstrated that oxidative polymerisation of 309
phenols can be accelerated non-enzymatically by several soil mineral fractions that can 310
act as catalysers. Soluble monomeric phenols are oxidised, yielding water-insoluble 311
polymers, while soil Mn will be reduced to oxidation states that originate more soluble 312
chemical species. 313
In V soil, comparison between amended and non-amended treatments using DGT 314
procedure cannot be shown, since soil without composts had pH values around 3, and 315
DGT recoveries for cations in solutions are only in the range of 30-55 % (Zhang and 316
14
Davison 1995). Chelex-100 is less efficient at binding metals at low pH as metal ions 317
are in competition with high concentration of hydrogen ions present in solution (Gimpel 318
et al. 2001). 319
Based on SPW and CaCl2 extracts, we could show that the application of both 320
amendments reduced trace elements availability, likely by inducing various sorption 321
processes upon pH increase. In general, TE sorption/dissolution processes are 322
influenced by many factors: pH, redox potential, type of soil constituents, cation 323
exchange capacity, etc. (Kumpiene et al. 2008). It is well known that pH is generally the 324
main factor governing concentrations of soluble or labile TE fractions (Clemente et al. 325
2006). The incorporation of organic matter through the two different amendments 326
produced a raise in soil pH and thus triggered the establishment of vegetation into the 327
pots, whereas in non-amended soils no plant was growing. 328
329
3.4 Soil-plant correlations 330
Correlations between the amount of TE extractable by CaCl2, present in SWP, and 331
determined by DGT and those found in plant tissues were calculated (Tables 5 and 6) to 332
assess the predictability of the different methods and shoot concentrations. 333
Despite the differences in the absolute values, in TE amounts obtained by the three 334
methods, a similar trend was observed that was supported by the high correlations 335
between values of available Cd, Cu and Zn (p<0.01) (Table 5). In the case of Mn no 336
correlation coefficients were found and only between SPW and DGT values correlations 337
were significant (p<0.05) (Table 5). 338
Correlations between total amount of each TE uptake by the plants and the amount of 339
TE available estimated by the three methods showed different results depending on the 340
species evaluated (Table 6). In the case of M. polymorpha these correlations were 341
15
positive and significant only for Mn, and no correlations (or even negative values) were 342
observed for the rest of the elements. A possible explanation would be that M. 343
polymorpha is an excluder plant able to avoid TE absorption or retaining them in the 344
root system. For Mn, the correlations were higher (p<0.01) for SPW and less significant 345
for CaCl2 extraction and DGT (p<0.05). In a previous study by Mundus et al. (2012) a 346
lower predictability of plant Mn concentrations by DGT-available was reported, in 347
particular for aerated soils. However, the higher correlations observed in our study (in 348
both species) can be explained by the much greater range of available Mn 349
concentrations in both soils. 350
For P. annua, correlation coefficients between the different values of available Cd, Mn 351
and Zn obtained by the three methods and total plant uptake were higher than for M. 352
polymorpha with high significance (p<0.01) in most cases (except Mn with SPW; Table 353
6). For Cu these correlations were not significant. This finding is in contrast to previous 354
observations, where high correlations between DGT-available Cu in soil and plant Cu 355
concentrations (Zhang et al. 2001; Tandy et al. 2011) and between Cu extracted by 356
CaCl2 and Cu in plants (Burgos et al. 2008) were shown. In contrast to Mn, Cd and Zn, 357
plant accumulation of Cu in our experiment was to a large extent independent from the 358
amount of Cu extractable in soil. Since the available fraction concentrations of the other 359
studied elements occurred in a much larger range, we assume that under conditions of 360
high availability of Mn, Cd and Zn, the uptake of Cu could be decreased by competition 361
with other elements. Trace elements correlation coefficients between plants and soil 362
were more dependent on the plant species than the methodology used, and the better 363
correlation obtained for P. annua demonstrated that it could be considered as indicator 364
plant. For P. annua and for Cd and Zn high correlations coefficients were also observed 365
using the three methods. Puschenreiter et al. (2013) have obtained similar results using 366
16
other two indicator species for Zn, whereas for Cd lower correlation coefficients were 367
reported than in Table 6. For both elements, the highest correlations were found for 368
SPW, due to the fact that the TE fraction extracted by this method represents the 369
primary exposure to plant root system in soil (soil solution). The high reliability of 370
DGT-labile TE concentrations in soil has previously been explained by the fact that 371
DGT mimics the soil chemical processes that are also dominating the availability for 372
plants, i.e. diffusion and labile metal release (Zhang et al. 2001). 373
374
4 Conclusions 375
The results of this experiment demonstrate that the application of organic amendments 376
such as biosolid and alperujo compost, are suitable for the improvement and restoration 377
of TE contaminated soils. The effectiveness of the restoration was especially noticeable 378
in the acid TE contaminated soil, in which the addition of the composts allowed the 379
establishment of a vegetation cover. This vegetal cover contributes to the prevention of 380
wind and water erosion decreasing the mobilization of TE in these polluted soils to the 381
adjacent areas. 382
The results obtained in this study pointed out that under our microcosm conditions the 383
three methods tested (CaCl2 extraction, SPW and DGT) to predict TE phytoavailability 384
were highly correlated. Among the three methods tested, pore water is probably the 385
most realistic and cost effective method. However, the extraction of the soil pore water 386
is not always possible under Mediterranean field conditions because the low moisture 387
content in the vadose zone only permits this extraction after rainfall episodes. Despite 388
the accuracy of the diffusive gradient in thin film (DGT), this method could 389
underestimate concentrations and new gels adapted to very acid soils have to be 390
17
developed. Furthermore the extraction with neutral salts, may overestimate the 391
availability, however is a simple method adapted to acid soils. 392
These results also show that the correlation between TE concentrations in plants and 393
different TE concentrations in soils extracted by the three methods is more dependent 394
on the plant species than the method of extraction. The best coefficients that correlated 395
the three methods were found for elements like Cd and Zn and especially when P. 396
annua, an indicator plant, was the test plant. 397
398
Acknowledgments AGL2011-23617 supported by the CICYT of the Ministerio de 399
Ciencia e Innovación of Spain and FEDER (EU). L. Ciadamidaro thanks to CSIC for 400
funding her grant (JAE-PreDoc). 401
402
References 403
Adriano DC (2001) Trace Elements in Terrestrial Environments: Biogeochemistry, 404
Bioavailability and Risks of Metals, 2nd
edn. Springer, New York, pp 867 405
Adriano DC, Wenzel WW, Vangronsveld J, Bolan NS (2004) Role of assisted natural 406
remediation in environmental cleanup. Geoderma 122: 121-142 407
Aguilar J, Dorronsoro C, Fernández E, Fernández J, García I, Martín F, Simón M 408
(2004) Soil pollution by a pyrite mine spill in Spain: evolution in time. Environ 409
Pollut 132: 395-401 410
Beesley L, Moreno-Jiménez E, Clemente R, Lepp N, Dickinson N (2010) Mobility of 411
arsenic, cadmium and zinc in a multi-element contaminated soil profile assessed by 412
in-situ soil pore water sampling, column leaching and sequential extraction. 413
Environ Pollut 158:155-160 414

18
Brookes PC (1995) The use of microbial parameters in monitoring soil pollution by 415
heavy metals. Biol Fertil Soil 19:269-279 416
Burgos P, Pérez de Mora A, Madejón P, Cabrera F, Madejón E (2008) Trace elements 417
in wild grasses: a phytoavailability study on a remediated field. Environ Geochem 418
Health 30:109-114 419
Burgos P, Madejón P, Cabrera F, Madejón E (2010) By-products as amendment to 420
improve biochemical properties of trace element contaminated soils: effects in 421
time. Int Biodeterior Biodegrad 64:481-488 422
Chaney RL (1989) Toxic element accumulation in soils and crops: protecting soil 423
fertility and agricultural food-chains In: Bar-Yosef B, Barrow NJ, Goldshmid J (ed) 424
Inorganic contaminants in the Vadose Zone. Springer-Verlag, Berlin, pp 140-158 425
Ciadamidaro L, Madejón P, Puschenreiter M, Madejón E (2013) Growth of Populus 426
alba and its influence on soil trace element availability. Sci Total Environ 454-427
455:337-347 428
Clemente R, Almela C, Bernal MP (2006) A remediation strategy based on active 429
phytoremediation followed by natural attenuation in a soil contaminated by pyrite 430
waste. Environ Pollut 143:397-406 431
Clemente R, Dickinson NM, Lepp NW (2008) Mobility of metals and metalloids in a 432
multielement contaminated soil 20 years after cessation of the pollution source 433
activity. Environ Pollut 155:254-261 434
19
Degryse F, Smolders E, Zhang H, Davison W (2009) Predicting availability of mineral 435
elements to plants with the DGT technique: a review of experimental data and 436
interpretation by modelling. Environ Chem 6:198-218 437
De la Fuente C, Clemente R, Bernal MP (2008) Changes in metal speciation and pH in 438
olive processing and sulphur-treated contaminated soil. Ecotoxicol Environ Saf 439
70:207-215 440
Dunbabin JS, Pokorný J, Bowmer KH (1988) Rhizosphere oxygenation by Typha 441
domingensis Pers. in miniature artificial wetland filters used for metal removal 442
from wastewaters. Aquat Bot 29:303-317 443
Gimpel J, Zhang H, Hutchinson W, Davison W (2001) Effect of solution composition, 444
flow and deployment time on the measurement of trace metals by the diffusive 445
gradient in thin films technique. Analyt Chim Acta 448: 93-103 446
Grimalt JO, Ferrer M, Macpherson E (1999) The mine tailing accident in Aznalcollar. 447
Sci Total Environ 242:3-11 448
He ZL, Yang XE, Stoffella PJ (2005) Trace elements in agroecosystems and impacts on 449
the environment. J Trace Elem Medic Biol 19:125-140 450
Hesse PR (1971) A textbook of soil chemical analysis. London: John Murray 451
Houba VJG, Temminghoff EJM, Gaikhorst GA, Van Vark W (2000) Soil analysis 452
procedures using 0.01 M calcium chloride as extraction reagent. Commun Soil Sci 453
Plant 31:1299-396 454
Huang PM (1990) Role of soil minerals in transformations of natural organics and 455
xenobiotics in soil. In: Bollag JM, Stotzky G (ed) Soil Biochemistry, vol. 6. 456
Dekker, New York, pp 29-115 457
20
Kuboi T, Noguchi A, Yazaki J (1986) Family-dependent cadmium accumulation 458
characteristics in higher plants. Plant Soil 92:405-415 459
Kumpiene J, Lagerkvist A, Maurice C (2008) Stabilization of As, Cr, Cu, Pb and Zn in 460
soil using amendments-A review. Waste Manag 28:215-225 461
ISO (1995) Soil Quality. Extraction of Trace Elements Soluble in Aqua Regia, 462
International Organization for Standardization, ISO 11466 463
Lehmann RG, Cheng HH, Harsh JB (1987) Oxidation of phenolic acids by soil iron and 464
manganese oxides. Soil Sci Soc Am J 51:352-356 465
Madejón E, Pérez de Mora A, Felipe E, Burgos P, Cabrera F (2006) Soil amendments 466
reduced trace element solubility in a contaminated soil and allow regrowth of 467
natural vegetation. Environ Pollut 139:40-52 468
Mench M, Vangronsveld J, Didier V, Clijsters H (1994) Evaluation of metal mobility, 469
plant availability and immobilization by chemical agents in a limed-silty soil. 470
Environ Pollut 86:279-286 471
Mokolobate MS, Haynes RJ (2002) Comparative liming effect of four organic residues 472
applied to an acid soil. Biol Fertil Soils 35: 79-85 473
Morel JL (1997) Bioavailability of trace elements to terrestrial plants. In: Tarradellas J, 474
Bitton G, Rossel D (ed) Soil Ecotoxicology. Lewis Publishers, Boca Raton, pp 475
141-178 476
Mundus S, Lombi E, Holm PE, Zhang H, Husted S (2012) Assessing the plant 477
availability of manganese in soils using Diffusive Gradients in Thin films (DGT). 478
Geoderma 183-184:92-99. 479
21
Naramabuye FX, Haynes R.J (2006) Effect of organic amendments on soil pH and Al 480
solubility and use of laboratory indices to predict their liming effect. Soil Sci 171: 481
754-763. 482
Nolan AL, McLaughlin MJ, Mason SD (2003) Chemical speciation of Zn, Cd, Cu and 483
Pb in pore waters of agricultural and contaminated soils using Donnan dialysis. 484
Environ Sci Technol 37:90-98 485
Pérez de Mora A, Madejón P, Burgos P, Cabrera F, Lepp NW, Madejón E (2011) 486
Phytostabilization of semiarid soils residually contaminated with trace elements 487
using by-products: Sustainability and risks. Environ Pollut 159:3018–3027 488
Pierzynski GM, Schwab AP (1993) Bioavailability of Zinc, Cadmium, and lead in a 489
metal-contaminated alluvial soil. J Environ Qual 22:247-254 490
Puschenreiter M, Wittstock F, Friesl‐Hanl W, Wenzel WW (2013) Predictability of the 491
Zn and Cd phytoextraction efficiency of a Salix smithiana clone by DGT and 492
conventional bioavailability assays. Plant Soil 369:531-541 493
Tandy S, Mundus S, Yngvesson J, De Bang TC, Lombi E, Schjoerring JK, Husted S 494
(2011) The use of DGT for prediction of plant available copper, zinc and 495
phosphorus in agricultural soils. Plant Soil 346:167-180 496
Walkley A, Black JA (1934) An examination of the Degtjareff method for determining 497
soil organic matter and a proposed modification of the chromicacid tritation 498
method. Soil Sci 37:29-38 499
22
Zhang H, Davison W (1995) Performance characteristics of diffusion gradients in thin 500
films for the in situ measurement of trace metals in aqueous solution. Anal Chem 501
67:3391-3400 502
Zhang H, Zhao FJ, Sun B, Davison W, McGrath SP (2001) A new method to measure 503
effective soil solution concentration predicts copper availability to plants. Environ 504
Sci Technol 35:2602-2607 505
Zhang H, Zhao FJ, Sun B, Davison W, McGrath SP (2005) A new method to measure 506
effective soil solution concentration predicts copper availability to plants. Environ 507
Sci Technol 35:2602–2607 508
Zhang H, Davison W (2006) Predicting metal uptake by plants using the DGT 509
technique. In: Twardowska I, Allen HE, Häggblom MM, Stefaniak S. (ed) Viable 510
Methods of Soil and Water Pollution Monitoring, Protection and Remediation. 511
Springer, New York, pp 187-197 512
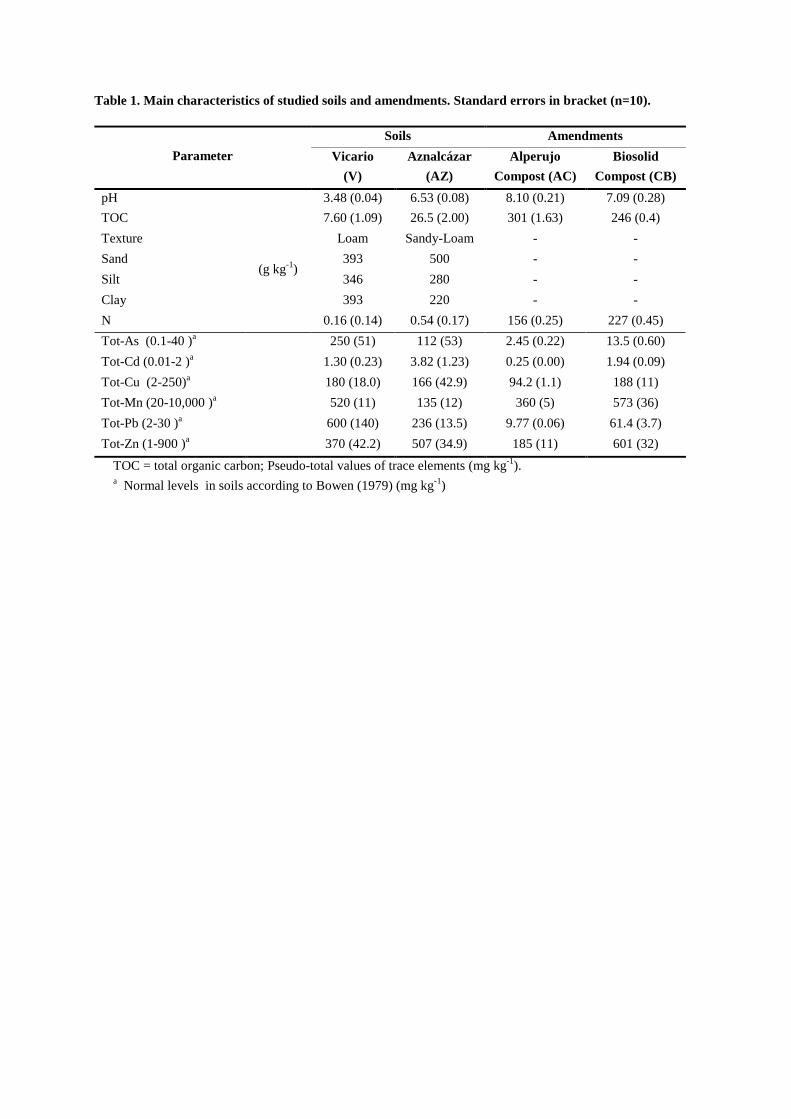
Table 1. Main characteristics of studied soils and amendments. Standard errors in bracket (n=10).
Parameter
Soils Amendments
Vicario
(V)
Aznalcázar
(AZ)
Alperujo
Compost (AC)
Biosolid
Compost (CB)
pH 3.48 (0.04) 6.53 (0.08) 8.10 (0.21) 7.09 (0.28)
TOC
(g kg-1
)
7.60 (1.09) 26.5 (2.00) 301 (1.63) 246 (0.4)
Texture Loam Sandy-Loam - -
Sand 393 500 - -
Silt 346 280 - -
Clay 393 220 - -
N 0.16 (0.14) 0.54 (0.17) 156 (0.25) 227 (0.45)
Tot-As (0.1-40 )a
250 (51) 112 (53) 2.45 (0.22) 13.5 (0.60)
Tot-Cd (0.01-2 )a 1.30 (0.23) 3.82 (1.23) 0.25 (0.00) 1.94 (0.09)
Tot-Cu (2-250)a 180 (18.0) 166 (42.9) 94.2 (1.1) 188 (11)
Tot-Mn (20-10,000 )a 520 (11) 135 (12) 360 (5) 573 (36)
Tot-Pb (2-30 )a 600 (140) 236 (13.5) 9.77 (0.06) 61.4 (3.7)
Tot-Zn (1-900 )a 370 (42.2) 507 (34.9) 185 (11) 601 (32)
TOC = total organic carbon; Pseudo-total values of trace elements (mg kg-1
). a Normal levels in soils according to Bowen (1979) (mg kg
-1)
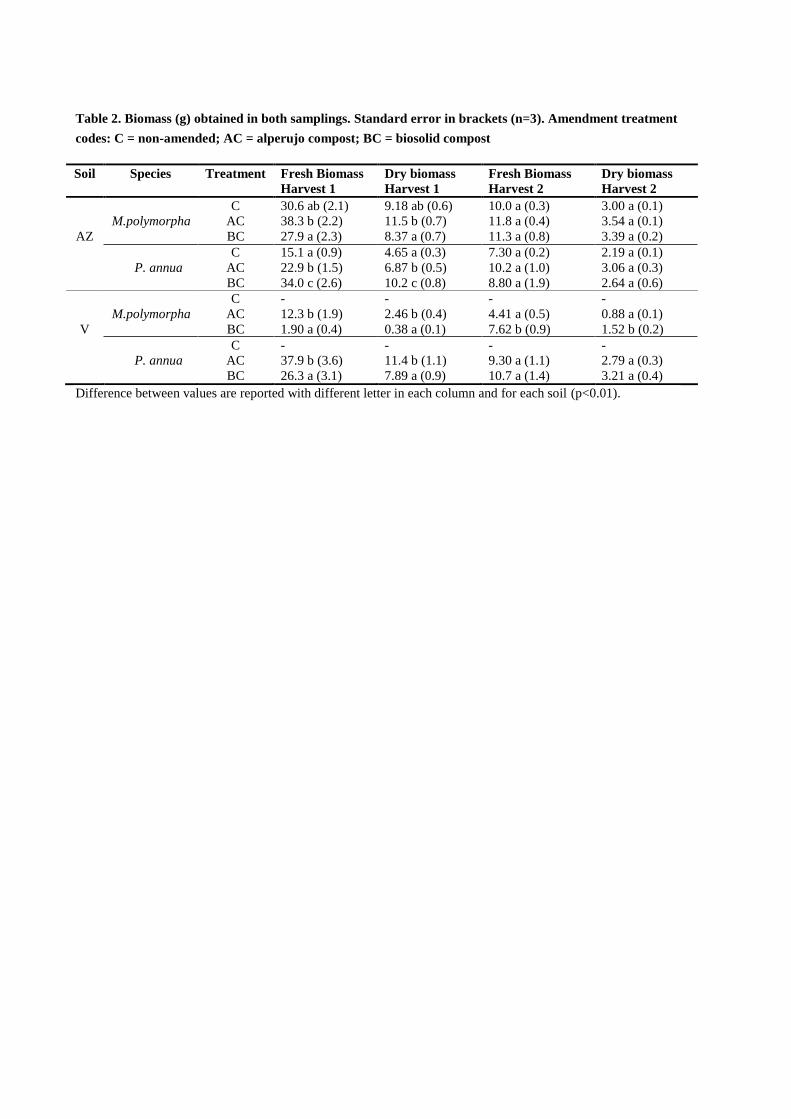
Table 2. Biomass (g) obtained in both samplings. Standard error in brackets (n=3). Amendment treatment
codes: C = non-amended; AC = alperujo compost; BC = biosolid compost
Soil Species Treatment Fresh Biomass
Harvest 1
Dry biomass
Harvest 1
Fresh Biomass
Harvest 2
Dry biomass
Harvest 2
C 30.6 ab (2.1) 9.18 ab (0.6) 10.0 a (0.3) 3.00 a (0.1)
M.polymorpha AC 38.3 b (2.2) 11.5 b (0.7) 11.8 a (0.4) 3.54 a (0.1)
AZ BC 27.9 a (2.3) 8.37 a (0.7) 11.3 a (0.8) 3.39 a (0.2)
C 15.1 a (0.9) 4.65 a (0.3) 7.30 a (0.2) 2.19 a (0.1)
P. annua AC 22.9 b (1.5) 6.87 b (0.5) 10.2 a (1.0) 3.06 a (0.3)
BC 34.0 c (2.6) 10.2 c (0.8) 8.80 a (1.9) 2.64 a (0.6)
C - - - -
M.polymorpha AC 12.3 b (1.9) 2.46 b (0.4) 4.41 a (0.5) 0.88 a (0.1)
V BC 1.90 a (0.4) 0.38 a (0.1) 7.62 b (0.9) 1.52 b (0.2)
C - - - -
P. annua AC 37.9 b (3.6) 11.4 b (1.1) 9.30 a (1.1) 2.79 a (0.3)
BC 26.3 a (3.1) 7.89 a (0.9) 10.7 a (1.4) 3.21 a (0.4)
Difference between values are reported with different letter in each column and for each soil (p<0.01).
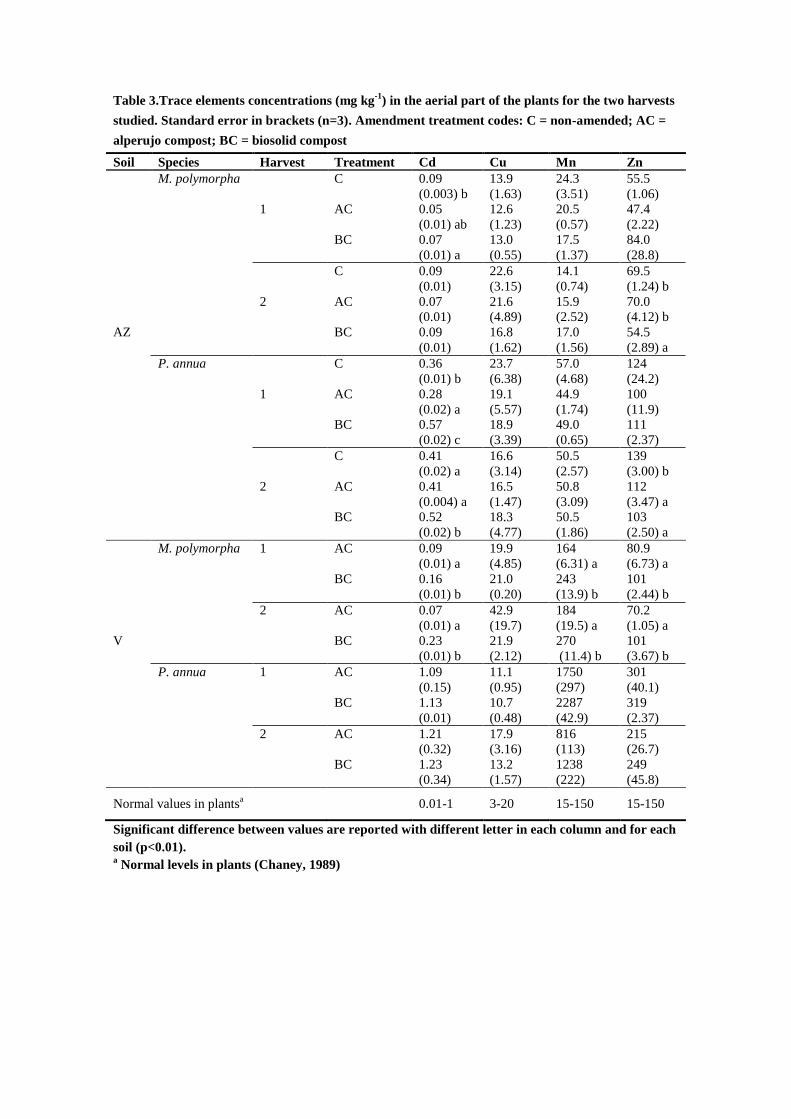
Table 3.Trace elements concentrations (mg kg-1
) in the aerial part of the plants for the two harvests
studied. Standard error in brackets (n=3). Amendment treatment codes: C = non-amended; AC =
alperujo compost; BC = biosolid compost
Soil Species Harvest Treatment Cd Cu Mn Zn
M. polymorpha C 0.09
(0.003) b
13.9
(1.63)
24.3
(3.51)
55.5
(1.06)
1 AC 0.05
(0.01) ab
12.6
(1.23)
20.5
(0.57)
47.4
(2.22)
BC 0.07
(0.01) a
13.0
(0.55)
17.5
(1.37)
84.0
(28.8)
C 0.09
(0.01)
22.6
(3.15)
14.1
(0.74)
69.5
(1.24) b
2 AC 0.07
(0.01)
21.6
(4.89)
15.9
(2.52)
70.0
(4.12) b
AZ BC 0.09
(0.01)
16.8
(1.62)
17.0
(1.56)
54.5
(2.89) a
P. annua C 0.36
(0.01) b
23.7
(6.38)
57.0
(4.68)
124
(24.2)
1 AC 0.28
(0.02) a
19.1
(5.57)
44.9
(1.74)
100
(11.9)
BC 0.57
(0.02) c
18.9
(3.39)
49.0
(0.65)
111
(2.37)
C 0.41
(0.02) a
16.6
(3.14)
50.5
(2.57)
139
(3.00) b
2 AC 0.41
(0.004) a
16.5
(1.47)
50.8
(3.09)
112
(3.47) a
BC 0.52
(0.02) b
18.3
(4.77)
50.5
(1.86)
103
(2.50) a
M. polymorpha 1 AC 0.09
(0.01) a
19.9
(4.85)
164
(6.31) a
80.9
(6.73) a
BC 0.16
(0.01) b
21.0
(0.20)
243
(13.9) b
101
(2.44) b
2 AC 0.07
(0.01) a
42.9
(19.7)
184
(19.5) a
70.2
(1.05) a
V BC 0.23
(0.01) b
21.9
(2.12)
270
(11.4) b
101
(3.67) b
P. annua 1 AC 1.09
(0.15)
11.1
(0.95)
1750
(297)
301
(40.1)
BC 1.13
(0.01)
10.7
(0.48)
2287
(42.9)
319
(2.37)
2 AC 1.21
(0.32)
17.9
(3.16)
816
(113)
215
(26.7)
BC 1.23
(0.34)
13.2
(1.57)
1238
(222)
249
(45.8)
Normal values in plantsa 0.01-1 3-20 15-150 15-150
Significant difference between values are reported with different letter in each column and for each
soil (p<0.01). a Normal levels in plants (Chaney, 1989)
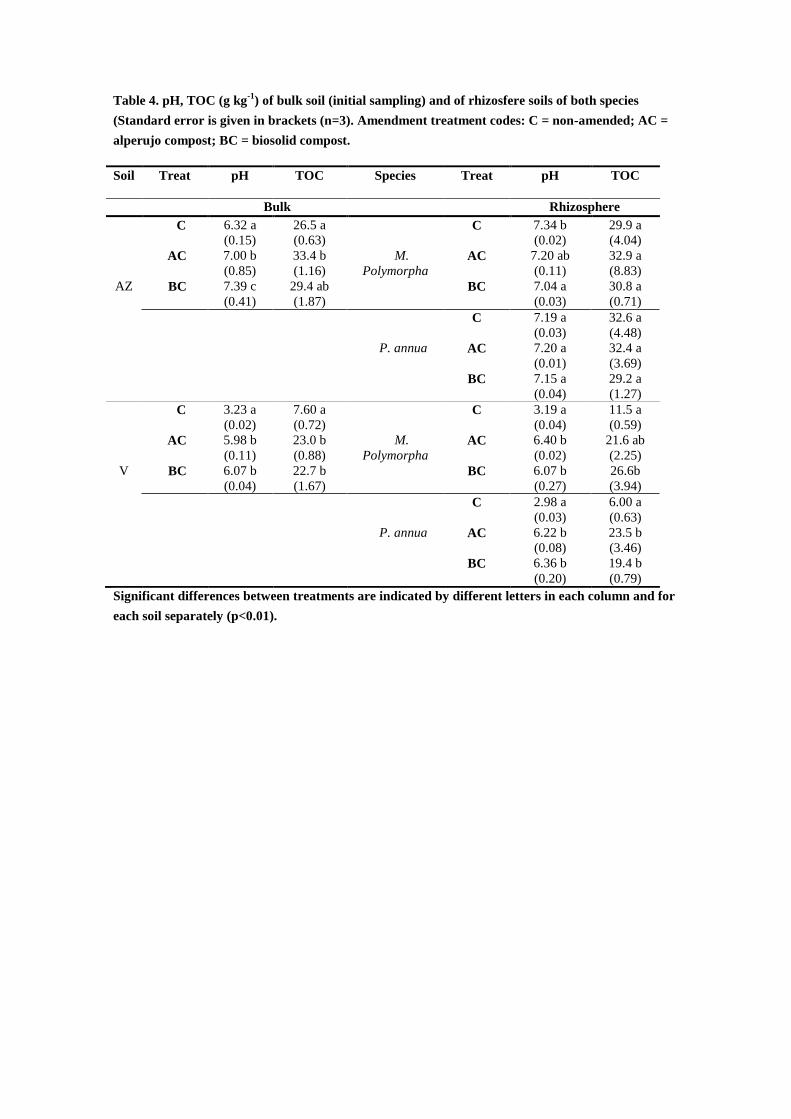
Table 4. pH, TOC (g kg-1
) of bulk soil (initial sampling) and of rhizosfere soils of both species
(Standard error is given in brackets (n=3). Amendment treatment codes: C = non-amended; AC =
alperujo compost; BC = biosolid compost.
Soil Treat pH
TOC
Species Treat pH TOC
Bulk Rhizosphere
C 6.32 a
(0.15)
26.5 a
(0.63)
C 7.34 b
(0.02)
29.9 a
(4.04)
AC 7.00 b
(0.85)
33.4 b
(1.16)
M.
Polymorpha AC 7.20 ab
(0.11)
32.9 a
(8.83)
AZ BC 7.39 c
(0.41)
29.4 ab
(1.87)
BC 7.04 a
(0.03)
30.8 a
(0.71)
C 7.19 a
(0.03)
32.6 a
(4.48)
P. annua AC 7.20 a
(0.01)
32.4 a
(3.69)
BC 7.15 a
(0.04)
29.2 a
(1.27)
C 3.23 a
(0.02)
7.60 a
(0.72)
C 3.19 a
(0.04)
11.5 a
(0.59)
AC 5.98 b
(0.11)
23.0 b
(0.88)
M.
Polymorpha AC 6.40 b
(0.02)
21.6 ab
(2.25)
V BC 6.07 b
(0.04)
22.7 b
(1.67)
BC 6.07 b
(0.27)
26.6b
(3.94)
C 2.98 a
(0.03)
6.00 a
(0.63)
P. annua AC 6.22 b
(0.08)
23.5 b
(3.46)
BC 6.36 b
(0.20)
19.4 b
(0.79)
Significant differences between treatments are indicated by different letters in each column and for
each soil separately (p<0.01).
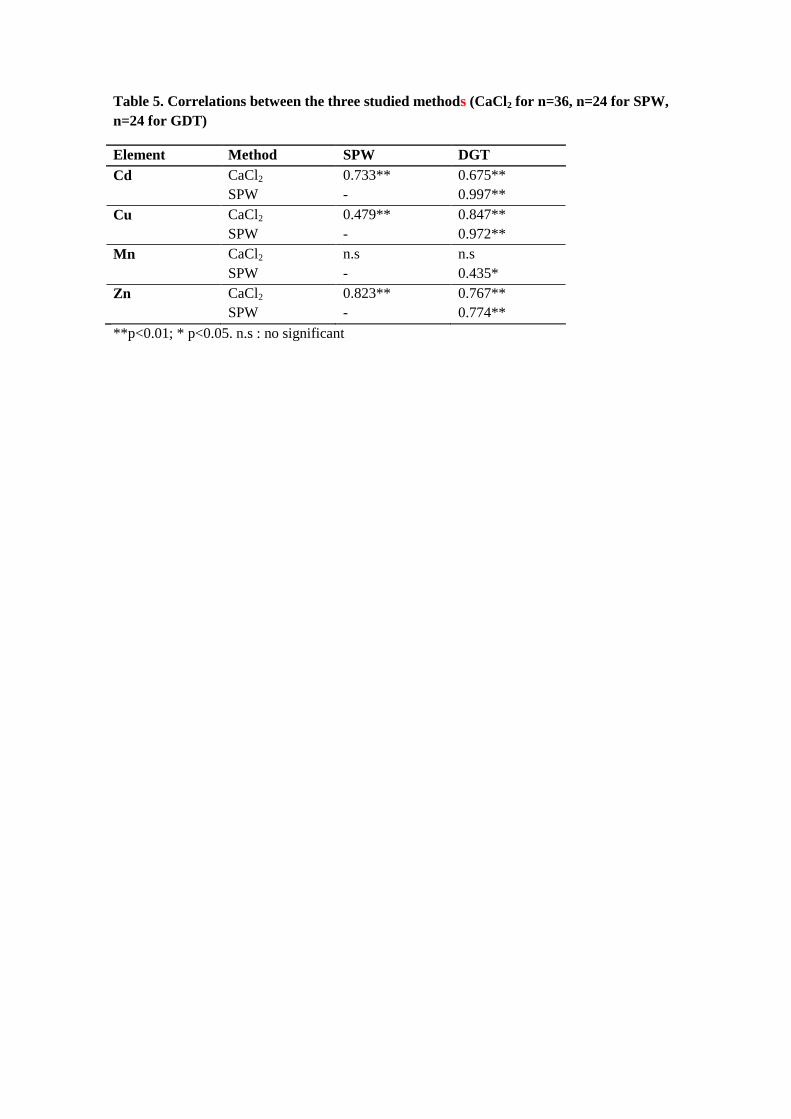
Table 5. Correlations between the three studied methods (CaCl2 for n=36, n=24 for SPW,
n=24 for GDT)
Element Method SPW DGT
Cd CaCl2 0.733** 0.675**
SPW - 0.997**
Cu CaCl2 0.479** 0.847**
SPW - 0.972**
Mn CaCl2 n.s n.s
SPW - 0.435*
Zn CaCl2 0.823** 0.767**
SPW - 0.774**
**p<0.01; * p<0.05. n.s : no significant
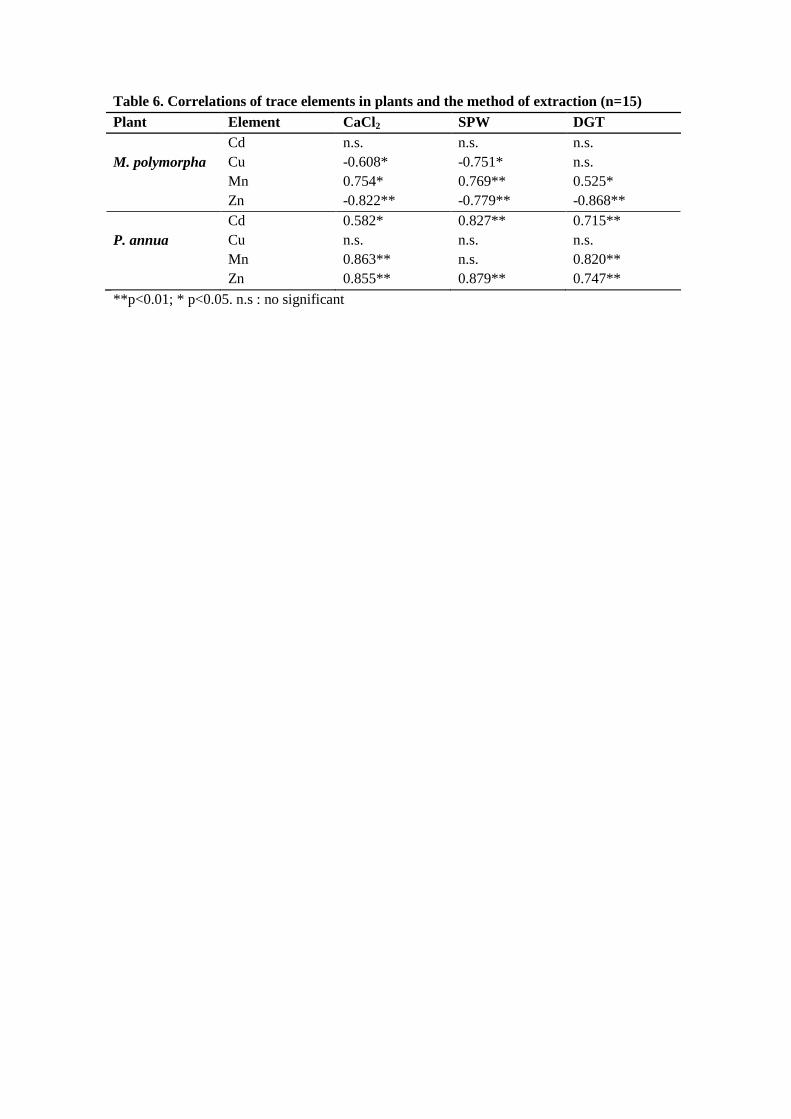
Table 6. Correlations of trace elements in plants and the method of extraction (n=15)
Plant Element CaCl2 SPW DGT
Cd n.s. n.s. n.s.
M. polymorpha Cu -0.608* -0.751* n.s.
Mn 0.754* 0.769** 0.525*
Zn -0.822** -0.779** -0.868**
Cd 0.582* 0.827** 0.715**
P. annua Cu n.s. n.s. n.s.
Mn 0.863** n.s. 0.820**
Zn 0.855** 0.879** 0.747**
**p<0.01; * p<0.05. n.s : no significant
Plant
AZ-ME AZ-PO
g C
d
0
1
2
3
4
5
6
7
C
AC
BC
CaCl2
AZ-ME AZ-PO
g C
d0
20
40
60
80
100
120
140
160 SPW
AZ-ME AZ-PO
g C
d
0.0
0.2
0.4
0.6
0.8
1.0
1.2
1.4
1.6 DGT
AZ-ME AZ-PO
g C
d
0.0
0.2
0.4
0.6
0.8
1.0
1.2
Plant
V-ME V-PO
g C
d
0
2
4
6
8
10
12
14 CaCl2
V-ME V-PO
g C
d
0
200
400
600
800 SPW
V-ME V-PO
g C
d
0
50
100
150
200
250
300
350 DGT
V-ME V-PO
g C
d
0
1
2
3
4
5
a
a
b
aa
b
a
b
c
a
bb
aa
a
b
a
a
b
Figure 1
Plant
AZ-ME AZ-PO
g C
u
0
50
100
150
200 C
AC
BC
CaCl2
AZ-ME AZ-PO
g C
u0
200
400
600
800
1000
1200SPW
AZ-ME AZ-PO
g C
u
0
10
20
30
40
50
60
70 DGT
AZ-ME AZ-PO
g C
u
0
2
4
6
8
10
12
14
16
18
Plant
V-ME V-PO
g C
u
0
20
40
60
80
100
120
140CaCl2
V-ME V-PO
g C
u
0
500
1000
1500
2000
2500
3000
3500 SPW
V-ME V-PO
g C
u
0
1000
2000
3000
4000
5000
DGT
V-ME V-PO
g C
u
0
10
20
30
40
50
a
b
c
a
b b
aa
b
a
c
b
a
b
c
aa
b
a
bb
a a
a
a
Figure 2
Plant
AZ-ME AZ-PO
g M
n
0
100
200
300
400
500
600 C
AC
BC
CaCl2
AZ-ME AZ-POg
Mn
0
200
400
600
800
1000
1200
1400
1600
1800 SPW
AZ-ME AZ-PO
g M
n
0
2
4
6
8
10 DGT
AZ-ME AZ-PO
g M
n
0
10
20
30
40
50
60
Plant
V-ME V-PO
g M
n
0
5000
10000
15000
20000
25000 CaCl2
V-ME V-PO
g M
n
0
1e+5
2e+5
3e+5
4e+5
5e+5
6e+5
7e+5SPW
V-ME V-PO
g M
n
0,0
2,0e+4
4,0e+4
6,0e+4
8,0e+4
1,0e+5
1,2e+5
1,4e+5 DGT
V-ME V-PO
g M
n
0
2000
4000
6000
8000
10000
12000
a
ab
b
b
aa
b
aa
b b
b
a
aa
b
Figure 3
Plant
AZ-ME AZ-PO
g Z
n
0
200
400
600
800
1000
1200 C
AC
BC
CaCl2
AZ-ME AZ-POg
Zn
0
100
200
300
400
500
600
700 SPW
AZ-ME AZ-PO
g Z
n
0
100
200
300
400
500
600
700 DGT
AZ-ME AZ-PO
g Z
n
0
20
40
60
80
100
120
140
Plant
V-ME V-PO
g Z
n
0
1000
2000
3000
4000 CaCl2
V-ME V-PO
g Z
n
0
10000
20000
30000
40000
50000
60000 SPW
V-ME V-PO
g Z
n
0
5000
10000
15000
20000
25000
30000
35000 DGT
V-ME V-PO
g Z
n
0
100
200
300
400
500
600
a
b b
b
a a
a
b
aa
bb
aa a a
Figure 4
Figure Caption
Figure 1. Cd concentration in plant shoots, Cd concentration in soils extracted with 0.01M
CaCl2 , soil pore water (SPW), and DGT for the two studied soils, with and without plants and
amendments. For each soil and plant columns with different letter differ significantly (p<0.05).
Error bars show standard error of the mean (n=3). Amendment treatment codes: C = non-
amended; AC = alperujo compost; BC = biosolid compost; Soil type codes: AZ = Aznalcázar
(neutral contaminated soil); V = Vicario (acid contaminated soil); Plant species code: ME:
Medicago polymorpha; PO: Poa annua.
Figure 2. Cu concentration in plant shoots, Cu concentration in soils extracted with 0.01M
CaCl2, soil pore water (SPW), and DGT for the two studied soils, with and without plants and
amendments. Error bars show standard error of the mean (n=3). For each soil and plant
columns with different letter differ significantly (p<0.05). Error bars show standard error of the
mean (n=3). Amendment treatment codes: C = non-amended; AC = alperujo compost; BC =
biosolid compost; Soil type codes: AZ = Aznalcázar (neutral contaminated soil); V = Vicario (acid
contaminated soil); Plant species code: ME: Medicago polymorpha; PO: Poa annua.
Figure 3. Mn concentration in plant shoots, Mn concentration in soils extracted with 0.01M
CaCl2, soil pore water (SPW), and DGT for the two studied soils, with and without plants and
amendments. Error bars show standard error of the mean (n=3). For each soil and plant
columns with different letter differ significantly (p<0.05). Error bars show standard error of the
mean (n=3). Amendment treatment codes: C = non-amended; AC = alperujo compost; BC =
biosolid compost; Soil type codes: AZ = Aznalcázar (neutral contaminated soil); V = Vicario (acid
contaminated soil); Plant species code: ME: Medicago polymorpha; PO: Poa annua.
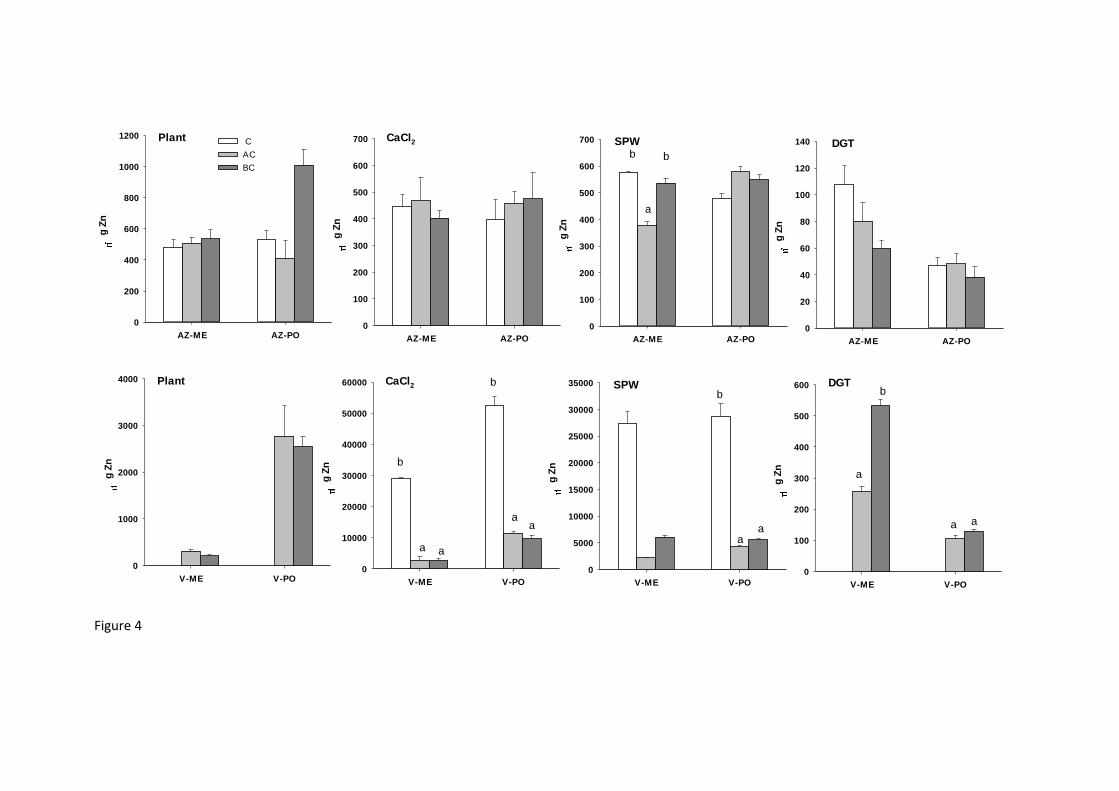
Figure 4. Zn concentration in plant shoots, Zn concentration in soils extracted with 0.01M
CaCl2, soil pore water (SPW), and DGT for the two studied soils, with and without plants and
amendments. Error bars show standard error of the mean (n=3). For each soil and plant
columns with different letter differ significantly (p<0.05). Error bars show standard error of the
mean (n=3). Amendment treatment codes: C = non-amended; AC = alperujo compost; BC =
biosolid compost; Soil type codes: AZ = Aznalcázar (neutral contaminated soil); V = Vicario (acid
contaminated soil); Plant species code: ME: Medicago polymorpha; PO: Poa annua.


