

DEER 2004
A New CFD Model for Understanding and Managing Diesel Particulate Filter
Regeneration
Z. Jason Hou and Ted Angelo
Donaldson Company, Inc.
DEER 2004
DPF Technology Development
• Understand Regeneration– When?
– How?
• Characterize Soot Loading and Pressure Drop vs. Time
• System Control– Model-Based Feed-Forward Adaptive Control
• Component Development
• Flow Distribution and Thermal Management
DEER 2004
DPF Technology Development
• Understand Regeneration– When?
– How?
• Characterize Soot Loading and Pressure Drop vs. Time
• System Control– Model-Based Feed-Forward Adaptive Control
• Component Development
• Flow Distribution and Thermal Management
DEER 2004
Why Model Regeneration?• Goal: Achieve Quick, Complete and Safe
Regeneration with Minimal Fuel Penalty
• Regeneration is Very Complex
• Experiments are Difficult and Costly
• Modeling Allows Us to Optimize System and Regeneration Strategy
DEER 2004
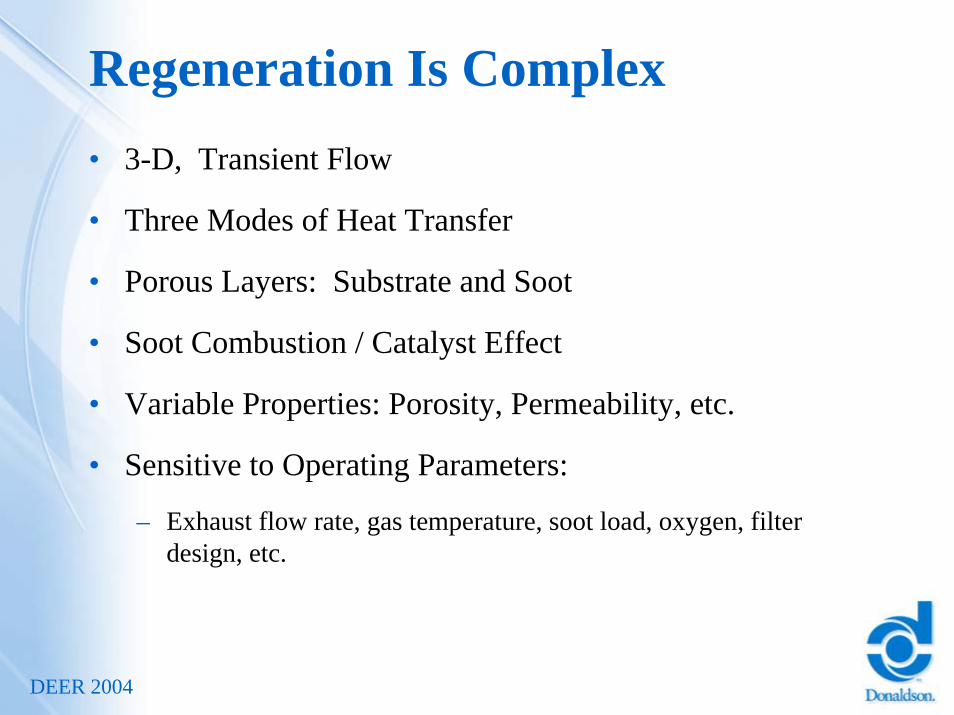
Regeneration Is Complex• 3-D, Transient Flow
• Three Modes of Heat Transfer
• Porous Layers: Substrate and Soot
• Soot Combustion / Catalyst Effect
• Variable Properties: Porosity, Permeability, etc.
• Sensitive to Operating Parameters:
– Exhaust flow rate, gas temperature, soot load, oxygen, filter design, etc.

DEER 2004
Filter Failure: Want to Avoid
• Ring-off Cracking of Cordierite

DEER 2004
Regeneration Model: I/OInput:• Filter configuration: dimensions, cell density, wall thickness• Soot loading / distribution• Regeneration condition: inlet gas temp, exhaust flow rate, O2
• Substrate property: porosity, permeability, thermal, etc.• Soot property: packing density, permeability, etc.• Soot reaction kinetics and catalyst effect
Output:• Spatial and temporal profiles of key variables
– Temperature, velocity, oxygen, reaction rate, etc.
• Soot distribution (regen efficiency) vs. time
• A tool for parametric and what-if studies
DEER 2004
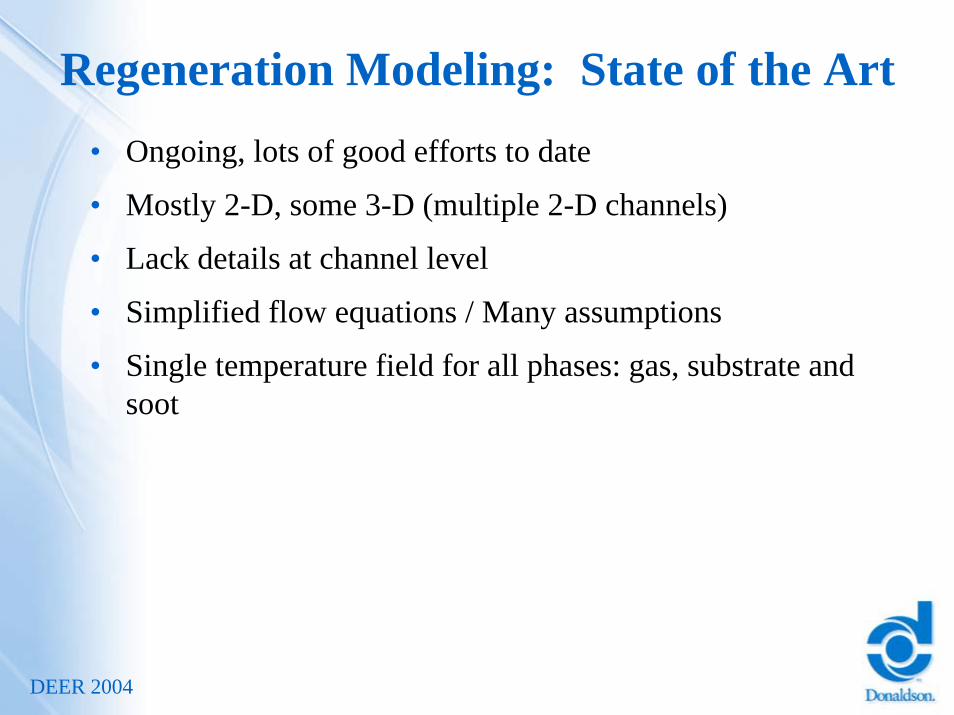
Regeneration Modeling: State of the Art• Ongoing, lots of good efforts to date
• Mostly 2-D, some 3-D (multiple 2-D channels)
• Lack details at channel level
• Simplified flow equations / Many assumptions
• Single temperature field for all phases: gas, substrate and soot
DEER 2004
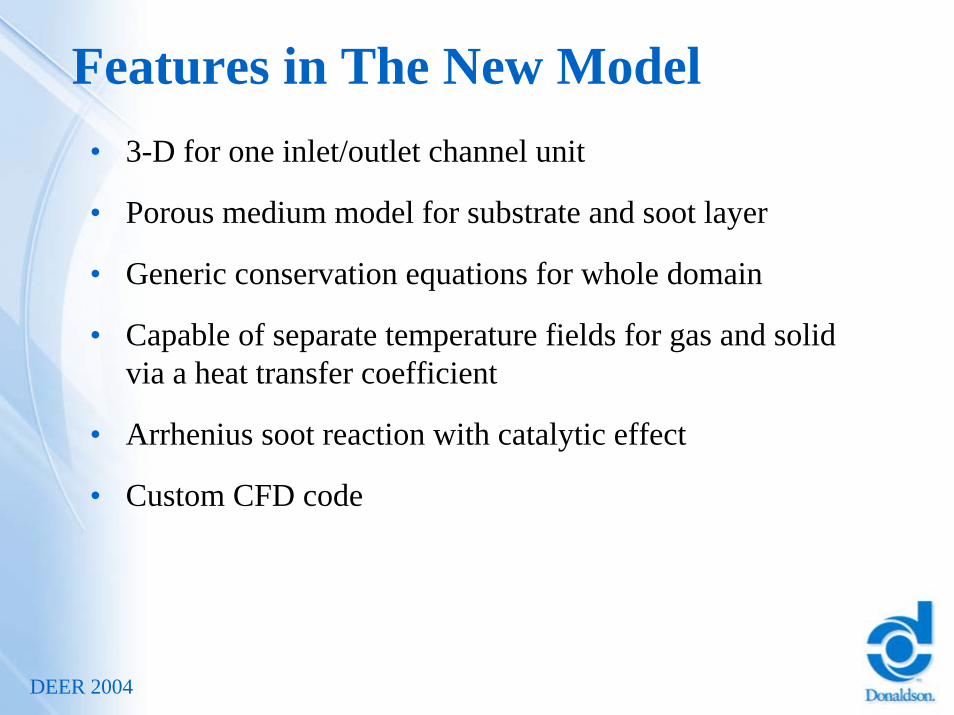
Features in The New Model• 3-D for one inlet/outlet channel unit
• Porous medium model for substrate and soot layer
• Generic conservation equations for whole domain
• Capable of separate temperature fields for gas and solid via a heat transfer coefficient
• Arrhenius soot reaction with catalytic effect
• Custom CFD code

DEER 2004
Computational Domain
3-D view
Plug
Inlet
Inlet
Outlet
Outlet
Cross-section View
Inlet
Outlet
Side View
Plug
DEER 2004
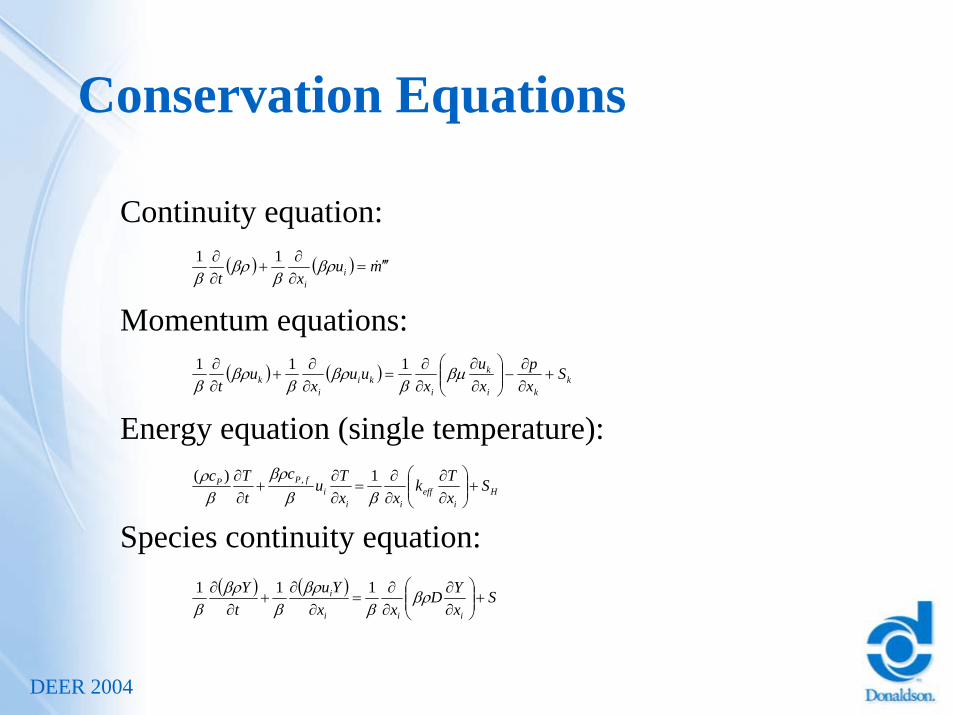
Conservation Equations
Continuity equation:
Momentum equations:
Energy equation (single temperature):
Species continuity equation:
( ) ( ) muxt i
i
′′′=∂∂
+∂∂
&βρβ
βρβ
11
( ) ( ) kki
k
iki
ik S
xp
xu
xuu
xu
t+
∂∂
−⎟⎟⎠
⎞⎜⎜⎝
⎛∂∂
∂∂
=∂∂
+∂∂ βµ
ββρ
ββρ
β111
Hi
effii
ifPP S
xTk
xxTu
ctTc
+⎟⎟⎠
⎞⎜⎜⎝
⎛∂∂
∂∂
=∂∂
+∂∂
βββρ
βρ 1)( ,
( ) ( ) SxYD
xxYu
tY
iii
i +⎟⎟⎠
⎞⎜⎜⎝
⎛∂∂
∂∂
=∂
∂+
∂∂ βρ
ββρ
ββρ
β111
DEER 2004
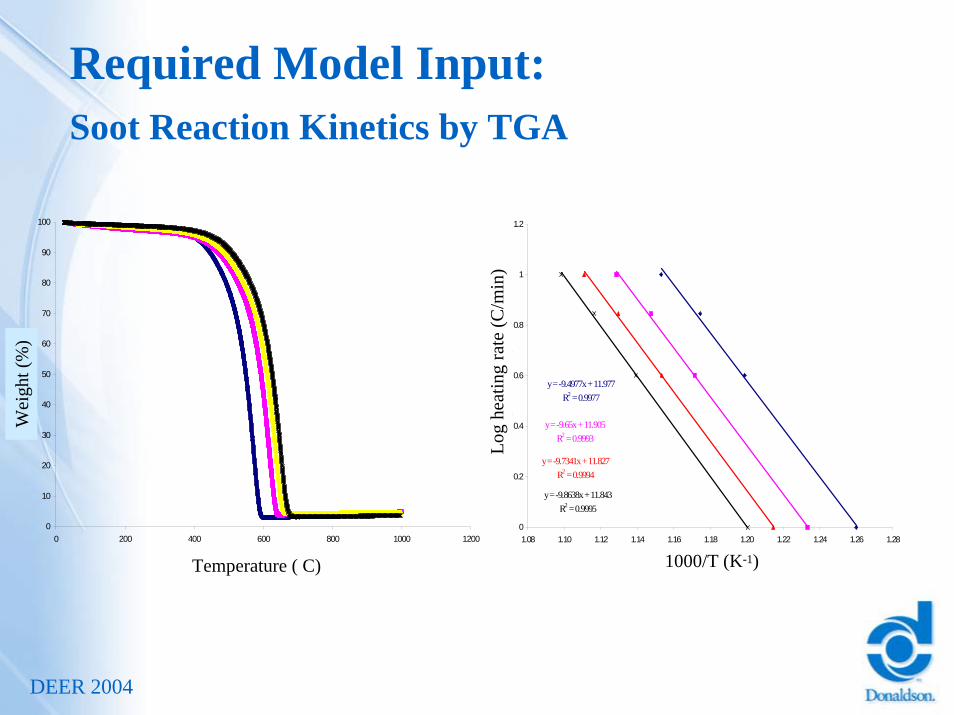
Required Model Input:Soot Reaction Kinetics by TGA
Overlay of Kinetic Study of soot oxidationSecond Method - No Pre Treatment
0
10
20
30
40
50
60
70
80
90
100
0 200 400 600 800 1000 1200
Temperature (C)
Wei
ght (
%) 1 C/min
4 C/min7 C/min10 C/min
Temperature ( C)
Wei
ght (
%)
Arrhenius Plot of Heating RateSecond Method - No pretreatment
y = -9.8638x + 11.843R2 = 0.9995
y = -9.7341x + 11.827R2 = 0.9994
y = -9.65x + 11.905R2 = 0.9993
y = -9.4977x + 11.977R2 = 0.9977
0
0.2
0.4
0.6
0.8
1
1.2
1.08 1.10 1.12 1.14 1.16 1.18 1.20 1.22 1.24 1.26 1.28
1000/T (K)
Log
Hea
ting
Rat
e (C
/min
)
70% Oxidation60% Oxidation50% Oxidation40% Oxidation
Log
heat
ing
rate
(C/m
in)
1000/T (K-1)
DEER 2004
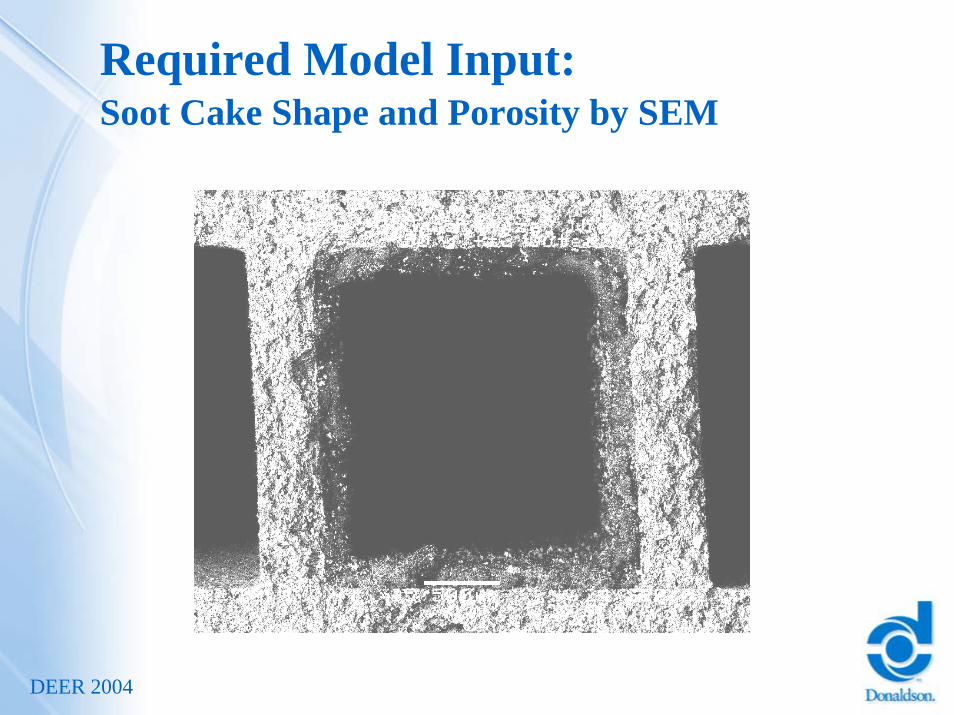
Required Model Input:Soot Cake Shape and Porosity by SEM
DEER 2004
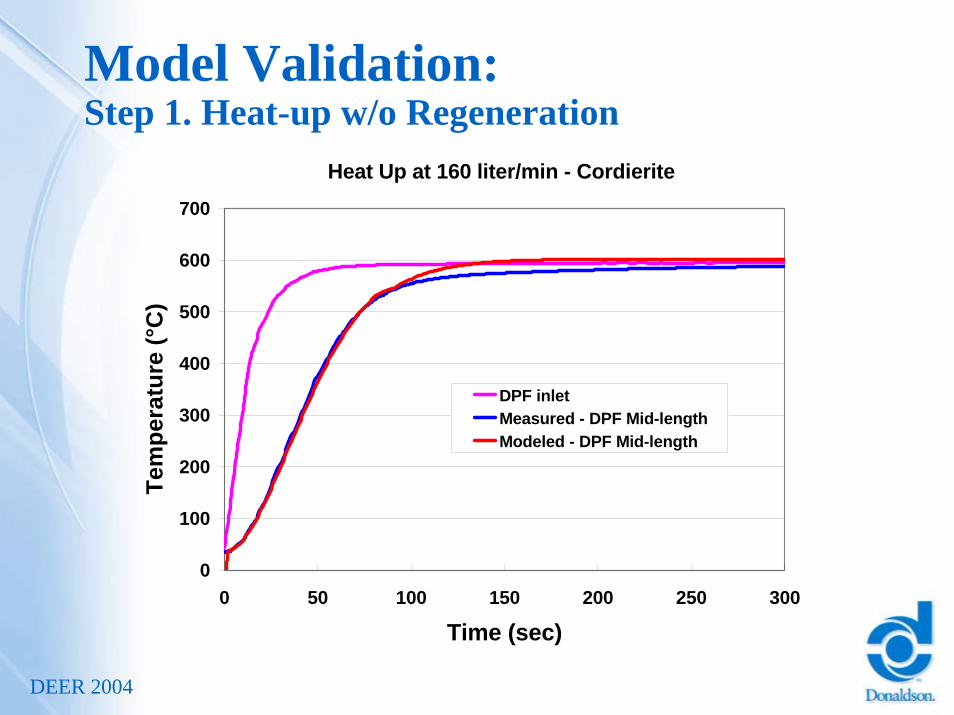
Model Validation: Step 1. Heat-up w/o Regeneration
Heat Up at 160 liter/min - Cordierite
0
100
200
300
400
500
600
700
0 50 100 150 200 250 300
Time (sec)
Tem
pera
ture
(°C
)
DPF inletMeasured - DPF Mid-lengthModeled - DPF Mid-length

DEER 2004
Model Validation:Step 2. Regeneration
Temperature Measurements at 3 Axial Locations
200
300
400
500
600
700
800
0 60 120 180 240 300
Time (sec)
Tem
pera
ture
(C)
Measured at 3" down
Measured at 6" down
Measured at 9" down
DEER 2004
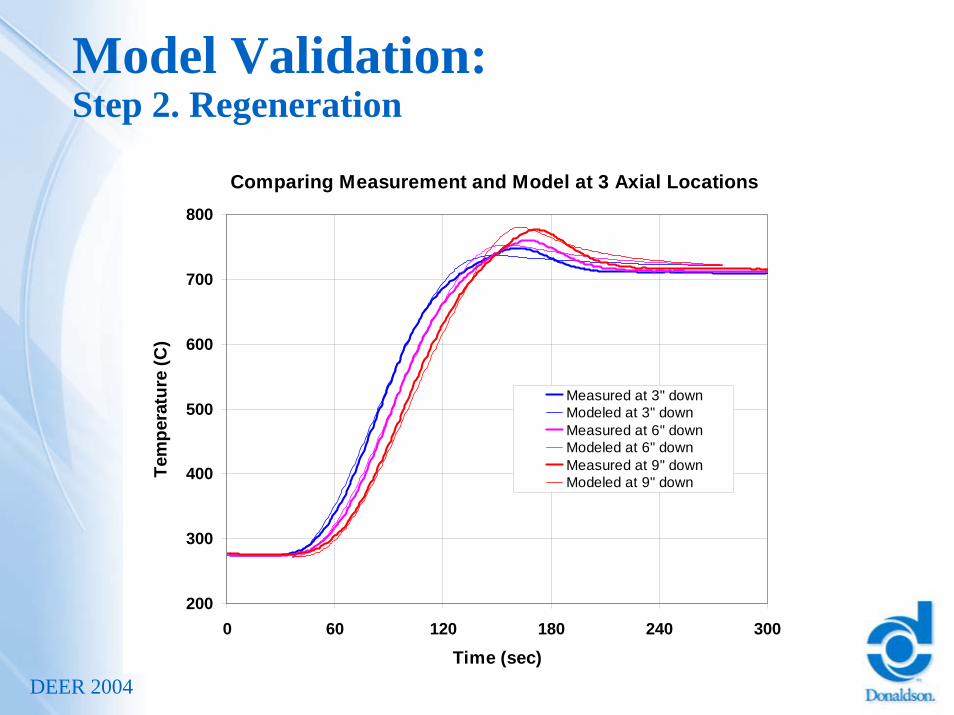
Model Validation:Step 2. Regeneration
Comparing Measurement and Model at 3 Axial Locations
200
300
400
500
600
700
800
0 60 120 180 240 300
Time (sec)
Tem
pera
ture
(C)
Measured at 3" downModeled at 3" downMeasured at 6" downModeled at 6" downMeasured at 9" downModeled at 9" down

DEER 2004
Model Results:Velocity and Temperature Fields
3-D View
Colored by Temperature
Cross-sectional View

DEER 2004
Model Results:Velocity and Pressure Field
Colored by Pressure
Side view – Porous Zone
Inlet
Outlet
Inlet
Outlet
Side view – Gas Zone

DEER 2004
Model Results:Temperature and Oxygen Distribution
DEER 2004
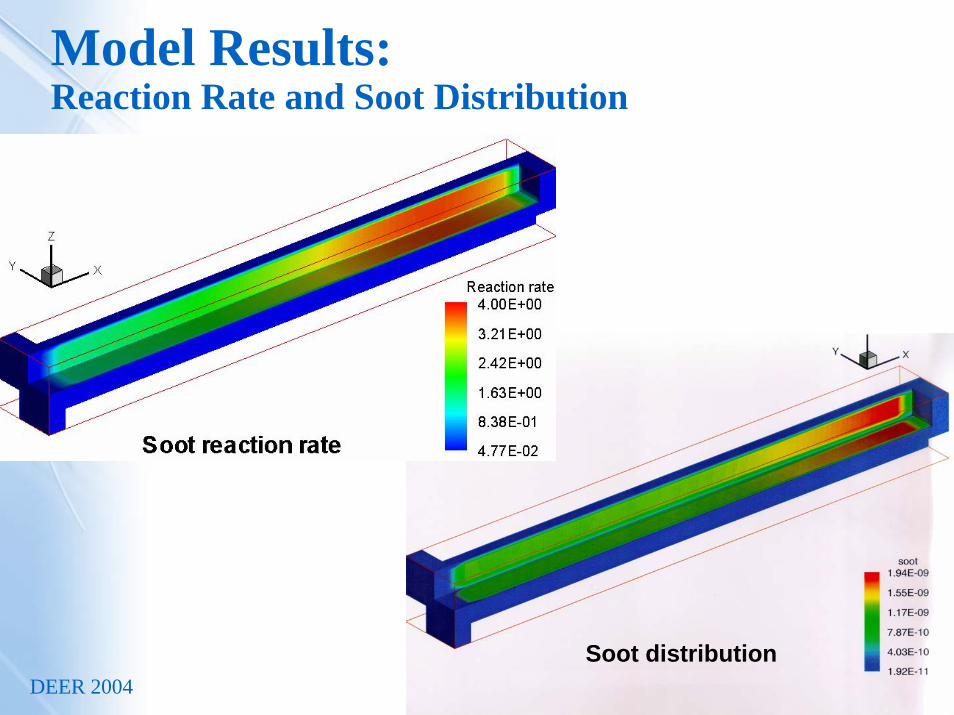
Model Results:Reaction Rate and Soot Distribution
Soot distribution

DEER 2004
Parametric Study:Effect of Flow Rate
200
300
400
500
600
700
800
900
1000
0 60 120 180 240 300
Time (sec)
Tem
pera
ture
(C)
Measured at 600 kg/h
Modeled at 600 kg/h
Modeled at 900 kg/h
Modeled at 300 kg/h
DEER 2004
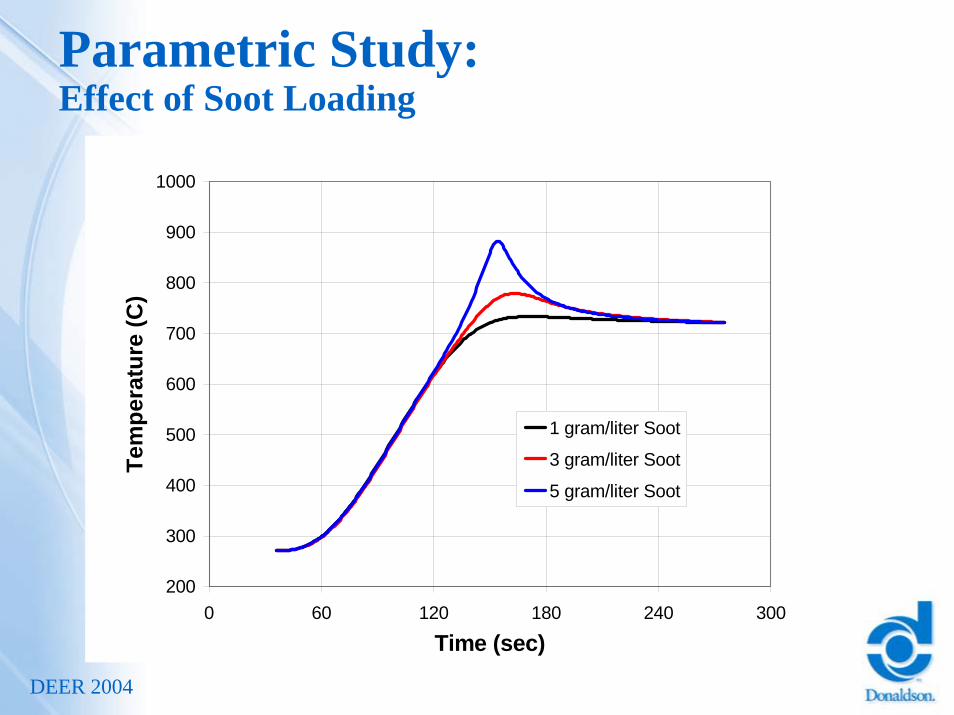
Parametric Study:Effect of Soot Loading
200
300
400
500
600
700
800
900
1000
0 60 120 180 240 300
Time (sec)
Tem
pera
ture
(C)
1 gram/liter Soot
3 gram/liter Soot
5 gram/liter Soot
DEER 2004
200
300
400
500
600
700
800
0 60 120 180 240 300 360 420 480
Time (sec)
Tem
pera
ture
(C)
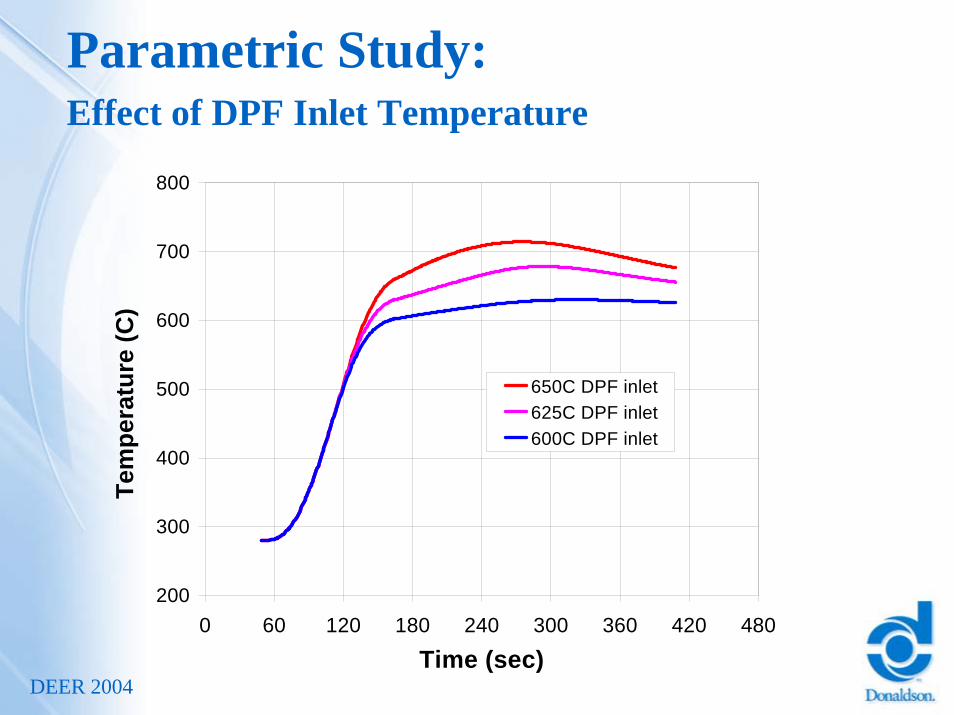
650C DPF inlet625C DPF inlet600C DPF inlet
Parametric Study:Effect of DPF Inlet Temperature

DEER 2004
200
300
400
500
600
700
800
900
1000
0 60 120 180 240 300
Time (sec)
Tem
pera
ture
(C)
10% Oxygen
5% Oxygen
Parametric Study:Effect of Oxygen

DEER 2004
Engine goes to idle
200
300
400
500
600
700
800
900
1000
0 60 120 180 240 300
Time (sec)
Tem
pera
ture
(C)
3" downstream
6" downstream
9" downstream
Mass flow rate
What-If Study:Runaway Regeneration?

DEER 2004
Summary • A new regeneration model was developed and validated• Features include: (1) 3-D; (2) A porous model; and (3)
Generic equations solved • The model provides detailed prediction of spatial and
temporal distributions of key parameters such as temperature, as well as regeneration efficiency
• The model was shown to be effective in parametric and what-if studies
• A good model is useful in the design and operation of DPF systems, hence shortening development cycle


