
FROM DEVICE TO SYSTEMEFFICIENCY:
Examples from Buildings
L.D.Danny Harvey
Department of GeographyUniversity of Toronto
Email: [email protected]
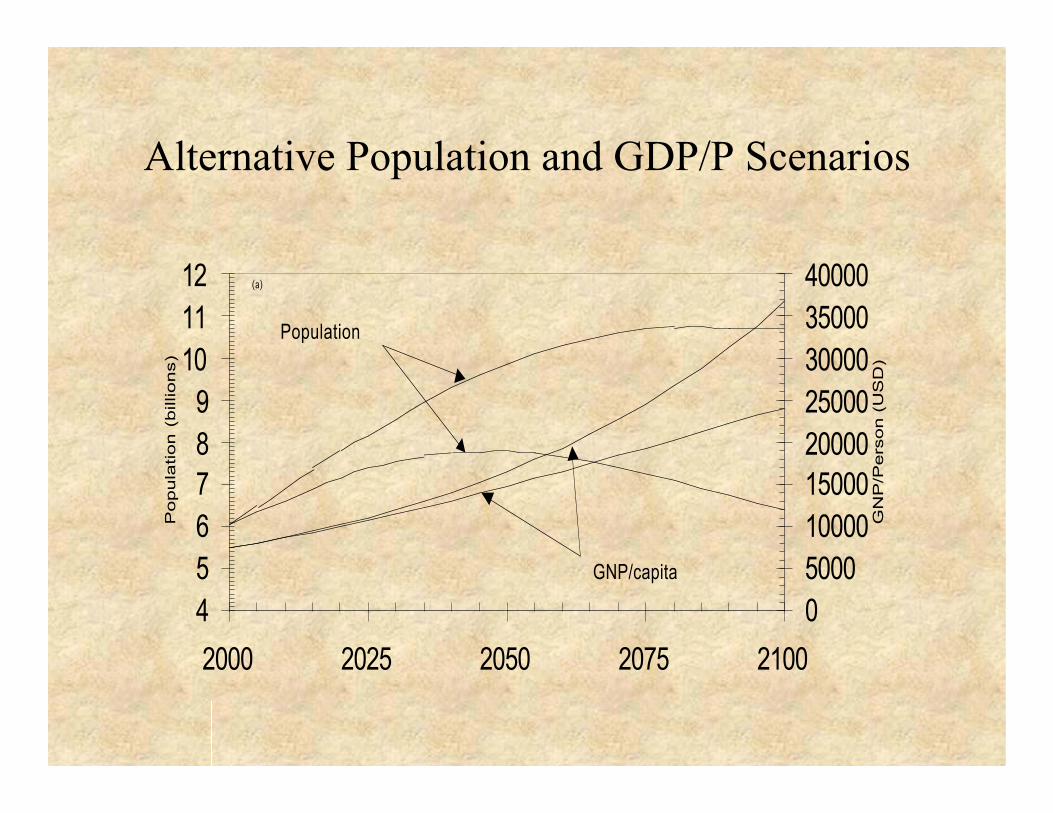
Alternative Population and GDP/P Scenarios
456789
101112
2000 2025 2050 2075 2100
Po
pu
latio
n (
bill
ion
s)
0500010000150002000025000300003500040000
GN
P/P
ers
on
(U
SD
)
(a)
Population
GNP/capita

Medium Population, 1.6% per yeargrowth of GDP per capita, 450 ppmv peak
020406080
100
0.0 0.5 1.0 1.5 2.0 2.5 3.0Rate of Energy Intensity Decline (%/yr)
Required C
arb
on-F
ree P
ow
er
(TW
)
2100
2075
2050
2025
Low Population, Declining Rate of Growth inGDP per capita, 450 ppmv peak
0
20
40
0.0 0.5 1.0 1.5 2.0 2.5 3.0Rate of Energy Intensity Decline (%/yr)
Required C
arb
on-F
ree P
ow
er
(TW
)
2100
2075
2050
2025
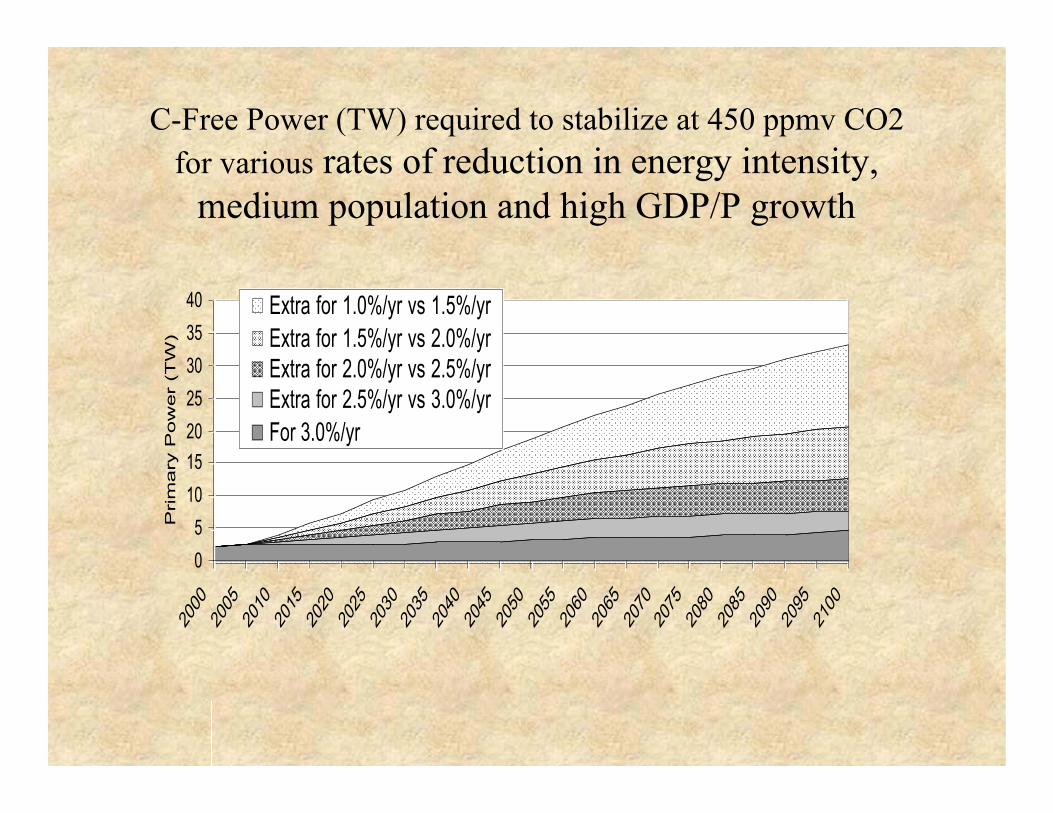
C-Free Power (TW) required to stabilize at 450 ppmv CO2for various rates of reduction in energy intensity,
medium population and high GDP/P growth
05
10152025303540
2000
2005
2010
2015
2020
2025
2030
2035
2040
2045
2050
2055
2060
2065
2070
2075
2080
2085
2090
2095
2100
Prim
ary
Pow
er
(TW
)
Extra for 1.0%/yr vs 1.5%/yrExtra for 1.5%/yr vs 2.0%/yrExtra for 2.0%/yr vs 2.5%/yrExtra for 2.5%/yr vs 3.0%/yrFor 3.0%/yr
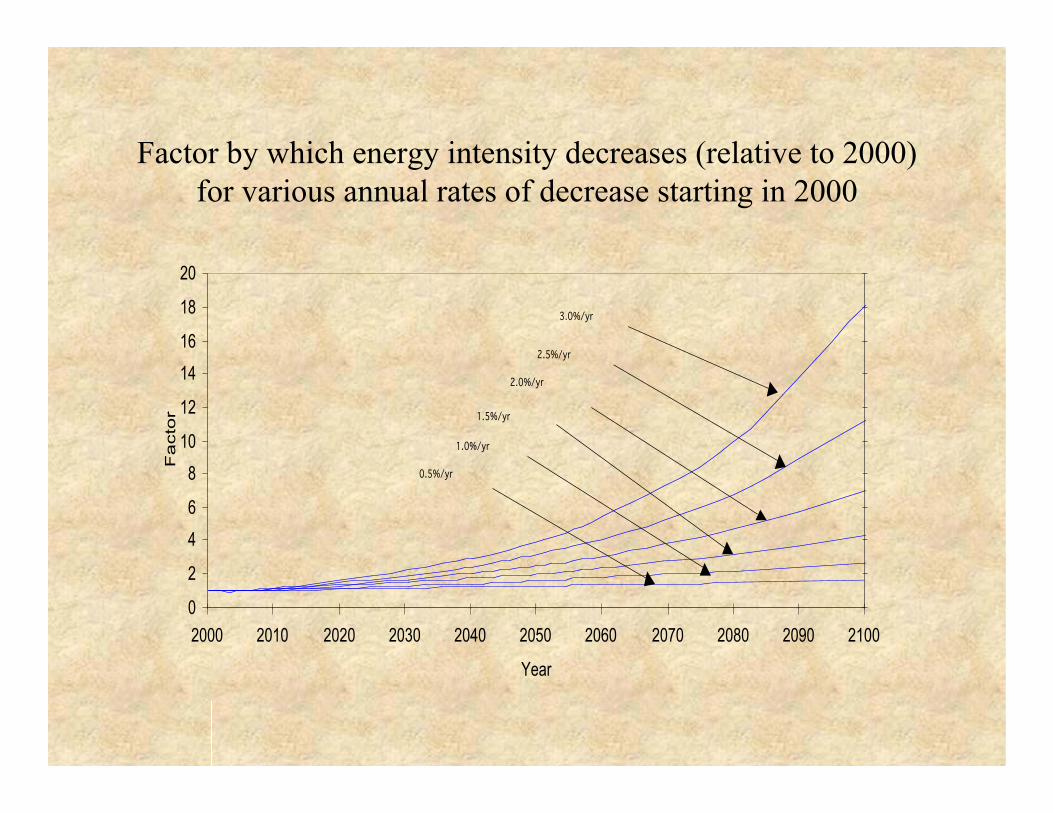
Factor by which energy intensity decreases (relative to 2000)for various annual rates of decrease starting in 2000
0
2
4
6
8
10
12
14
16
18
20
2000 2010 2020 2030 2040 2050 2060 2070 2080 2090 2100
Year
Factor
3.0%/yr
2.5%/yr
2.0%/yr
1.5%/yr
1.0%/yr
0.5%/yr
Energy and the New Reality: Facing upto Climatic Change
• Island Press (Washington), Spring 2005• 160,000 words• 225 figures+photos• 130 tables• 13 mathematical boxes
A Primer on Energy-EfficientBuilding Design and Retrofits
• Proposal to Island Press, Summer 2004 release• 110,000 words• 105 figures• 60 Tables• 15 mathematical boxes
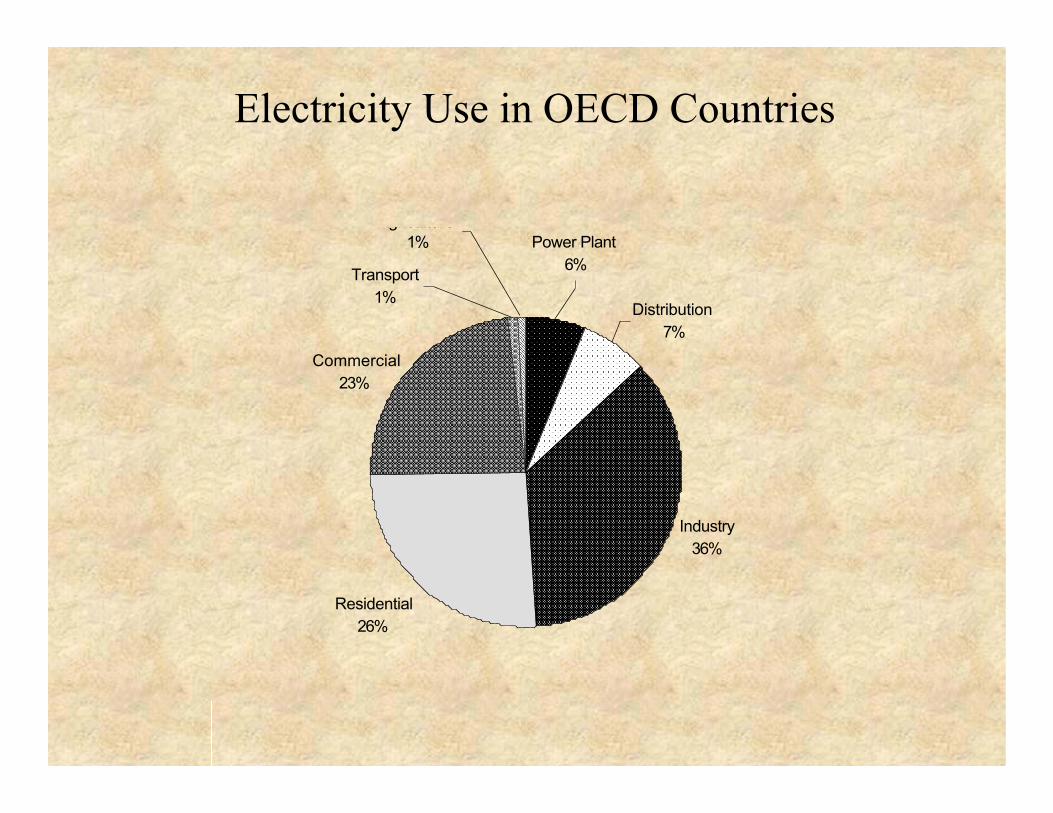
Electricity Use in OECD Countries
Industry36%
Residential26%
Commercial23%
Power Plant6%
Agriculture1%
Transport1%
Distribution7%
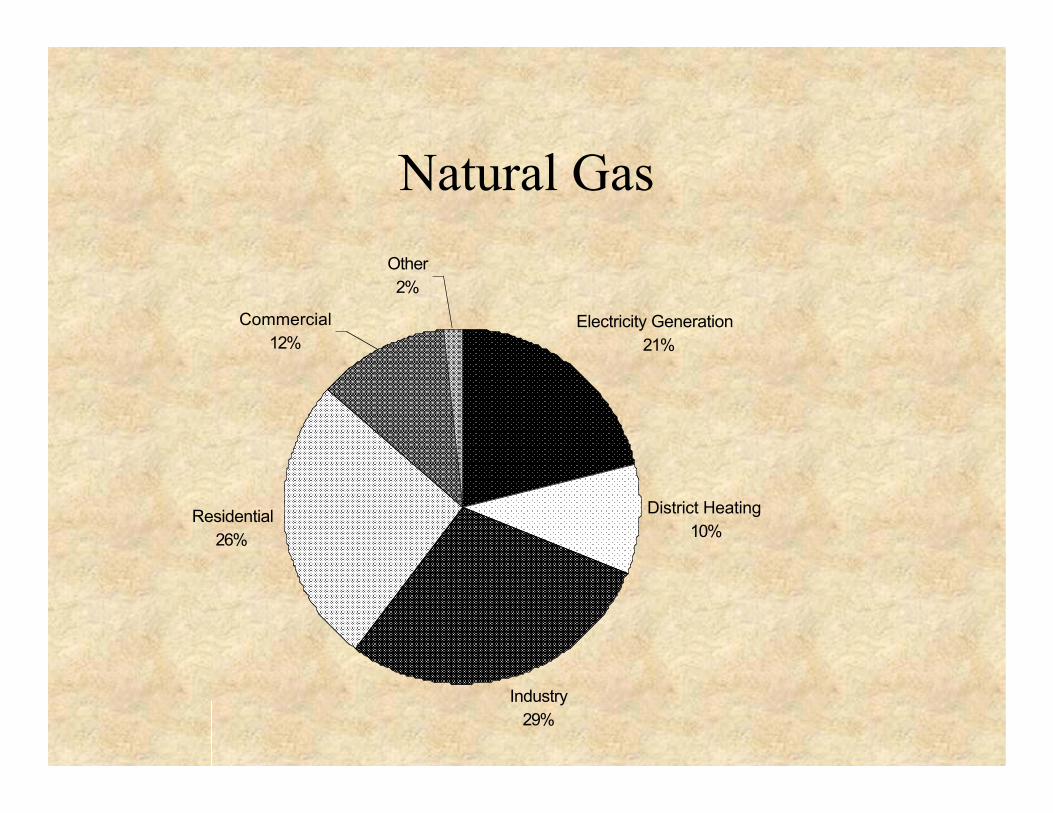
Natural Gas
Electricity Generation21%
District Heating10%
Industry29%
Residential26%
Other2%
Commercial12%
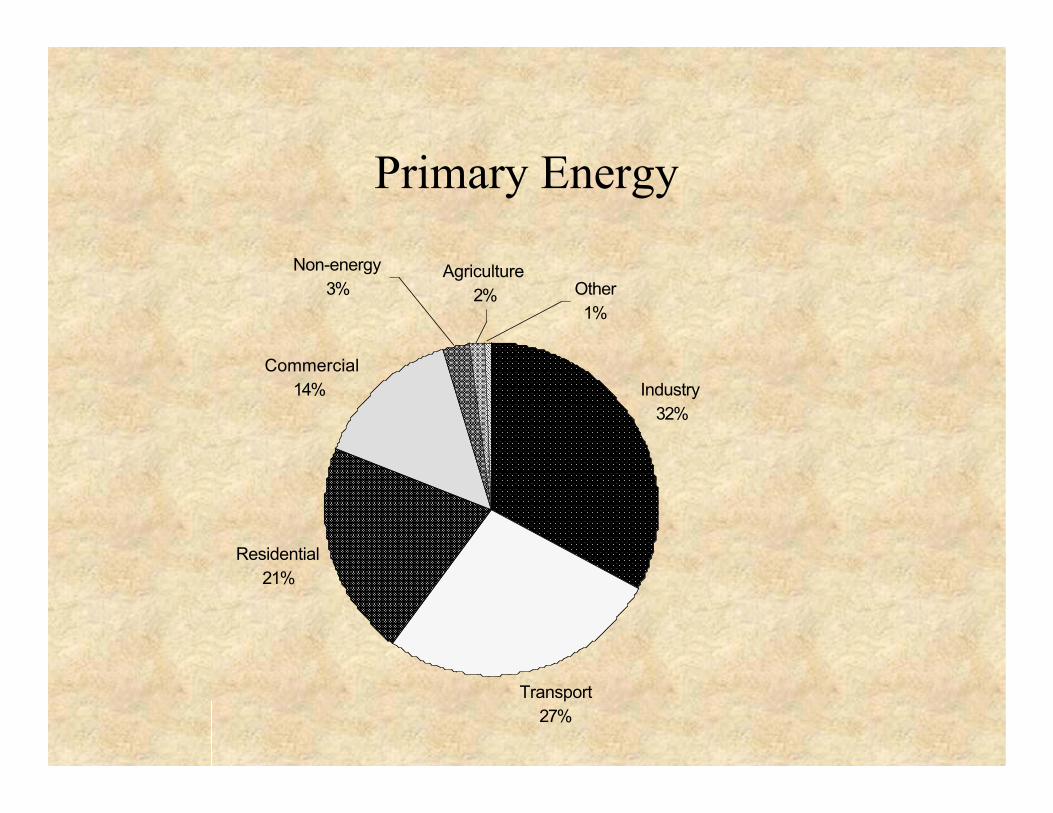
Primary Energy
Industry32%
Transport27%
Residential21%
Commercial14%
Agriculture2%
Non-energy3% Other
1%
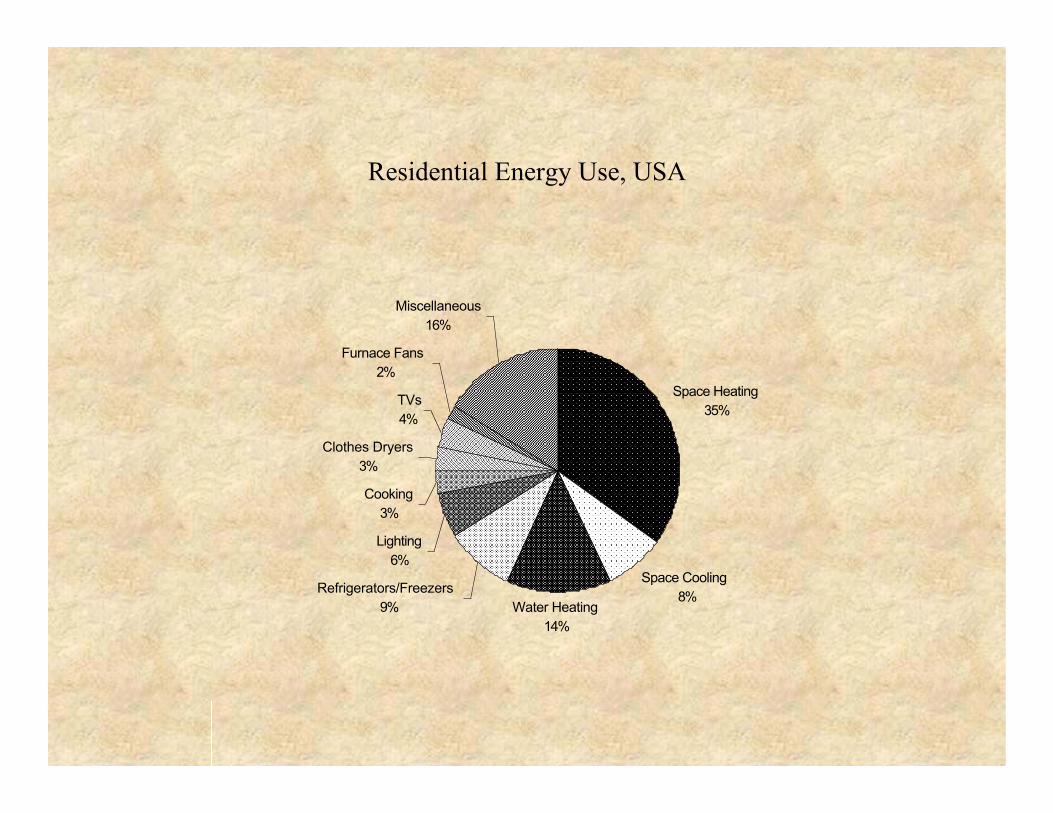
Residential Energy Use, USA
Space Heating35%
Space Cooling8%
Water Heating14%
Refrigerators/Freezers9%
Lighting6%
Cooking3%
Clothes Dryers3%
TVs4%
Furnace Fans2%
Miscellaneous16%
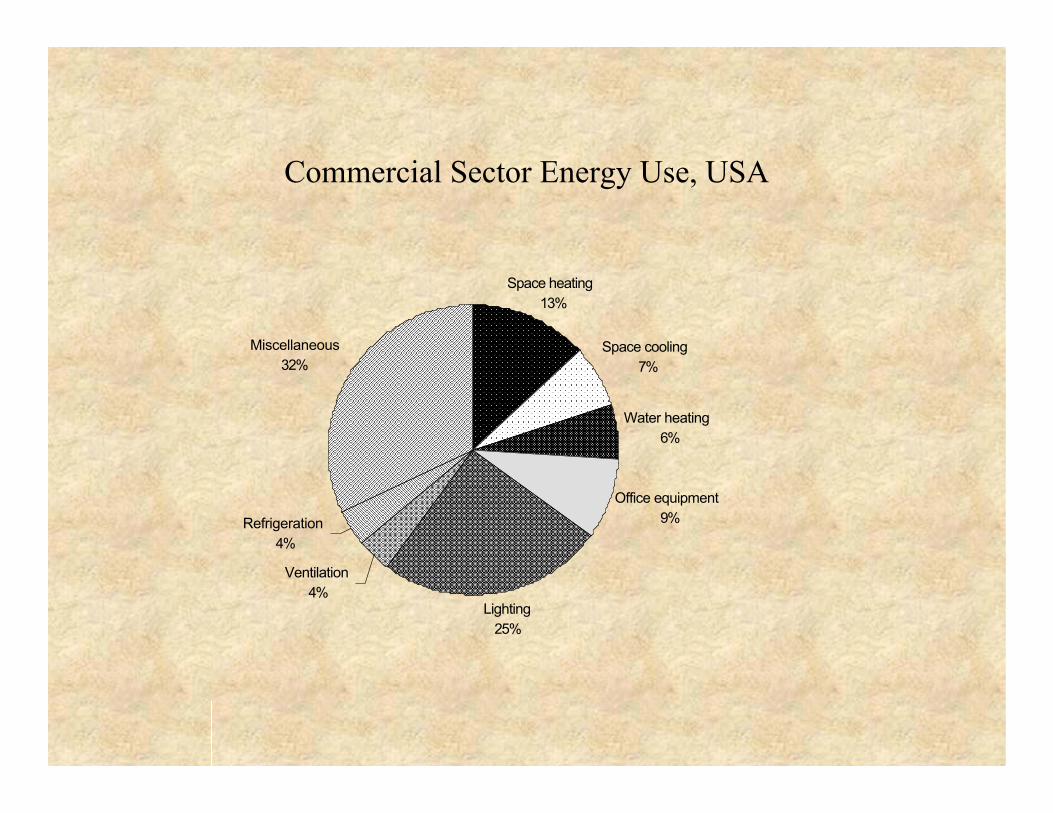
Commercial Sector Energy Use, USA
Space cooling7%
Water heating6%
Office equipment9%
Lighting25%
Ventilation4%
Refrigeration4%
Miscellaneous32%
Space heating13%
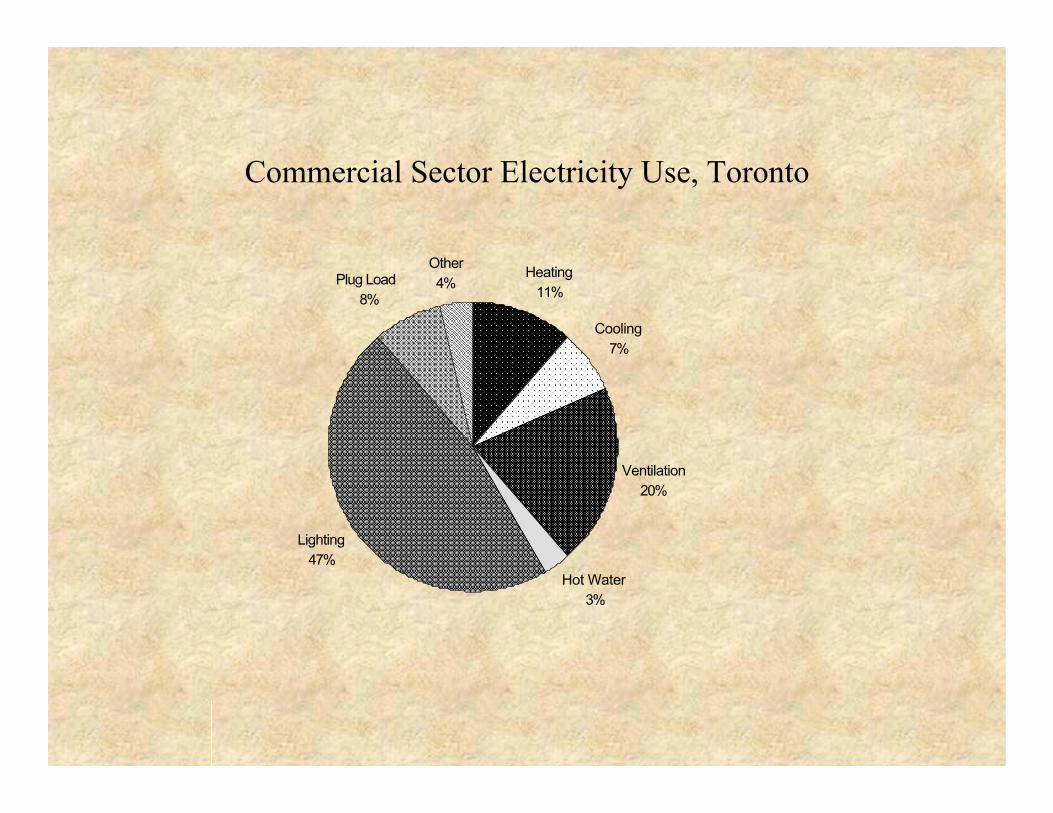
Commercial Sector Electricity Use, Toronto
Heating11%
Cooling7%
Ventilation20%
Hot Water3%
Lighting47%
Plug Load8%
Other4%
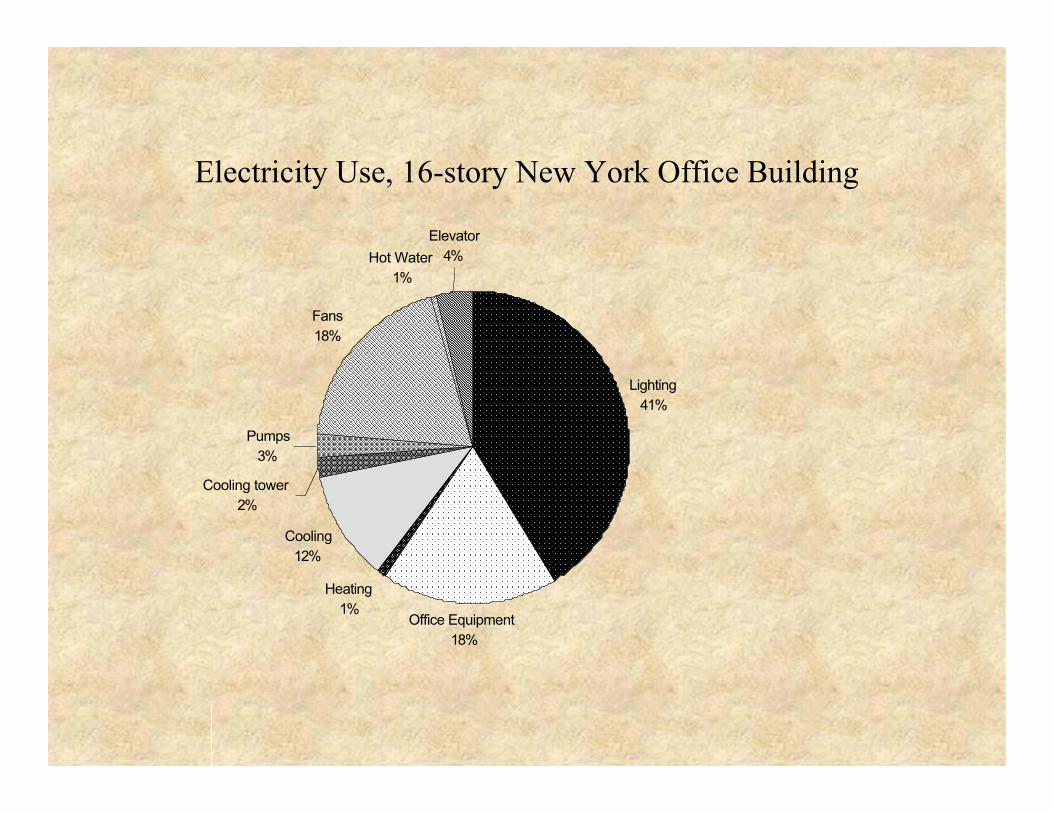
Electricity Use, 16-story New York Office Building
Lighting41%
Office Equipment18%
Heating1%
Cooling12%
Cooling tower2%
Pumps3%
Fans18%
Hot Water1%
Elevator4%
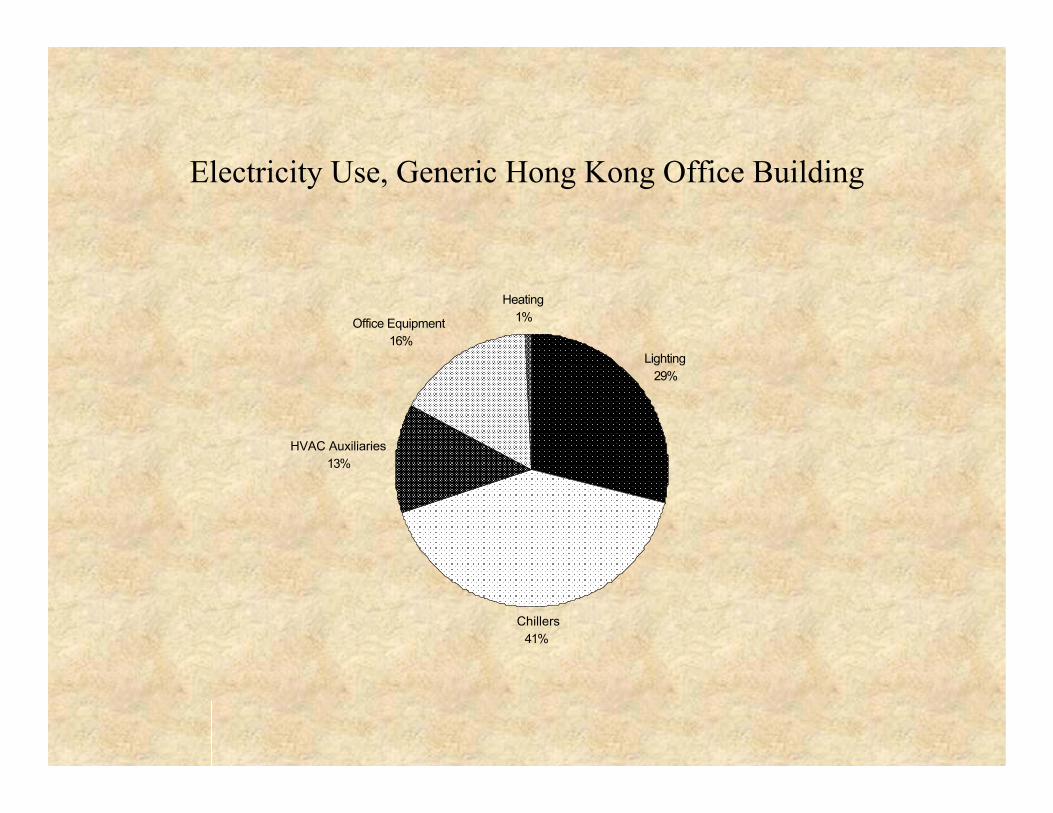
Electricity Use, Generic Hong Kong Office Building
Lighting29%
Chillers41%
HVAC Auxiliaries13%
Office Equipment16%
Heating1%
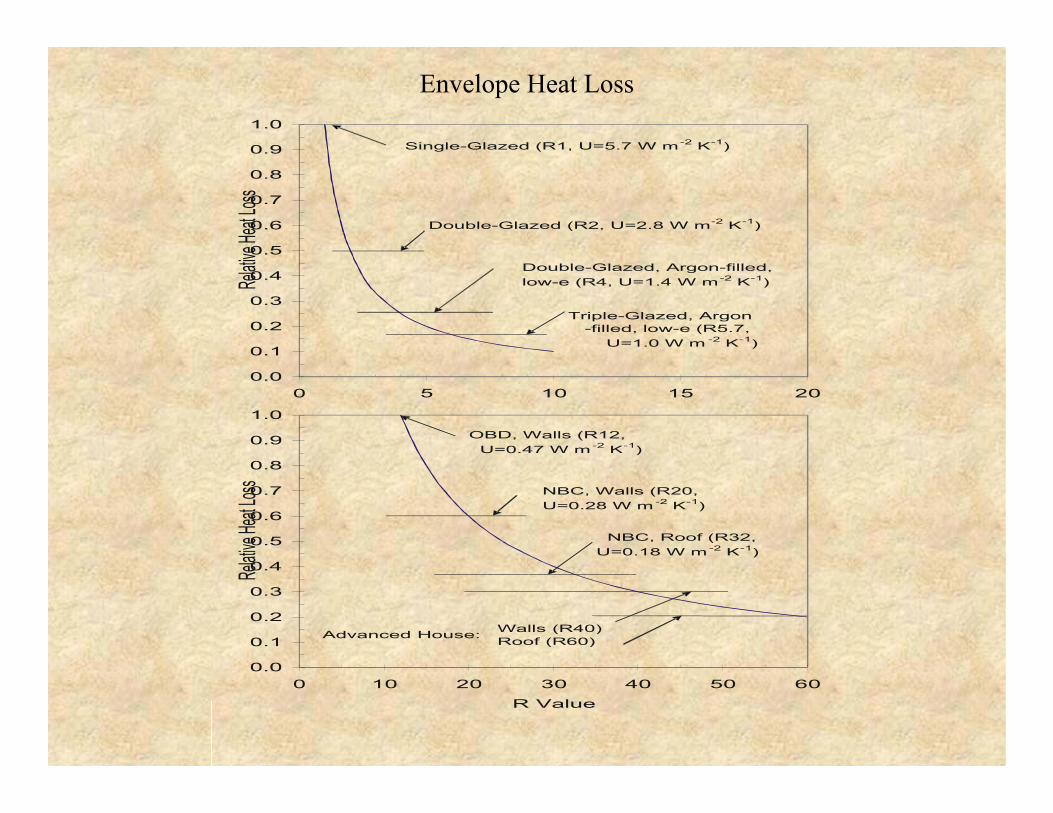
Envelope Heat Loss
0.00.10.20.30.40.50.60.70.80.91.0
0 5 10 15 20RelativeH ea t Lo ss
Single-Glazed (R1, U=5.7 W m-2 K-1)Double-Glazed (R2, U=2.8 W m-2 K-1)Double-Glazed, Argon-filled,low-e (R4, U=1.4 W m-2 K-1)Triple-Glazed, Argon -filled, low-e (R5.7, U=1.0 W m -2 K-1)
0.00.10.20.30.40.50.60.70.80.91.0
0 10 20 30 40 50 60R Value
Relati ve He at Los s
OBD, Walls (R12, U=0.47 W m-2 K-1)NBC, Walls (R20, U=0.28 W m-2 K-1) NBC, Roof (R32, U=0.18 W m-2 K-1)Walls (R40)Roof (R60)Advanced House:
0.0
0.1
0.2
0.3
0.4
0.5
0.6
0.7
0.8
0.9
1.0
0 5 10 15 20
Relativ
eHeat
Loss
Single-Glazed (R1, U=5.7 W m-2 K-1)
Double-Glazed (R2, U=2.8 W m-2 K-1)
Double-Glazed, Argon-filled,low-e (R4, U=1.4 W m-2 K-1)
Triple-Glazed, Argon -filled, low-e (R5.7, U=1.0 W m -2 K-1)
0.0
0.1
0.2
0.3
0.4
0.5
0.6
0.7
0.8
0.9
1.0
0 10 20 30 40 50 60R Value
Relativ
eHeat
Loss
OBD, Walls (R12, U=0.47 W m-2 K-1)
NBC, Walls (R20, U=0.28 W m-2 K-1)
NBC, Roof (R32, U=0.18 W m-2 K-1)
Walls (R40)Roof (R60)Advanced House:
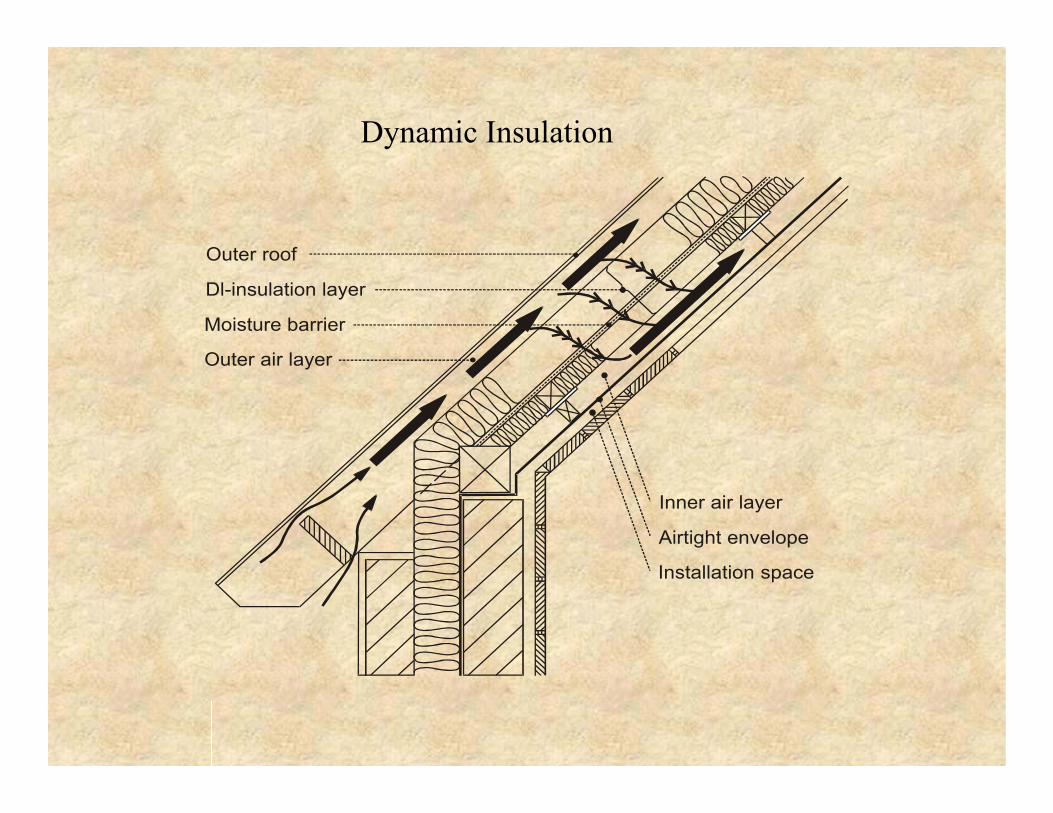
Dynamic Insulation
Inner air layer
Airtight envelope
Installation space
Outer roof
Dl-insulation layer
Moisture barrier
Outer air layer
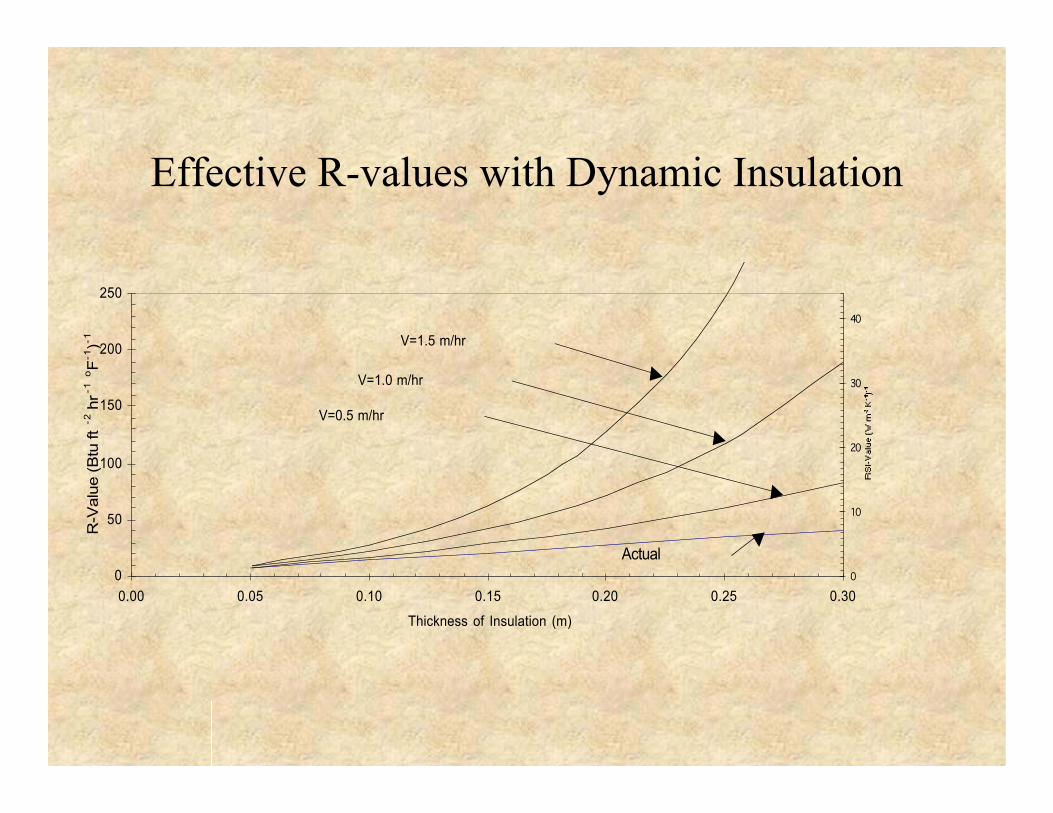
Effective R-values with Dynamic Insulation
0
50
100
150
200
250
0.00 0.05 0.10 0.15 0.20 0.25 0.30
Thickness of Insulation (m)
R-V
alue
(Btu
ft-2
hr-1
oF
-1)-1
0
10
20
30
40
V=1.5 m/hr
V=1.0 m/hr
V=0.5 m/hr
Actual
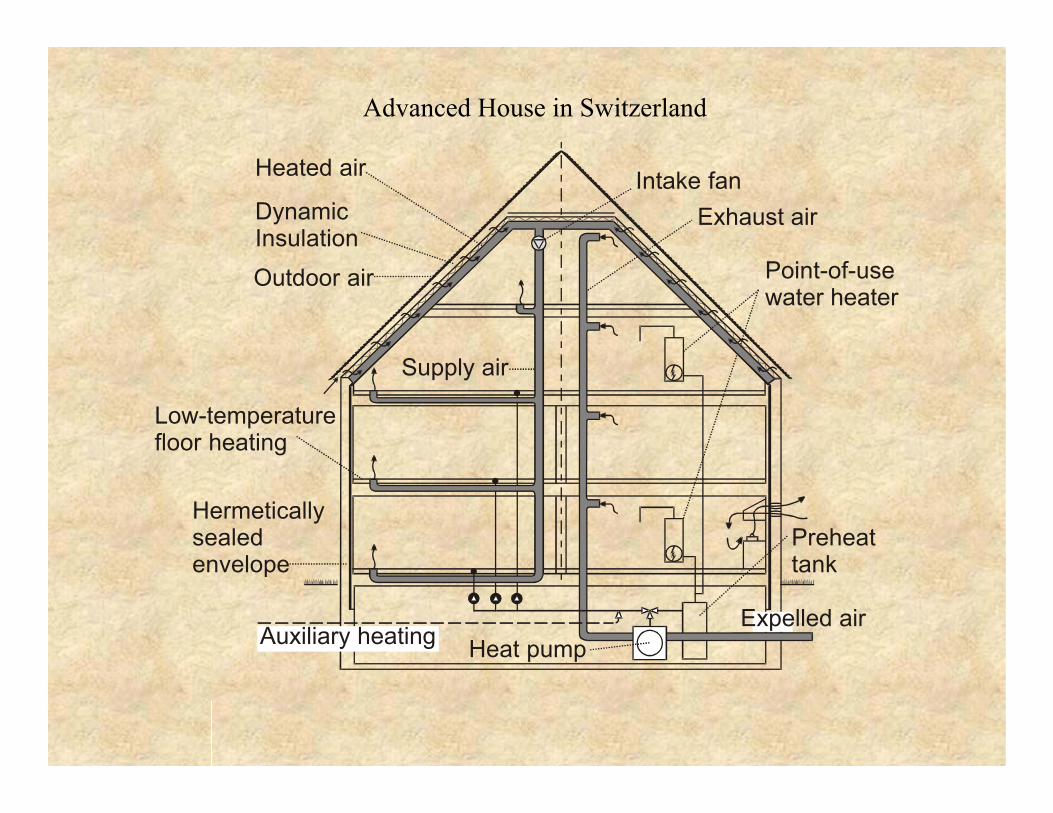
Advanced House in Switzerland
Heat pump
Preheattank
Point-of-usewater heater
Exhaust air
Supply air
Heated air
Dynamic InsulationOutdoor air
Hermeticallysealedenvelope
Auxiliary heatingExpelled air
Intake fan
Low-temperaturefloor heating
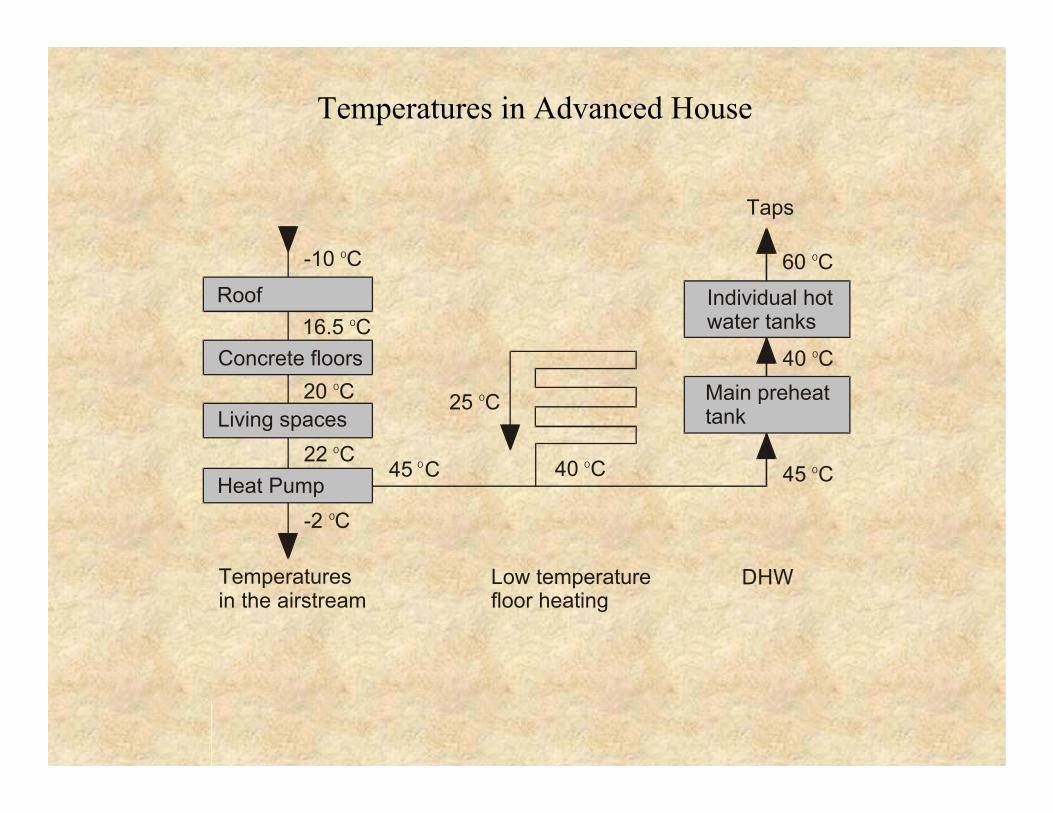
Temperatures in Advanced House
40 CO
25 CO
45 CO22 CO
20 CO
16.5 CO
-2 CO
-10 CO
45 CO
40 CO
60 CO
Taps
Individual hotwater tanks
Main preheattank
Roof
Concrete floors
Living spaces
Heat Pump
Temperaturesin the airstream
Low temperaturefloor heating
DHW
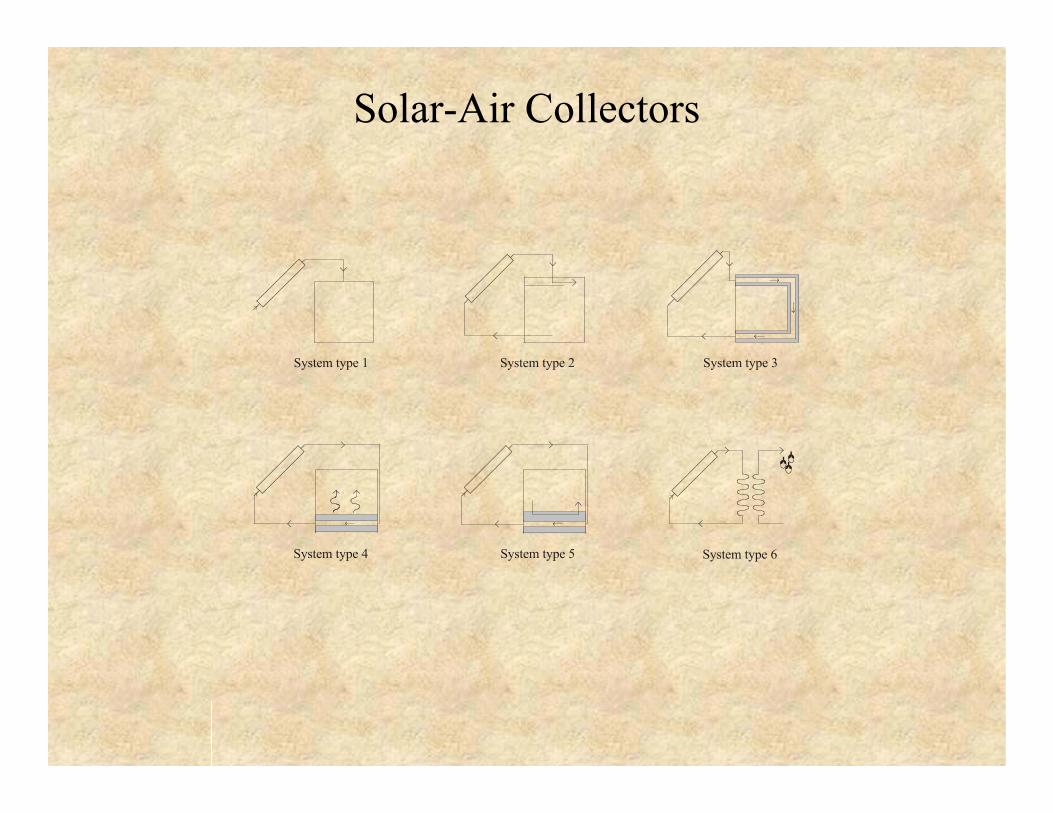
Solar-Air Collectors
System type 1 System type 2 System type 3
System type 6System type 5System type 4
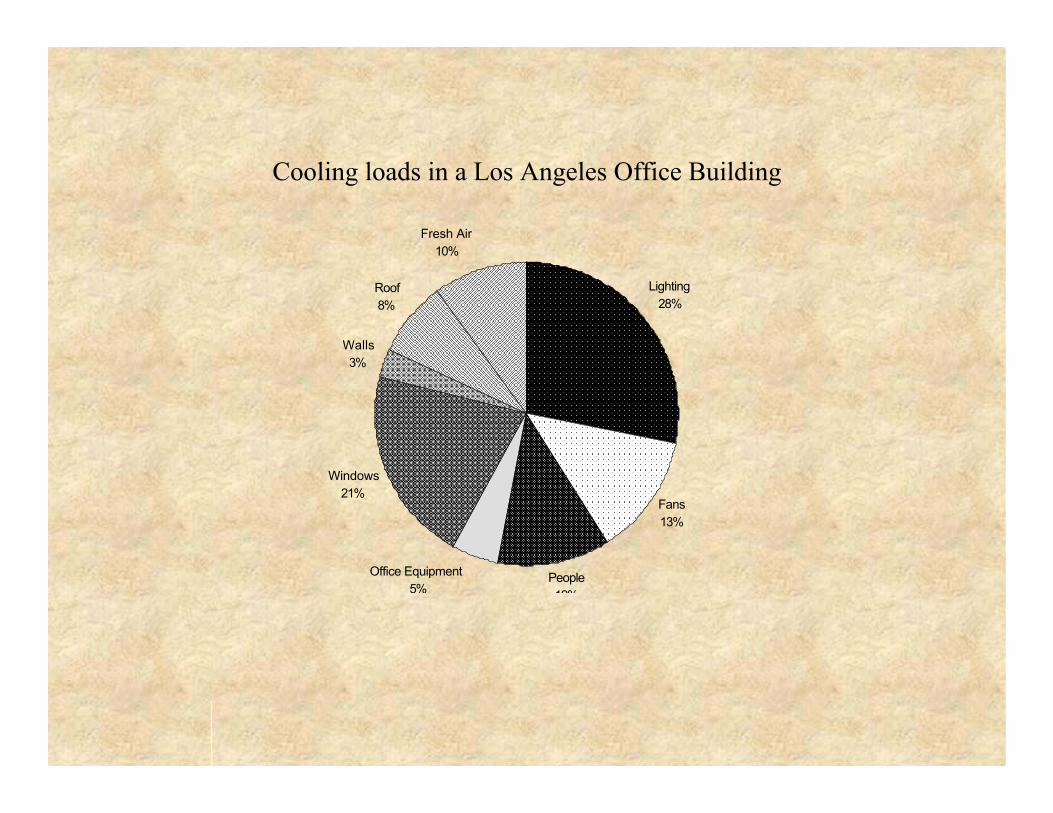
Cooling loads in a Los Angeles Office Building
Lighting28%
Fans13%
People12%
Office Equipment5%
Windows21%
Walls3%
Roof8%
Fresh Air10%
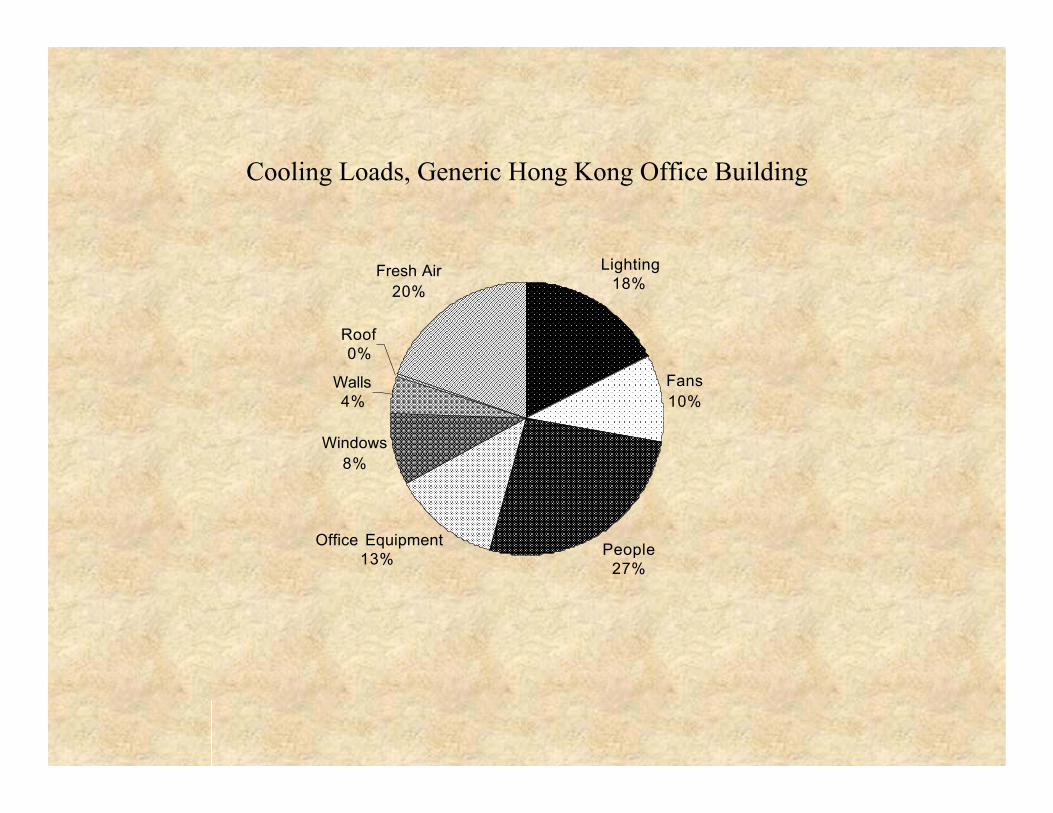
Cooling Loads, Generic Hong Kong Office Building
Lighting18%
Fans10%
People27%
Office Equipment13%
Windows8%
Walls4%
Roof0%
Fresh Air20%
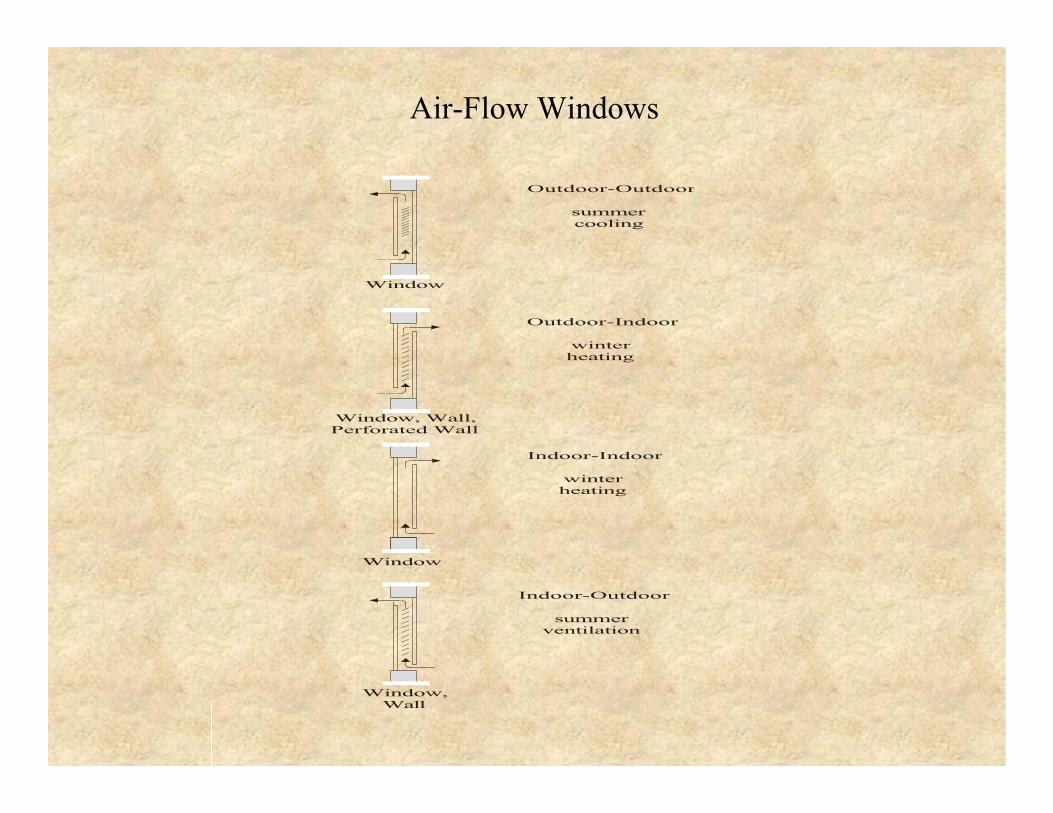
Air-Flow Windows
Window
Outdoor-Outdoor
summercooling
Window
Indoor-Indoor
winterheating
Window, Wall,Perforated Wall
Outdoor-Indoor
winterheating
Window,Wall
Indoor-Outdoor
summerventilation
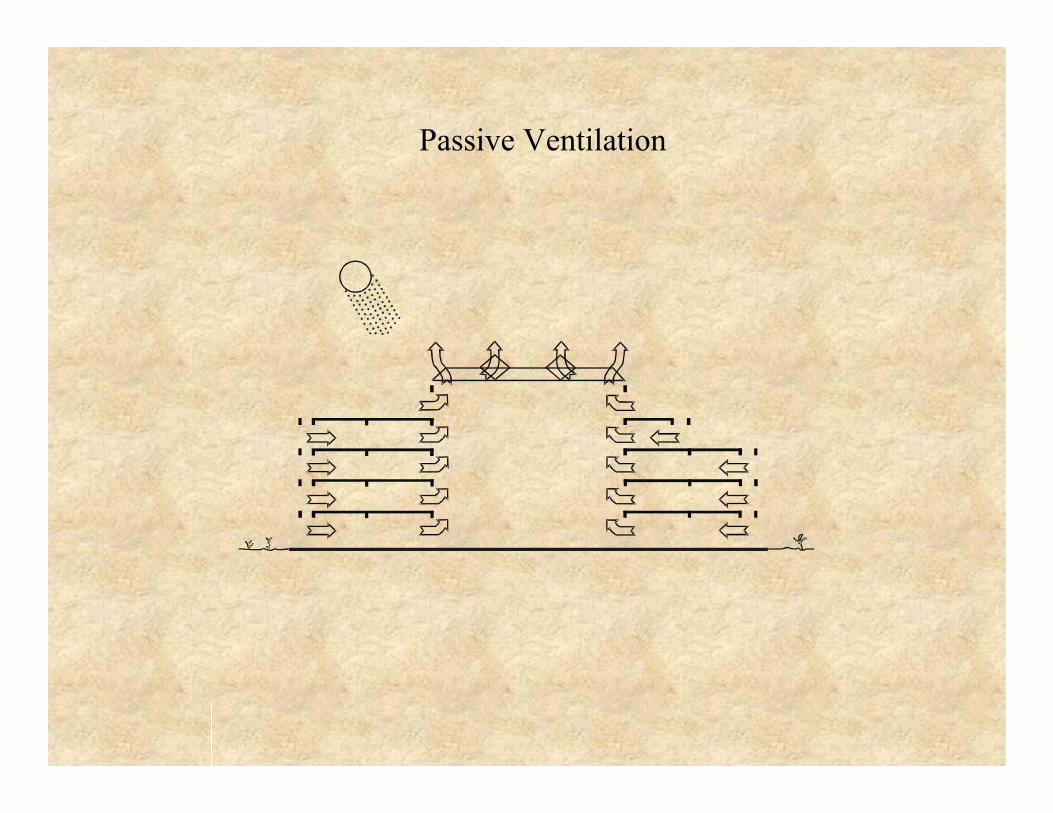
Passive Ventilation
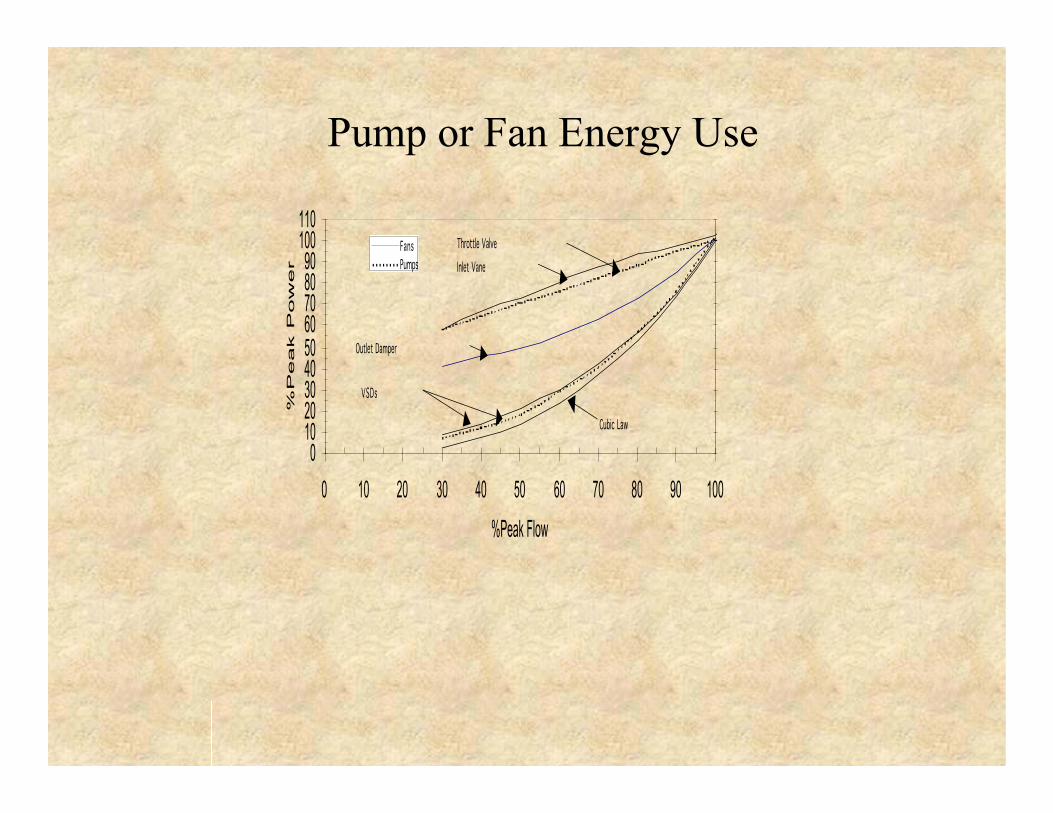
Pump or Fan Energy Use
0102030405060708090
100110
0 10 20 30 40 50 60 70 80 90 100
%Peak Flow
%P
ea
k P
ow
er
FansPumps Inlet Vane
Throttle Valve
Outlet Damper
VSDs
Cubic Law
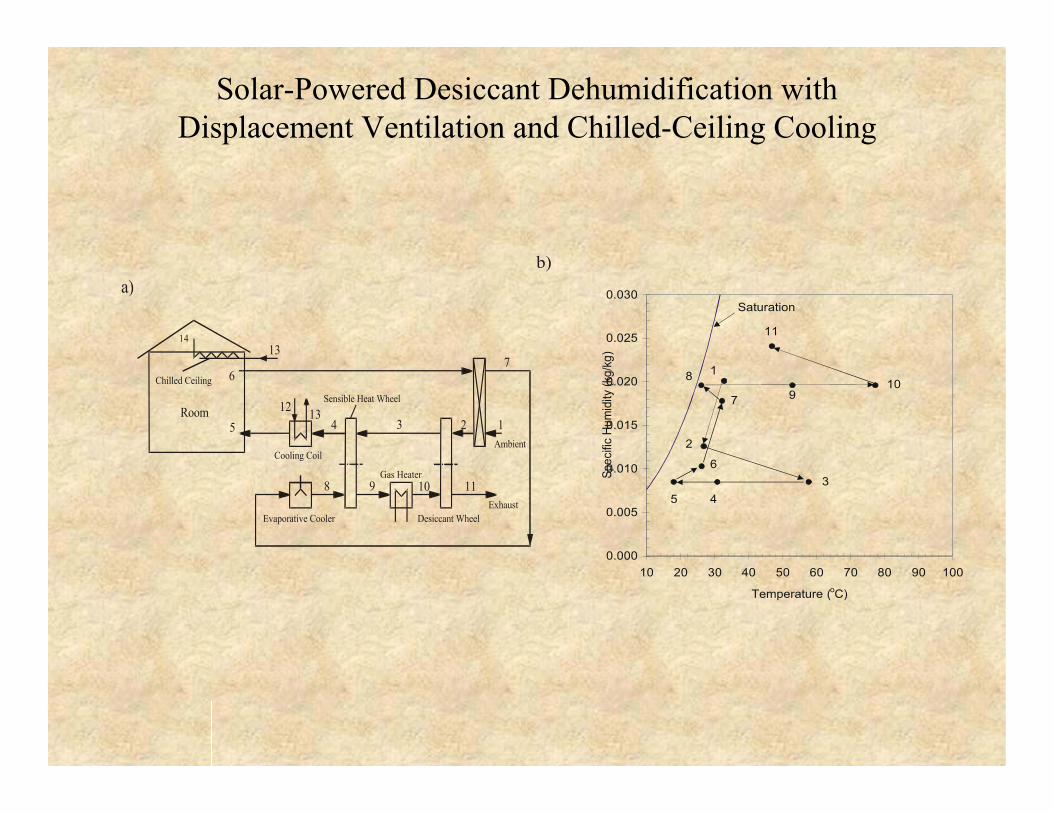
Solar-Powered Desiccant Dehumidification withDisplacement Ventilation and Chilled-Ceiling Cooling
123
67
8 9 10 11
Room
Ambient
Exhaust
Sensible Heat Wheel
Gas Heater
Desiccant Wheel
Cooling Coil
Evaporative Cooler
Chilled Ceiling
1413
512 13
4
a)
0.000
0.005
0.010
0.015
0.020
0.025
0.030
10 20 30 40 50 60 70 80 90 100
Temperature (oC)Sp
ecifi
cH
umid
i ty( k
g /kg
)
1
2
34
Saturation
97
5
6
810
11
b)
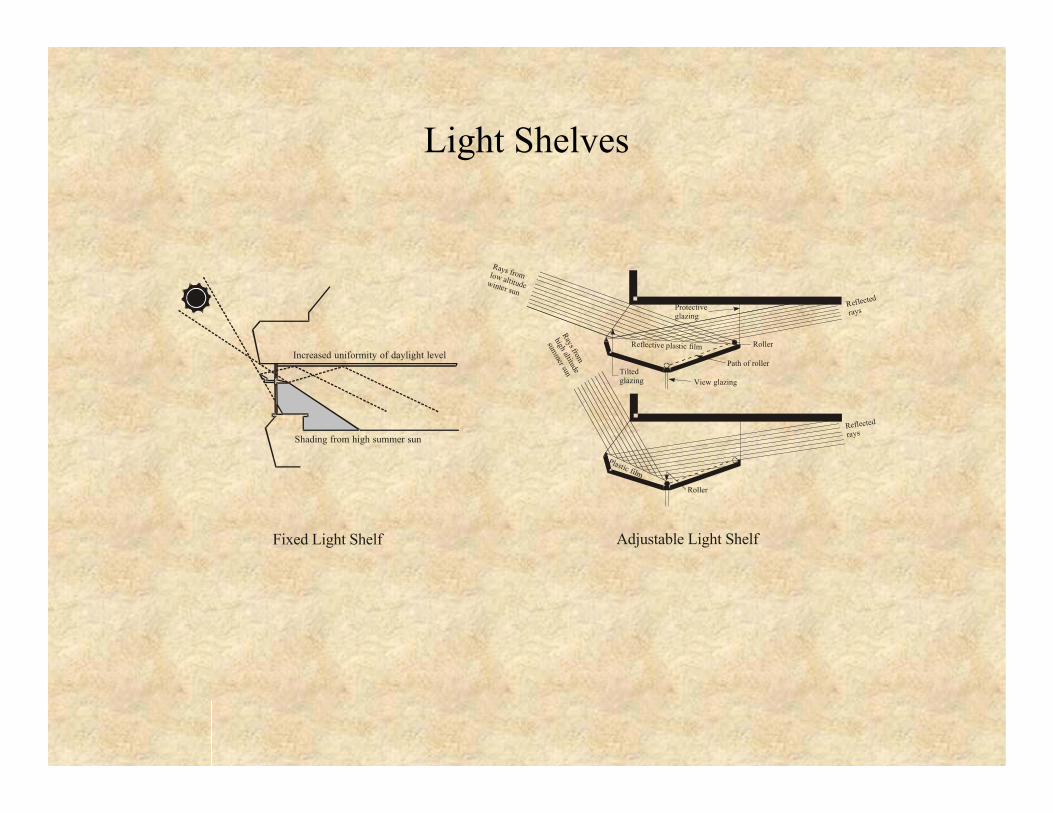
Light Shelves
View glazingTiltedglazing
Path of roller
RollerReflective plastic film
Protectiveglazing
Reflected
rays
Rays fromlow altitudewinter sun
Rays from
high altitude
summer sun
Plastic film
Roller
Reflectedrays
Increased uniformity of daylight level
Shading from high summer sun
Fixed Light Shelf Adjustable Light Shelf
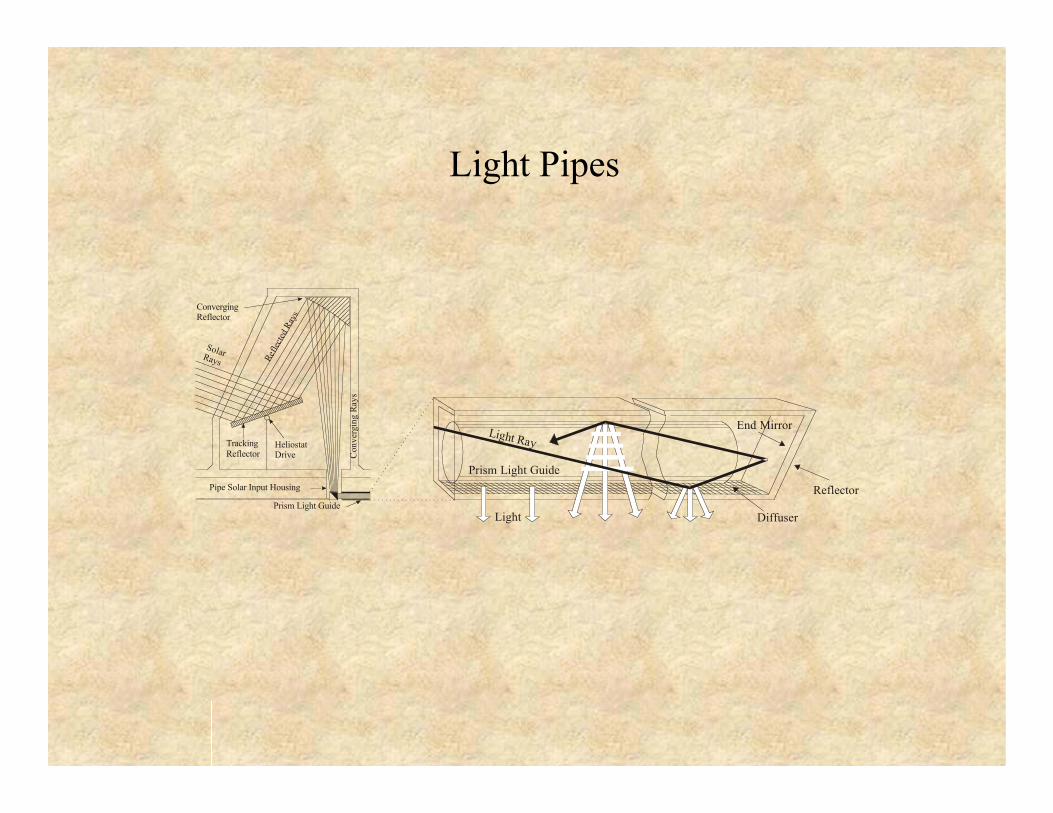
Light Pipes
Prism Light Guide
Pipe Solar Input Housing
TrackingReflector
HeliostatDrive C
onve
rgin
g Ra
ys
ConvergingReflector
Solar Rays Refle
cted R
ays
Diffuser
Reflector
End Mirror
Light
Prism Light Guide
Light Ray
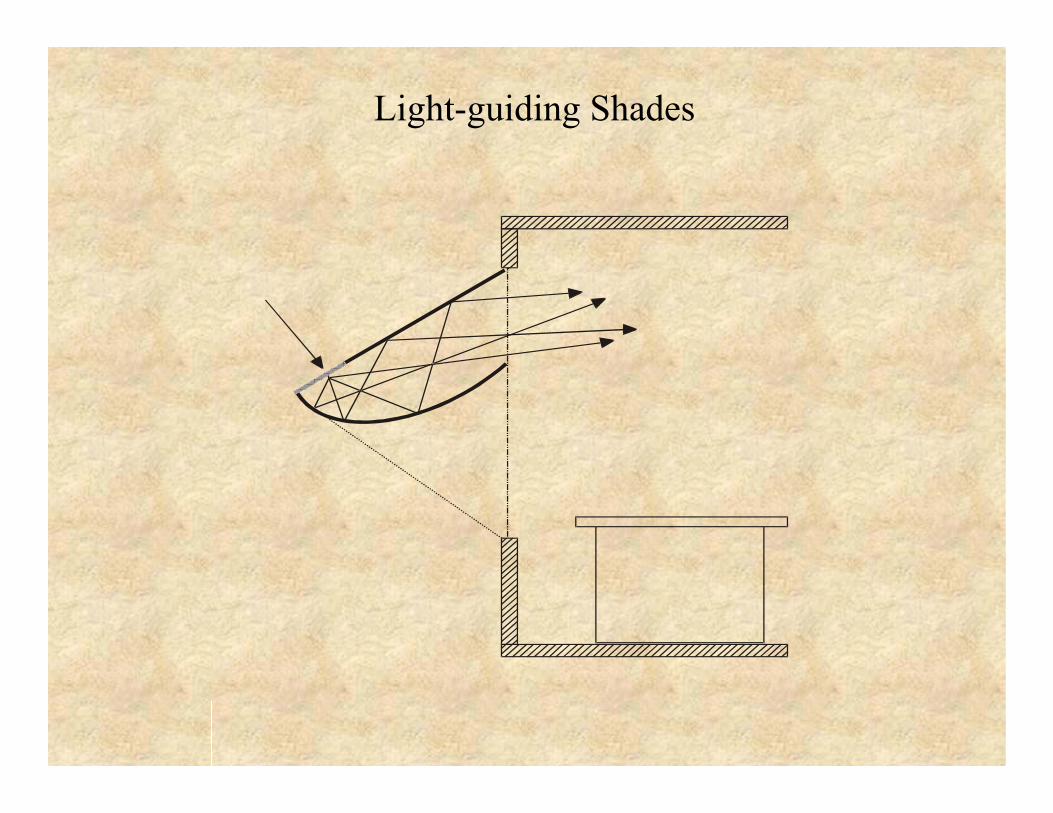
Light-guiding Shades
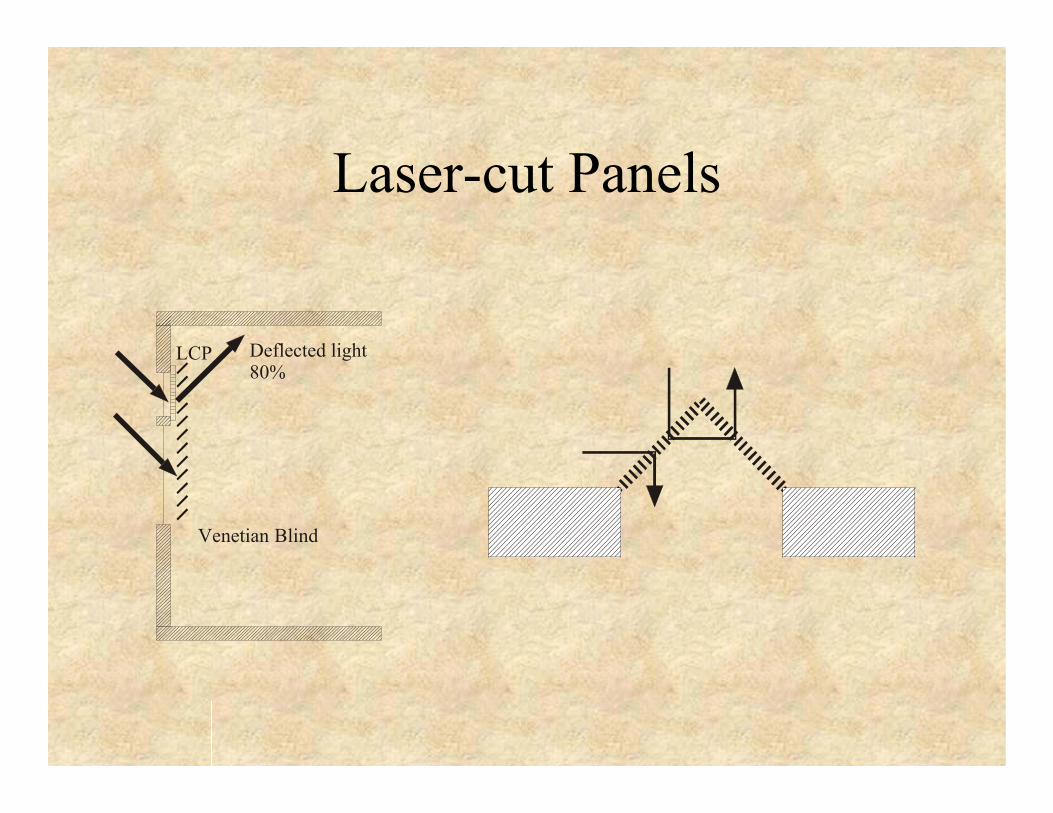
Laser-cut Panels
Venetian Blind
LCP Deflected light80%
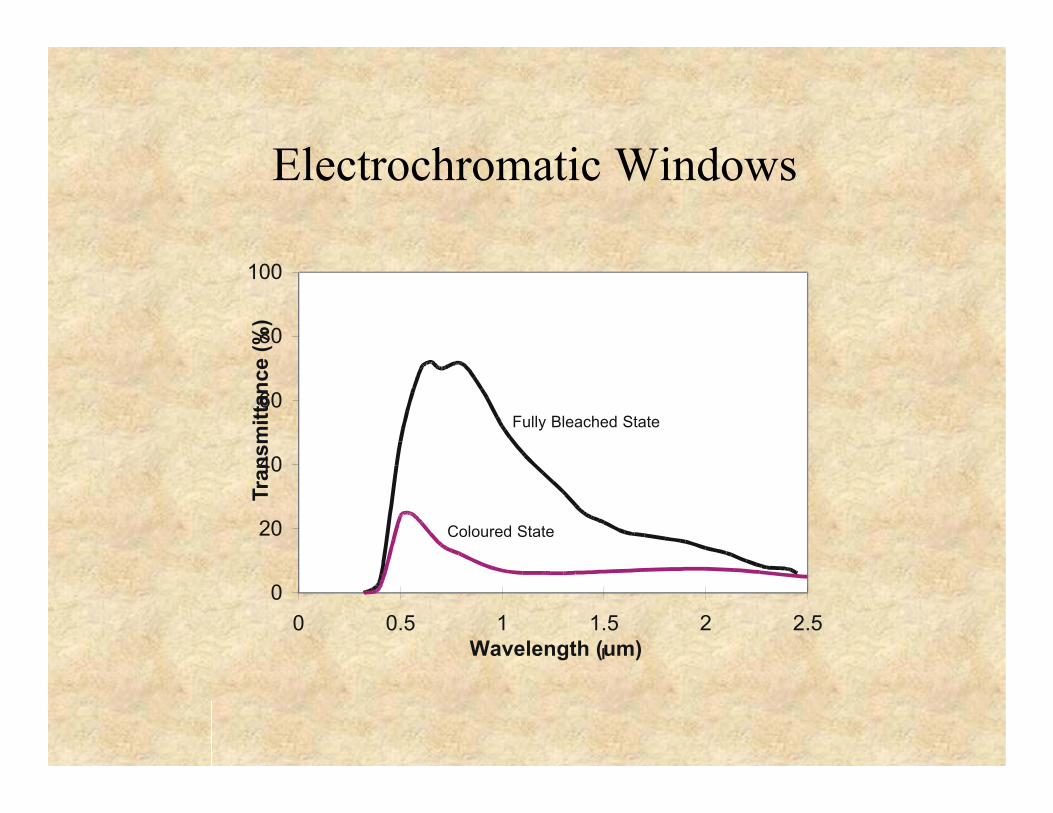
Electrochromatic Windows
0
20
40
60
80
100
0 0.5 1 1.5 2 2.5Wavelength (um)
Tran
smitt
ance
(%)
Fully Bleached State
Coloured State
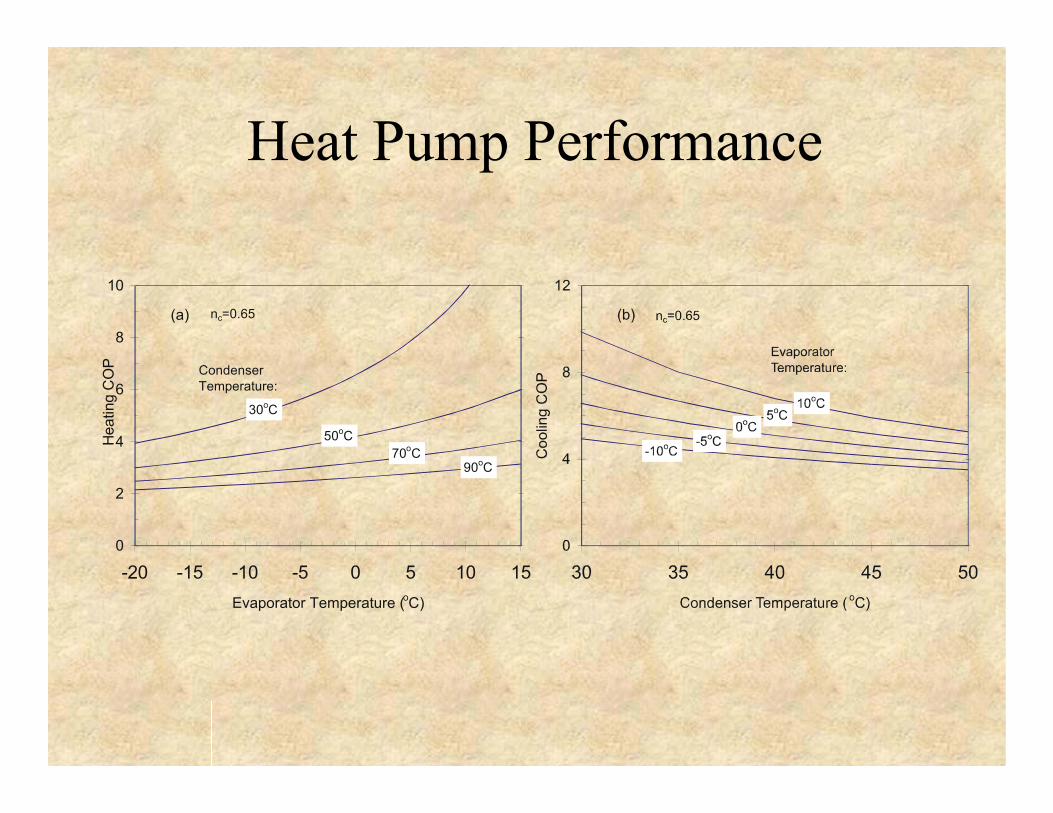
Heat Pump Performance
0
2
4
6
8
10
-20 -15 -10 -5 0 5 10 15Evaporator Temperature (oC)
Hea
ting
CO
P
30oC
50oC70oC
90oC
(a)
CondenserTemperature:
nc=0.65
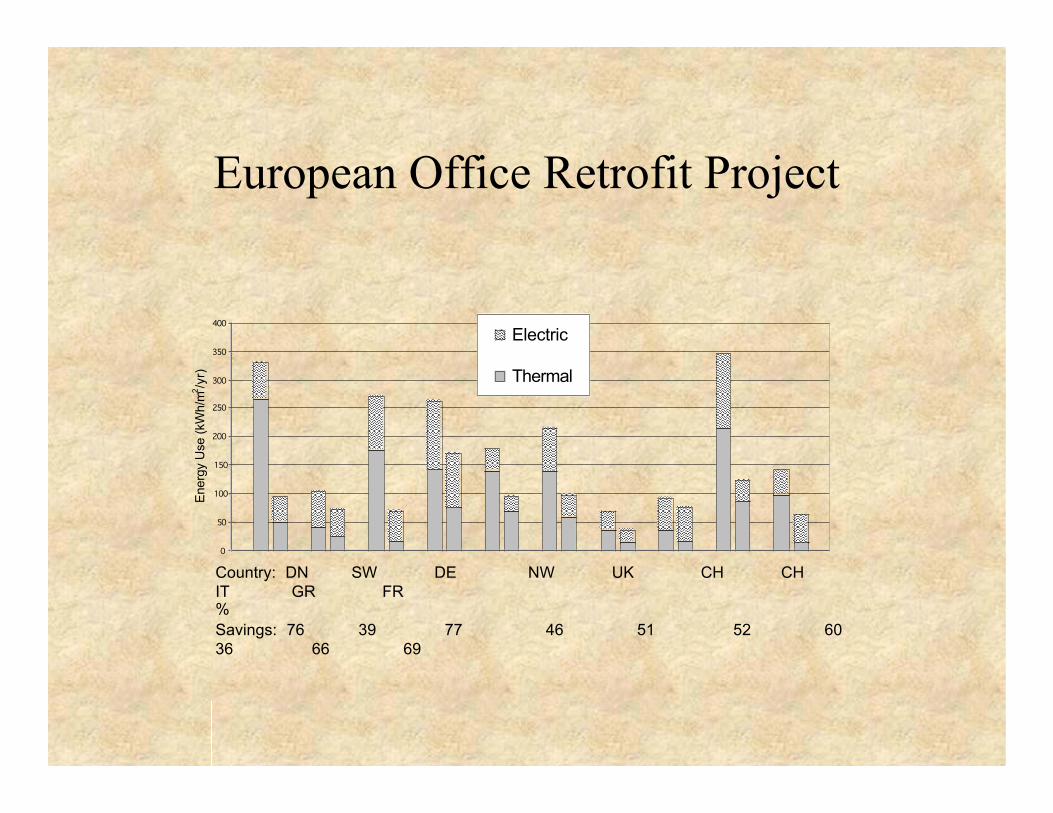
European Office Retrofit Project
0
50
100
150
200
250
300
350
400
Ener
gy U
se (k
Wh/
m2 /y
r)
Electric
Thermal
Country: DN SW DE NW UK CH CH IT GR FR% Savings: 76 39 77 46 51 52 60 36 66 69
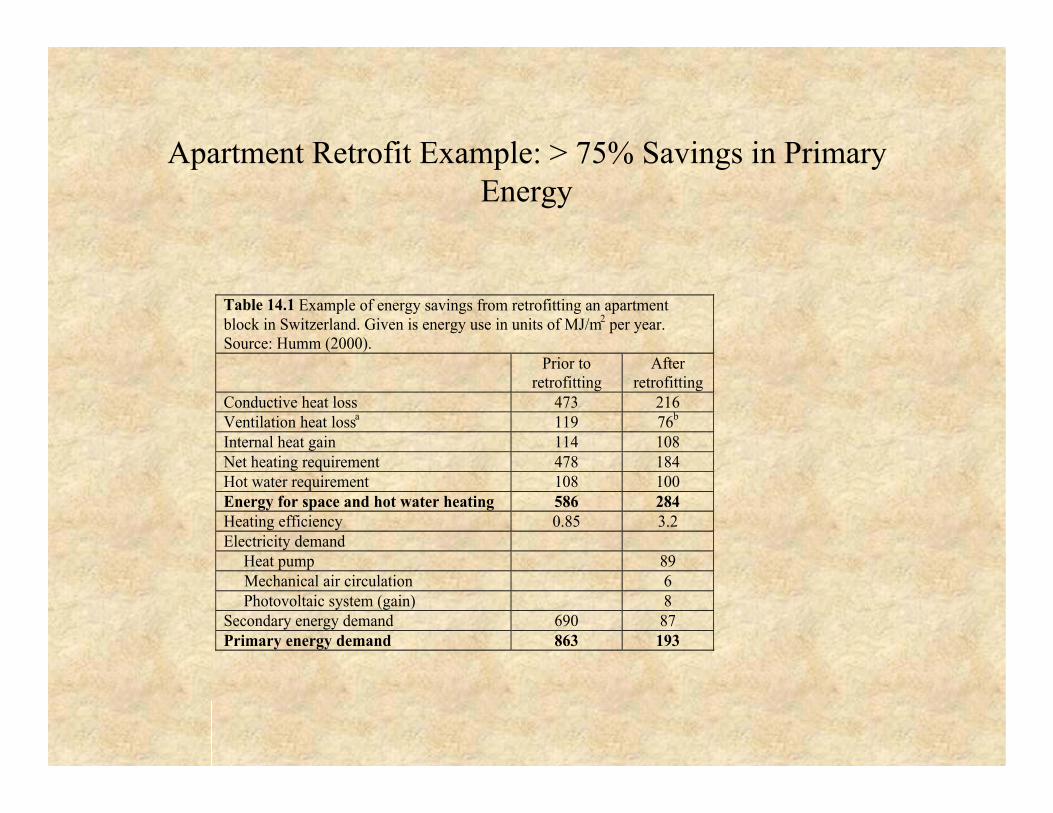
Apartment Retrofit Example: > 75% Savings in PrimaryEnergy
Table 14.1 Example of energy savings from retrofitting an apartment block in Switzerland. Given is energy use in units of MJ/m2 per year. Source: Humm (2000). Prior to
retrofitting After
retrofitting Conductive heat loss 473 216 Ventilation heat lossa 119 76b Internal heat gain 114 108 Net heating requirement 478 184 Hot water requirement 108 100 Energy for space and hot water heating 586 284 Heating efficiency 0.85 3.2 Electricity demand Heat pump 89 Mechanical air circulation 6 Photovoltaic system (gain) 8 Secondary energy demand 690 87 Primary energy demand 863 193
a Associated with an exchange rate of 0.4/hr. b Reduction due to installation of heat recovery from the exhaust air stream.
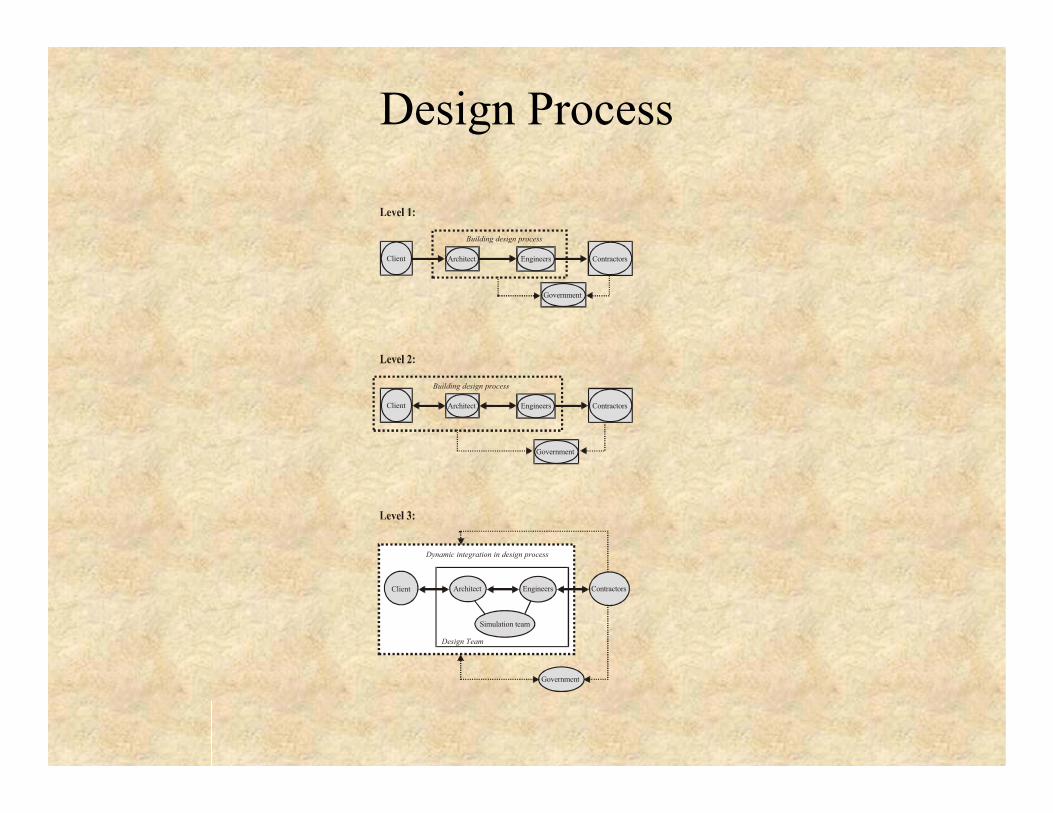
Design Process
Building design process
Client Architect Engineers
Government
Contractors
Client Architect Engineers
Government
Contractors
Simulation team
Dynamic integration in design process
Design Team
Building design process
Client Architect Engineers
Government
Contractors
Summary:
• Much of the energy needs in buildings (lighting, ventilation, cooling,heating) can be achieved passively using solar energy and/or radianttechniques
• Buildings thus become the collectors and transformers of renewableenergy
• Much of the remaining energy needs can be greatly reduced by puttingtogether mechanical systems in a more intelligent fashion
• Device efficiencies tell us next to nothing about system efficiencies• Improved design process alone can achieve savings of 50% in new
buildings compared to common practice• An integrated process combined with best (but currently available
technologies) gives demonstrated savings of 75-90% in new buildings• Retrofits that include solar features can often achieve savings of 40-75%
in existing buildings


