

8/14/2019 Preheating DVW
http://slidepdf.com/reader/full/preheating-dvw 1/30
(submitted to Energy and Buildings in December of 2009) 1
Real climate experimental study of two double window systems with
preheating of ventilation air
Jorge S. Carlos 1 , Helena Corvacho 2 , Pedro D. Silva 1 and J.P. Castro-Gomes 1
1C-MADE, Centre of Materials and Building Technologies, University of Beira Interior, Covilhã,
Portugal;
2Faculty of Engineering of the University of Porto (FEUP), Civil Engineering Department, Building
Division, Laboratory of Building Physics, Porto, Portugal
Abstract
This paper aims to characterize the thermal performance of a window system that consists in doubling an
existing window, converting it into a ventilated double window. The air coming from the outside
circulates upwards through the channel between windows and enters the building through a vent on the
top of the window’s case. A series of experimental measurements was conducted in a test cell exposed to
real outdoor weather conditions located in a mountain region at Centre of Portugal, during heating season
in order to determine how this window system can act as a heat exchanger. It was found that such window
system act as an efficient heat exchanger using transmission heat losses and solar radiation to preheat
ventilation air, thus reducing the building’s operational energy costs. An average of about 19m3/h of air
flow rate was found with an air temperature increment within the air gap of about 6ºC, during night-time,
for an indoor/outdoor temperature difference of about 16ºC. Air temperature increment reached up to
12ºC using a plastic shutter. With solar radiation, the average of that increment was about 10ºC. This is a
simple and cheap building technology which can be implemented both in new and existing buildings.
Key words: Solar Heating; Ventilation Air; Double Window; Experimental Measurements.

8/14/2019 Preheating DVW
http://slidepdf.com/reader/full/preheating-dvw 2/30
(submitted to Energy and Buildings in December of 2009) 2
1. Introduction
The need to ensure indoor air quality in all dwellings and other buildings requires air renovation through
ventilation resulting in inevitable energy consumption for heating due to ventilation thermal losses, in
winter. A variety of technical solutions have been studied and used in order to reduce those losses as, for
instance, earth-to-air heat exchangers through buried pipes as used in DB Netz AG (Hamm), Fraunhofer
ISE (Freiburg) or Lamparter (Weilheim) in Germany [1]. Fresh air is heated by heat transfer from the
ground to buried pipes and then to air by convection. Another possibility is the construction of a
conservatory, an enclosed glazed space attached to the main building with fresh air entering in it at a low
level. The air is preheated within the space and enters the main building through top vents [2].
The use of unglazed transpired solar collectors [3], solar air collectors mounted on the sun-facing walls
[4] or on the roof, the use of a window air collector that consists of two glazed windows with an
intermediate device, usually a Venetian shutter [5] or a supply air window that consists of a window with
two sashes separated by an air gap [6] or even a glazed ventilated double facade [7, 8] are all similar
systems in what concerns modus operandi. Solar gains and the heat coming from indoors warm the glass
and thereby preheat the air stream which rises by stack effect and wind pressure. A fan can be associated
to increase or maintain the air flow.
Measures to reduce energy consumption are needed if Kyoto Protocol commitments are to be met, i.e. the
reduction of green house gas emissions reported in 1990 up to 5.2% in year 2012 [9] With this in mind,
the aim of the present study was to investigate the use of ventilated double windows to preheat ventilation
air, which can contribute to reduce domestic energy consumption during heating season. Tests were
conducted under outdoor weather conditions and considering exclusively natural ventilation.
Traditional Portuguese dwelling fenestrations are made of a single or double glazed window with a roller
shutter case on its top. Windows and roller shutter cases are the thermally weakest components of a
building envelope. Thermal comfort of the occupants and thermal losses are largely influenced by these
two components. To reduce thermal loss and cold air infiltration in colder zones of Portugal, it is common
to add a second single glazed window on the outside of the pre-existing window. The roller shutter
operates then between the windows. Adding vents at the bottom of the outer window and at the top of the

8/14/2019 Preheating DVW
http://slidepdf.com/reader/full/preheating-dvw 3/30
(submitted to Energy and Buildings in December of 2009) 3
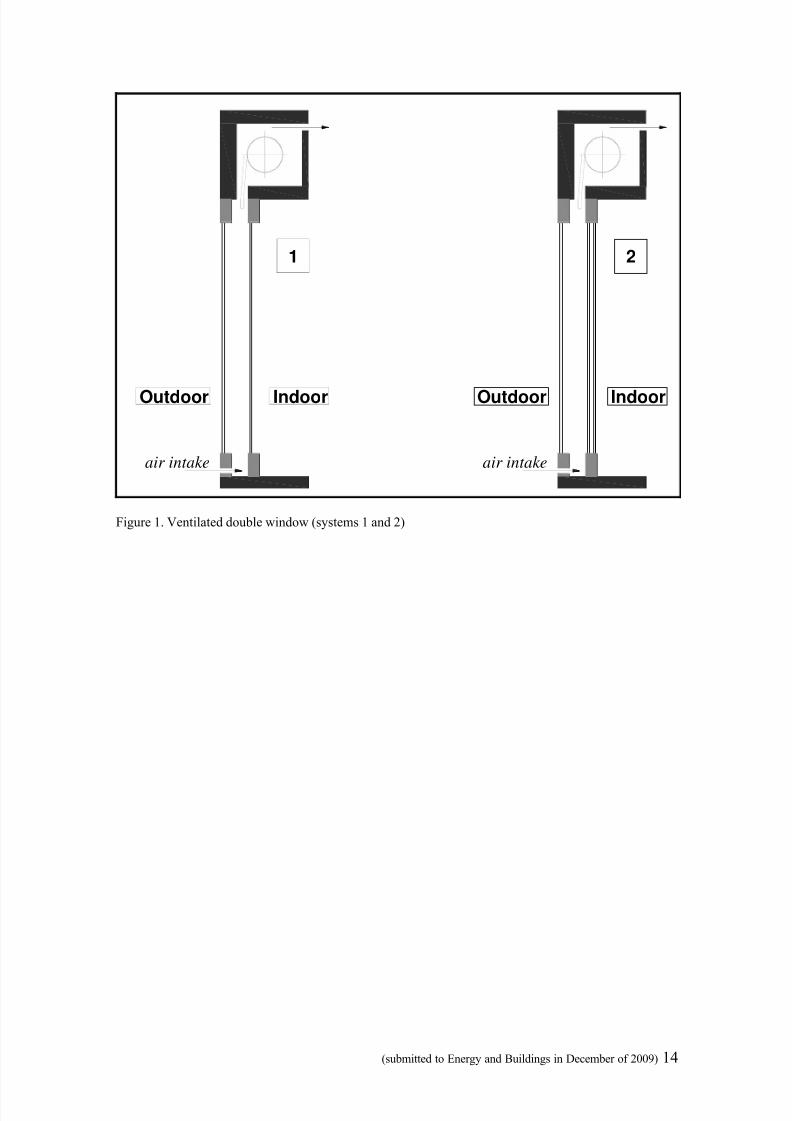
roller shutter case creates a path for incoming airflow through the gap between windows and through the
upper case (Figure 1).
The gap that is formed between the windows is supplied with fresh air from outside through vents at the
base of the outer window. Air circulating through this gap is warmed by the heat coming from the inner
window which transmits heat loss from indoors and also by solar gains. Preheated rising airflow, by stack
effect and wind pressure, enters the room through a vent on the top of the roller case. Thereby the
ventilated double window serves as a heat exchanger, recovering part of the heat losses through the inner
window and providing solar gains. Besides this function, it is still a window offering a view to the outside
and admitting daylight. The main advantages of this system are its simplicity, its inexpensive technology
and the fact that there are no operation costs.
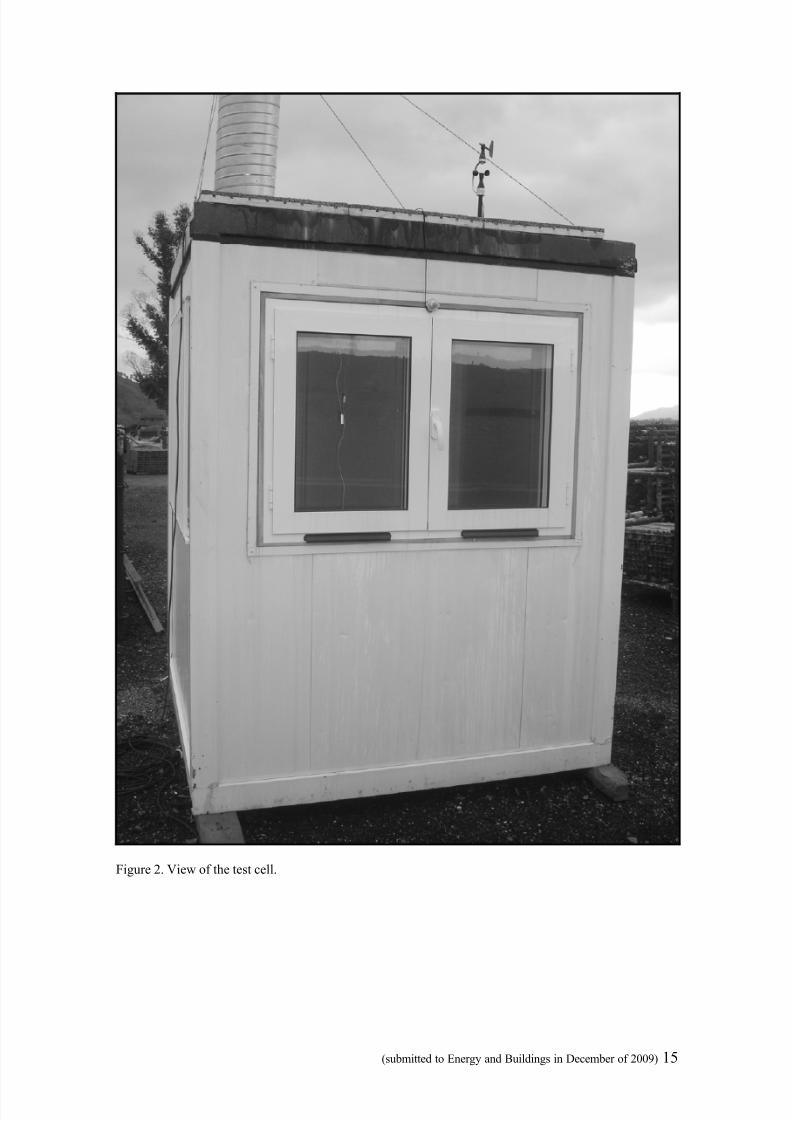
2. Test cell and studied system description
The experimental studies were carried out in the test cell shown in Figure 2. The windows being tested
were fitted into a south-facing 1.43 x 1m2
opening of the test cell. This test cell is a metallic insulated
container and has a width of 2.2 m, a length of 2.0 m and a height of 2.5 m. This outdoors test cell was
used to characterize the potential for preheating ventilation air of the ventilated double window under
effective winter conditions. The cell was located at 40º 20’ N, 7º 21’º W and at an altitude above sea level
of 464 m, in a mountain region at Centre of Portugal. The system under investigation is composed by two
commercially available windows mounted on the south facing wall of the test cell. Two air inlets with a
total area of 50 cm2 were installed at the bottom of the outer window. The objective was to reproduce the
current situation of a double window without ventilation and to convert it into a ventilated one.
Portuguese double window system has a single glazed pane at the outer window and a single or double
glazed pane at the inner window. The analysis was carried out with this type of double window in two
stages for the two different combinations of the glazing. The original thickness of the gap was of 9 cm,
glass to glass and of 5 cm, casement to casement. Glazing surface is about 54% of the surface of the
whole window.

8/14/2019 Preheating DVW
http://slidepdf.com/reader/full/preheating-dvw 4/30
(submitted to Energy and Buildings in December of 2009) 4
A pyranometer was used to measure total solar radiation, and it was fixed rigidly to the south-facing wall
of the test cell. In this way, the value provided by the pyranometer corresponds directly to the solar
radiation reaching the south-facing vertical surface. The air flow rate was measured at the outlet vent
using a transducer. This outlet vent was placed at the top of the roller shutter case to provide the room
with fresh air. Several thermocouples were located within the cavity to measure air temperature along the
gap and of the delivered airflow. Both outdoor and indoor air temperatures were also measured. In Figure
3, a scheme with the location of the points of measurement is presented and in table 1 the experiment
instruments are presented.
The experiments were performed from November to December 2008, in the beginning of heating season,
using two programmable data acquisition systems. Experimental data was collected based on preliminary
acquisition tests and considering that incident solar radiation varies continuously during the day and for
this reason the cavity air temperature changes continuously too. However since the air temperature varies
slowly an average value for each minute was considered as a suitable measurement for the purpose of this
research.
3. Experimental measurements
3. 1 Aim
The main objective of the experimental campaign was to evaluate the impact of real climatic conditions
on the performance of the system. The test cell described above was used to investigate that impact.
Measurements of the temperature rise along the window air gap, the solar irradiance on the south-facing
vertical surface, the air speed and the indoor and outdoor temperatures were recorded on several days and
the correlations between them were plotted on scatter graphs. Indoor temperature was kept at an almost
constant level (around 20ºC) using an electric radiator controlled by an ambient thermostat. The
experimental program, over a period of several days, was performed using both systems sequentially
(Figure 1, systems 1 and 2) with the window’s vents open to provide free ventilation. By measuring the
air temperature and speed at the outlet of the system (air inlet for the room), it was possible to estimate
the resulting heat gains through the air flow of the ventilated double window. Several different factors and

8/14/2019 Preheating DVW
http://slidepdf.com/reader/full/preheating-dvw 5/30
(submitted to Energy and Buildings in December of 2009) 5
systems solutions were evaluated. In this paper some results related with the impact of solar radiation and
with the influence of the roller shutter will be presented and the performance of the two systems presented
in Figure 1 will be compared.
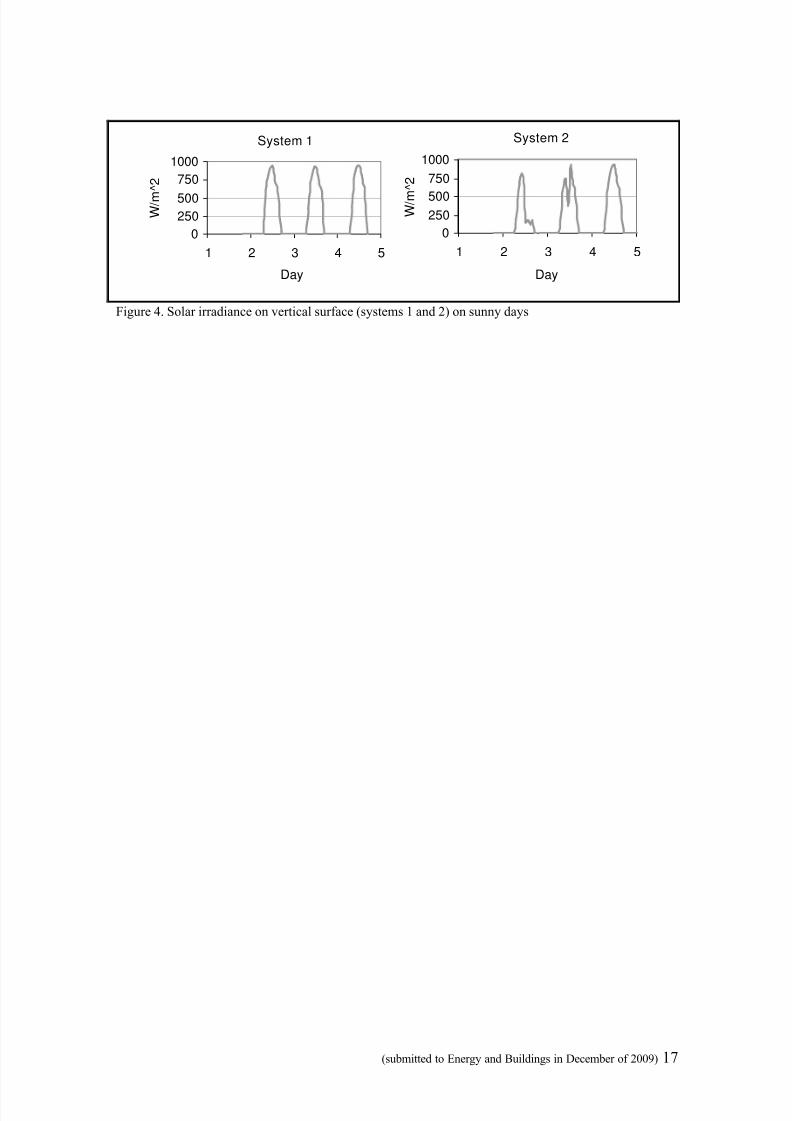
3.2 Solar radiation impact – daytime performance
The following measurements were performed only in day time to observe how incident solar radiation
influences the ventilated double window’s behavior. Figure 4 shows measured incident solar irradiance at
the window’s vertical surface as a function of time during the observed periods on sunny days. A
comparison between the measured outdoor air temperature and the temperature of the air at the top of the
window gap is shown in figure 5. As it was expected, all the measured temperatures increase when
incident solar radiation increases and start to decrease following decreasing incident solar radiation.
Figure 5 also shows that the temperature at the top of the window gap is always above outdoor
temperature and that the biggest difference between them is coincident with the highest incident solar
radiation. Southall [10], Dickson [11] and Park [12] also analyzed the influence of the climatic
determinants on the delivered air temperature in similar systems, being the latter always higher than
outdoors, as found out in each respective research work. Southall results were obtained by “supply air
window” for the PASSYS test cell at the Scottish laboratory of the Building Research Establishment in a
controlled environment followed by simulations with East Kilbride and Milton Keynes, UK Meteonorm
climate files. Dickson studies were based in a double-skin façade for simulations with UK default climate
files by ESP-r and, in turn, Park considered a “smart façade system” for Atlanta and Chicago, USA
climatic data. For the lowest incident solar radiation, the difference between outlet and outdoor air
temperatures was about 7.9ºC with system 1 and 6.1ºC with system 2. For the highest incident solar
radiation, that difference was about 13.2ºC and 12.2ºC, respectively. Besides this obvious increment of
temperature due to the solar radiation, there are other factors that cannot be ignored, since they contribute
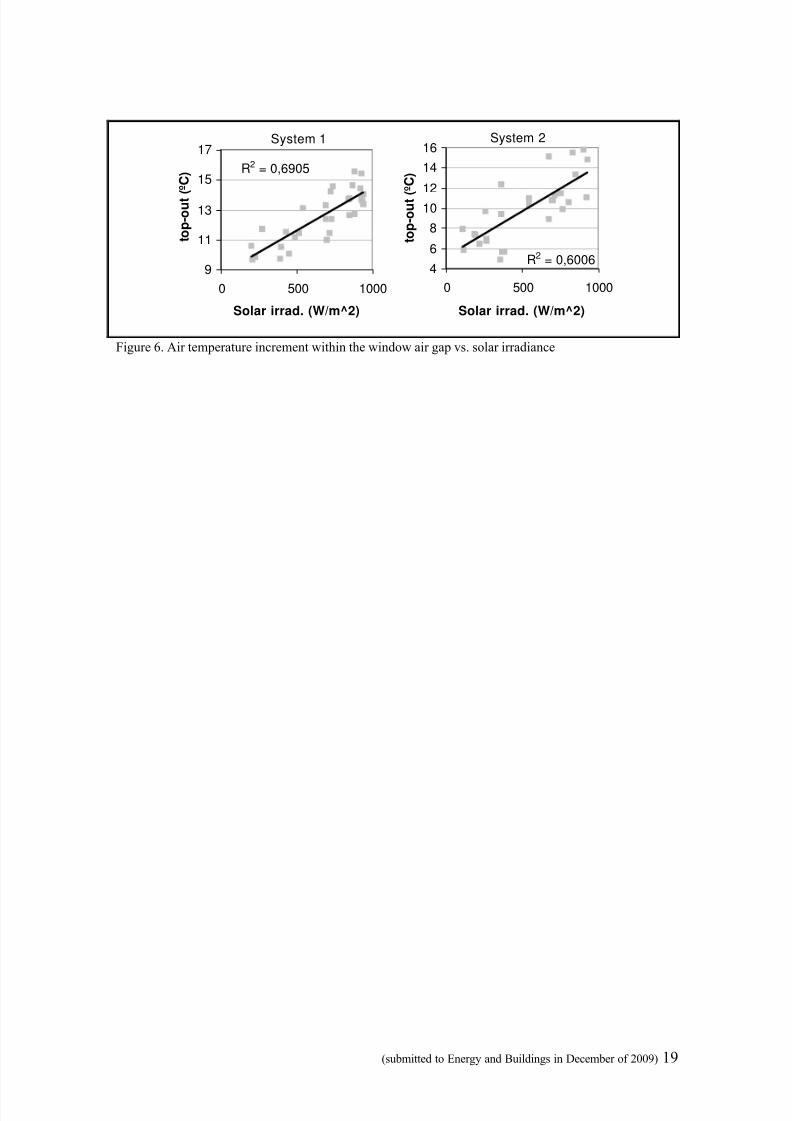
also to the final temperature achieved. Figure 6 reveals a reasonable correlation between the value of solar
irradiance and the temperature increment at the ventilated double window. Baker [10], using the test cell
at the Scottish laboratory of the Building Research Establishment, found out by climate simulations the
existence of a limited correspondence between solar intensity and the temperature along the height of the

8/14/2019 Preheating DVW
http://slidepdf.com/reader/full/preheating-dvw 6/30
(submitted to Energy and Buildings in December of 2009) 6
window. Concluding it was due to inversed air flow on the sunniest day, which was not found in this
research work.
However, solar irradiance did not show to have a significant influence (by itself in a direct way) on the
amount of the air flow, as it can be seen in figure 7 where there is almost no correlation at all between the
measured solar irradiance and the air flow rate. This last parameter is the joint result of the direction and
speed of the wind and of the temperature difference along the gap which is obviously influenced by solar
irradiance, as Figure 6 shows. It is difficult however to identify the individual impact of each factor
involved, since measurements were carried out in real climate change situation.
3.3 The performance without solar radiation – night-time.
The behavior of the ventilated double window without the sun’s influence was observed during night
period since even on an overcast day there is always some solar radiation, at least its diffuse component.
For this purpose the periods that were chosen were the nights where temperature differences between
indoors and outdoors were the lowest and the highest. The lowest indoors/outdoors temperatures
difference was of 11.0ºC when testing system 1 and of 11.6ºC, when testing system 2, with minimum
temperature increments at window’s top of 3.9ºC and 1.5ºC, respectively. At that time the minimum air
flow rate reached by the two systems was of about 15m3/h and 13m
3/h, for systems 1 and 2, respectively.
For the highest indoors/outdoors temperatures difference (of 24.9ºC and 19.3ºC for system 1 and 2,
respectively) the temperature rise along the window gap was of about 10.6ºC and 7.2ºC, with a highest air
flow rate of about 29m3/h and 26m3/h. Although figure 8 reveals a great dispersion of results and a very
low correlation between the air temperature increment along the window gap and the air flow rate,
numerical simulation with fixed values of air flow rate can prove that air temperature increment decreases
when air flow rate increases and it increases when air flow rate decreases. This is because the total heat
collected by the air stream from the glazing surfaces depends on the time in which air remains in contact
with the hotter surfaces. As the air flow rate increases through the air gap, which means as the air velocity
increases, the time of contact between the air and the glass surface decreases and so the air temperature
increment along the gap is lower. The same result was found by Southall [10]. In figure 9, the variation
of the temperature rise along the window gap in function of the temperature difference between indoors

8/14/2019 Preheating DVW
http://slidepdf.com/reader/full/preheating-dvw 7/30
(submitted to Energy and Buildings in December of 2009) 7
and outdoors is presented. It can be observed that the air temperature increment within the window air
gap follows the indoors/outdoors temperatures difference tendency.
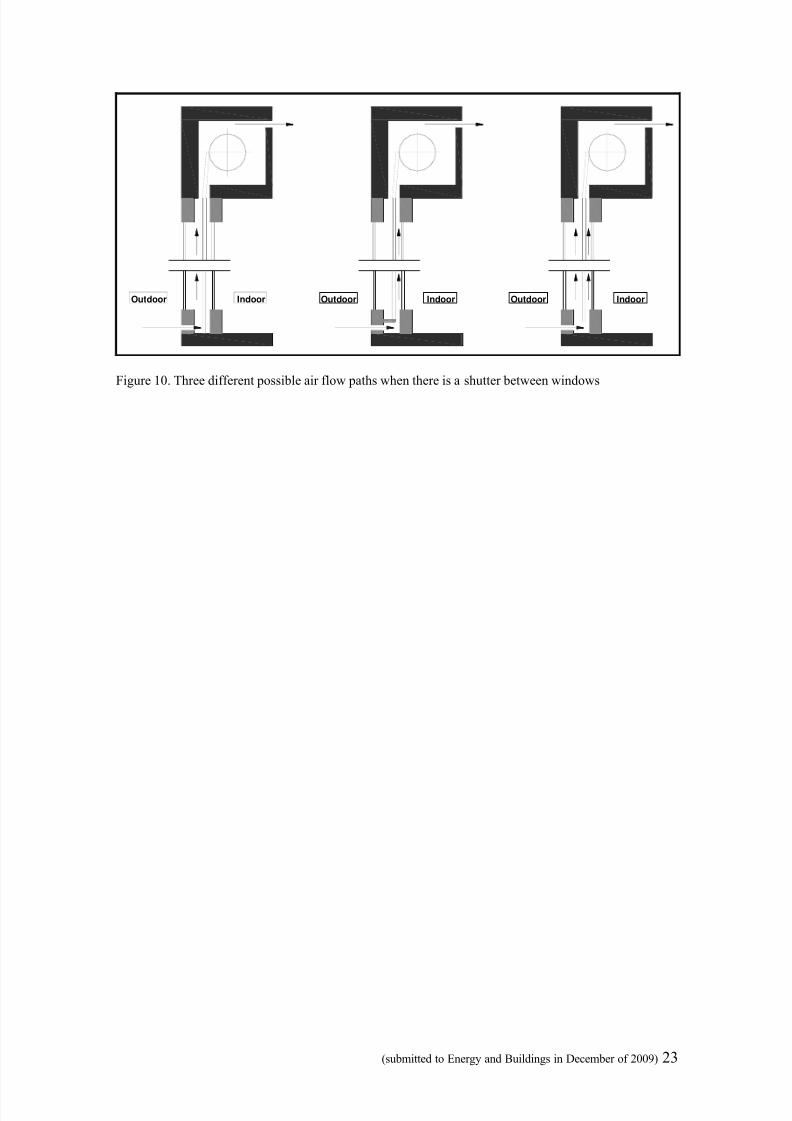
3.4. The influence of the roller shutter
The shutter used in the system under analysis was a commercially available plastic roller shutter which
works between the two windows. Usually the roller shutter is closed at night time. When closed, the
ventilated gap is divided into two gaps with three options of ventilation pattern: only through the exterior
gap, only through the interior gap or through both gaps (figure 10). The adding of a plastic shutter
between the windows leads also to an increase of the global thermal resistance of the system. Since this
shutter is usually closed only at night time, during the winter season, and air flow’s temperature depends
on the thermal losses from indoors to outdoors, the analysis was performed for the case of a ventilation
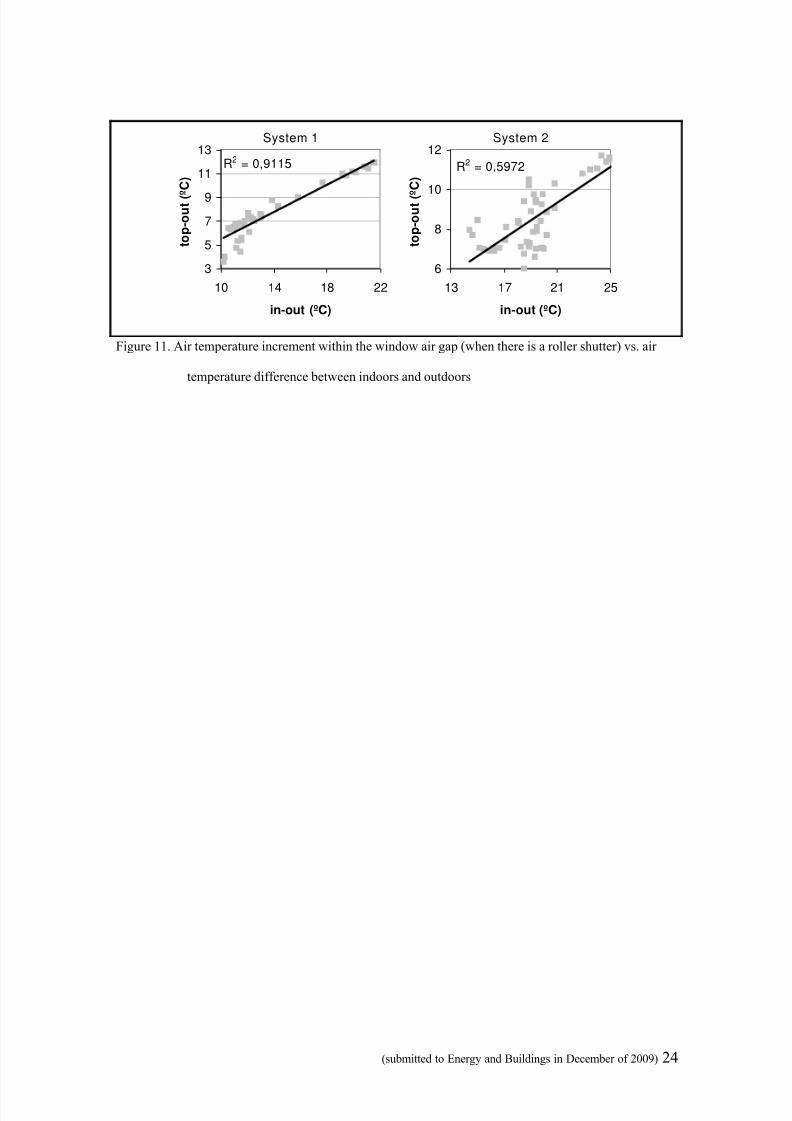
path only through the interior gap and for the night period. For this new air flow path, meaning that air
flows between the roller shutter and the inner window, the temperature gradient along the window air gap
obtained with the two systems is shown on figure 11, revealing a very good correlation to the air
temperature difference between indoors and outdoors.
4. Results and discussion
When a ventilated double window is integrated in the building facade, depending on the design of the
construction system, ventilation can be either natural or mechanical. The design of this new building
component affects its thermal behavior and thus the heating needs of the building, especially due to air
renovation. If part of the solar heat gains absorbed by the inner window is removed by ventilation air and
part of the heat losses from indoors to outdoors is also captured by the same ventilation air, it will enter
the building warmer than directly from the outside. The effective heating of the ventilation air depends on
the climactic conditions, the thermal characteristics of the system and the indoor conditions. From direct
measurements of some parameters under real conditions, some others can be estimated. Thermal losses
due to air renovation (Qair , in W) can be determined by:
)(VCQ outinair θ−θρ= (1)

8/14/2019 Preheating DVW
http://slidepdf.com/reader/full/preheating-dvw 8/30
(submitted to Energy and Buildings in December of 2009) 8
Were C is the specific heat capacity of air (J/kg.ºC), ρ is the density of air (kg/m3), V is the volumetric air
flow rate (m3/s), θin and θout are the indoor and the outdoor air temperatures (ºC). Expression (1)
presupposes that air is drawn directly from outside. With ventilation air being supplied through the
ventilated gap of the double window the heat gained by preheating the air (Qutil, in W) is:
)(VCQ outtoputil θ−θρ= (2)
Were θtop is the air temperature at the window’s outlet (ºC) (inlet for the room). Thus, the new ventilation
heat loss (Qvent
, in W), as used by Baker [13], will be:
)(VCQ topinvent θ−θρ= (3)
The reduction in ventilation heat loss as a result of preheating the ventilation air is therefore:
)(VCQQouttopventair
θ−θρ=− (4)
Figures 12 and 13 present the heat transfer due to ventilation over the measured period. These graphs
show a clear daily variation due to the pattern of solar radiation and to the outdoor air temperature
variation. The percentage of heat loss reduction after preheating the ventilation air can be estimated as:
%100.air
vent air
Q
QQ −(5)
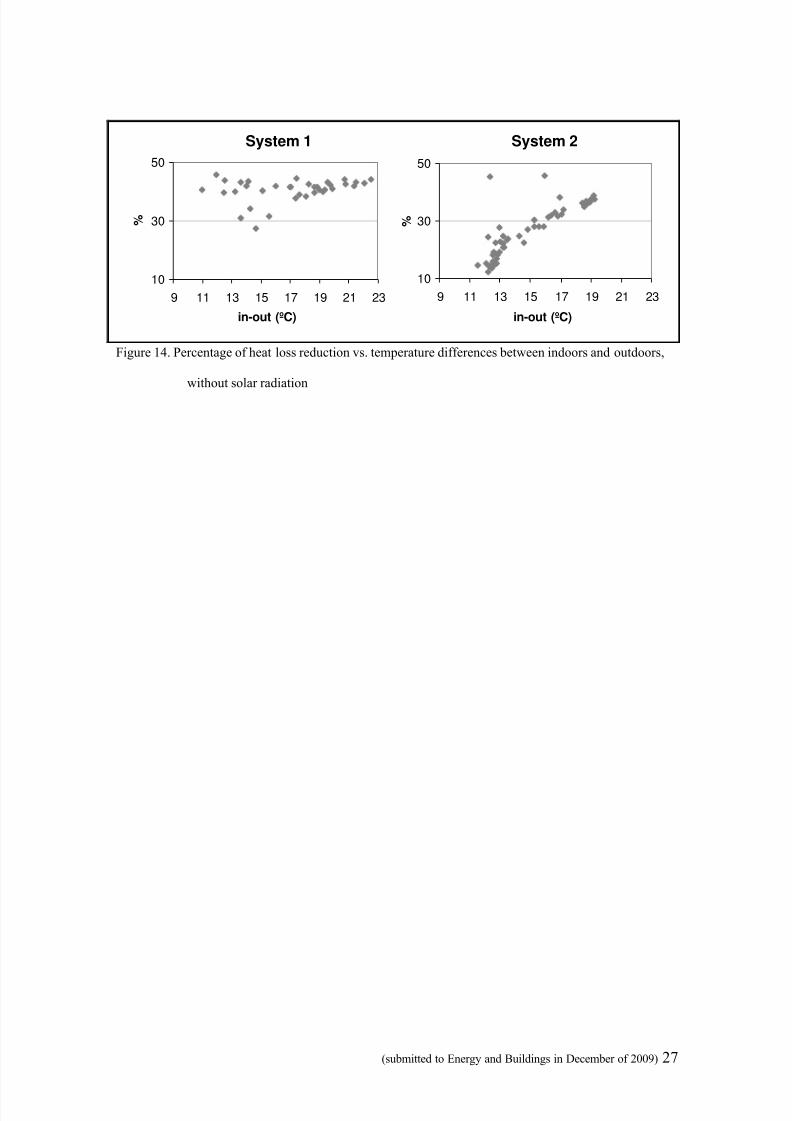
The results for the two different systems are presented in figures 14 and 15. Figure 14 shows the
percentage of heat loss reduction without solar radiation influence. As it can be seen, system 1 presents
values greater than 40% for the majority of the measured values of temperatures difference (the average
value of the percentage of heat loss reduction is of 43%), whilst system 2, in spite of a little increase in its
percentage with the increase of temperatures difference, presents values mainly lower than 40% (with an

8/14/2019 Preheating DVW
http://slidepdf.com/reader/full/preheating-dvw 9/30
(submitted to Energy and Buildings in December of 2009) 9
average value of 26%). This reflects the capacity of each system to recover part of the heat lost from the
indoors through the inner window. System 1 shows a better response since its inner window has a lower
thermal resistance than the inner window of system 2. This causes more heat transfer from inside to the
gap and so more heat can be recovered by the air stream. Figure 15 shows the increase of the percentage
of heat loss reduction in function of the solar irradiance, for both systems. Also for the supply air window
[10 and 13], considerable savings were obtained at moderate levels of solar radiation. The experimental
results by Southall [10] showed an approximately linear response of the increase of pre-heating to the
increase of solar radiation, for a constant flow rate. This percentage has an average value of 82%, for
system 1 and of 68%, for system 2. In this case, the results express the joint effect of solar gains and heat
recovery. Figure 16 shows the percentage of heat loss reduction when the vertical shutter is closed and
there is no solar radiation. With this new construction component an extra thermal resistance is added.
Since the air flow path is found between the inner window and the vertical shutter, meaning that for the
same conditions thermal losses from inside to the air gap is unchangeable, with an extra thermal
resistance added to the outer window’s resistance, thermal loss from the gap to outside is reduced and
more heat can be recovered by the air stream. Comparing Figure 16 with Figure 14, it can be observed
that the mean percentage of heat loss reduction is higher when the shutter is closed, as it could be
expected.
5. Conclusions
This paper presents some results of a wide experimental study performed on a two ventilated double
window systems exposed to real outdoor weather conditions. This study aimed to characterise the use of
this double window as a passive system for the preheating of ventilation air. Air temperatures, solar
radiation and air speed were measured to get information about the way the temperature of the delivered
air at the outlet of the system varies with the influent factors. In this paper, the relationship between the
solar irradiance, the air flow rate and the temperature of the air entering the room was described. The
results indicate that there is a good correlation between solar irradiance and the air temperature increment
within the air channel but a very low direct correlation was found between solar irradiance and the air
flow rate. A good correlation was shown between indoors/outdoors temperatures difference and the air
temperature increment within the air channel.

8/14/2019 Preheating DVW
http://slidepdf.com/reader/full/preheating-dvw 10/30
(submitted to Energy and Buildings in December of 2009) 10
During the periods of experimental measurements outdoor temperatures varied between -6.6ºC and
16.6ºC and the indoor air temperature was kept at around 20ºC. In these conditions, the experiments
carried out using this modified window system lead to a rise in the delivered air temperature, without
solar radiation, of at least 3.9ºC with system 1 and at least 1.5ºC with system 2, above the outdoor air
temperature. With solar radiation, air temperature minimum rise has doubled. The maximum values of
the percentage of heat loss reduction (figures 14, 15 and 16) obtained with these systems were the
following: without solar radiation and with the solar shutter opened, 59% and 46%, with systems 1 and 2,
respectively; without solar radiation and with the solar shutter closed, 63% and 58%; in the presence of
solar radiation, 131% and 134%.
This window system, that is applicable to both new and old buildings, has proved to be able to provide
preheated ventilation air in winter time, by recovering part of the heat losses from indoors and by
transferring solar radiation heat gains. This kind of system helps to reduce the global heating energy
needs of a building, in winter, since it can lead to a significant reduction of the heat loss through
ventilation. Furthermore, with the highly insulated envelopes of modern buildings and the correspondent
low transmission losses, the heat losses through ventilation became an important part (sometimes the
most important) of the total heat losses of the buildings. Therefore, the cost of the initial investment on
heating devices could also be reduced as a consequence of preheating the ventilation air. Finally, it must
be noticed that ventilated double windows are quite inexpensive and easy to install and offer a wide
diversity of design. Its optimization however, due to the large number of design and operating related
parameters and because of the time needed for testing, demands the use of a simulation code. The
obtained results are encouraging for the adoption of this kind of window system.
8/14/2019 Preheating DVW
http://slidepdf.com/reader/full/preheating-dvw 11/30
(submitted to Energy and Buildings in December of 2009) 11
Nomenclature
C Specific heat capacity, J/kg.ºC
Qair Thermal losses due to air renovation, W
Qutil Heat gained by preheating the air, W
Qvent Ventilation heat loss, W
V Volumetric air flow rate m3/s
θin Indoor air temperature, ºC
θout Outdoor air temperature, ºC
θtop Air temperature at the window’s outlet, ºC
ρ Density, kg/m3
8/14/2019 Preheating DVW
http://slidepdf.com/reader/full/preheating-dvw 12/30
(submitted to Energy and Buildings in December of 2009) 12
References
[1] Pfafferott, Jens, Evaluation of earth-to-air heat exchangers with a standardised method to calculate
energy efficiency, Energy and Buildings, 35, 2003, Pages 971-983.
[2] Lechner, Norbert (1991) Heating, Cooling, Lighting – Design methods for Architects, John Wiley &
Sons, Inc.
[3] Summers, David N., Mitchell, John W., Klein, Sanford A. e Beckman, William A. (1996), Thermal
Simulation and economic assessment of unglazed transpired solar collector systems, Proceedings of
solar 96, American Solar Energy Society;
[4] Pottler, K., Sippel, C. M., Beck, A. e Fricke, J. (1999) Optimized finned absorber geometries for solar
air heating collectors”, Solar Energy, 67, pp 35 - 52;
[5] Hastings, S. Robert e Morck, Ove, (2000), Solar air systems – A design handbook, International
Energy Agency (IEA);
[6] McEvoy, M. E.; Southall, R. G. e Baker, P. H. (2003) Test cell evaluation of supply air windows to
characterise their optimum performance and its verification by the use of modelling techniques,
Energy and Buildings, 35, pp 1009 - 1020
[7] Faggembauu, D., Costa, M., Soria, M. e Oliva, A. (2003) Numerical analysis of the thermal
behaviour of glazed ventilated facades in Mediterranean climates. Part II: applications and analysis of
results, Solar Energy, 75, pp 229 - 239;
[8] Arons, D. M. M. and Glicksman, L. R. (2003), Double skin, airflow facades: Will the popular
European model work in the USA? Building Technology Program, Massachussetts Institute of
Technology;
[9] UNFCCC (1990), Kyoto Protocol to the United Nations framework convention on climate change,
United Nations convention on climate change, FCC/CP/L.7/Add1, Kyoto;
[10] Southall, Ryan G. (2003), Design optimisation of the supply air ventilated window, PhD Thesis,
Department of Architecture, University of Cambridge, UK
[11] Dickson, Allan (2004), Modelling double-skin facades, MSc thesis, Department of Mechanical
Engineering, University of Strathclyde, Glasgow UK
[12] Park, Cheol-Soo (2003), Occupant responsive optimal control of smart façade systems, PhD Thesis,
College of Architecture, Georgia Institute of Technology, USA

8/14/2019 Preheating DVW
http://slidepdf.com/reader/full/preheating-dvw 13/30
(submitted to Energy and Buildings in December of 2009) 13
[13] Baker, P. H. e McEvoy M. (2000), Test cell analysis of the use of a supply air window as a passive
solar component, Solar Energy, 69, pp 113-130.
8/14/2019 Preheating DVW
http://slidepdf.com/reader/full/preheating-dvw 14/30
(submitted to Energy and Buildings in December of 2009) 14
Outdoor Indoor
1 2
air intake air intake
Outdoor Indoor
Figure 1. Ventilated double window (systems 1 and 2)
8/14/2019 Preheating DVW
http://slidepdf.com/reader/full/preheating-dvw 15/30

8/14/2019 Preheating DVW
http://slidepdf.com/reader/full/preheating-dvw 16/30
(submitted to Energy and Buildings in December of 2009) 16
interior view Sectionthermocouples
Figure 3. Location of the points in the system where air temperatures were measured.
8/14/2019 Preheating DVW
http://slidepdf.com/reader/full/preheating-dvw 17/30
(submitted to Energy and Buildings in December of 2009) 17
System 1
0
250500
750
1000
1 2 3 4 5
Day
W / m
^ 2
System 2
0
250500
750
1000
1 2 3 4 5
Day
W / m
^ 2
Figure 4. Solar irradiance on vertical surface (systems 1 and 2) on sunny days

8/14/2019 Preheating DVW
http://slidepdf.com/reader/full/preheating-dvw 18/30
(submitted to Energy and Buildings in December of 2009) 18
System 1
-5
5
15
25
35
1 2 3 4 5
Day
T e m p e r a t u r e ( º C )
System 2
-5
5
15
25
35
1 2 3 4 5
Day
T e m p e r a t u r e ( º C )
out
top
Figure 5. Outdoor air temperature (out) and temperature of the air at the top of the window air gap (top)
on sunny days
8/14/2019 Preheating DVW
http://slidepdf.com/reader/full/preheating-dvw 19/30
(submitted to Energy and Buildings in December of 2009) 19
System 1
R2 = 0,6905
9
11
13
15
17
0 500 1000
Solar irrad. (W/m^2)
t o p - o u t ( º C )
System 2
R2 = 0,60064
6
8
10
12
14
16
0 500 1000
Solar irrad. (W/m^2)
t o p - o u t ( º C )
Figure 6. Air temperature increment within the window air gap vs. solar irradiance

8/14/2019 Preheating DVW
http://slidepdf.com/reader/full/preheating-dvw 20/30
(submitted to Energy and Buildings in December of 2009) 20
System 1
0
10
20
30
40
0 500 1000
Solar irrad. (W/m^2)
A i r f l o w ( m
^ 3 / h )
System 2
0
10
20
30
40
0 500 1000
Solar irrad. (W/m^2)
A i r f l o w ( m
^ 3 / h )
Figure 7. Solar irradiance vs. air flow rate.

8/14/2019 Preheating DVW
http://slidepdf.com/reader/full/preheating-dvw 21/30
(submitted to Energy and Buildings in December of 2009) 21
System 1
0
3
6
9
12
10 20 30
Flow rate (m^3/h)
t o p - o u t ( º C )
System 2
0
3
6
9
12
10 20 30
Flow rate (m^3/h)
t o p - o u t ( º C )
Figure 8. Air temperature increment within the window air gap vs. air flow rate

8/14/2019 Preheating DVW
http://slidepdf.com/reader/full/preheating-dvw 22/30
(submitted to Energy and Buildings in December of 2009) 22
System 1
R2 = 0,57263
5
7
9
11
9 12 15 18 21 24
in-out (ºC)
t o p - o u t ( º C )
System 2
R2 = 0,78950
2
4
6
8
12 14 16 18 20
in-out (ºC)
t o p - o u t (
º C )
Figure 9. Air temperature increment within the window air gap vs. temperature difference between
indoors and outdoors
8/14/2019 Preheating DVW
http://slidepdf.com/reader/full/preheating-dvw 23/30
(submitted to Energy and Buildings in December of 2009) 23
Outdoor Indoor Outdoor Indoor Outdoor Indoor
Figure 10. Three different possible air flow paths when there is a shutter between windows
8/14/2019 Preheating DVW
http://slidepdf.com/reader/full/preheating-dvw 24/30

8/14/2019 Preheating DVW
http://slidepdf.com/reader/full/preheating-dvw 25/30
(submitted to Energy and Buildings in December of 2009) 25
-40
0
40
80
120
160
1 2 3 4 5
Day
W
Qair
Qutil
Qvent
Figure 12. Heat transfer by ventilation air, with system 1

8/14/2019 Preheating DVW
http://slidepdf.com/reader/full/preheating-dvw 26/30
(submitted to Energy and Buildings in December of 2009) 26
-40
0
40
80
120
160
1 2 3 4 5 6
Day
W
Qair
Qutil
Qvent
Figure 13. Heat transfer by ventilation air, with system 2
8/14/2019 Preheating DVW
http://slidepdf.com/reader/full/preheating-dvw 27/30
(submitted to Energy and Buildings in December of 2009) 27
System 1
10
30
50
9 11 13 15 17 19 21 23
in-out (ºC)
%
System 2
10
30
50
9 11 13 15 17 19 21 23
in-out (ºC)
%
Figure 14. Percentage of heat loss reduction vs. temperature differences between indoors and outdoors,
without solar radiation

8/14/2019 Preheating DVW
http://slidepdf.com/reader/full/preheating-dvw 28/30
(submitted to Energy and Buildings in December of 2009) 28
System 1
R2 = 0,5493
0
35
70
105
140
0 250 500 750 1000
Solar irrad. (W/m^2)
%
System 2
R2 = 0,6173
0
35
70
105
140
0 250 500 750 1000
Solar irrad. (W/m^2)
%
Figure 15. Percentage of heat loss reduction vs. solar irradiance

8/14/2019 Preheating DVW
http://slidepdf.com/reader/full/preheating-dvw 29/30
(submitted to Energy and Buildings in December of 2009) 29
System 1
30
45
60
75
10 12 14 16 18 20 22
in-out (ºC)
%
System 2
30
45
60
75
14 16 18 20 22 24 26
in-out (ºC)
%
Figure 16. Percentage of heat loss reduction vs. temperature differences between indoors and outdoors,
with the shutter closed and without solar radiation

8/14/2019 Preheating DVW
http://slidepdf.com/reader/full/preheating-dvw 30/30
Table 1. Experiment instruments in double ventilated window
Range Accuracy
* Pyranometer 0 to 2000W/m2 0.15%/ºC
* Thermocouples -270 to 400ºC ±0.1ºC
** Transducer 0.05 to 2m/s ±0.05m/s
Two programmable data acquisition systems
* Mikromec multisens
** Thermal Comfort Data Logger, model 1221


