

Preliminary results
Year ended 30 June 2012
Marius Kloppers Chief Executive Officer
Graham Kerr Chief Financial Officer
22 August 2012
Newman
Disclaimer
Preliminary results, 22 August 2012 Slide 2
Forward looking statements
This presentation contains forward looking statements, including statements regarding: trends in commodity prices and currency exchange rates; demand for commodities; plans,
strategies and objectives of management; closure or divestment of certain operations or facilities (including associated costs); anticipated production or construction commencement
dates; capital costs and scheduling; operating costs and shortages of materials and skilled employees; anticipated productive lives of projects, mines and facilities; provisions and
contingent liabilities; tax and regulatory developments.
Forward looking statements can be identified by the use of terminology such as „intend‟, „aim‟, „project‟, „anticipate‟, „estimate‟, „plan‟, „believe‟, „expect‟, „may‟, „should‟, „will‟, „continue‟
or similar words. These statements discuss future expectations concerning the results of operations or financial condition, or provide other forward looking statements.
These forward looking statements are not guarantees or predictions of future performance, and involve known and unknown risks, uncertainties and other factors, many of which are
beyond our control, and which may cause actual results to differ materially from those expressed in the statements contained in this presentation. Readers are cautioned not to put
undue reliance on forward looking statements.
For example, our future revenues from our operations, projects or mines described in this presentation will be based, in part, upon the market price of the minerals, metals or
petroleum produced, which may vary significantly from current levels. These variations, if materially adverse, may affect the timing or the feasibility of the development of a particular
project, the expansion of certain facilities or mines, or the continuation of existing operations.
Other factors that may affect the actual construction or production commencement dates, costs or production output and anticipated lives of operations, mines or facilities include our
ability to profitably produce and transport the minerals, petroleum and/or metals extracted to applicable markets; the impact of foreign currency exchange rates on the market prices
of the minerals, petroleum or metals we produce; activities of government authorities in some of the countries where we are exploring or developing these projects, facilities or mines,
including increases in taxes, changes in environmental and other regulations and political uncertainty; labour unrest; and other factors identified in the risk factors discussed in BHP
Billiton‟s filings with the US Securities and Exchange Commission (the “SEC”) (including in Annual Reports on Form 20-F) which are available on the SEC‟s website at www.sec.gov.
Except as required by applicable regulations or by law, the Group does not undertake any obligation to publicly update or review any forward looking statements, whether as a result
of new information or future events.
Non-IFRS financial information
BHP Billiton results are reported under International Financial Reporting Standards (IFRS) including Underlying EBIT and Underlying EBITDA which are used to measure segment
performance. This presentation also includes certain non-IFRS measures including Attributable profit excluding exceptional items, Underlying EBITDA interest coverage, Underlying
effective tax rate, Underlying EBIT margin and Underlying return on capital. These measures are used internally by management to assess the performance of our business, make
decisions on the allocation of our resources and assess operational management. Non-IFRS measures have not been subject to audit or review.
UK GAAP financial information
Certain historical financial information for periods prior to FY2005 has been presented on the basis of UK GAAP, which is not comparable to IFRS or US GAAP. Readers are
cautioned not to place undue reliance on UK GAAP information.
No offer of securities
Nothing in this presentation should be construed as either an offer to sell or a solicitation of an offer to buy or sell BHP Billiton securities in any jurisdiction.
Reliance on third party information
The views expressed in this presentation contain information that has been derived from publicly available sources that have not been independently verified. No representation or
warranty is made as to the accuracy, completeness or reliability of the information. This presentation should not be relied upon as a recommendation or forecast by BHP Billiton.
Preliminary results
Year ended 30 June 2012
Marius Kloppers Chief Executive Officer
Escondida

Key themes
Preliminary results, 22 August 2012 Slide 4
• Strong operating performance and robust financial results
• Targeting a significant reduction in operating costs
• Disciplined investment has established strong momentum in our major businesses
• Our projects in execution are expected to create substantial value for our shareholders
• A commitment to further simplify the portfolio
• Sector leading shareholder returns

Robust financial results
Preliminary results, 22 August 2012 Slide 5
• Total Recordable Injury Frequency improved by 6%
• Underlying EBITDA of US$33.7 billion, down 9%
• Underlying EBIT of US$27.2 billion, down 15%
• Attributable profit (excluding exceptional items) of US$17.1 billion, down 21%
• Attributable profit of US$15.4 billion included net exceptional charges of US$1.7 billion
• Net operating cash flow of US$24.4 billion, down 19%
• Gearing of 26% following the acquisition of Petrohawk Energy Corporation
• Full year dividend of 112 US cents per share, up 11%
Note: Variance relates to the relative performance of BHP Billiton during the 2012 financial year compared with the 2011 financial year.

Strong operating performance
Preliminary results, 22 August 2012 Slide 6
• Record production at 10 operations
– Western Australia Iron Ore (WAIO)
shipments rose to a rate of 179mtpa
(100% basis) in the June 2012 quarter
• Temporary operational challenges
– industrial action and the remnant effects
of wet weather at Queensland Coal
– deferral of high margin non-operated
crude oil and condensate production in
the Gulf of Mexico
– industrial action at Escondida
• Release of this substantial latent capacity
in FY13 will underpin strong, low-risk
momentum in our major businesses
Effective asset utilisation1 in FY12
(%)
Hillside
90%
1. Excludes assets where major projects are in commissioning phase or in the process of ramp-up (Worsley, Antamina, WAIO and NSW Energy Coal). Excludes the non-operated
Richards Bay Minerals operation, the EKATI diamond mine (both part of the D&SP CSG) and Onshore US (Petroleum CSG). Spence and Cerro Colorado capacity based on
forecast annualised production as reported in the BHP Billiton 2011 Annual Report; Manganese Ore and South Africa Coal capacity adjusted for available rail allocation; and
Queensland Coal adjusted for the closure of Norwich Park.
Petroleum (non-operated)
Escondida
Queensland Coal

Preliminary results
Year ended 30 June 2012
Graham Kerr Chief Financial Officer
Eagle Ford

0
25
50
75
100
FY03 to FY12 FY12
Strength in diversity
Preliminary results, 22 August 2012 Slide 8
• The value of our diversified strategy was
reflected in the Group‟s Underlying EBIT
margin of 39%1
• Net operating cash flow of US$12.1 billion
in H2 FY12 declined by 1% when
compared with H1 FY12 and demonstrated
the cash generating capacity of our
business throughout the economic cycle
• Underlying return on capital was 23%
or 27% excluding capital investment
associated with projects not yet
in production
Underlying EBIT1
(%)
1. Excludes third party trading activities.
2. Cash flow reflects proportional consolidation of joint ventures for FY07 and future periods. Exploration expenditure incurred which has not been capitalised has been re-classified
to net operating cash flow for FY06 and future periods.
0
8
16
24
32
FY
03
FY
04
FY
05
FY
06
FY
07
FY
08
FY
09
FY
10
FY
11
FY
12
H1 H2
Net operating cash flow2
(US$ billion)
Petroleum
D&SP Metallurgical Coal
Energy Coal SSM
Manganese Base Metals Aluminium
Iron Ore

32.0
27.2
0.8 1.5
(2.0) (1.0) (2.0) (1.7) (0.4) (0.0)
0.0
10.0
20.0
30.0
40.0
FY
11
Price
¹
Exch
an
ge
En
erg
y c
osts
a
nd
in
fla
tion
Su
b-t
ota
l
Vo
lum
e²
Ca
sh c
osts
²
Ma
jor
outa
ge
s a
nd
d
isru
ptio
ns²
No
n-c
ash
co
sts
Oth
er³
FY
12
Underlying EBIT analysis
1. Includes net impact of price-linked costs.
2. The impact of wet weather and industrial action at Escondida and Queensland Coal, and outages at Mad Dog, Atlantis and Hillside, are all excluded from Volume and
Cash costs variance; included in Major outages and disruptions.
3. Includes new and acquired operations.
EBIT variance
(FY12 versus FY11, US$ billion)
Uncontrollable (2.2) Controllable (2.6)
Slide 9 Preliminary results, 22 August 2012
29.8
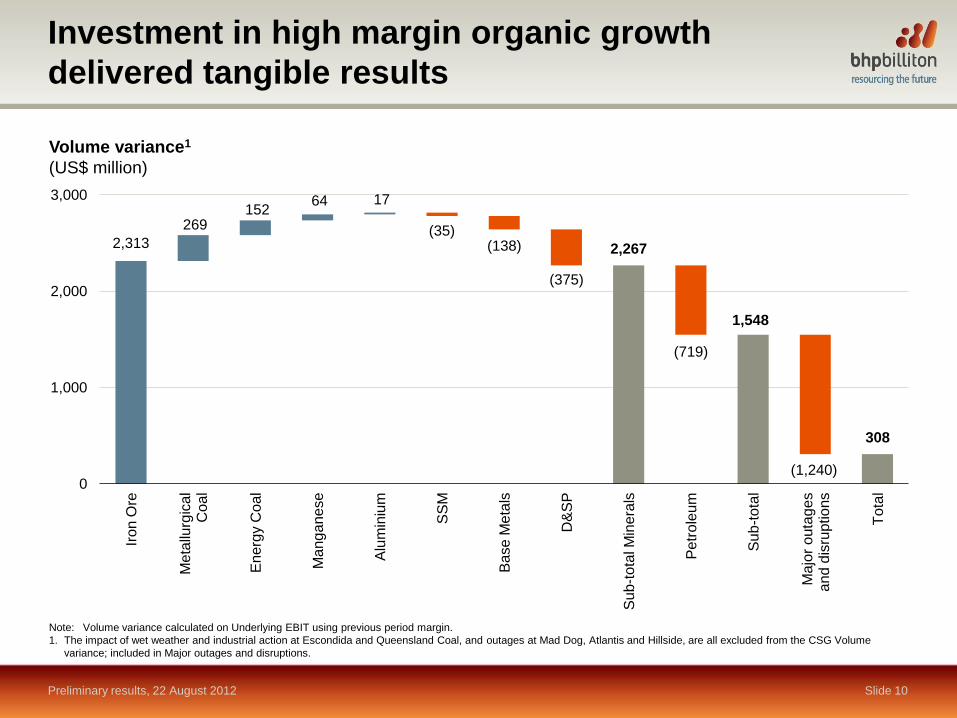
Investment in high margin organic growth
delivered tangible results
Preliminary results, 22 August 2012 Slide 10
2,313
269 152
64 17
(35) (138)
(375)
(719)
(1,240)
2,267
1,548
308
0
1,000
2,000
3,000
Iro
n O
re
Me
tallu
rgic
al
Co
al
En
erg
y C
oal
Ma
ng
ane
se
Alu
min
ium
SS
M
Base M
eta
ls
D&
SP
Su
b-t
ota
l Min
era
ls
Pe
tro
leum
Su
b-t
ota
l
Ma
jor
outa
ge
s
and
dis
ruptio
ns
To
tal
Note: Volume variance calculated on Underlying EBIT using previous period margin.
1. The impact of wet weather and industrial action at Escondida and Queensland Coal, and outages at Mad Dog, Atlantis and Hillside, are all excluded from the CSG Volume
variance; included in Major outages and disruptions.
Volume variance1
(US$ million)
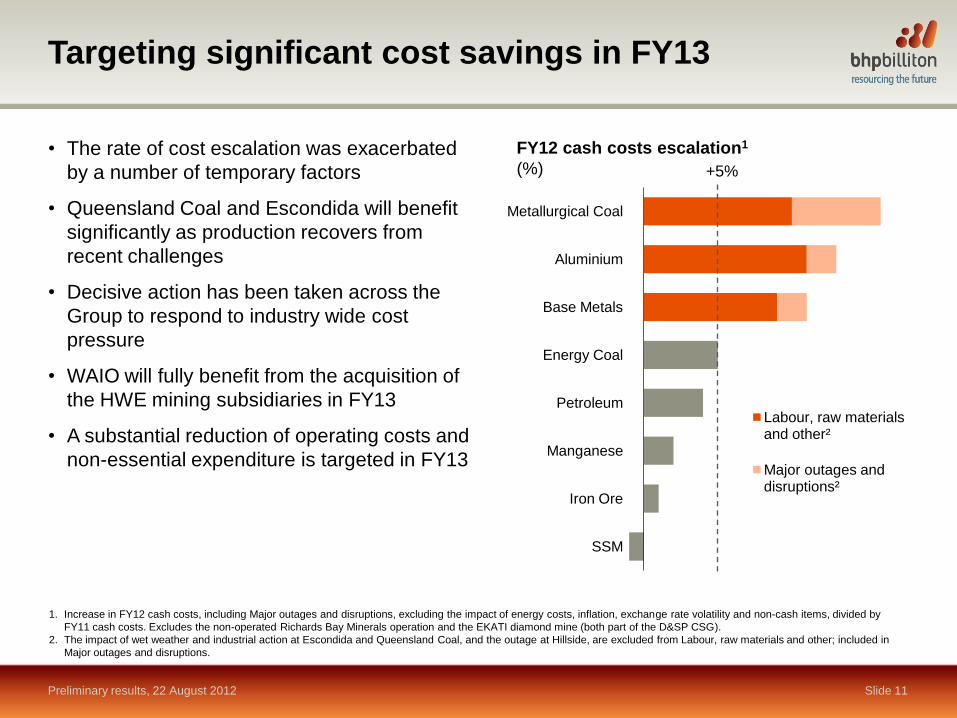
Targeting significant cost savings in FY13
Preliminary results, 22 August 2012 Slide 11
• The rate of cost escalation was exacerbated
by a number of temporary factors
• Queensland Coal and Escondida will benefit
significantly as production recovers from
recent challenges
• Decisive action has been taken across the
Group to respond to industry wide cost
pressure
• WAIO will fully benefit from the acquisition of
the HWE mining subsidiaries in FY13
• A substantial reduction of operating costs and
non-essential expenditure is targeted in FY13
1. Increase in FY12 cash costs, including Major outages and disruptions, excluding the impact of energy costs, inflation, exchange rate volatility and non-cash items, divided by
FY11 cash costs. Excludes the non-operated Richards Bay Minerals operation and the EKATI diamond mine (both part of the D&SP CSG).
2. The impact of wet weather and industrial action at Escondida and Queensland Coal, and the outage at Hillside, are excluded from Labour, raw materials and other; included in
Major outages and disruptions.
FY12 cash costs escalation1
(%)
SSM
Iron Ore
Manganese
Petroleum
Energy Coal
Base Metals
Aluminium
Metallurgical Coal
Labour, raw materials and other²
Major outages and disruptions²
+5%

FY12 FY13 FY14 FY15 FY16
FY12 FY13e FY14e FY15e FY16e
Major projects in our core products underpin near
term growth and returns
1. Only includes major projects in execution as at 22 August 2012.
2. Facilities ready for first production pending resolution of mercury content.
Escondida
OGP1
Kipper2 Macedon
WAIO
Jimblebar
Samarco 4
HPX3
Daunia
WAIO
Inner
Harbour
NWS Nth
Rankin B
Turrum WAIO
Port and Rail
Antamina
Exp
EKATI
Misery
NTP
Exp 3
Cerrejon
P40
NWS
GWF-A
MAC
RX1
Major projects currently in execution1
(capital expenditure, US$ billion)
NWS
CWLH
WAIO
RGP 5
Oxide
Leach
Caval
Ridge
Worsley
E&G
Appin
Area 9
≤ US$500m US$501m-US$5bn
WAIO
Orebody 24
Preliminary results, 22 August 2012
(timing of first production)
Slide 12
Broad-
meadow Escondida
Ore Access
Petroleum
D&SP Metallurgical Coal
Energy Coal SSM
Manganese Base Metals Aluminium
Iron Ore
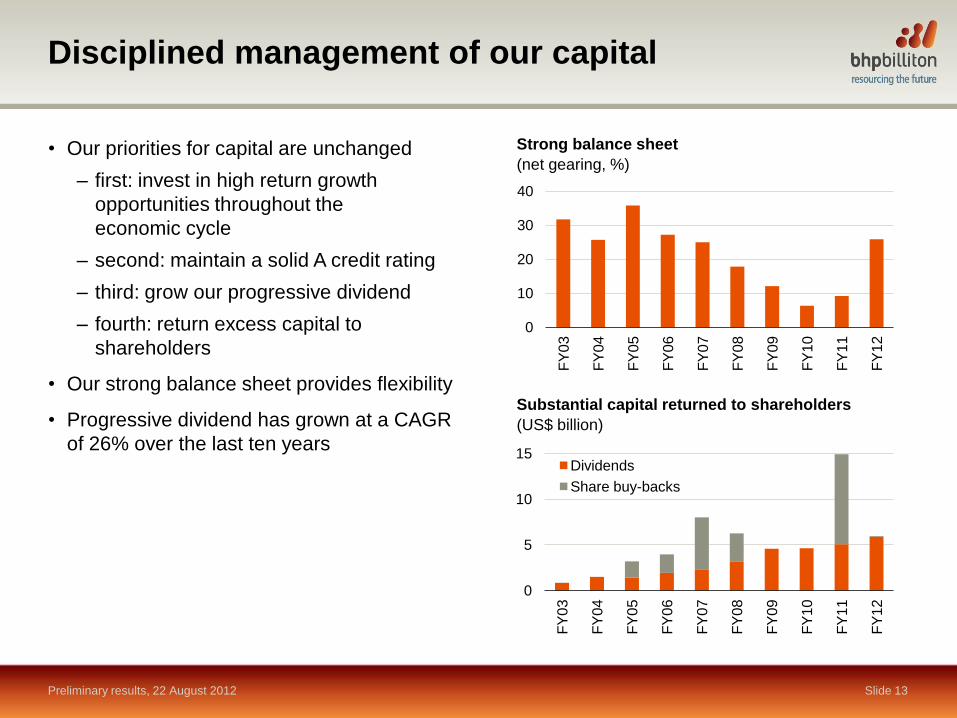
Disciplined management of our capital
Preliminary results, 22 August 2012 Slide 13
• Our priorities for capital are unchanged
– first: invest in high return growth
opportunities throughout the
economic cycle
– second: maintain a solid A credit rating
– third: grow our progressive dividend
– fourth: return excess capital to
shareholders
• Our strong balance sheet provides flexibility
• Progressive dividend has grown at a CAGR
of 26% over the last ten years
Substantial capital returned to shareholders
(US$ billion)
0
5
10
15
FY
03
FY
04
FY
05
FY
06
FY
07
FY
08
FY
09
FY
10
FY
11
FY
12
Dividends
Share buy-backs
Strong balance sheet
(net gearing, %)
0
10
20
30
40
FY
03
FY
04
FY
05
FY
06
FY
07
FY
08
FY
09
FY
10
FY
11
FY
12
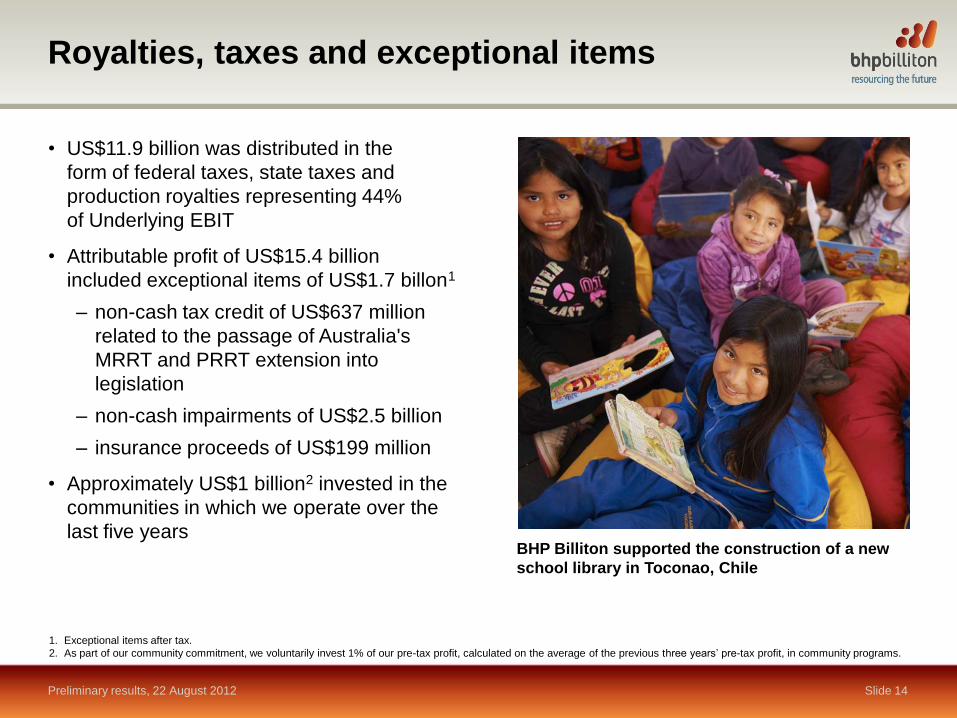
Royalties, taxes and exceptional items
Preliminary results, 22 August 2012 Slide 14
• US$11.9 billion was distributed in the
form of federal taxes, state taxes and
production royalties representing 44%
of Underlying EBIT
• Attributable profit of US$15.4 billion
included exceptional items of US$1.7 billon1
– non-cash tax credit of US$637 million
related to the passage of Australia's
MRRT and PRRT extension into
legislation
– non-cash impairments of US$2.5 billion
– insurance proceeds of US$199 million
• Approximately US$1 billion2 invested in the
communities in which we operate over the
last five years
1. Exceptional items after tax.
2. As part of our community commitment, we voluntarily invest 1% of our pre-tax profit, calculated on the average of the previous three years‟ pre-tax profit, in community programs.
BHP Billiton supported the construction of a new
school library in Toconao, Chile

Preliminary results
Year ended 30 June 2012
Marius Kloppers Chief Executive Officer
Mt Arthur Coal

Our positive long term view remains unchanged
Preliminary results, 22 August 2012 Slide 16
• Concerns surrounding the Eurozone
and the slowdown in China have led to
significant volatility
• Measured improvement in the external
environment anticipated, beginning
in H2 CY12
– growth in China is expected to
strengthen, beginning in H2 CY12
– encouraging signs have emerged in
the United States
• In the longer term, urbanisation and
industrialisation will remain the primary
drivers of economic growth
• Chinese GDP is forecast to almost triple
by CY25 with growth equivalent to 25%
of current global GDP
GDP change between 2011 and 2025
(2005 real PPP US$ trillion)
Source: Global Insight.
India
China
Brazil Russia
South Korea
European Union
Japan
Australia
USA
0
5
10
15
20
25
30
0 20 40 60
GDP per capita
(2005 real PPP US$‟000s)
GDP CAGR: 7.2%

Demand is only one side of the price equation
Preliminary results, 22 August 2012 Slide 17
• Demand growth alone is not a good
indicator of price performance
– inducement pricing: the copper
price was very well supported as
supply struggled to keep pace with
modest demand growth
– marginal cost pricing: the
aluminium price remained depressed
as plentiful supply more than
satisfied robust demand growth
– scarcity pricing: iron ore benefited
from strong demand growth and an
insufficient supply response
Source: BHP Billiton analysis; LME.
0
2,500
5,000
7,500
10,000
0
20
40
60
80 Copper
0
2,500
5,000
7,500
10,000
0
20
40
60
80
CY
00
CY
01
CY
02
CY
03
CY
04
CY
05
CY
06
CY
07
CY
08
CY
09
CY
10
CY
11
Cumulative demand growth
(% growth relative to 2000)
Demand CAGR: 2.0%
Price CAGR: 15.4%
Demand CAGR: 4.5%
Price CAGR: 4.0%
Aluminium
Price
(US$ per metric tonne)

Pricing will be partly driven by the pace of the
supply response
Preliminary results, 22 August 2012 Slide 18
• Robust aluminium demand will
continue to be met by strong supply
• The low cost iron ore supply
response is well advanced
• In copper, declining ore grades and
rising costs will continue to constrain
the supply response and support a
relatively steep cost curve
• The requirement for significant new
capacity in potash suggests prices
will be sustained at a level high
enough to induce new supply
Forecast supply additions relative to anticipated
20 year demand growth (2000 to 2020)
(%)
Source: BHP Billiton analysis; Wood Mackenzie; Fertecon.
Note: Supply refers to low cost mine supply for copper, potash and iron ore; and in the case of aluminium, capacity.
1. Indicates that aluminium demand growth to 2020 can be fully supplied from capacity additions by 2015.
0
20
40
60
80
100
Aluminium¹ Iron ore Copper Potash
Low cost supply
delivered to end
CY11
Low cost supply
response expected
between CY11 and
CY15
Supply required
to meet demand
growth

Prioritising low risk, high return growth
Preliminary results, 22 August 2012 Slide 19
• Our diversified strategy delivers superior
margins and returns
• Our 20 major projects are largely low risk
expansions of existing operations that will
deliver first production before end FY15
• Current investment in organic growth is
expected to create substantial value for
our shareholders
• No major projects are expected to be
approved in FY13
• As we complete the current suite of
projects in execution, we will allocate
future capital to those options that
maximise shareholder value
1. Financial metrics presented on a FY12 basis. Peer group based on LSE constituents: Rio Tinto, Anglo American and Xstrata. Return on assets (ROA) ratio calculated as follows: Total
sales divided by total assets (Asset turnover) multiplied by net income excluding exceptionals divided by total sales (Profit margin).
30
40
50
60
70
10 15 20 25 30
Profit margin1
(%)
Asset turnover1
(%)
BHP Billiton bubble size represents return on assets 1

Maximising our inner harbour capacity in WAIO
Preliminary results, 22 August 2012 Slide 20
• Our major projects are on schedule
and budget
– completion of the Port Hedland Inner
Harbour Expansion project in H2 CY12
takes our port capacity to 220mtpa1
– first production from the Jimblebar
Mine Expansion in Q1 CY14 will
increase its capacity to 35mtpa1
– capital investment associated with
these projects will peak in FY13
• WAIO production in FY13 is forecast to
increase by approximately 5%
FY11 FY12 FY13e FY14e FY15e FY16e
100
150
200
250
300
Car dumper 5
Jimblebar Mine
Expansion, port
blending & rail
yard facilities
Debottlenecking
WAIO system capacity
(mtpa, 100% basis)
+220mtpa
1. 100% basis.
Note: Dates are indicative of first production or commissioning of infrastructure.
230 245
277
15
32
100
200
300
Base LSD Post LSD OGP1 Post OGP1
94
36 130
0
50
100
150
Base Expansion Post expansion
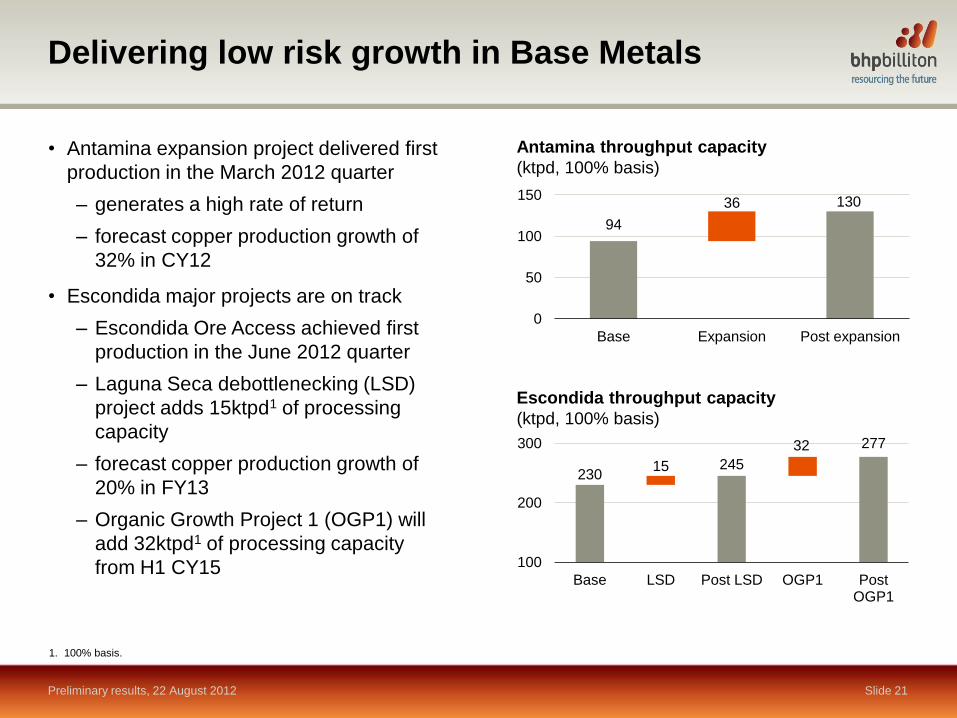
Delivering low risk growth in Base Metals
Preliminary results, 22 August 2012 Slide 21
• Antamina expansion project delivered first
production in the March 2012 quarter
– generates a high rate of return
– forecast copper production growth of
32% in CY12
• Escondida major projects are on track
– Escondida Ore Access achieved first
production in the June 2012 quarter
– Laguna Seca debottlenecking (LSD)
project adds 15ktpd1 of processing
capacity
– forecast copper production growth of
20% in FY13
– Organic Growth Project 1 (OGP1) will
add 32ktpd1 of processing capacity
from H1 CY15
Escondida throughput capacity
(ktpd, 100% basis)
Antamina throughput capacity
(ktpd, 100% basis)
1. 100% basis.

Significant latent capacity in Metallurgical Coal
Preliminary results, 22 August 2012 Slide 22
• Industrial action and wet weather severely
constrained production at Queensland Coal
• Strong Australian dollar, general inflationary
pressure and soft demand placed further
pressure on operating margins
• In response, we have chosen not to
commence the 2.5mtpa1 expansion of Peak
Downs associated with the Caval Ridge
mine development
• The 5.5mtpa1 Caval Ridge mine and
11mtpa1 Hay Point Stage Three Expansion
remain on schedule to deliver new capacity
in CY14
• By end CY142 the capacity of our leading
Queensland Coal business will be 50%
higher than the production rate recorded in
the recent 12 month period
1. 100% basis.
2. The Daunia and Broadmeadow Life Extension projects also remain on schedule for completion in CY13.
3. Includes major projects in execution; excludes Norwich Park nominal capacity.
44
66
12 10
0
40
80
FY12 production
FY12 nominal capacity
Projects in execution
FY15e capacity
Queensland Coal production capacity3
(mtpa, 100% basis)
32
55 12
11
0
40
80
FY12 throughput
FY12 nominal capacity
Hay Point Stage Three Expansion
FY15e capacity
Hay Point throughput capacity
(mtpa, 100% basis)

Eagle Ford Fayetteville
Haynesville
Permian
0.0
1.5
3.0
4.5
FY12 FY13e
Accelerating development of our liquids rich
shale assets
Preliminary results, 22 August 2012 Slide 23
• Prioritise development of the oil and
liquids rich Eagle Ford shale with
appraisal drilling in the Permian Basin
• Investment in the Eagle Ford offers
particularly high rates of return with
payback typically within one year
• Onshore US capital expenditure to rise to
approximately US$4 billion in FY13
• Onshore US production to increase to
approximately 100MMboe in FY13
• Development plans will remain flexible
and aligned with the external environment
Drilling activity in FY13
(number of rigs1)
Onshore US capital expenditure
(US$ billion)
1. Plan based on 40 drilling rigs.
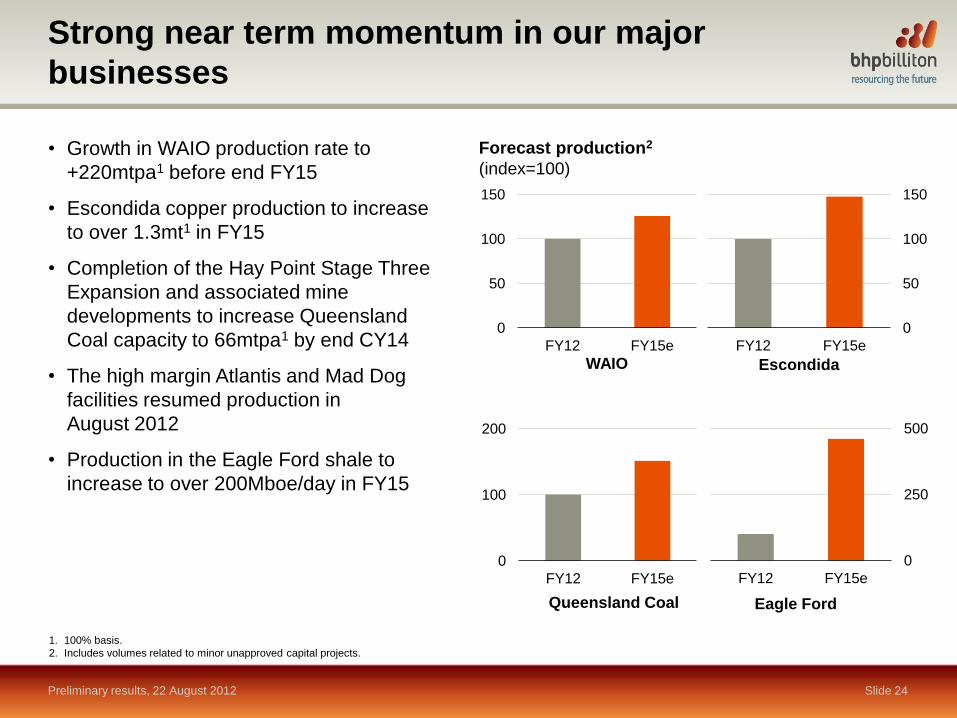
Strong near term momentum in our major
businesses
Preliminary results, 22 August 2012 Slide 24
• Growth in WAIO production rate to
+220mtpa1 before end FY15
• Escondida copper production to increase
to over 1.3mt1 in FY15
• Completion of the Hay Point Stage Three
Expansion and associated mine
developments to increase Queensland
Coal capacity to 66mtpa1 by end CY14
• The high margin Atlantis and Mad Dog
facilities resumed production in
August 2012
• Production in the Eagle Ford shale to
increase to over 200Mboe/day in FY15
1. 100% basis.
2. Includes volumes related to minor unapproved capital projects.
WAIO
0
50
100
150
FY12 FY15e
Escondida
0
100
200
FY12 FY15e
Forecast production2
(index=100)
Eagle Ford
0
50
100
150
FY12 FY15e
Queensland Coal
0
250
500
FY12 FY15e
Longer term development options
Preliminary results, 22 August 2012 Slide 25
Olympic Dam Project
• Following a major capital review, BHP Billiton has
decided to study an alternative, less capital
intensive design of the Olympic Dam open pit
expansion that involves new technologies
• This design has the potential to substantially
improve the economics of the project
• As a result, the Group is not ready to approve
development at Olympic Dam before the Indenture
agreement deadline of 15 December 2012
Jansen potash
• BHP Billiton has established a major presence in
the Saskatchewan potash basin
• Two underground shafts that will support an 8mtpa
operation at Jansen are well advanced and will be
fully excavated by end FY14
• Completed more than 25 kilometres of exploration
drilling in the wider Saskatchewan basin in FY12
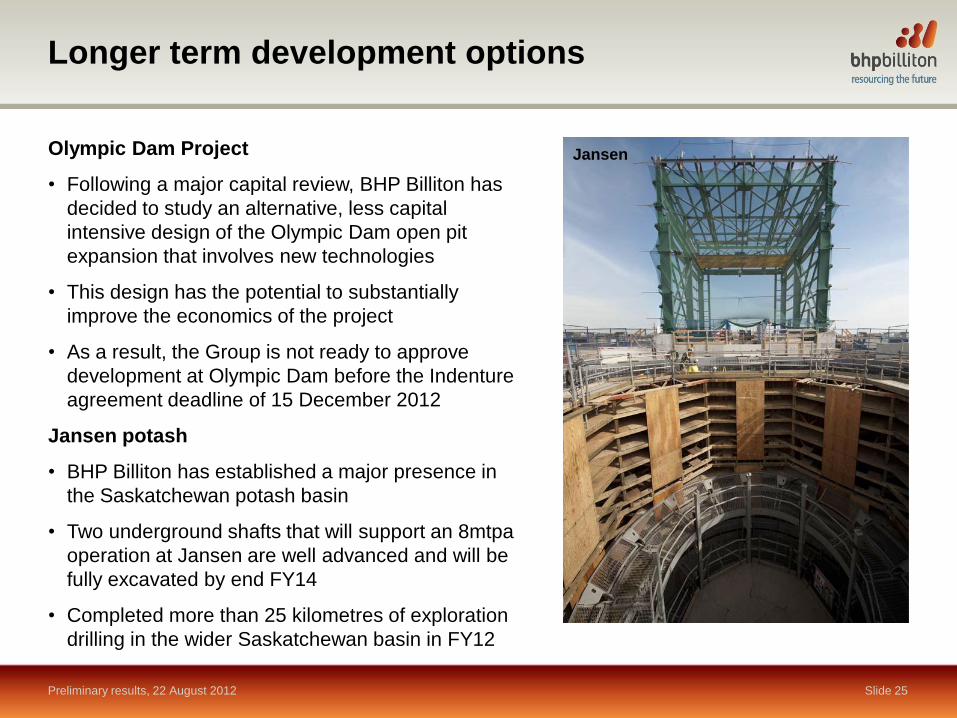
Jansen
Longer term development options
Preliminary results, 22 August 2012 Slide 26
Permian Basin
• 440,000 acres with a significant appraisal
program underway
• Encouraging results indicate potential for a
100Mboe/day shale liquids business
• More than 60 wells are planned for FY13
WAIO growth beyond 240mtpa
• WAIO has invested US$19 billion1 over a
10 year period
• Opportunities have been identified that
could release significant latent capacity
beyond 240mtpa2
• Increasing the productivity of our existing
infrastructure could deliver material volume
growth and unlock substantial value
1. Includes major projects and sustaining capital expenditure; BHP Billiton share.
2. 100% basis.
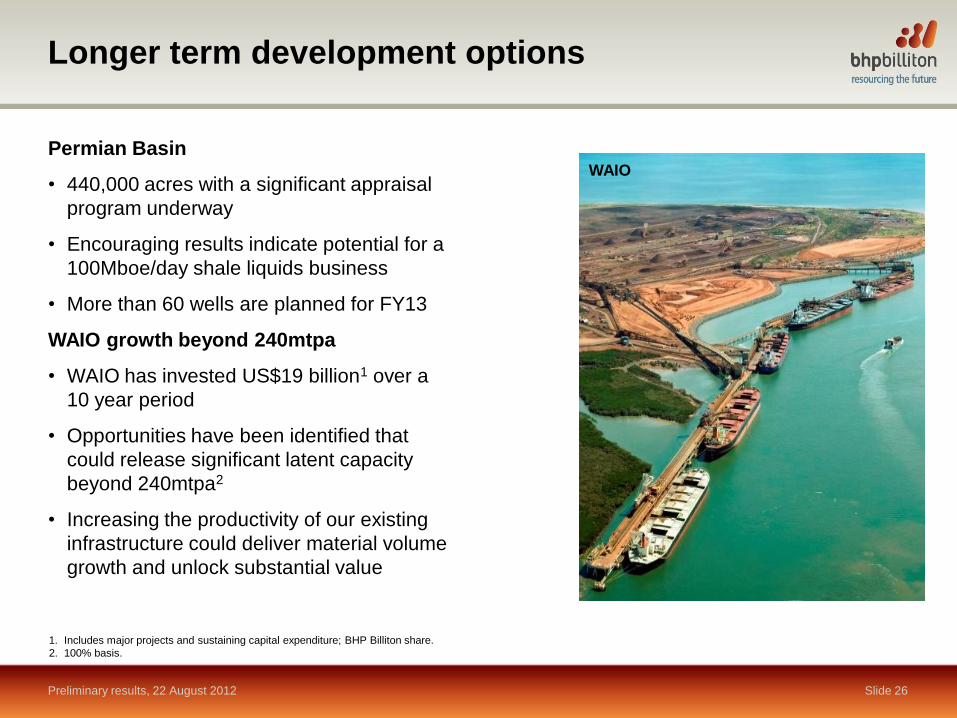
WAIO

Committed to further simplify the portfolio
Preliminary results, 22 August 2012 Slide 27
• Our business generates more cash per
unit of product and a higher level of cash
flow per employee
• The sale of our 37% non-operated interest
in Richards Bay Minerals is well advanced
• The review of our diamonds business is
continuing
• Assets must earn their right to remain in
the portfolio
• Other targeted divestments are being
considered
1,500
2,000
2,500
3,000
3,500
0 150 300 450 600
Cash margin1
(US$ per copper equivalent unit)
Source: Datastream; annual reports; press releases; BHP Billiton analysis.
1. Financial metrics presented on a FY12 basis and employee numbers (excluding contractors) presented on a FY12 basis for BHP Billiton and a CY11 basis for peers. Cash margin
is calculated as net operating cash flow per copper equivalent unit. Copper equivalent units based on FY12 average prices where available. Peer group based on LSE
constituents: Rio Tinto, Anglo American and Xstrata.
Simplicity1
(Net operating cash flow per employee, US$‟000)
BHP Billiton bubble size represents Underlying EBITDA margin1
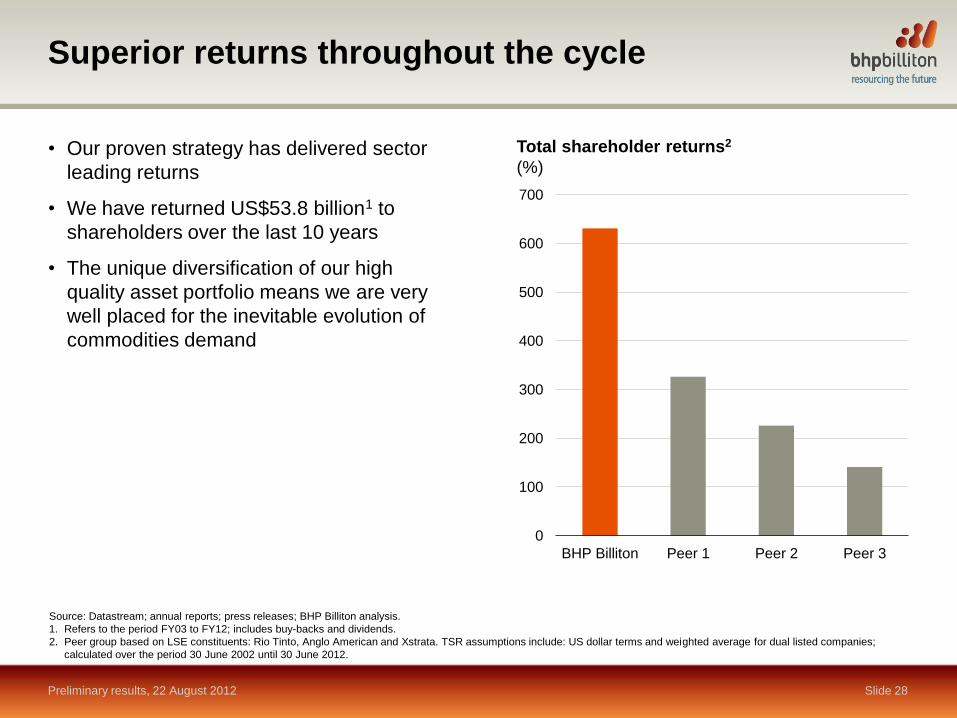
Superior returns throughout the cycle
Preliminary results, 22 August 2012 Slide 28
• Our proven strategy has delivered sector
leading returns
• We have returned US$53.8 billion1 to
shareholders over the last 10 years
• The unique diversification of our high
quality asset portfolio means we are very
well placed for the inevitable evolution of
commodities demand
0
100
200
300
400
500
600
700
BHP Billiton Peer 1 Peer 2 Peer 3
Total shareholder returns2
(%)
Source: Datastream; annual reports; press releases; BHP Billiton analysis.
1. Refers to the period FY03 to FY12; includes buy-backs and dividends.
2. Peer group based on LSE constituents: Rio Tinto, Anglo American and Xstrata. TSR assumptions include: US dollar terms and weighted average for dual listed companies;
calculated over the period 30 June 2002 until 30 June 2012.
Key themes
Preliminary results, 22 August 2012 Slide 29
• Strong operating performance and robust financial results
• Targeting a significant reduction in operating costs
• Disciplined investment has established strong momentum in our major businesses
• Our projects in execution are expected to create substantial value for our shareholders
• A commitment to further simplify the portfolio
• Sector leading shareholder returns

Appendix

Impact of major commodity price movements
Preliminary results, 22 August 2012 Slide 32
1,504
339 246
95
(245) (400)
(584)
(1,337)
(1,578)
(2,000)
(1,000)
0
1,000
2,000
Petroleum Metallurgical Coal
D&SP Energy Coal Aluminium Manganese SSM Iron Ore Base Metals
1. Includes net impact of price-linked costs.
Total price variance1
(FY12 versus FY11, US$ million)

Summary of key exchange rate components
in tax expense/(income)
Preliminary results, 22 August 2012 Slide 33
Restatement of
FY12
expense/(income)
US$ million
FY11
expense/(income)
US$ million
Current tax payable (91) 695
Deferred tax balances on fixed assets 59 (2,481)
Deferred tax balances on US$ debt 205 234
Deferred tax balances on timing differences 29 (3)
Other items 48 82
Total 250 (1,473)

Capital and exploration expenditure
Preliminary results, 22 August 2012 Slide 34
US$ billion FY03 FY04 FY05 FY06 FY07 FY08 FY09 FY10 FY11 FY12 FY13e
Growth 2.0 1.7 2.6 4.0 5.5 6.1 7.3 8.1 9.2 14.4
Sustaining and other 0.7 0.9 1.3 2.1 1.6 1.8 2.0 1.7 2.2 2.5
Exploration 0.3 0.5 0.5 0.8 0.8 1.4 1.3 1.3 1.2 2.1
Total 3.0 3.1 4.4 6.9 7.9 9.3 10.6 11.1 12.6 19.0 18.0
Note: Capital and exploration expenditure presented on an accruals basis.
US$ billion FY03 FY04 FY05 FY06 FY07 FY08 FY09 FY10 FY11 FY12 FY13e
Growth 0.2 3.3
Exploration 0.4
Total 0.2 3.7 4.0
Minerals and conventional oil and gas capital and exploration expenditure
Onshore US capital and exploration expenditure
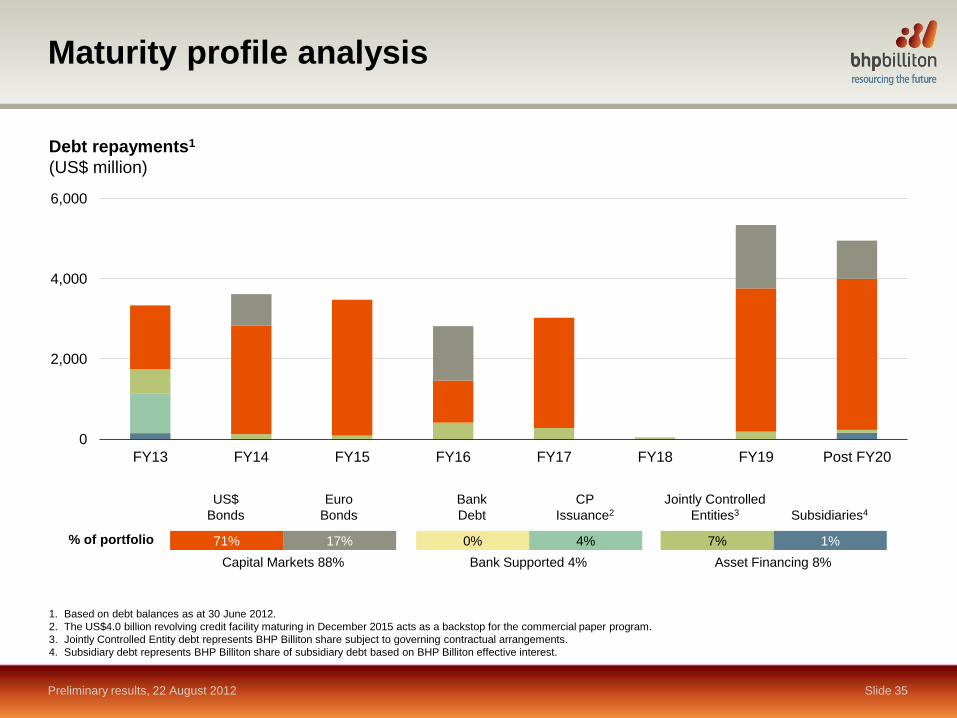
Maturity profile analysis
Preliminary results, 22 August 2012 Slide 35
Debt repayments1
(US$ million)
1. Based on debt balances as at 30 June 2012.
2. The US$4.0 billion revolving credit facility maturing in December 2015 acts as a backstop for the commercial paper program.
3. Jointly Controlled Entity debt represents BHP Billiton share subject to governing contractual arrangements.
4. Subsidiary debt represents BHP Billiton share of subsidiary debt based on BHP Billiton effective interest.
% of portfolio 0% 4% 71% 17%
Bank
Debt
CP
Issuance2
US$
Bonds
Euro
Bonds
Bank Supported 4% Capital Markets 88%
7% 1%
Jointly Controlled
Entities3
Subsidiaries4
Asset Financing 8%
0
2,000
4,000
6,000
FY13 FY14 FY15 FY16 FY17 FY18 FY19 Post FY20
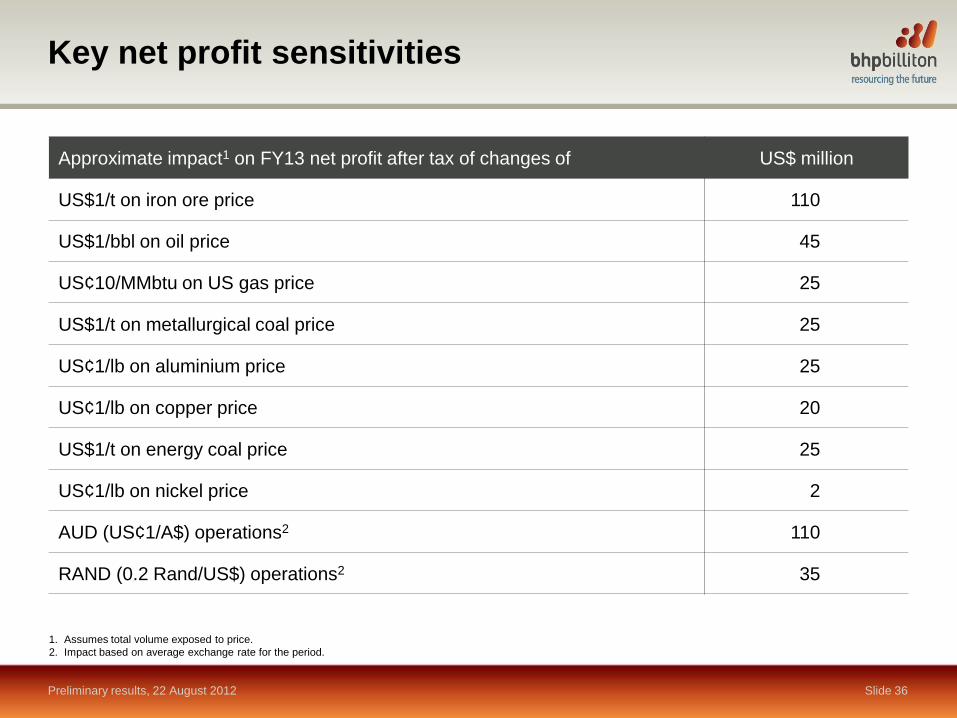
Key net profit sensitivities
Preliminary results, 22 August 2012 Slide 36
Approximate impact1 on FY13 net profit after tax of changes of US$ million
US$1/t on iron ore price 110
US$1/bbl on oil price 45
US¢10/MMbtu on US gas price 25
US$1/t on metallurgical coal price 25
US¢1/lb on aluminium price 25
US¢1/lb on copper price 20
US$1/t on energy coal price 25
US¢1/lb on nickel price 2
AUD (US¢1/A$) operations2 110
RAND (0.2 Rand/US$) operations2 35
1. Assumes total volume exposed to price.
2. Impact based on average exchange rate for the period.


