

Presented by:
Dr. Richard Harkness, CEO ADEPT DriverPaul Farrell Safety First
Prepared Exclusively For The
Loss Control Section ofCPCU Society
September 11, 2007Honolulu, Hawaii
Driving Miss Daisy: Safety Is No Accident!


Outline• Traffic Safety Overview
• Age Related Crash Risks– Defining the Issue– Analyzing the Factors
• Employment, Public Policy Issues
• Potential Solutions
• Summary

During this presentation…• Somewhere in the USA, 10 people will die
because of motor vehicle crashes (National Center for Statistics and Analysis, NHTSA)
• Worldwide, 274 drivers or pedestrians will perish on or next to a roadway, and another 11,415 will be injured (World Health Organization)

Global Perspective• While crash rates have generally declined
in the USA, they are climbing in other parts of the world.
• “World report on road traffic injury prevention” Highlights several provocative opinions:– traffic safety is under funded based on the
magnitude of the problem in developing countries
– Road deaths will eclipse many other health issues (TB, War, etc.) by CY 2020

Mortality Rates by Territory

Global Crash Costs

Traffic Safety• Despite best efforts of governments, insurers
and private firms, motor vehicle crashes remain:
– the leading cause of work place fatalities,
– the most costly lost-time workers compensation injury, and
– one of the leading causes of off-the-job, unintentional injury
WHY?

Traffic Safety
With limited exceptions, driving is the most complex
task people handle in the course of their day.
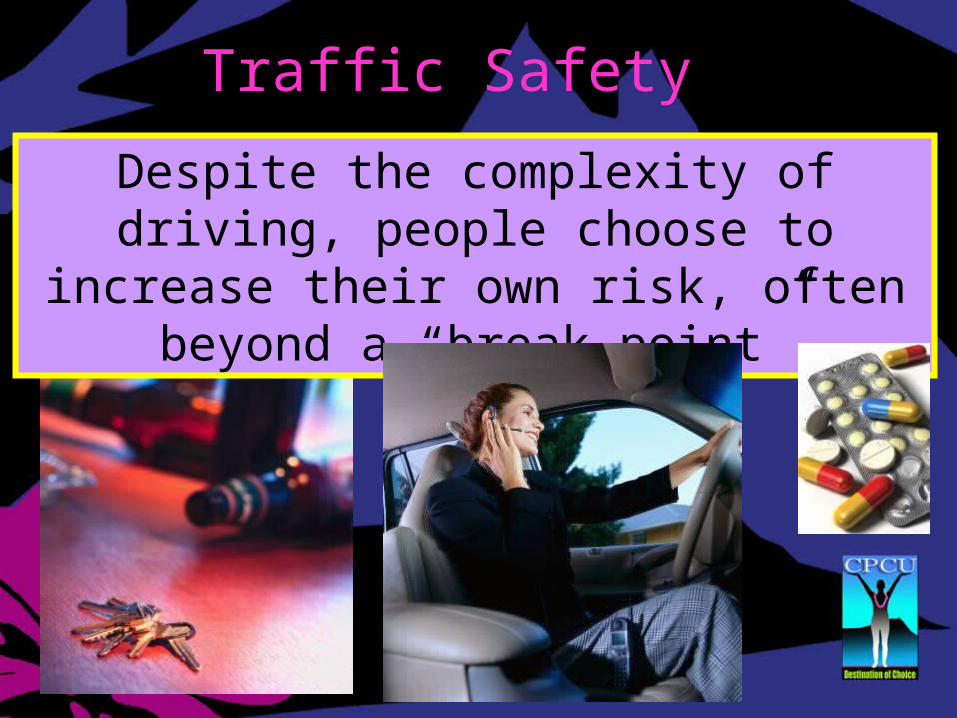
Traffic Safety
Despite the complexity of driving, people choose to increase their own risk, often
beyond a “break point”
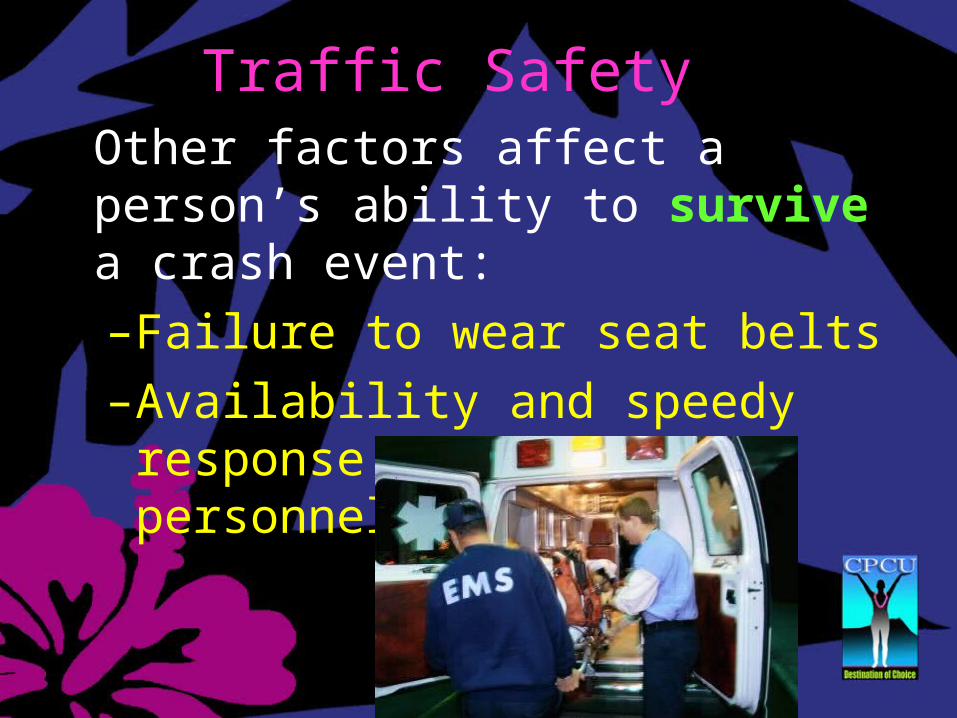
Traffic SafetyOther factors affect a person’s ability to survive a crash event:
–Failure to wear seat belts
–Availability and speedy response time of rescue personnel
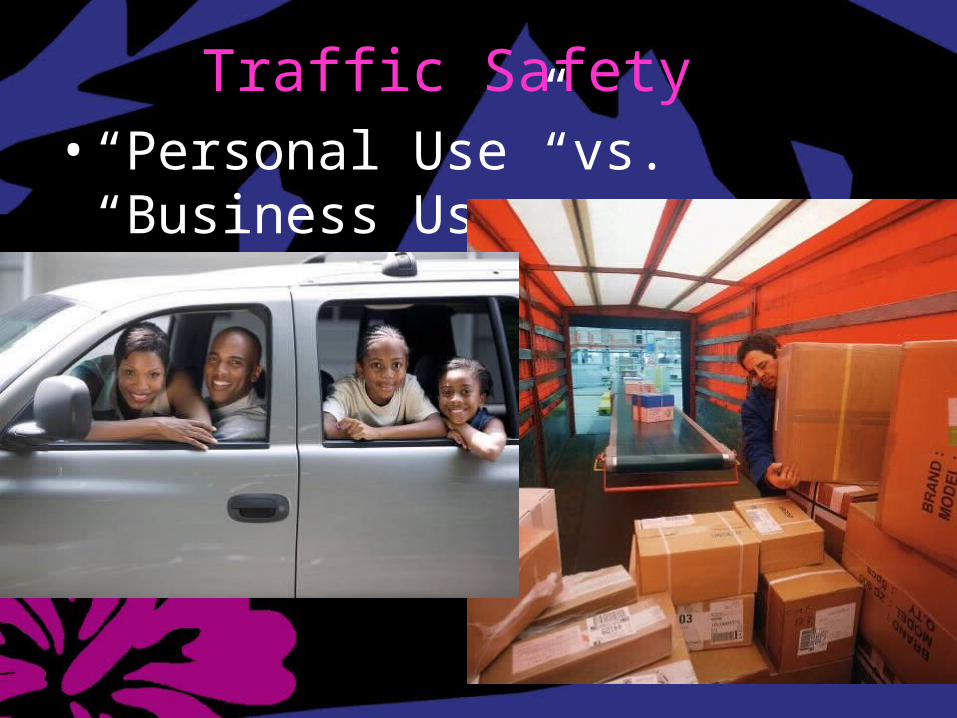
Traffic Safety• “Personal Use” vs. “Business Use”
Traffic Safety - Personal• Personal Use = getting to the grocery
store, or commuting to a work location.– For older drivers, driving is “lifeline” to
daily needs, social activity and gainful employment.

Traffic Safety - PersonalMost safety outreach efforts aimed at personal use are sponsored by public safety agencies, or vendors:
• NHTSA• IIHS• Police Departments• Driving Schools• National Safety Council• AAA / AAFTS

Traffic Safety - Personal
Personal use drivers participate in safety programs for many reasons.
Traffic Safety - Personal
Most safety practices for personal use driving focus on “common sense details”

Traffic Safety – Business UseBusiness use = job requires the employee to drive.
–For older commercial drivers, driving provides a source of income.
Traffic Safety - Commercial• Commercial safety training done by the
employer, often required by regulation, voluntary standards and by case law.
• Participation is mandatory, and the time spent is often eligible for compensation.

Traffic Safety - Commercial
Typically, a more formal approach to handling driver safety concerns.
Hiring / Selection
Medical Monitoring
Periodic, Specialized Training
Skills Evaluation
Annual Performance
Review
Traffic Safety
• Experience• Vehicle Design• Driver Impairments• Deadlines
• Weather• Equipment Maintenance• Distractions• Emotional Upset / Illness
Varied factors contribute to crashes:
Tool for analysis and understanding?

Haddon Matrix
FactorsPhase Human
Vehicles/Equipment
Environment
Pre-crashCrash
prevention
InformationAttitudes
ImpairmentPolice
enforcement
RoadworthinessLightingBrakingHandling
Speed management
Road design and road
layoutSpeed limitsPedestrian facilities
CrashInjury
prevention during the crash
Use of restraints
Impairment
Occupant restraints
Other safety devices
Crash-protective design
Crash-protective roadside objects
Post-crash
Life sustainingFirst-aid skill
Access to medics
Ease of accessFire risk
Rescue facilities
Congestion

Traffic Safety Analysis
All traffic safety issues can be reviewed under the Haddon Matrix:
–Youthful drivers
–Impaired driving
–Large truck vs. small car crashes
–Safety ratings
–EMT training and hospital response to crashes

Traffic Safety AnalysisFirst Dr. Harkness will help us define the scope of the age related drivers, then…
We will apply the Haddon Matrix to the issue of elderly drivers to identify the factors and suggest potential solutions to deal with aging drivers.

An Innovative Approach to Reducing Auto Collisions
Car Crashes Treated as a Behavioral Disorder

Background
Auto Crashes Resulting in Death
Driver Age Groups
Dea
ths
Per
10
0,0
00 L
icen
sed
Dri
ver
s
SOURCE: National Safety Council Injury Facts, 2004 edition p. 104
0
10
20
30
40
50
60
70
80
90
100
16-19 20-24 25-34 35-44 45-54 55-64 65-74 75 -over
1st Mission: Teens
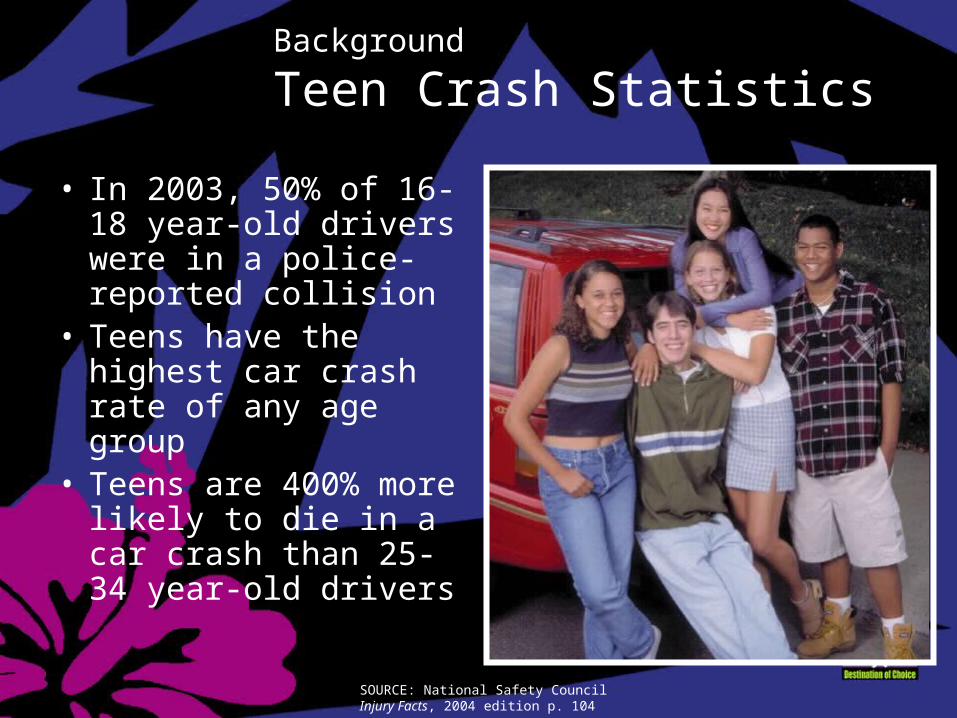
Background
Teen Crash Statistics
• In 2003, 50% of 16-18 year-old drivers were in a police-reported collision
• Teens have the highest car crash rate of any age group
• Teens are 400% more likely to die in a car crash than 25-34 year-old drivers
SOURCE: National Safety Council Injury Facts, 2004 edition p. 104

16
17
18
2000
58
45
36
2003
63
49
43
Age
Year
2005
32
26
24
Police Reported Crash Rate Per 100 Drivers Each Year
SOURCE: National Safety Council Injury Facts, 2001 edition, p. 100 and Injury Facts, 2004 edition p. 104 and Injury Facts 2007 edition p. 104
On average over 50% of teens crash during the first year of driving
Background
Teen Crash Trends

Background
What Does the Data Tell Us?• Teen car crashes are decreasing.
• Still the leading cause of death for teens
• The chance of one crash in the first three years of driving is 62%*
• The chance of two crashes in the first three years of driving is 18%*
• Per mile driven, teens are 300% more likely to die in car crash.
SOURCE: National Safety Council Injury Facts, 2007 edition, p. 104

Driver Age
Annual Automobile Crashes by Age
Cra
sh
es
Pe
r 1
00
L
ice
ns
ed
Dri
ve
rs
10
1
5
20
2
5
30
3
5
40
4
5
50
5
5
60
6
5
16
19
20
45
17
18
25
55 6535
75
16 25 35 45 55 65 75
ADEPT’s Challenge: Give new-to-the-road drivers the skills that usually take years of
on-the-road experience to master
SOURCE: National Safety Council Injury Facts, 2004 edition p. 104
Driver Age
Background
Our Challenge

0
1
2
3
4
5
16-19
20-24
25-29
30-34
35-39
40-44
45-49
50-54
55-59
60-64
65-69
70-74
75-79
80-84
85+
Driver Age Groups
Automobile Crashes Resulting in Injury or Death
Cra
sh
es
Pe
r M
illi
on
Mil
es
Dri
ve
n
2nd Mission: Seniors
Background

• 4% of Senior Drivers, 1.2 million will be killed or injured each year.
• Seniors have the highest death rate per mile driven of any age group
• 89% of Seniors with 40% or greater visual cognition reduction will crash a car in the next three years.
Background
Senior Crash Statistics

Background
Senior Crash Trends
75+
2002
9
2003
5 Age
Year
SOURCE: National Safety Council Injury Facts, 2003 edition, p. 104 and Injury Facts, 2004 edition p. 104,and Injury facts 2005 edition p.104 and Injury Facts 2007 edition p. 104
2005
4
2004
5
75+
2002
11.5
2003
11.5
2005
11.5
2004
11.5 Age
Police Reported Crash Rate Per 100 Drivers Each Year
Fatal Crash Rate Per 100 million vehicle miles

Background
What Does the Data Tell Us?
• On a per person basis, seniors have low crash rates
• On a per mile driven basis seniors have high crash rates
• Per mile driven, drivers over 75 are 383% more likely to die in a car crash.
SOURCE: National Safety Council Injury Facts, 2007 edition, p. 104

Background
• Senior Driver Population will Grow Significantly
> Currently 30 million Senior Drivers
> Estimated 70 million Senior Drivers by 2030

Factors Analysis
We’ll focus mainly on the human factors as we largely cannot change the environment or vehicle designs.

Human Factors: Pre-Crash
Impaired or Diminished Visual Acuity:– Changes in eye shape
– Cataracts
– Lens degradation
– Diseases affecting vision such as Macular Degeneration, HIV, Diabetes
Human Factors: Pre-Crash
Mental impairment:–Dementia, Alzheimer's
–Mental impairment by proper or improper use of medication for other conditions
–Emotional duress

Human Factors: Pre-Crash
Training and Awareness:– Scanning around vehicle for
right of way, merging, passing
– Situational awareness
– Practice traffic/road rules
– Spot and react to pedestrians

Human Factors: Post-CrashCrash Injuries and Treatment:– Increased susceptibility to crash injuries
(chest contusions and various fractures)
– Medical complications that may inhibit recovery
– “Fragility”
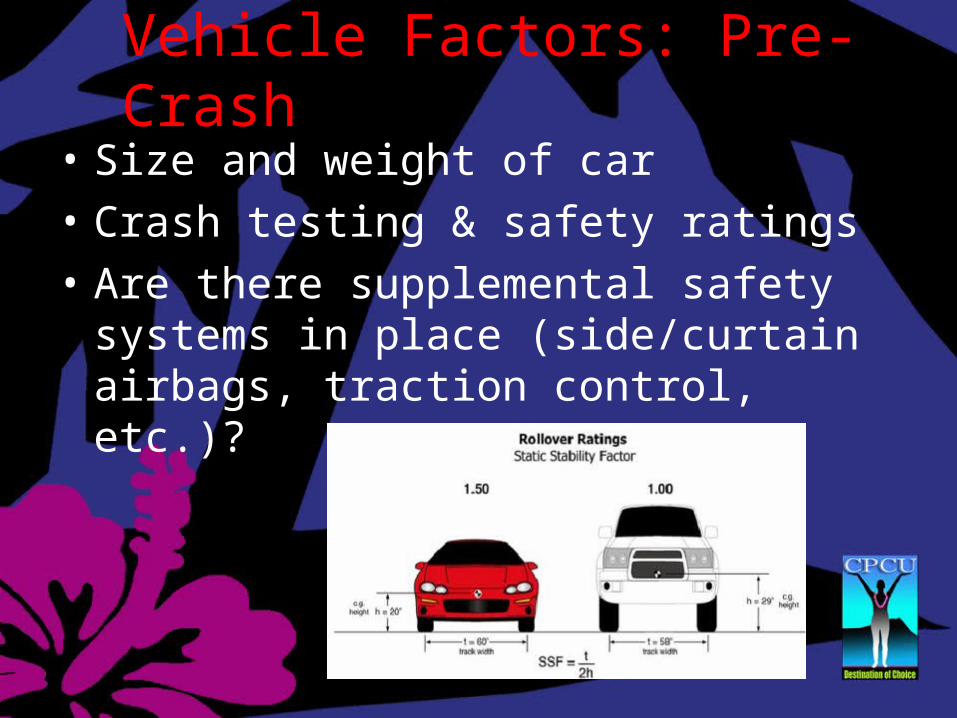
Vehicle Factors: Pre-Crash
• Size and weight of car
• Crash testing & safety ratings
• Are there supplemental safety systems in place (side/curtain airbags, traction control, etc.)?

Environmental Factors• Older drivers (age 70+) had more crashes at
intersections than younger drivers
• This type of crash accounted for about half of fatal crashes among drivers aged 85+
• Has there been enough attention to making roadway designs easy to understand and see?
Haddon Analysis - Conclusions• The human factors, specifically a person’s
medical/biological condition, have the most direct impact on crash causation.
• The most promising programs to address these concerns focus on licensing, monitoring, & training.

Health Monitoring - Obstacles
• Highly personal and can be emotional.
• Requires professional diagnosis/testing of driver.
• This raises additional questions of:– When to start testing (what age)?– Frequency of evaluations?– Cost (how much and who pays)?– Voluntary or compulsory?

Health Monitoring - Solutions
• Mandatory reporting of “unfit to drive” by physicians is in place in Canada
• USA is different:
• Fifty States = fifty guidelines for physicians
• AMA provides a guide (online)http://www.ama-assn.org/ama/pub/category/10791.html

Performance Monitoring
These systems range from “How’s My Driving?” call in programs to Satellite based Global Positioning Systems (GPS)– The systems have been widely documented
as effective in most commercial use settings.– Crash rate reductions of 20-30% are common– Many commercial insurers have loss control
programs to provide, or encourage policyholders to adopt such systems.

Performance MonitoringThe success of these programs comes from several critical factors:– The data generated is funneled through a
central contact person and evaluated based on a specific benchmark of performance.
– Affected drivers “must” participate in corrective coaching, counseling, training or if needed discipline.

Performance Monitoring• Personal use of these systems is not as
well documented. Limitations include:– Who serves as “coach”?– What is the basis of setting a realistic
benchmark with the study group so small?
• These systems may have some bearing if they come complete with recommendations, training resources, etc.

Self Monitoring & Education
• Driver Competency Assessment Protocols
• www.agenet.com – checklist for older drivers
• www.seniordrivers.org – various resources
• AAA -- Roadwise Review
The Adept Driving Program
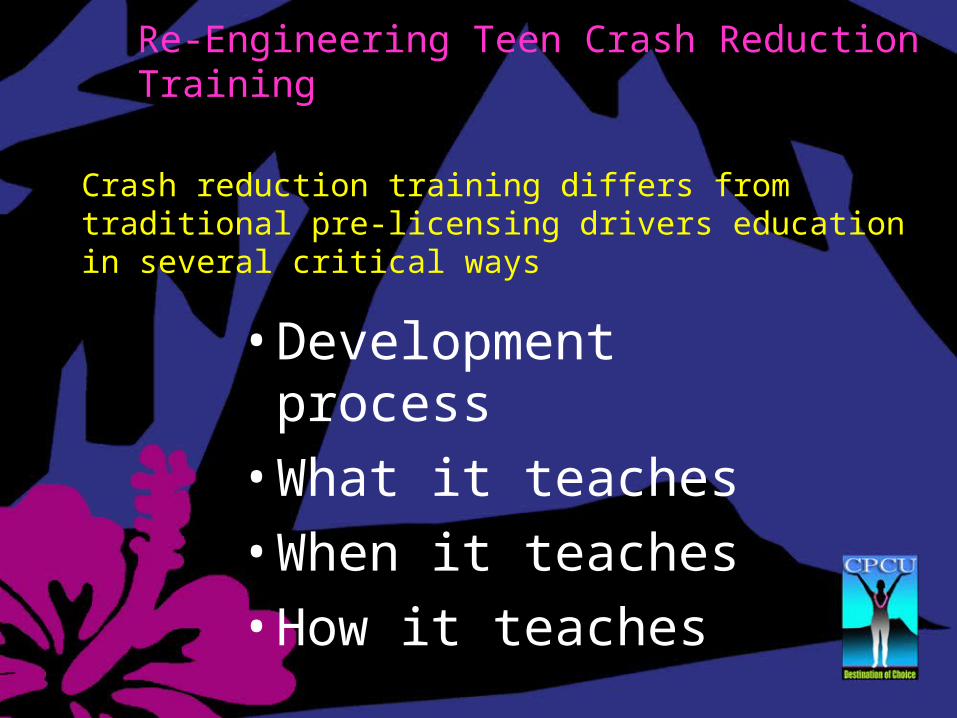
Re-Engineering Teen Crash Reduction Training
Crash reduction training differs from traditional pre-licensing drivers education in several critical ways
• Development process
• What it teaches
• When it teaches
• How it teaches
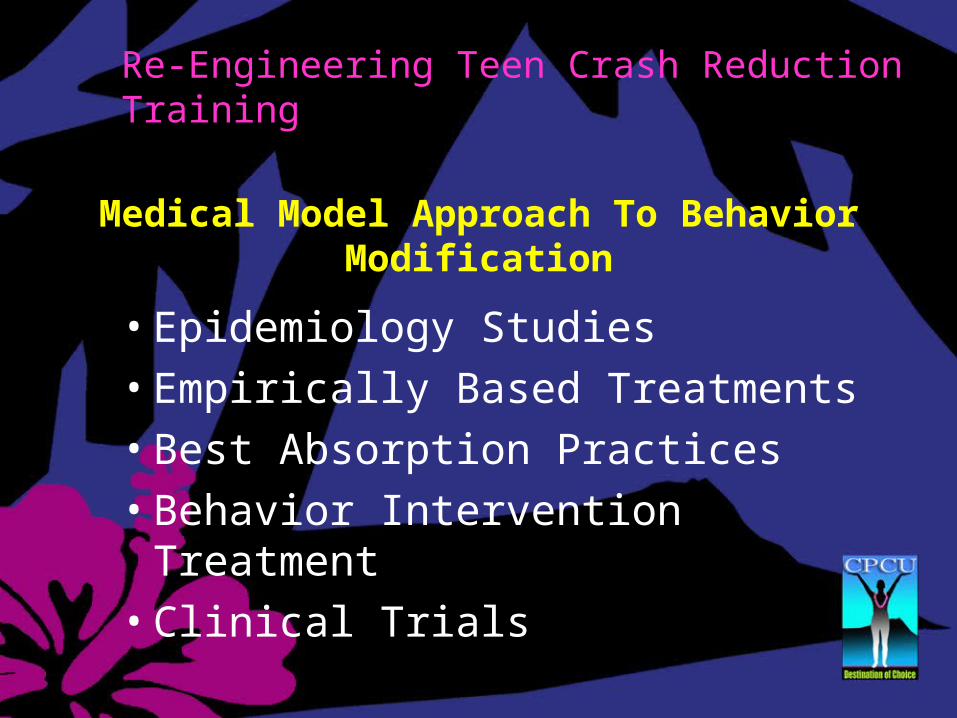
Re-Engineering Teen Crash Reduction Training
Medical Model Approach To Behavior Modification
• Epidemiology Studies
• Empirically Based Treatments
• Best Absorption Practices
• Behavior Intervention Treatment
• Clinical Trials

Re-Engineering Teen Crash Reduction Training
Step 1 Epidemiology Studies
• Convened a blue-ribbon panel of world-recognized experts:
– Dr. Herb Simpson (Chair)– Dr. Baruch Fischhoff– Dr. Richard Jessor– Dr. James McKnight– Dr. Allison Rossett
• Objective: Conduct research to identify the causes of teen driver collisions.

Re-Engineering Teen Crash Reduction Training
Step 1: Content Validation
• TIRF Research findings– Should be offered Post DE (after the 30/6)– Only empirically related content should be taught
• Key Factors that contribute to the greater crash risk of young drivers– Psychomotor skills (steering control, speed control,
integration and multitasking)– Perceptual skills (visual search & hazard detection)– Cognitive skills (risk assessment & decision making)– Attitudes and Motivations (risky lifestyle, risk taking)
• A different design training system is needed

Re-Engineering Teen Crash Reduction Training
Step 2: Empirically Based Treatments
• Research Results – Six highly correlated factors:
– Factor #1: Speed control– Factor #2: Space management– Factor #3: Risk perception– Factor #4: Visual search– Factor #5: Hazard recognition– Factor #6: Lifestyle Issues

Re-Engineering Teen Crash Reduction Training
Step 3: Best Absorption
• Determine best practices to modify behavior• Determine best learning modalities to increase
retention and practice • Gained consensus on curriculum content and
instructional technology• Result: ADEPT’s teenSMART training system
was born

Re-Engineering Teen Crash Reduction Training
Over $6 Million in Development

Re-Engineering Teen Crash Reduction Training
Step 4: Behavior Intervention
• Produced integrated, multi-media home study behavior intervention system
Workbooks
In-Car Guide
Interactive computer-based training on 6 CDs
DVD or VHSvideo segments

• Growth in knowledge
• Skill improvement
• Behavioral change
• Crash frequency
Re-Engineering Teen Crash Reduction Training
Step 5: Clinical Trials

Let’s See It…
Re-Engineering Teen Crash Reduction Training

Re-Engineering Teen Crash Reduction Training
How is teenSMART different from Driver Education
• Goals• Content• Teaching Effectiveness • Breadth and Depth• Position in Teen’s Learning Curve• Teen Motivation• Teaching Context • Parent Involvement• Measure of Success

Effectiveness of teenSMART Training
Absorption Effectiveness
• Is there measurable improvement in subject content knowledge?– 150 Subjects – Pre-post Design, parallel forms – Control for pre-testing effects– Visual Search, space management, speed
control, hazard recognition, risk and benefit perception
– ANOVA showed significant gains (p<.001) in all Knowledge areas
– Range: 22% to 42% in knowledge gains
Independent research conducted by Dr. Herb Simpson, Dr. Julie Downs, Dr. Baruch Fischhoff and Dan Mayhew

Effectiveness of teenSMART Training
Absorption Effectiveness
• Is there measurable improvement in driving skills?– 150 subjects– Pre-post Design, parallel forms – Control for pre-testing effects– Hazard clicking, Risk-0-meter, Where is it,
Driver action*, What’s the clue*– ANOVA showed significant gains (p<.01) in
Hazard clicking, Risk-o-meter and Where is it– Range: 9% to 41% in skill gains * Not significant
Independent research conducted by Dr. Herb Simpson, Dr. Julie Downs, Dr. Baruch Fischhoff and Dan Mayhew

Effectiveness of teenSMART Training
Behavior Modification Effectiveness
• Is there measurable improvement in behind the wheel driving behavior?– Drive test 50 subjects– Pre-post Design, Video taped– Control for pre-testing effects– Speed control, Space management,
Visual search– MANOVA showed significant gains p<.05
in all three areas
Independent research conducted by Dr. Herb Simpson, Dr. Julie Downs, Dr. Baruch Fischhoff and Dan Mayhew
Effectiveness of teenSMART Training
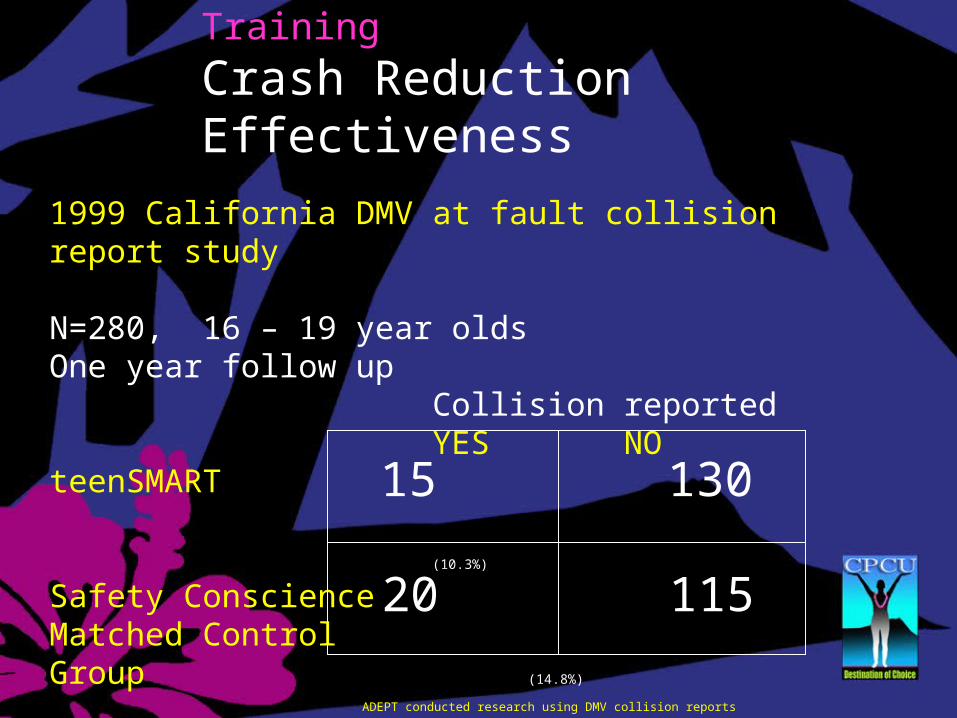
Crash Reduction Effectiveness
1999 California DMV at fault collision report study
N=280, 16 – 19 year oldsOne year follow up
Collision reportedYES NO
teenSMART
(10.3%)
Safety ConscienceMatched Control Group (14.8%)
15 130
20 115
ADEPT conducted research using DMV collision reports
20 115

Effectiveness of teenSMART Training
Crash Reduction Effectiveness
Does Improvement in Knowledge, Skills and Driving Behavior result in fewer young driver crashes?
145 teens aged 16 - 19 years had 30% fewer crashes one year after teenSMART training when compared to a safety-conscious control group from the same high schools and timeframe that were matched by age, gender and driving experience. Chi Square: Not significant

Effectiveness of teenSMART Training
Crash Reduction Effectiveness
262 1973
29,378 155,508
2002 Insurance organization collision report study
N=187,121, Aged 16,17&18Collisions per annualized exposure
Collision reportedYES NO
teenSMART
(11.5%)
Matched Control Group (15.9%)

Effectiveness of teenSMART Training
Crash Reduction Effectiveness
Does Improvement in Knowledge, Skills and Driving Behavior result in fewer young driver crashes?
In 2002 a study that involved 2235 teenSMART trained and 184,886 matched control group teens illustrated a 27.7% reduction in collision claims for the teenSMART group. Chi Square=28.72 P<.001

Effectiveness of teenSMART Training
Crash Reduction Effectiveness
2003 Insurance organization collision report study
N=262,589, Aged 16 and 17Collisions per annualized exposure
Collision reportedYES NO
teenSMART
Matched Control Group
726 6446
36,843 218,754

Effectiveness of teenSMART Training
Crash Reduction Effectiveness
Does Improvement in Knowledge, Skills and Driving Behavior result in fewer young driver crashes?
In 2003 a study that involved 7172 teenSMART trained and 255,417 matched control group teens illustrated a 29.8% reduction in collision claims for the teenSMART group. Chi Square=105.23 P<.001

Effectiveness of teenSMART Training
Crash Reduction Effectiveness
2003 Insurance organization collision report study
N=163,801 Age 18Collisions per annualized exposure
Collision reportedYES NO
teenSMART
Matched Control Group
328 3183
19,541 140,749

Effectiveness of teenSMART Training
Crash Reduction Effectiveness
Does Improvement in Knowledge, Skills and Driving Behavior result in fewer young driver crashes?
In 2003 a study that involved 3511 teenSMART trained and 160,290 matched control group teens illustrated a 23.8% reduction in collision claims for the teenSMART group. Chi Square=26.22 P<.001

Benefits for Teen Drivers and Parents
• Financial– Discounted insurance premiums– Decreased car repair costs– Fewer insurance claims & deductible costs– Fewer medical claims & costs– Fewer traffic citations
• Crash Prevention– Improved “skill factor” performance– Fewer collisions– Fewer injuries and deaths
• Freedom of Mobility– Retention of driving privileges

Benefits for Insurance Companies 1: Financial
• Significantly Improved Claims Experience and Loss Ratio’s
• Improved Customer Retention
• Premium Growth
• Over 100% discount recovery2: Marketing
• Improved Competitive Pricing
• Powerful, Award Winning Marketing Message
• Excellent Prospecting Tool
3: Public and Customer Relations• Consistent with Company Image
• Recognition for Pioneering a Breakthrough Product with the Power to Reduce Teen Injuries and Death

Re-Engineering Senior Driver Crash Reduction Training
Crash reduction training differs from traditional senior driver driver education in several critical ways
• Development process
• What it teaches
• When it teaches
• How it teaches

Re-Engineering Senior Driver Crash Reduction Training
Medical Model Approach To Behavior Modification
• Epidemiology Studies
• Empirically Based Treatments
• Best Absorption Practices
• Behavior Intervention Treatment
• Clinical Trials
Re-Engineering Senior Driver Crash Reduction Training
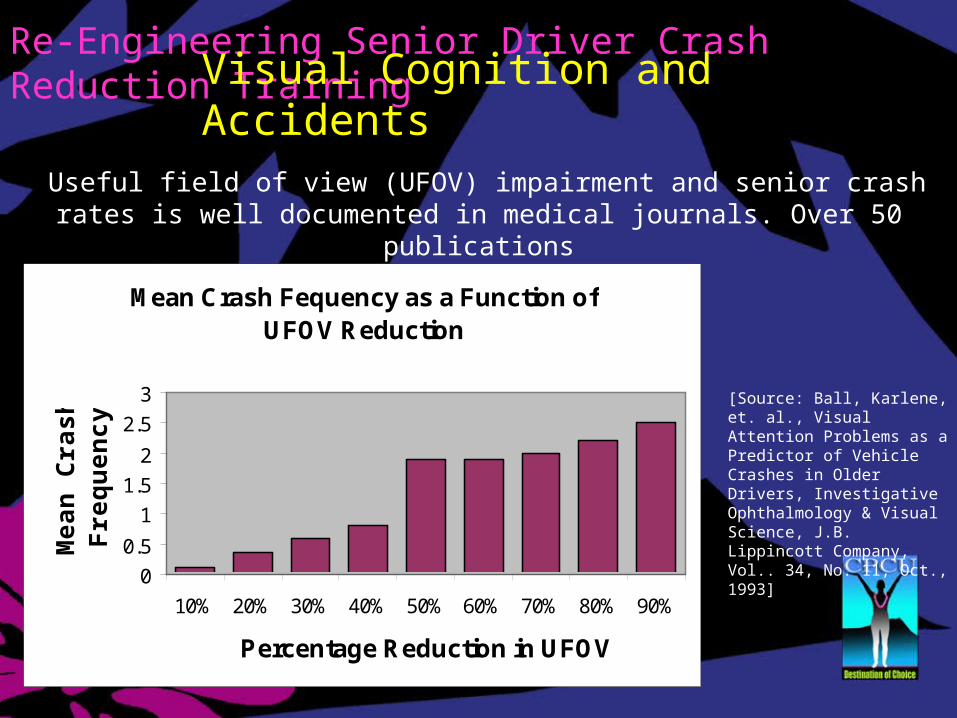
Visual Cognition and Accidents Useful field of view (UFOV) impairment and senior crash rates is well
documented in medical journals. Over 50 publications
Mean Crash Fequency as a Function of UFOV Reduction
0
0.5
1
1.5
2
2.5
3
10% 20% 30% 40% 50% 60% 70% 80% 90%
Percentage Reduction in UFOV
Me
an
Cra
sh
F
req
ue
nc
y
[Source: Ball, Karlene, et. al., Visual Attention Problems as a Predictor of Vehicle Crashes in Older Drivers, Investigative Ophthalmology & Visual Science, J.B. Lippincott Company, Vol.. 34, No. 11, Oct., 1993]

Re-Engineering Senior Driver Crash Reduction Training
Senior driver age is not a good indicator of crash likelihood
Reduction in visual cognition and visual memory is the best indicator of senior crash likelihood.
Mean Crash Frequency as a Function of Age and UFOV
Reduction
0
1
2
3
Age 55-64 Age 65 -74 Age 75 or greater
Percentage Reduction in UFOV
Me
an
Cra
sh
Less than 40%41 - 90%
[Source: Ball, Karlene, et. al., Visual Attention Problems as a Predictor of Vehicle Crashes in Older Drivers, Investigative Ophthalmology & Visual Science, J.B. Lippincott Company, Vol.. 34, No. 11, Oct., 1993]
Summary
• Empirically developed
• Science-based content
• Validated instructional technology
• Proven crash reduction
• Comprehensive and effective program

Bottom Line
• Fewer collisions
• Better driving skills that reduce chances of injury
• Parents and family are engaged
• Strong economic incentive for all stakeholders

Technology Demonstration
Full Motion - Real Life Driving Challenges

Public Policy Issues - Licensing
This is an example of the confusion surrounding the underlying cause – medical condition not age. Some possible solutions:
– “Accelerated Renewal” cycles after some threshold age (shorter renewal cycles)
– Special provisions for older drivers such as vision checks, road tests
– Restrict renewal by mail after a certain age

Other Concerns - Employment
Supervisors of drivers of commercial vehicles may set policies governing ability to perform job duties
– Unfairly Discriminatory?– Employers can require physicals for WC issues– DOT Regulations require periodic physicals

Summary
Aging drivers have an increased risk of crash and fatality due to medical conditions such as:
– Cognitive and visual impairments– Fragility or a susceptibility to be injured– Difficulty in recovering from extensive injuries

Summary
Minimizing the potential for crashes by elderly drivers can be accomplished when:1. A monitoring program is in place to notice
key health, behavior or performance changes–Physicians are part of the team–Self monitoring and education are treated
as important by the affected driver(s)

Summary
2. Licensing programs treat drivers respectfully, fairly and with public safety properly balanced
3. Employers understand and properly practice their rights and responsibilities under employment and case law:– Provide safety programs– Comply with regulations (physicals)– Treat each employee fairly
http://my.safetyfirst.com/presentations/DrivingMissDaisy752007.ppt


