
04/05/2016
Primary Health Care facility managers’ competency
assessments in South Africa: The refinement of competency
assessment tools and approaches
R Madale1, J Dippenaar1, A Cois1 and R English1 1 Health Systems Trust
1
Background
In 2013, a competency assessments study was conducted with 429 PHC
managers in ten districts across five provinces.
The purpose of that study was to:
Determine public health and general management competencies of health
facility and local area managers working in selected districts in South
Africa in order to identify areas that need strengthening in the context of
the PHC re-engineering
A set of tools were developed to assess the competencies of these managers.
This study revealed competency gaps of managers in:
Leadership
Operational management
Public health
2
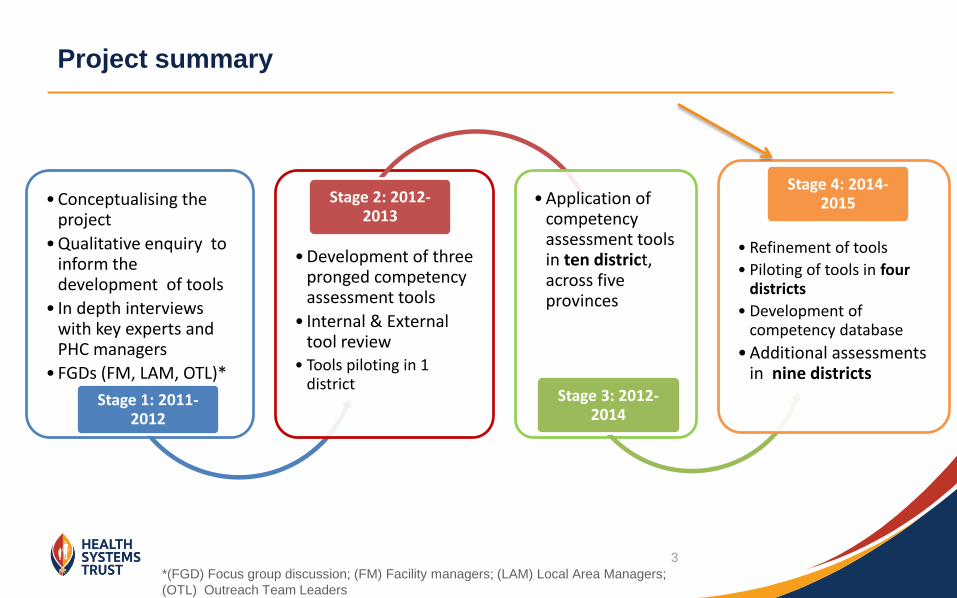
• Conceptualising the project
• Qualitative enquiry to inform the development of tools
• In depth interviews with key experts and PHC managers
• FGDs (FM, LAM, OTL)*
Stage 1: 2011- 2012
• Development of three pronged competency assessment tools
• Internal & External tool review
• Tools piloting in 1 district
Stage 2: 2012-2013
• Application of competency assessment tools in ten district, across five provinces
Stage 3: 2012-2014
• Refinement of tools
• Piloting of tools in four districts
• Development of competency database
• Additional assessments in nine districts
Stage 4: 2014-2015
Project summary
*(FGD) Focus group discussion; (FM) Facility managers; (LAM) Local Area Managers;
(OTL) Outreach Team Leaders
3
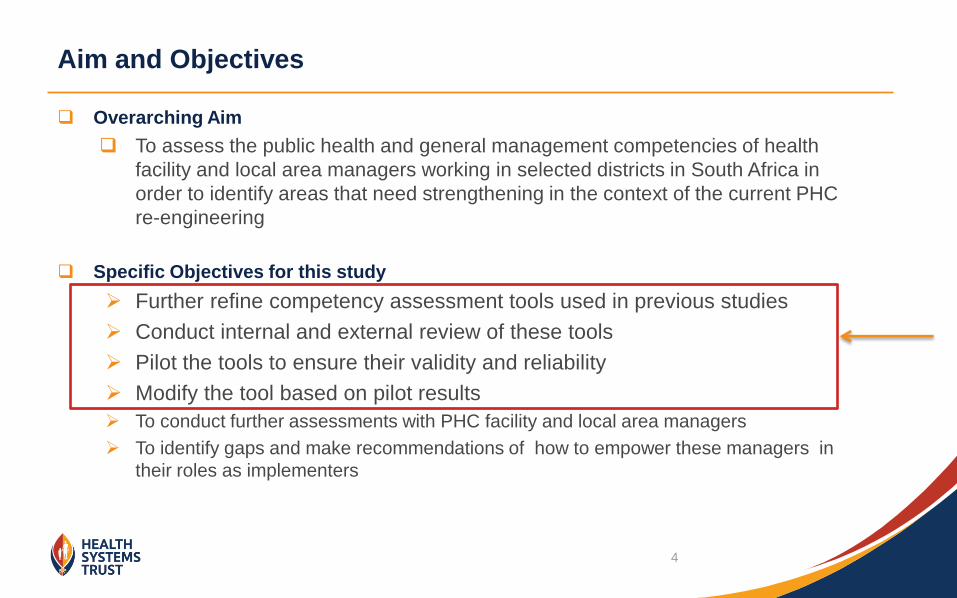
Aim and Objectives
Overarching Aim
To assess the public health and general management competencies of health
facility and local area managers working in selected districts in South Africa in
order to identify areas that need strengthening in the context of the current PHC
re-engineering
Specific Objectives for this study
Further refine competency assessment tools used in previous studies
Conduct internal and external review of these tools
Pilot the tools to ensure their validity and reliability
Modify the tool based on pilot results
To conduct further assessments with PHC facility and local area managers
To identify gaps and make recommendations of how to empower these managers in
their roles as implementers
4
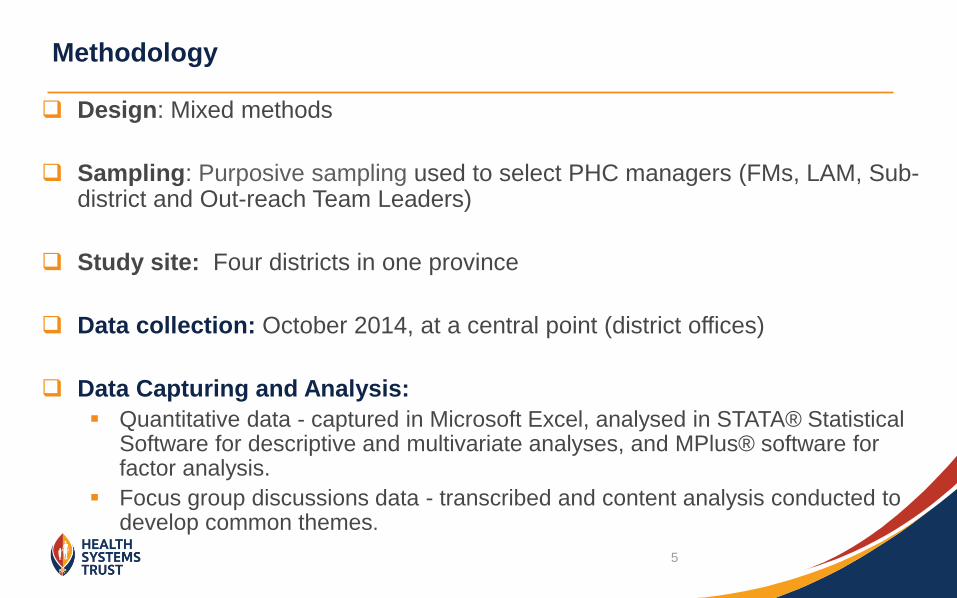
Design: Mixed methods
Sampling: Purposive sampling used to select PHC managers (FMs, LAM, Sub-district and Out-reach Team Leaders)
Study site: Four districts in one province
Data collection: October 2014, at a central point (district offices)
Data Capturing and Analysis:
Quantitative data - captured in Microsoft Excel, analysed in STATA® Statistical Software for descriptive and multivariate analyses, and MPlus® software for factor analysis.
Focus group discussions data - transcribed and content analysis conducted to develop common themes.
Methodology
5
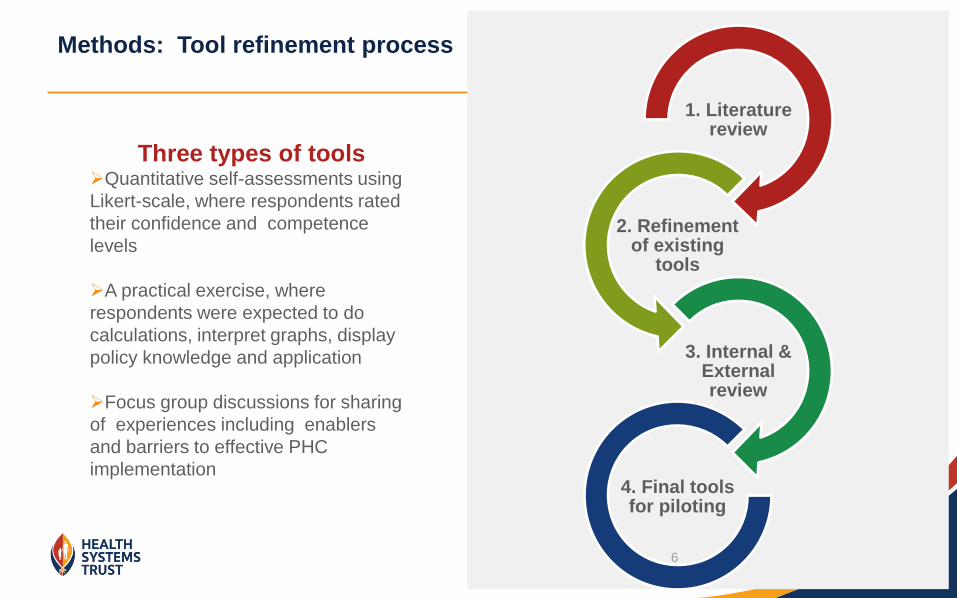
Methods: Tool refinement process
Three types of tools Quantitative self-assessments using
Likert-scale, where respondents rated
their confidence and competence
levels
A practical exercise, where
respondents were expected to do
calculations, interpret graphs, display
policy knowledge and application
Focus group discussions for sharing
of experiences including enablers
and barriers to effective PHC
implementation
1. Literature review
2. Refinement of existing
tools
3. Internal & External review
4. Final tools for piloting
6
Study Results
Pre-pilot
Refinement of tools
Piloting and testing of competency tools
Demographic characteristics
Analysis of missing data
Factor analysis
Self-administered questionnaire
Practical exercises
Focus group discussion results
Conclusion
8

Refinement of tools (pre-pilot)
9
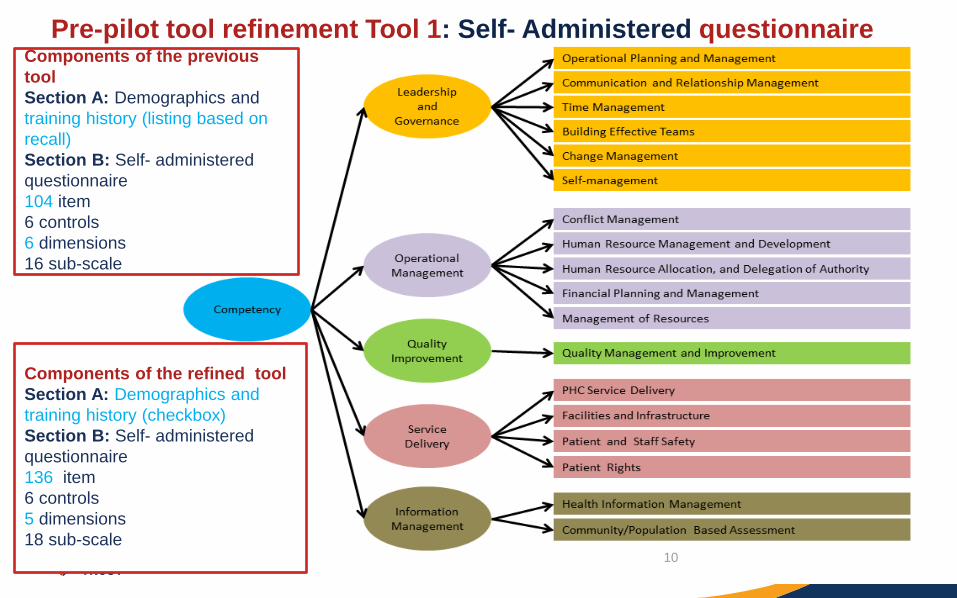
Pre-pilot tool refinement Tool 1: Self- Administered questionnaire
Components of the previous
tool
Section A: Demographics and
training history (listing based on
recall)
Section B: Self- administered
questionnaire
104 item
6 controls
6 dimensions
16 sub-scale
Components of the refined tool
Section A: Demographics and
training history (checkbox)
Section B: Self- administered
questionnaire
136 item
6 controls
5 dimensions
18 sub-scale
10
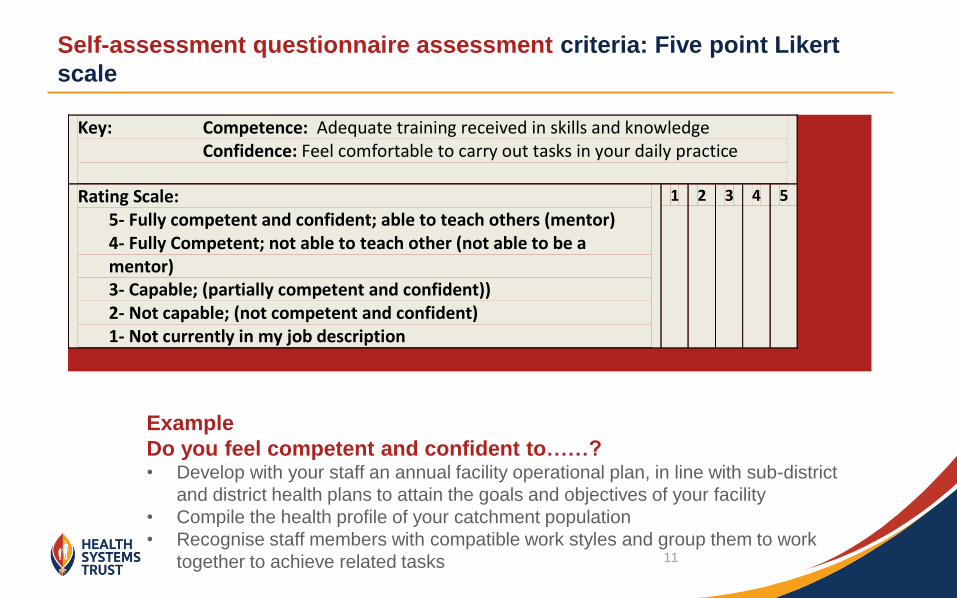
Self-assessment questionnaire assessment criteria: Five point Likert
scale
Key: Competence: Adequate training received in skills and knowledge Confidence: Feel comfortable to carry out tasks in your daily practice
Rating Scale: 5- Fully competent and confident; able to teach others (mentor) 4- Fully Competent; not able to teach other (not able to be a
mentor) 3- Capable; (partially competent and confident)) 2- Not capable; (not competent and confident)
1- Not currently in my job description
1 2 3 4 5
Example
Do you feel competent and confident to……? • Develop with your staff an annual facility operational plan, in line with sub-district
and district health plans to attain the goals and objectives of your facility
• Compile the health profile of your catchment population
• Recognise staff members with compatible work styles and group them to work
together to achieve related tasks 11
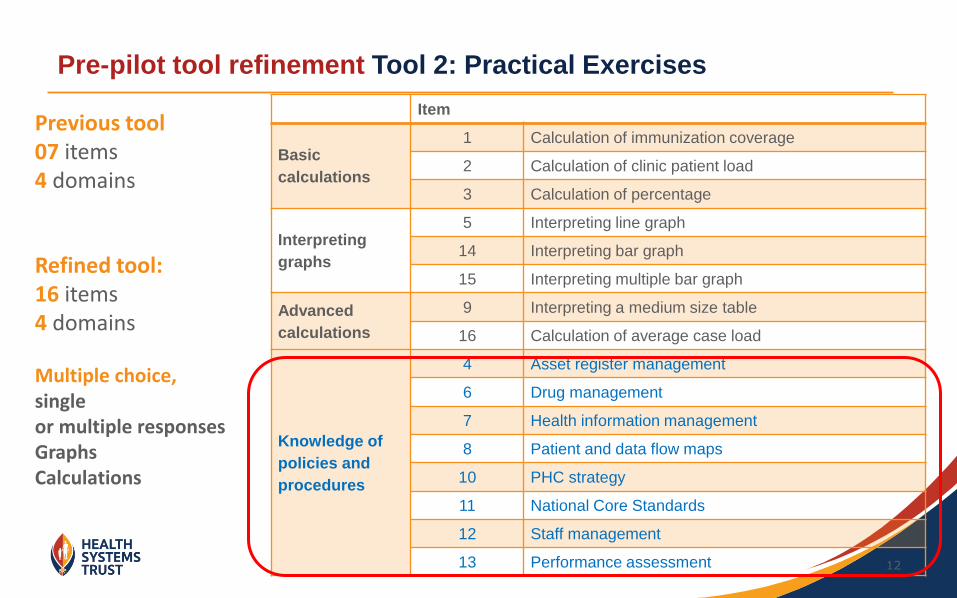
Pre-pilot tool refinement Tool 2: Practical Exercises
12
Refined tool: 16 items 4 domains Multiple choice, single or multiple responses Graphs Calculations
Item
Basic
calculations
1 Calculation of immunization coverage
2 Calculation of clinic patient load
3 Calculation of percentage
Interpreting
graphs
5 Interpreting line graph
14 Interpreting bar graph
15 Interpreting multiple bar graph
Advanced
calculations
9 Interpreting a medium size table
16 Calculation of average case load
Knowledge of
policies and
procedures
4 Asset register management
6 Drug management
7 Health information management
8 Patient and data flow maps
10 PHC strategy
11 National Core Standards
12 Staff management
13 Performance assessment
Previous tool 07 items 4 domains
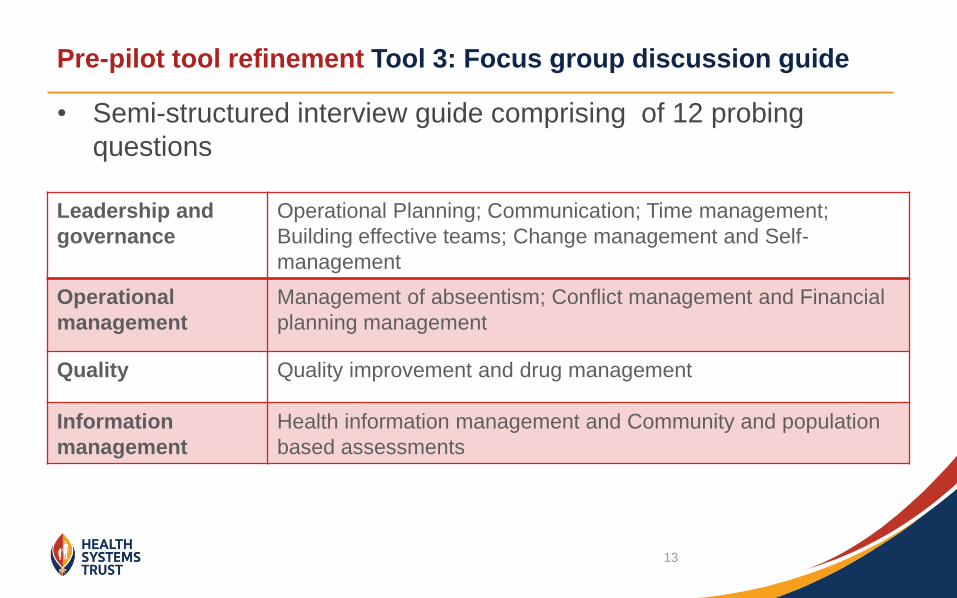
Pre-pilot tool refinement Tool 3: Focus group discussion guide
• Semi-structured interview guide comprising of 12 probing
questions
Leadership and
governance
Operational Planning; Communication; Time management;
Building effective teams; Change management and Self-
management
Operational
management
Management of abseentism; Conflict management and Financial
planning management
Quality Quality improvement and drug management
Information
management
Health information management and Community and population
based assessments
13
Pilot: Analysis of missing
data; factor analysis
14
Results: Data cleaning
Tools administered to a sample of 348
15 questionnaires excluded – more than 40 % of missing data
46 questionnaires excluded – nurses delegated to represent their facility managers
Final analysis of data conducted on 287 participants
15
Analysis of self assessment questionnaire - missing and incongruent
responses (n=287)
Proportion of missing data was less than 5%
Analysis of possible contributory factors to missing data
Participants characteristics
Easiness or difficulty of questions
Effects of length of tools (fatigue)
Level of understanding of the questions (control questions)
16
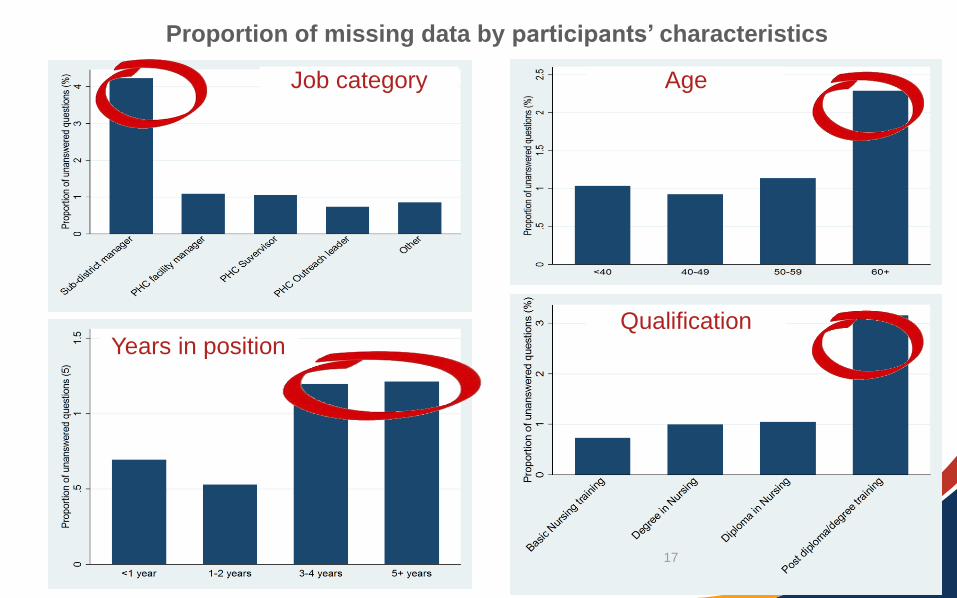
Job category Age
Qualification Years in position
Proportion of missing data by participants’ characteristics
17
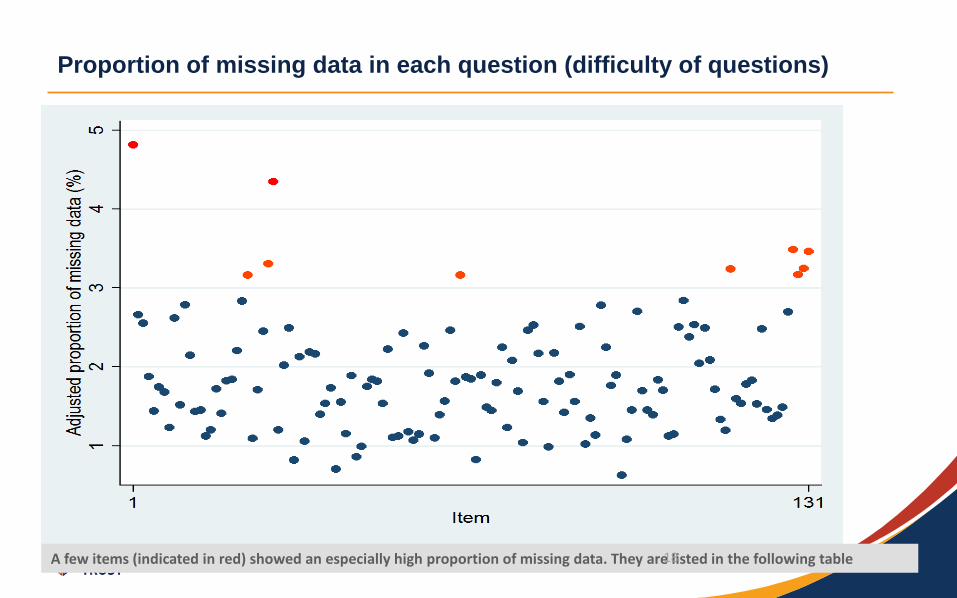
Proportion of missing data in each question (difficulty of questions)
A few items (indicated in red) showed an especially high proportion of missing data. They are listed in the following table 18
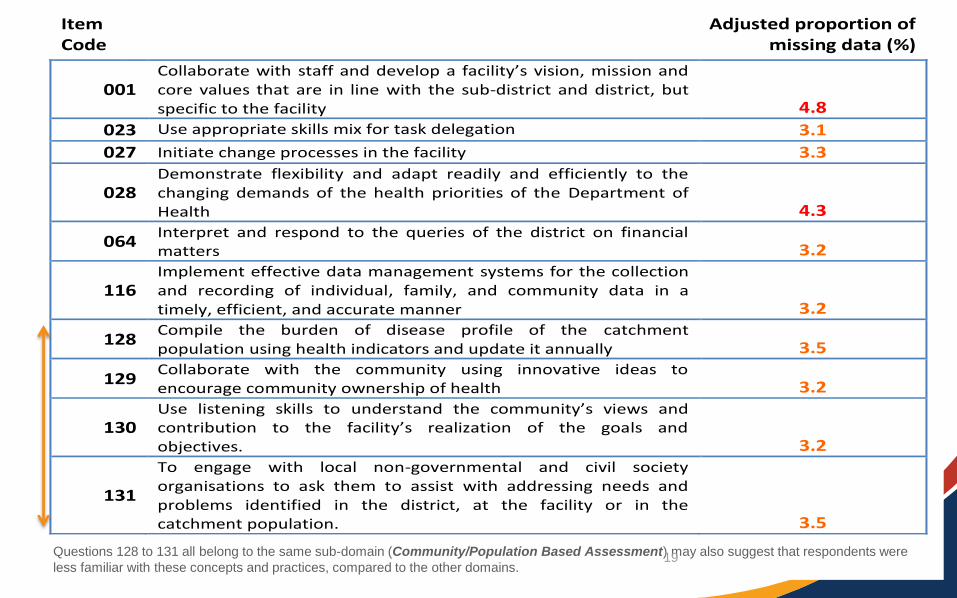
Item Code
Adjusted proportion of missing data (%)
001 Collaborate with staff and develop a facility’s vision, mission and core values that are in line with the sub-district and district, but specific to the facility 4.8
023 Use appropriate skills mix for task delegation 3.1
027 Initiate change processes in the facility 3.3
028 Demonstrate flexibility and adapt readily and efficiently to the changing demands of the health priorities of the Department of Health 4.3
064 Interpret and respond to the queries of the district on financial matters 3.2
116 Implement effective data management systems for the collection and recording of individual, family, and community data in a timely, efficient, and accurate manner 3.2
128 Compile the burden of disease profile of the catchment population using health indicators and update it annually 3.5
129 Collaborate with the community using innovative ideas to encourage community ownership of health 3.2
130 Use listening skills to understand the community’s views and contribution to the facility’s realization of the goals and objectives. 3.2
131
To engage with local non-governmental and civil society organisations to ask them to assist with addressing needs and problems identified in the district, at the facility or in the catchment population. 3.5
Questions 128 to 131 all belong to the same sub-domain (Community/Population Based Assessment) may also suggest that respondents were
less familiar with these concepts and practices, compared to the other domains. 19
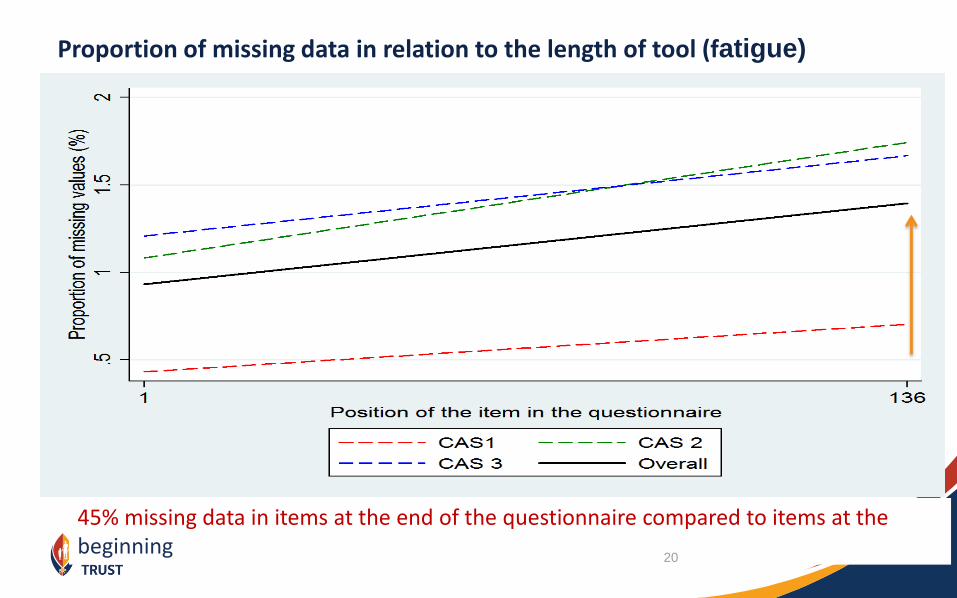
45% missing data in items at the end of the questionnaire compared to items at the beginning
Proportion of missing data in relation to the length of tool (fatigue)
20
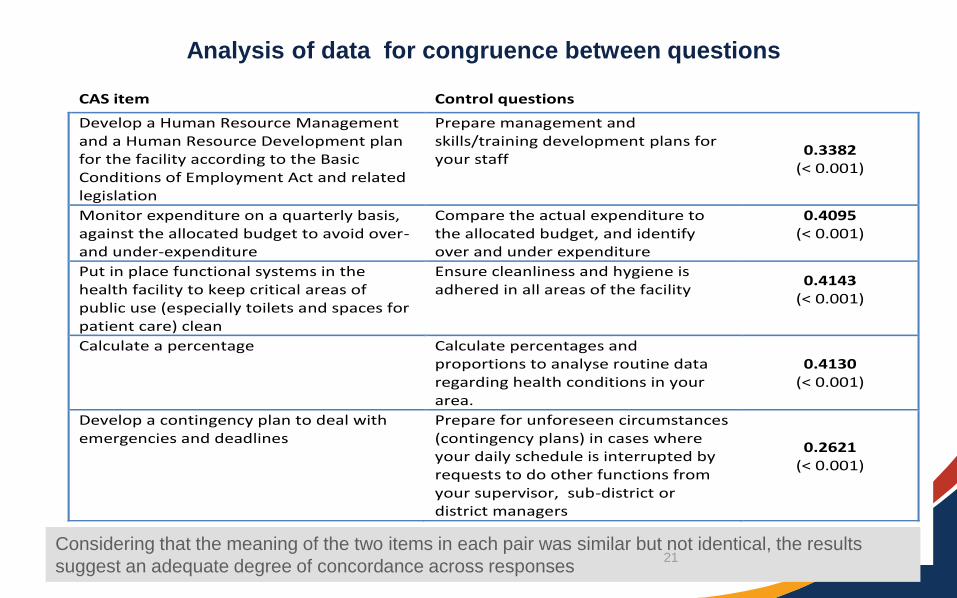
CAS item Control questions taub
Develop a Human Resource Management and a Human Resource Development plan for the facility according to the Basic Conditions of Employment Act and related legislation
Prepare management and skills/training development plans for your staff
0.3382 (< 0.001)
Monitor expenditure on a quarterly basis, against the allocated budget to avoid over- and under-expenditure
Compare the actual expenditure to the allocated budget, and identify over and under expenditure
0.4095 (< 0.001)
Put in place functional systems in the health facility to keep critical areas of public use (especially toilets and spaces for patient care) clean
Ensure cleanliness and hygiene is adhered in all areas of the facility
0.4143 (< 0.001)
Calculate a percentage Calculate percentages and proportions to analyse routine data regarding health conditions in your area.
0.4130 (< 0.001)
Develop a contingency plan to deal with emergencies and deadlines
Prepare for unforeseen circumstances (contingency plans) in cases where your daily schedule is interrupted by requests to do other functions from your supervisor, sub-district or district managers
0.2621 (< 0.001)
Analysis of data for congruence between questions
Considering that the meaning of the two items in each pair was similar but not identical, the results
suggest an adequate degree of concordance across responses 21
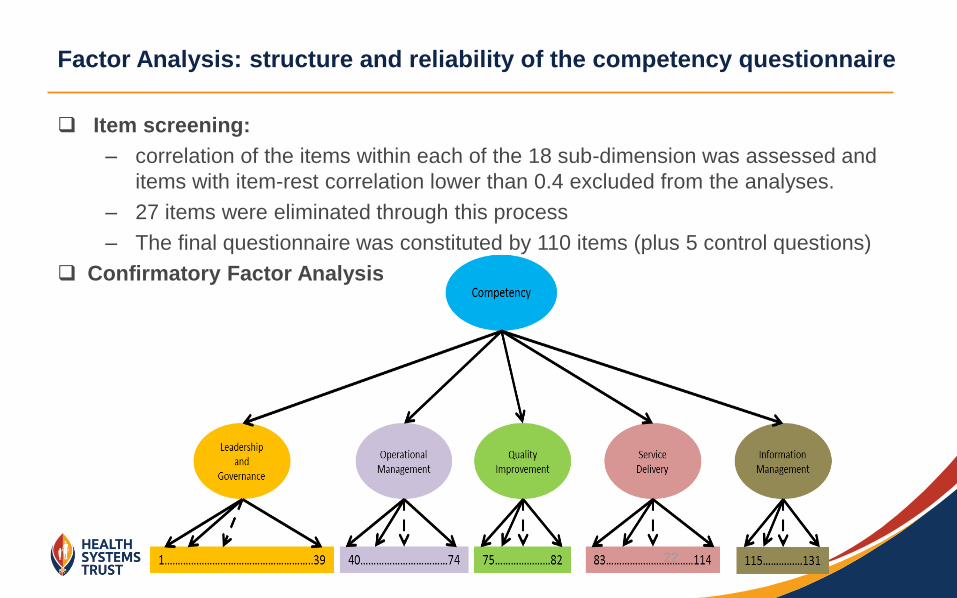
Factor Analysis: structure and reliability of the competency questionnaire
Item screening:
– correlation of the items within each of the 18 sub-dimension was assessed and
items with item-rest correlation lower than 0.4 excluded from the analyses.
– 27 items were eliminated through this process
– The final questionnaire was constituted by 110 items (plus 5 control questions)
Confirmatory Factor Analysis
22
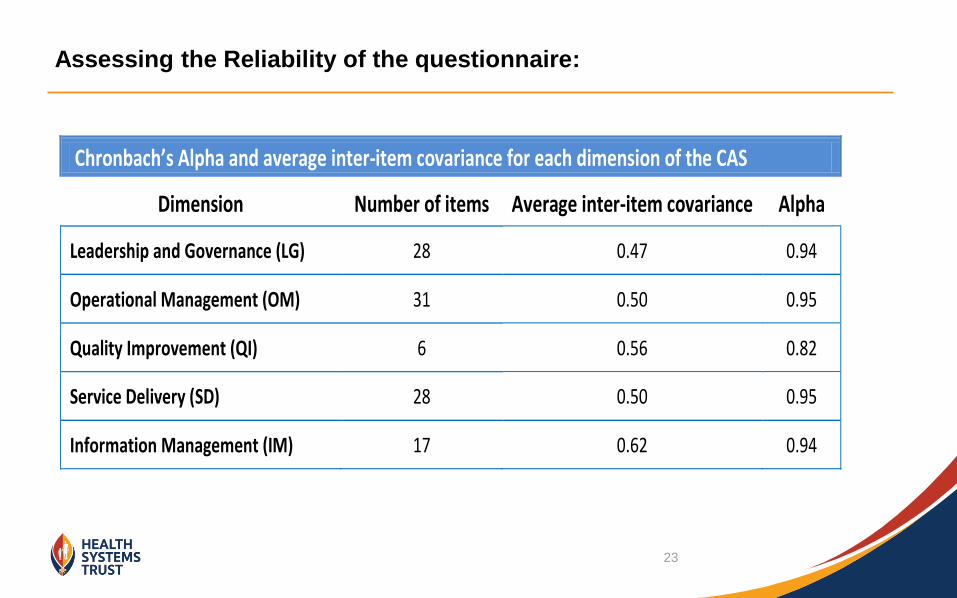
Assessing the Reliability of the questionnaire:
Chronbach’s Alpha and average inter-item covariance for each dimension of the CAS
Dimension Number of items Average inter-item covariance Alpha
Leadership and Governance (LG) 28 0.47 0.94
Operational Management (OM) 31 0.50 0.95
Quality Improvement (QI) 6 0.56 0.82
Service Delivery (SD) 28 0.50 0.95
Information Management (IM) 17 0.62 0.94
23
Pilot: Demographic data;
results of administering the
questionnaire
24
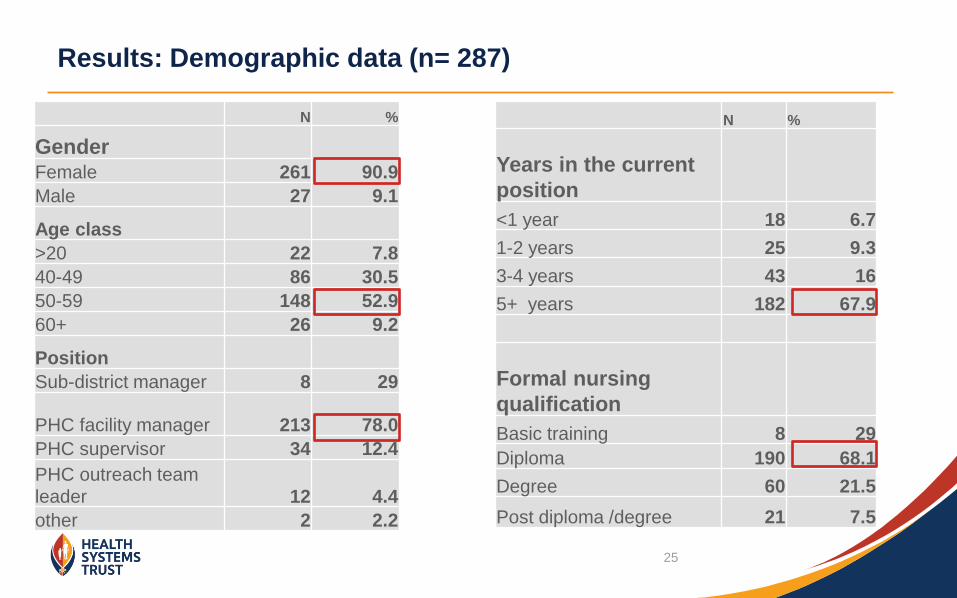
Results: Demographic data (n= 287)
N %
Years in the current
position
<1 year 18 6.7
1-2 years 25 9.3
3-4 years 43 16
5+ years 182 67.9
Formal nursing
qualification
Basic training 8 29
Diploma 190 68.1
Degree 60 21.5
Post diploma /degree 21 7.5
N %
Gender
Female 261 90.9
Male 27 9.1
Age class
>20 22 7.8
40-49 86 30.5
50-59 148 52.9
60+ 26 9.2
Position
Sub-district manager 8 29
PHC facility manager 213 78.0
PHC supervisor 34 12.4
PHC outreach team
leader 12 4.4
other 2 2.2
25
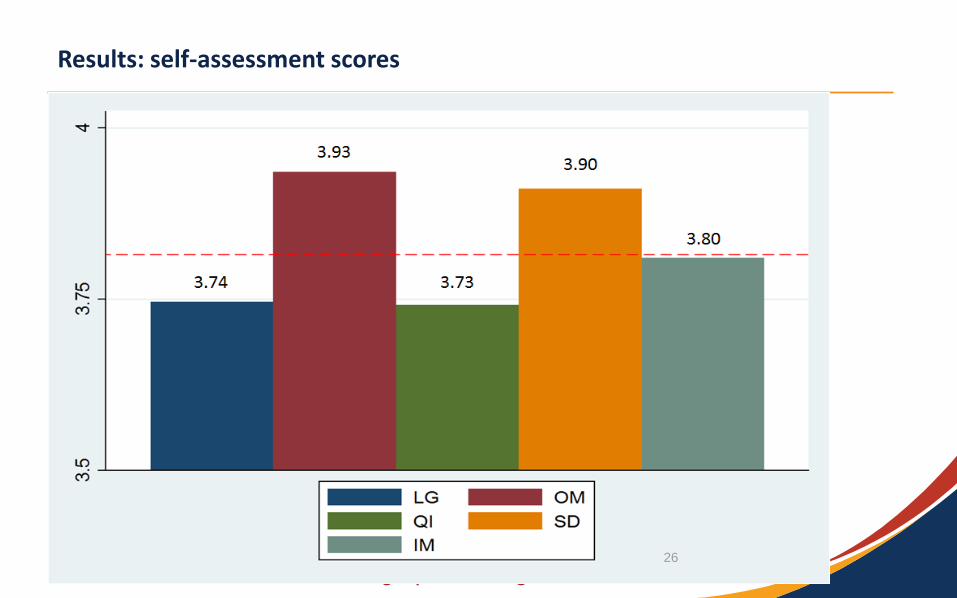
Results: self-assessment scores
Put numbers in the graph, average score 26
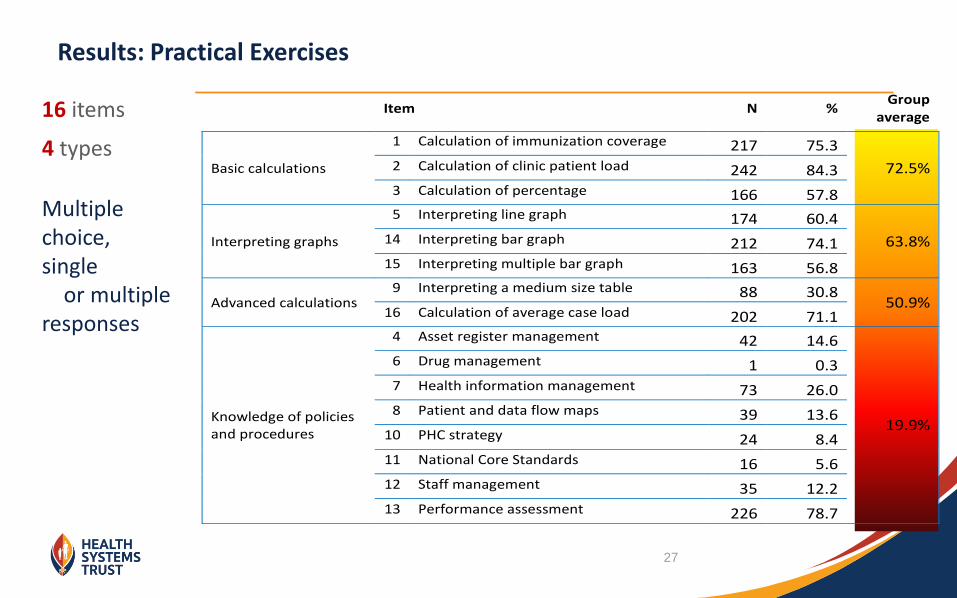
Results: Practical Exercises
Item N % Group
average
Basic calculations
1 Calculation of immunization coverage 217 75.3
72.5% 2 Calculation of clinic patient load 242 84.3 3 Calculation of percentage 166 57.8
Interpreting graphs
5 Interpreting line graph 174 60.4
63.8% 14 Interpreting bar graph 212 74.1 15 Interpreting multiple bar graph 163 56.8
Advanced calculations 9 Interpreting a medium size table 88 30.8
50.9% 16 Calculation of average case load 202 71.1
Knowledge of policies and procedures
4 Asset register management 42 14.6
19.9%
6 Drug management 1 0.3 7 Health information management 73 26.0 8 Patient and data flow maps 39 13.6
10 PHC strategy 24 8.4 11 National Core Standards 16 5.6 12 Staff management 35 12.2 13 Performance assessment 226 78.7
16 items
4 types
Multiple choice, single or multiple responses
27
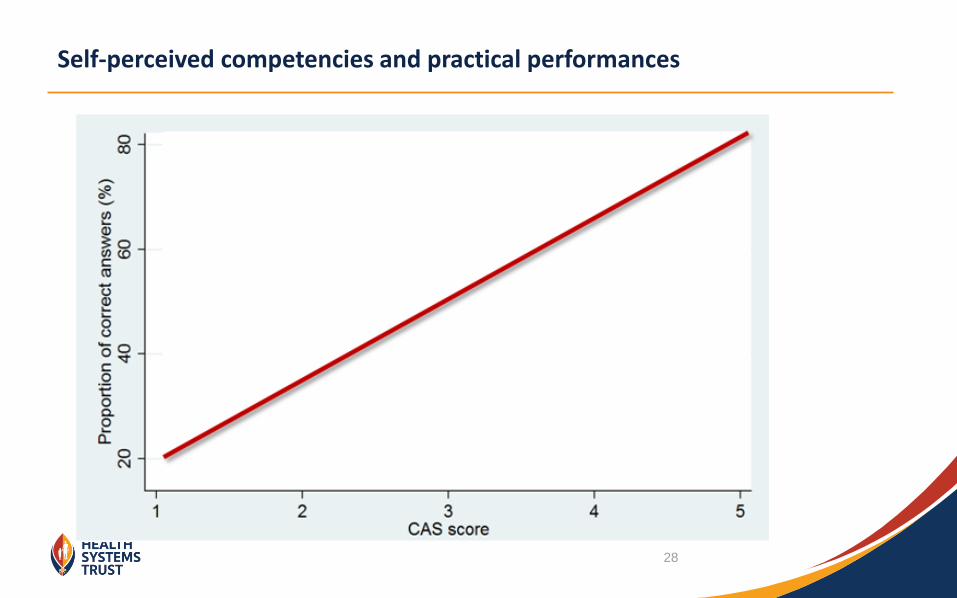
Self-perceived competencies and practical performances
28
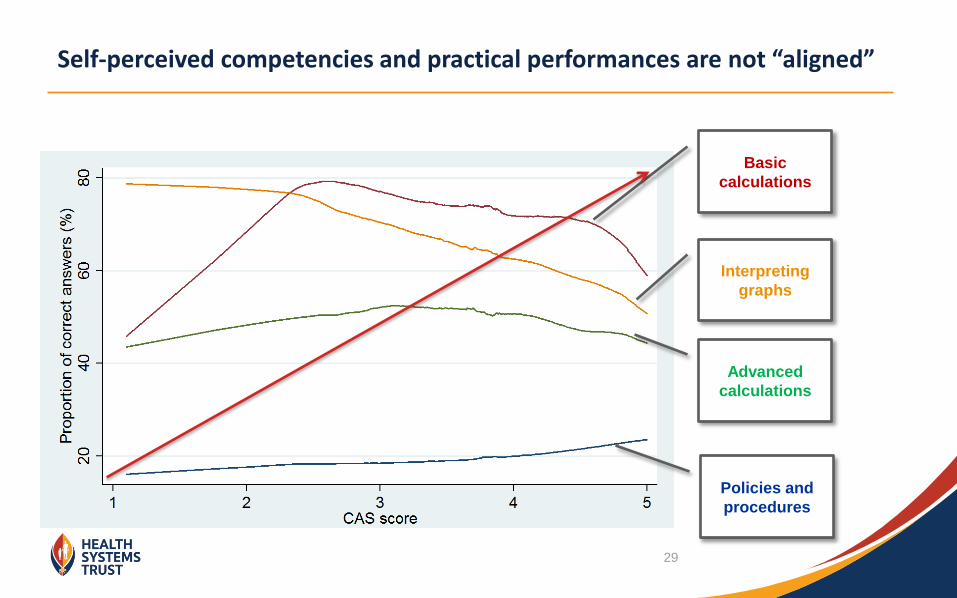
Self-perceived competencies and practical performances are not “aligned”
Basic
calculations
Interpreting
graphs
Advanced
calculations
Policies and
procedures
29
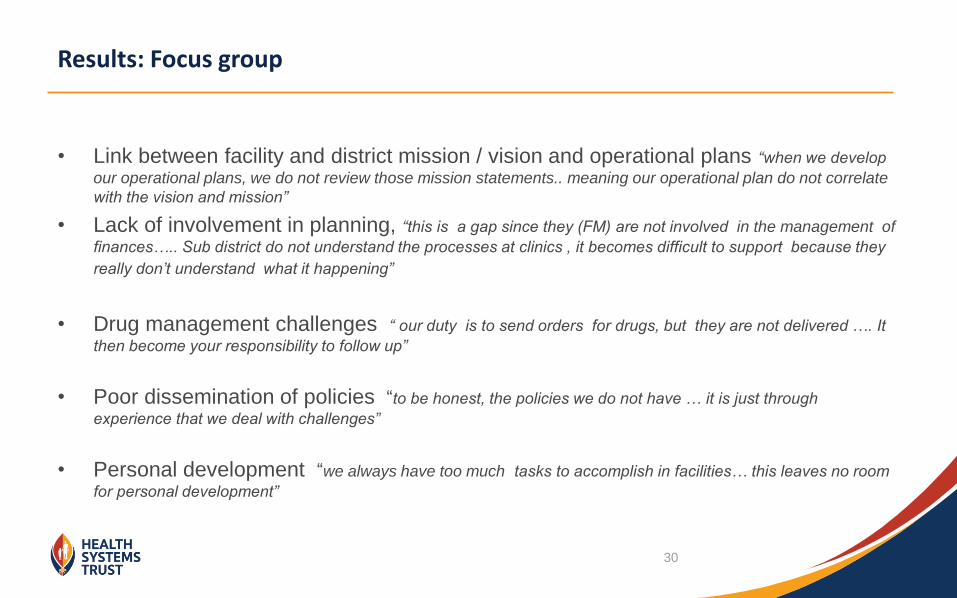
Results: Focus group
• Link between facility and district mission / vision and operational plans “when we develop
our operational plans, we do not review those mission statements.. meaning our operational plan do not correlate
with the vision and mission”
• Lack of involvement in planning, “this is a gap since they (FM) are not involved in the management of
finances….. Sub district do not understand the processes at clinics , it becomes difficult to support because they
really don’t understand what it happening”
• Drug management challenges “ our duty is to send orders for drugs, but they are not delivered …. It
then become your responsibility to follow up”
• Poor dissemination of policies “to be honest, the policies we do not have … it is just through
experience that we deal with challenges”
• Personal development “we always have too much tasks to accomplish in facilities… this leaves no room
for personal development”
30
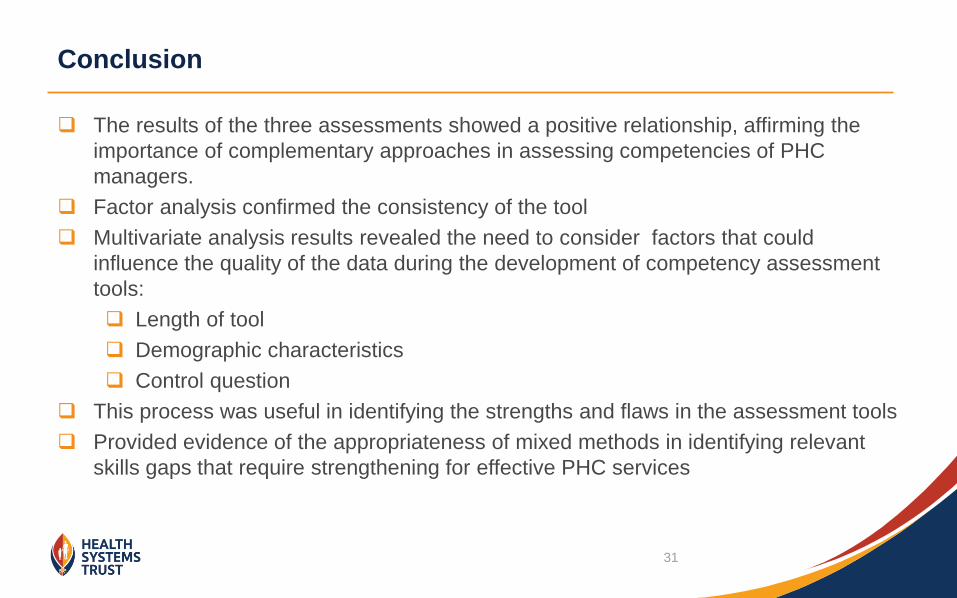
Conclusion
The results of the three assessments showed a positive relationship, affirming the
importance of complementary approaches in assessing competencies of PHC
managers.
Factor analysis confirmed the consistency of the tool
Multivariate analysis results revealed the need to consider factors that could
influence the quality of the data during the development of competency assessment
tools:
Length of tool
Demographic characteristics
Control question
This process was useful in identifying the strengths and flaws in the assessment tools
Provided evidence of the appropriateness of mixed methods in identifying relevant
skills gaps that require strengthening for effective PHC services
31
Acknowledgements:
Project team: Iris Cupido, Linda Mureithi, Jessica Phillips, Taurai Chikotie, Patrick Madhlopa,
Carmen Sisam and Naomi Massyn
Contact Details:
Rhulane Madale
E-Mail: [email protected]
Website: www.hst.org.za
Thank you
32


