TSX:P | NYSE:PPP
TSX:P | NYSE:PPP
This presentation may contain “forward-looking” statements within the meaning of Canadian securities legislation and the United States Private Securities Litigation Reform Act of 1995. Forward-looking statements relate to future events or the anticipated performance of the Company and reflect management’s expectations or beliefs regarding such future events and anticipated performance. In certain cases, forward-looking statements can be identified by the use of words such as “plans”, “expects”, “is expected”, “budget”, “scheduled”, ”estimates”, ”forecasts”, ”intends”, ”anticipates” or “believes”, or variations of such words and phrases or statements that certain actions, events or results “may”, ”could”, “would”, ”might”, or “will be taken”, “occur” or “be achieved”, or the negative of these words or comparable terminology. By their very nature forward-looking statements involve known and unknown risks, uncertainties and other factors which may cause the actual performance of the Company to be materially different from any anticipated performance expressed or implied by the forward-looking statements. Such factors include various risks related to the Company’s operations, including, without limitation, fluctuations in spot and forward markets for gold, silver and other metals, fluctuations in currency markets, changes in national and local governments in Mexico and the speculative nature of mineral exploration and development, risks associated with obtaining necessary exploitation and environmental licenses and permits, and the presence of laws that may impose restrictions on mining. A complete list of risk factors are described in the Company’s annual information form and will be detailed from time to time in the Company’s continuous disclosure, all of which are, or will be available, for review on SEDAR at www.sedar.com. This presentation uses the terms “measured resources”, “indicated resources” and “inferred resources”. The Company advises readers that although these terms are recognized and required by Canadian regulations (under National Instrument 43-101 Standards of Disclosure for Mineral Projects (“NI43-101”)), the United States Securities and Exchange Commission does not recognize them. Readers are cautioned not to assume that any part or all of the mineral deposits in these categories will ever be converted in to reserves. In addition, “inferred resources” have a great amount of uncertainty as to their existence, and economic and legal feasibility. It cannot be assumed that all or any part of an inferred mineral resource will ever be upgraded to a higher category. Under Canadian rules, estimates of inferred mineral resources may not form the basis of feasibility or pre-feasibility studies, or economic studies, except for a Preliminary Assessment as defined under NI43-101. Investors are cautioned not to assume that part or all of an inferred resource exists, or is economically or legally mineable. Although the Company has attempted to identify important factors that could cause actual performance to differ materially from that described in forward-looking statements, there may be other factors that cause its performance not to be as anticipated. The Company neither intends nor assumes any obligation to update these forward-looking statements or information to reflect changes in assumptions or circumstances other than required by applicable law. There can be no assurance that forward-looking statements will prove to be accurate, as actual results and future events could differ materially from those currently anticipated. Accordingly, readers should not place undue reliance on forward-looking statements. Unless otherwise indicated, all dollar values herein are in US$.
2
TSX:P | NYSE:PPP
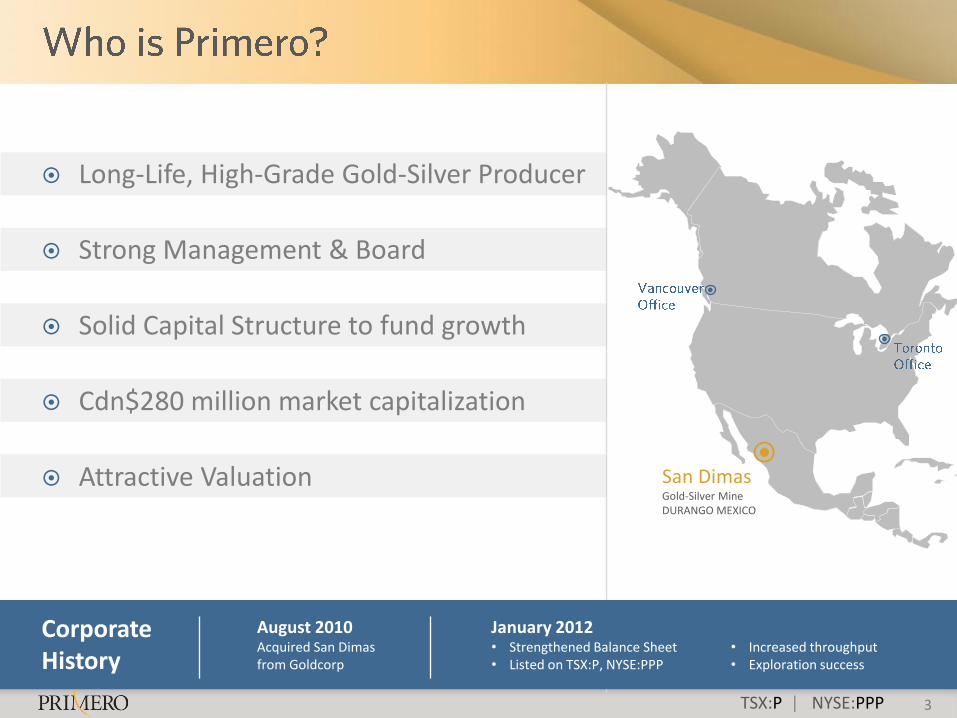
Long-Life, High-Grade Gold-Silver Producer
Strong Management & Board
Solid Capital Structure to fund growth
Cdn$280 million market capitalization
Attractive Valuation
Corporate History
August 2010 Acquired San Dimas from Goldcorp
January 2012 • Strengthened Balance Sheet • Listed on TSX:P, NYSE:PPP
• Increased throughput • Exploration success
San Dimas Gold-Silver Mine DURANGO MEXICO
3
TSX:P | NYSE:PPP
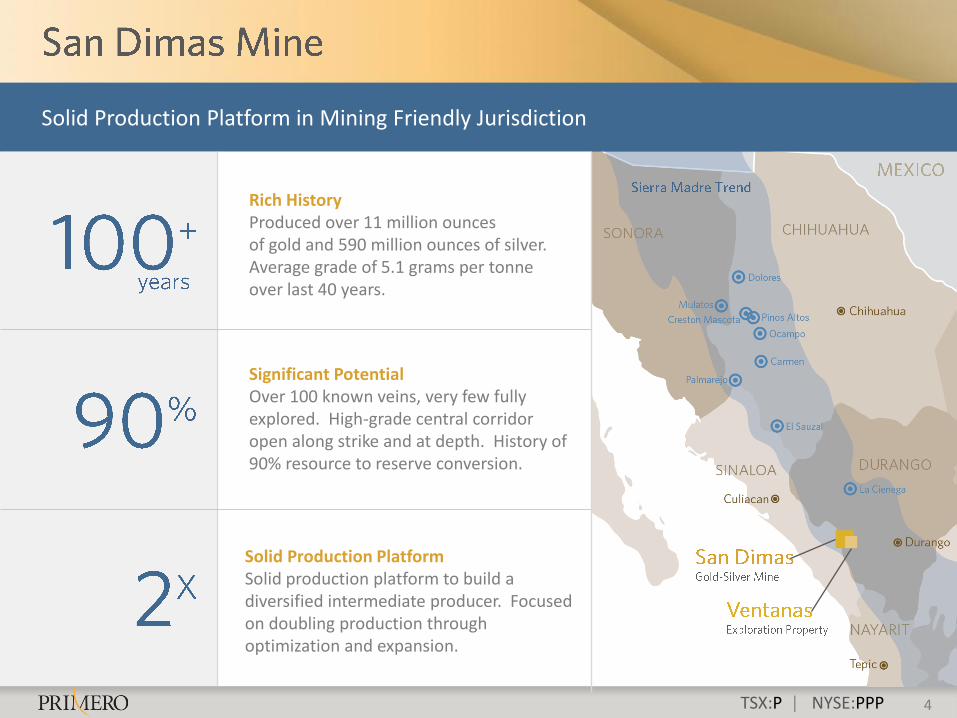
Solid Production Platform in Mining Friendly Jurisdiction
4
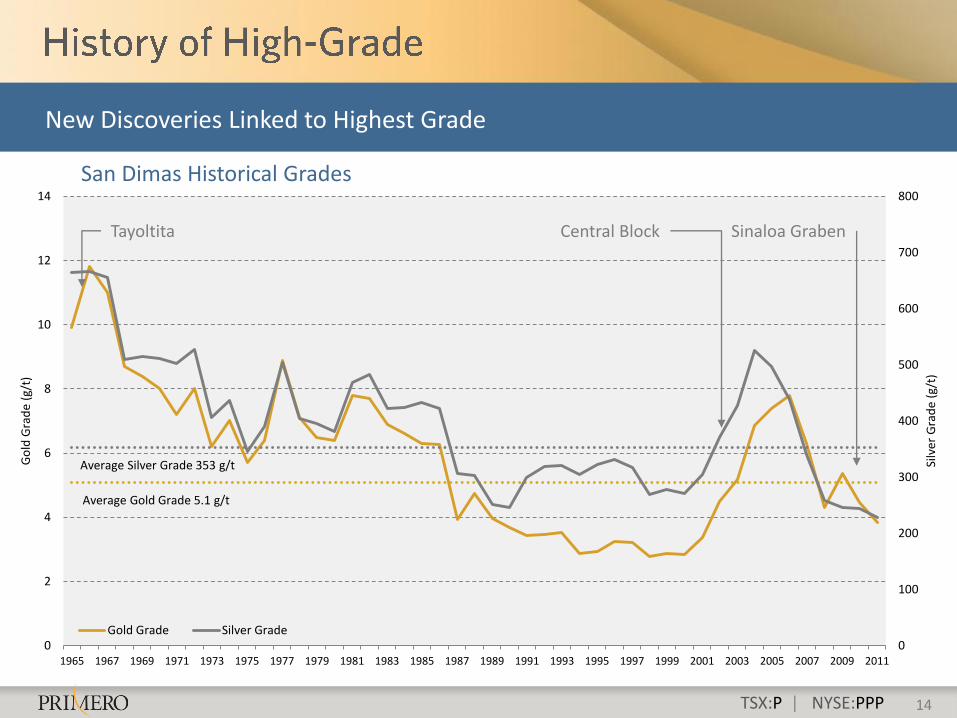
Rich History Produced over 11 million ounces of gold and 590 million ounces of silver. Average grade of 5.1 grams per tonne over last 40 years.
Solid Production Platform Solid production platform to build a diversified intermediate producer. Focused on doubling production through optimization and expansion.
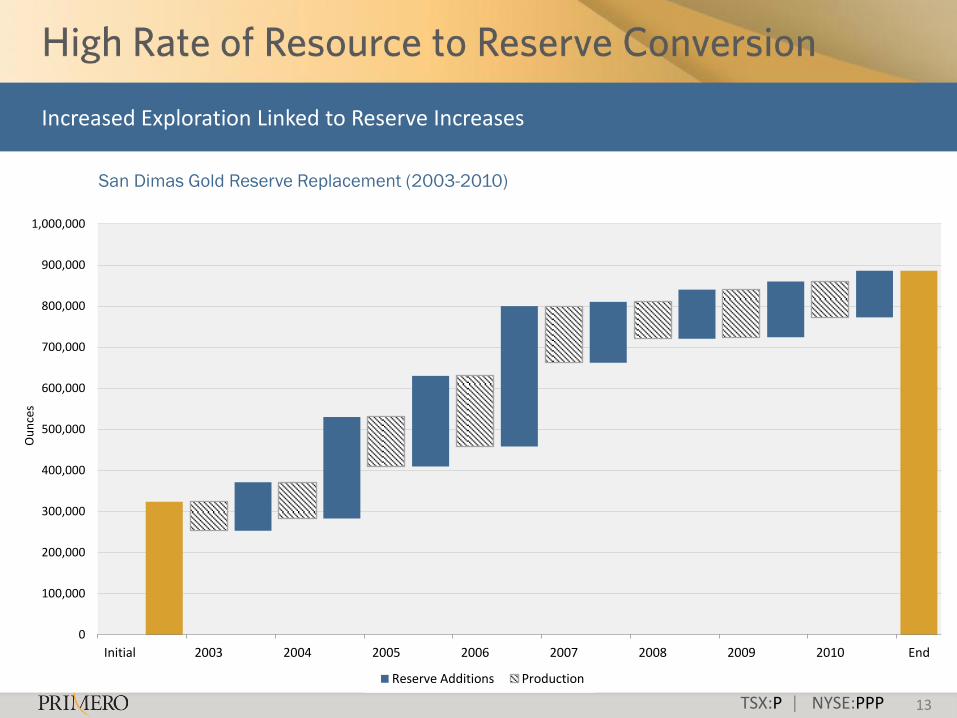
Significant Potential Over 100 known veins, very few fully explored. High-grade central corridor open along strike and at depth. History of 90% resource to reserve conversion.
TSX:P | NYSE:PPP 5 TSX:P | NYSE:PPP
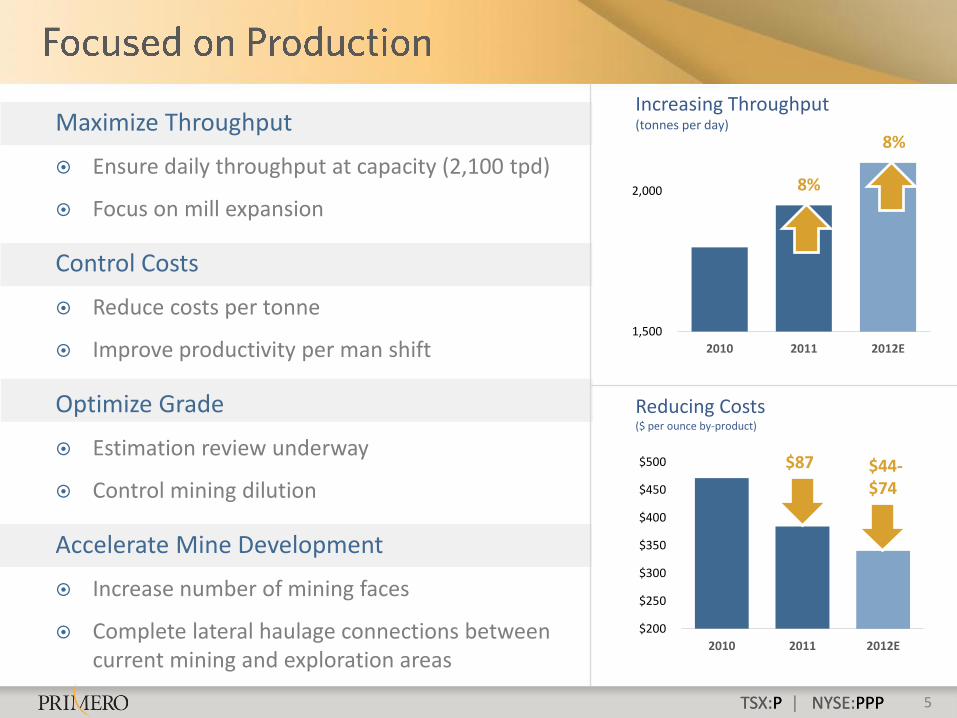
Maximize Throughput
Ensure daily throughput at capacity (2,100 tpd)
Focus on mill expansion
Control Costs
Reduce costs per tonne
Improve productivity per man shift
Optimize Grade
Estimation review underway
Control mining dilution
Accelerate Mine Development
Increase number of mining faces
Complete lateral haulage connections between current mining and exploration areas
1,500
2,000
2010 2011 2012E
Increasing Throughput (tonnes per day)
$200
$250
$300
$350
$400
$450
$500
2010 2011 2012E
8%
8%
$87 $44-$74
Reducing Costs ($ per ounce by-product)
TSX:P | NYSE:PPP
EXPLORATION
OPTIMIZATION
ACQUISITIONS
6 TSX:P | NYSE:PPP
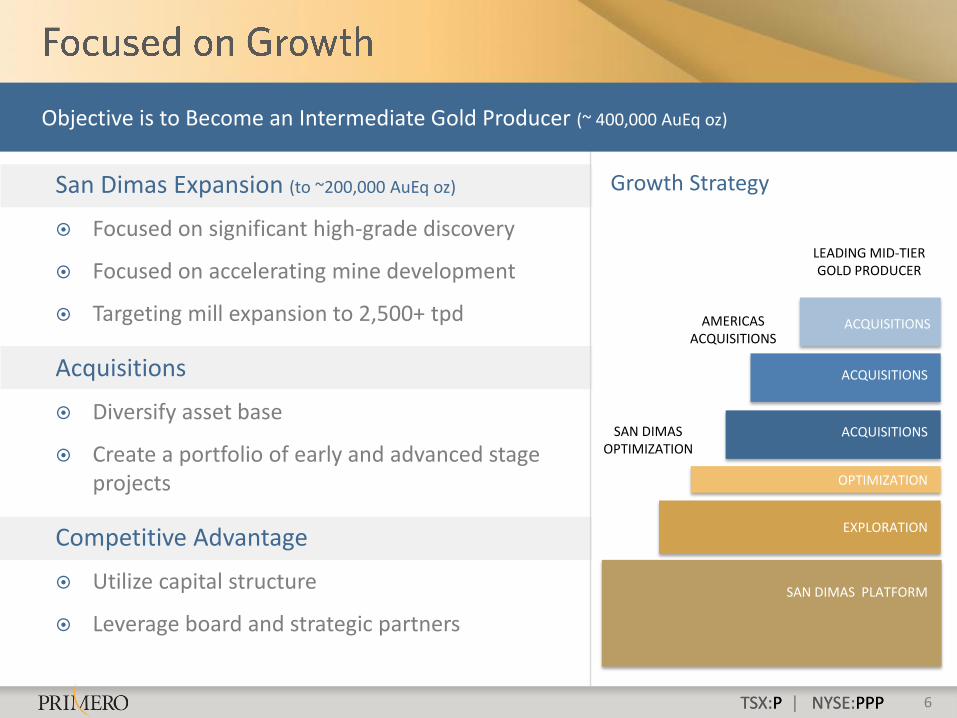
San Dimas Expansion (to ~200,000 AuEq oz)
Focused on significant high-grade discovery
Focused on accelerating mine development
Targeting mill expansion to 2,500+ tpd
Acquisitions
Diversify asset base
Create a portfolio of early and advanced stage projects
Competitive Advantage
Utilize capital structure
Leverage board and strategic partners
Objective is to Become an Intermediate Gold Producer (~ 400,000 AuEq oz)
SAN DIMAS PLATFORM
Growth Strategy
ACQUISITIONS
ACQUISITIONS
SAN DIMAS OPTIMIZATION
AMERICAS ACQUISITIONS
LEADING MID-TIER GOLD PRODUCER
TSX:P | NYSE:PPP
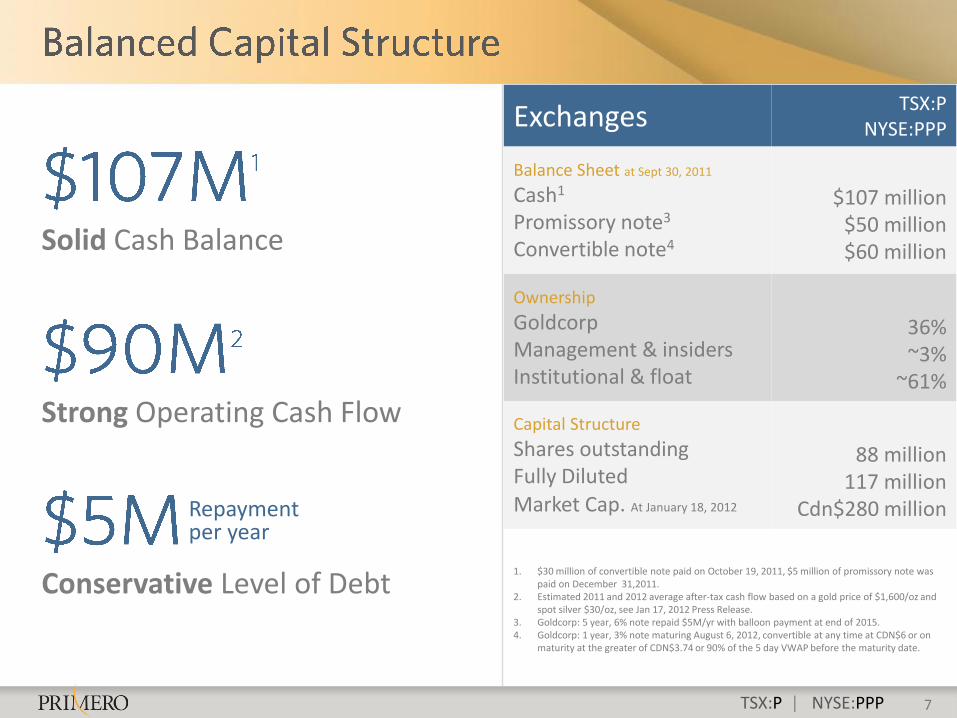
Exchanges TSX:P
NYSE:PPP
Balance Sheet at Sept 30, 2011
Cash1
Promissory note3 Convertible note4
$107 million
$50 million
$60 million
Ownership
Goldcorp Management & insiders Institutional & float
36% ~3%
~61%
Capital Structure
Shares outstanding Fully Diluted Market Cap. At January 18, 2012
88 million
117 million Cdn$280 million
1. $30 million of convertible note paid on October 19, 2011, $5 million of promissory note was paid on December 31,2011.
2. Estimated 2011 and 2012 average after-tax cash flow based on a gold price of $1,600/oz and spot silver $30/oz, see Jan 17, 2012 Press Release.
3. Goldcorp: 5 year, 6% note repaid $5M/yr with balloon payment at end of 2015. 4. Goldcorp: 1 year, 3% note maturing August 6, 2012, convertible at any time at CDN$6 or on
maturity at the greater of CDN$3.74 or 90% of the 5 day VWAP before the maturity date.
Solid Cash Balance
Strong Operating Cash Flow
Conservative Level of Debt
Repayment per year
7
TSX:P | NYSE:PPP
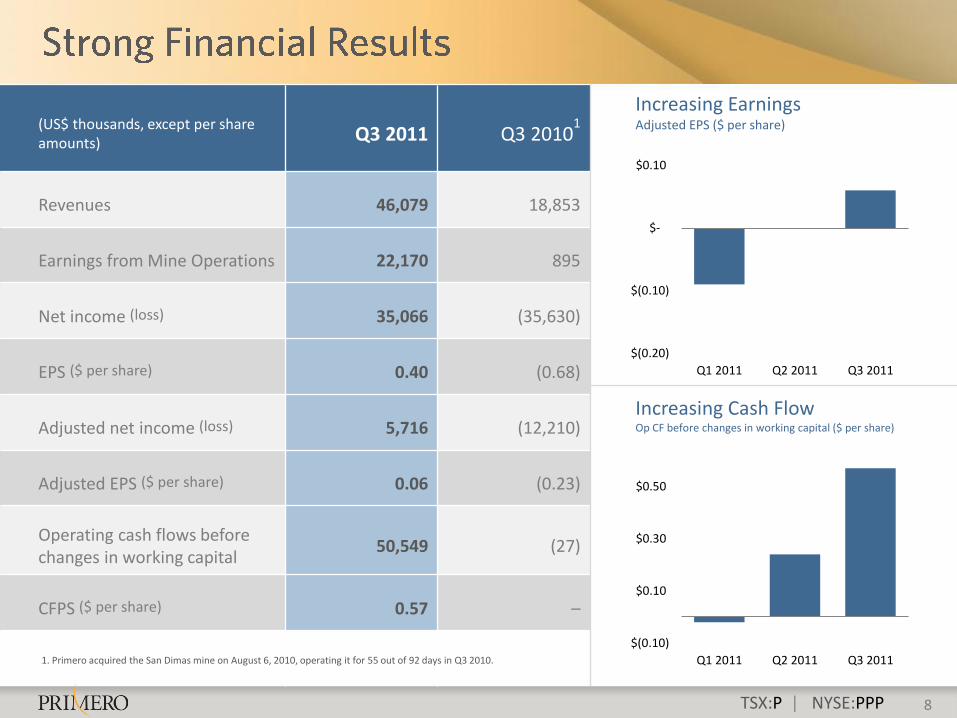
(US$ thousands, except per share amounts) Q3 2011 Q3 2010
1
Revenues 46,079 18,853
Earnings from Mine Operations 22,170 895
Net income (loss) 35,066 (35,630)
EPS ($ per share) 0.40 (0.68)
Adjusted net income (loss) 5,716 (12,210)
Adjusted EPS ($ per share) 0.06 (0.23)
Operating cash flows before changes in working capital
50,549 (27)
CFPS ($ per share) 0.57 –
$(0.20)
$(0.10)
$-
$0.10
Q1 2011 Q2 2011 Q3 2011
$(0.10)
$0.10
$0.30
$0.50
Q1 2011 Q2 2011 Q3 20111. Primero acquired the San Dimas mine on August 6, 2010, operating it for 55 out of 92 days in Q3 2010.
Increasing Earnings Adjusted EPS ($ per share)
Increasing Cash Flow Op CF before changes in working capital ($ per share)
8
TSX:P | NYSE:PPP
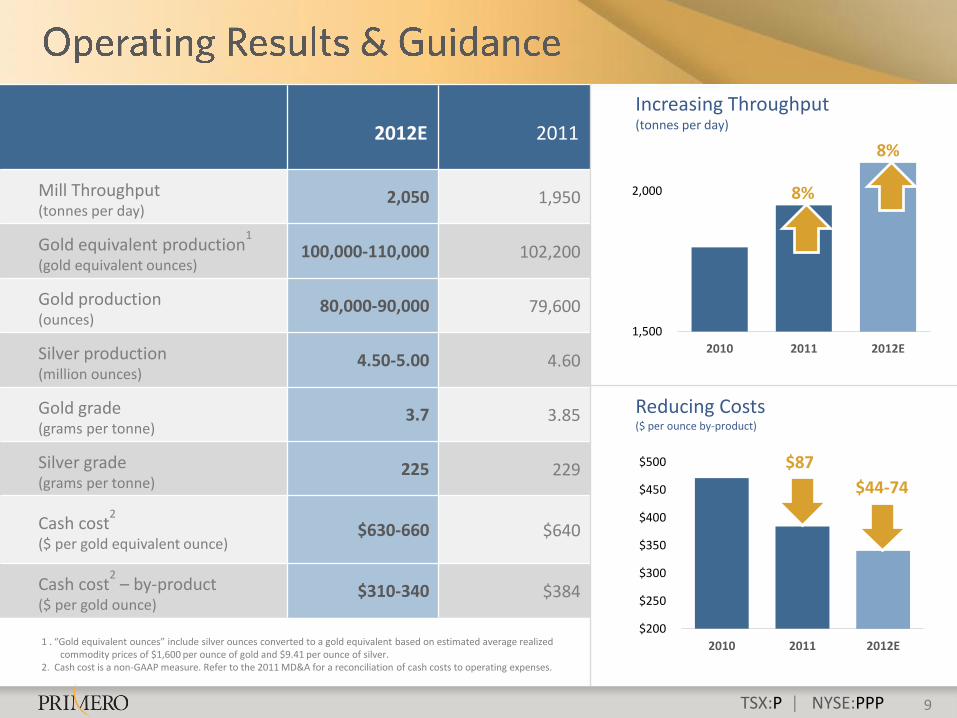
2012E 2011
Mill Throughput (tonnes per day)
2,050 1,950
Gold equivalent production1
(gold equivalent ounces) 100,000-110,000 102,200
Gold production (ounces)
80,000-90,000 79,600
Silver production (million ounces)
4.50-5.00 4.60
Gold grade (grams per tonne)
3.7 3.85
Silver grade (grams per tonne)
225 229
Cash cost2
($ per gold equivalent ounce) $630-660 $640
Cash cost2 – by-product
($ per gold ounce) $310-340 $384
1 . “Gold equivalent ounces” include silver ounces converted to a gold equivalent based on estimated average realized commodity prices of $1,600 per ounce of gold and $9.41 per ounce of silver.
2. Cash cost is a non-GAAP measure. Refer to the 2011 MD&A for a reconciliation of cash costs to operating expenses.
9
1,500
2,000
2010 2011 2012E
Increasing Throughput (tonnes per day)
$200
$250
$300
$350
$400
$450
$500
2010 2011 2012E
8%
8%
$87
$44-74
Reducing Costs ($ per ounce by-product)
TSX:P | NYSE:PPP
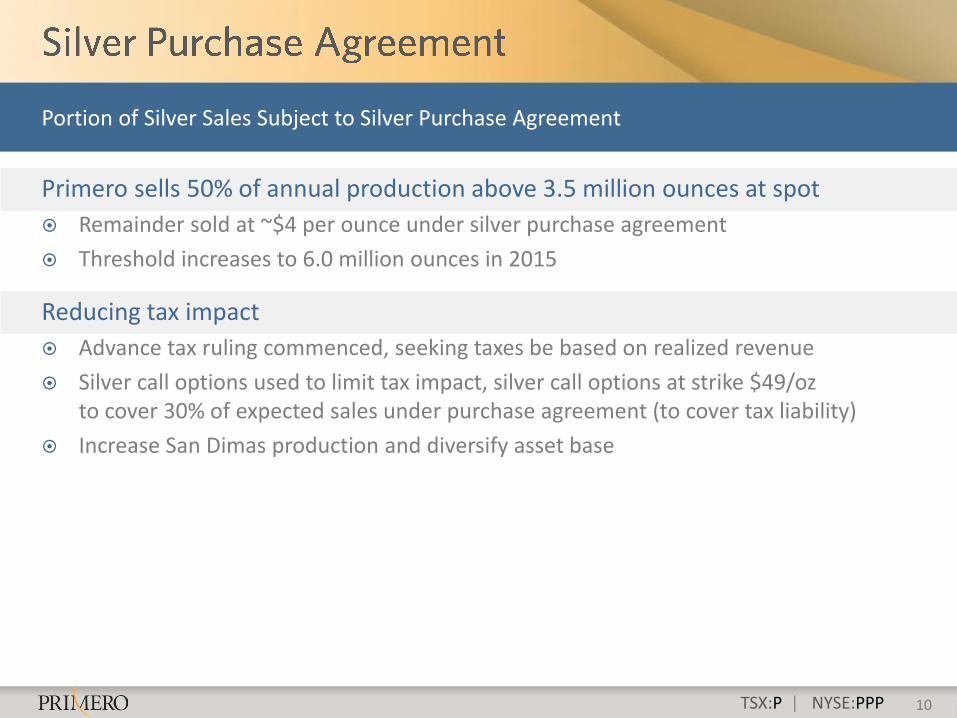
Primero sells 50% of annual production above 3.5 million ounces at spot
Remainder sold at ~$4 per ounce under silver purchase agreement
Threshold increases to 6.0 million ounces in 2015
Reducing tax impact
Advance tax ruling commenced, seeking taxes be based on realized revenue
Silver call options used to limit tax impact, silver call options at strike $49/oz to cover 30% of expected sales under purchase agreement (to cover tax liability)
Increase San Dimas production and diversify asset base
10
Portion of Silver Sales Subject to Silver Purchase Agreement
TSX:P | NYSE:PPP
TSX:P | NYSE:PPP 12
-
100
200
300
400
500
600
700
800
900
1,000
Tho
usa
nd
s O
un
ces
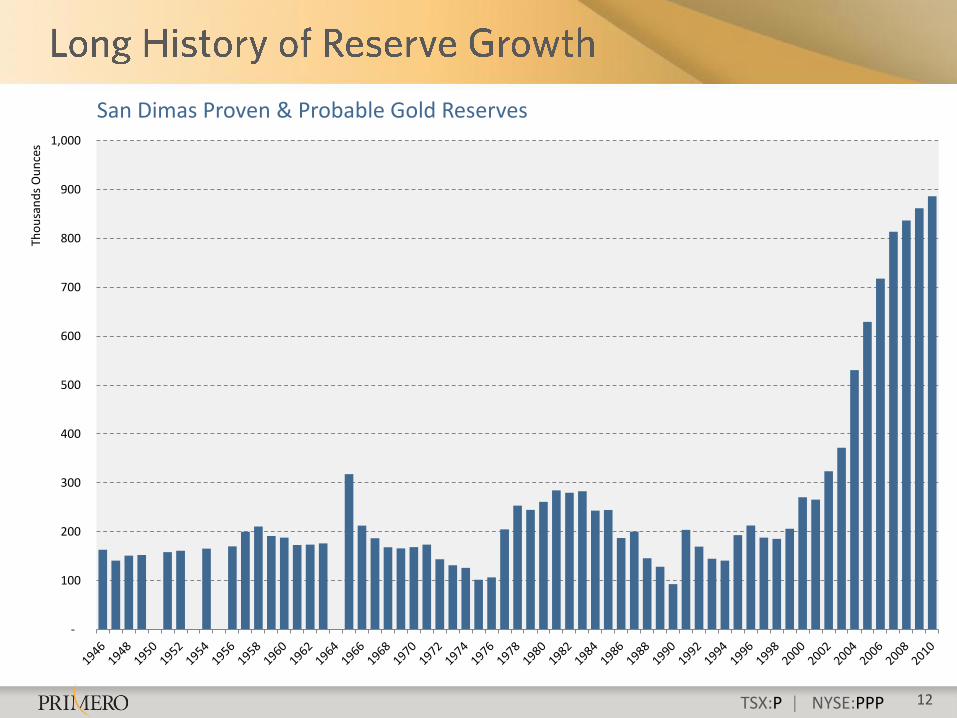
San Dimas Proven & Probable Gold Reserves
TSX:P | NYSE:PPP 13
Increased Exploration Linked to Reserve Increases
0
100,000
200,000
300,000
400,000
500,000
600,000
700,000
800,000
900,000
1,000,000
Initial 2003 2004 2005 2006 2007 2008 2009 2010 End
Ou
nce
s
San Dimas Gold Reserve Replacement (2003-2010)
Reserve Additions Production
TSX:P | NYSE:PPP 14
0
100
200
300
400
500
600
700
800
0
2
4
6
8
10
12
14
1965 1967 1969 1971 1973 1975 1977 1979 1981 1983 1985 1987 1989 1991 1993 1995 1997 1999 2001 2003 2005 2007 2009 2011
Silv
er G
rad
e (g
/t)
Go
ld G
rad
e (g
/t)
Gold Grade Silver Grade
New Discoveries Linked to Highest Grade
Average Gold Grade 5.1 g/t
Average Silver Grade 353 g/t
Tayoltita Sinaloa Graben Central Block
San Dimas Historical Grades
TSX:P | NYSE:PPP
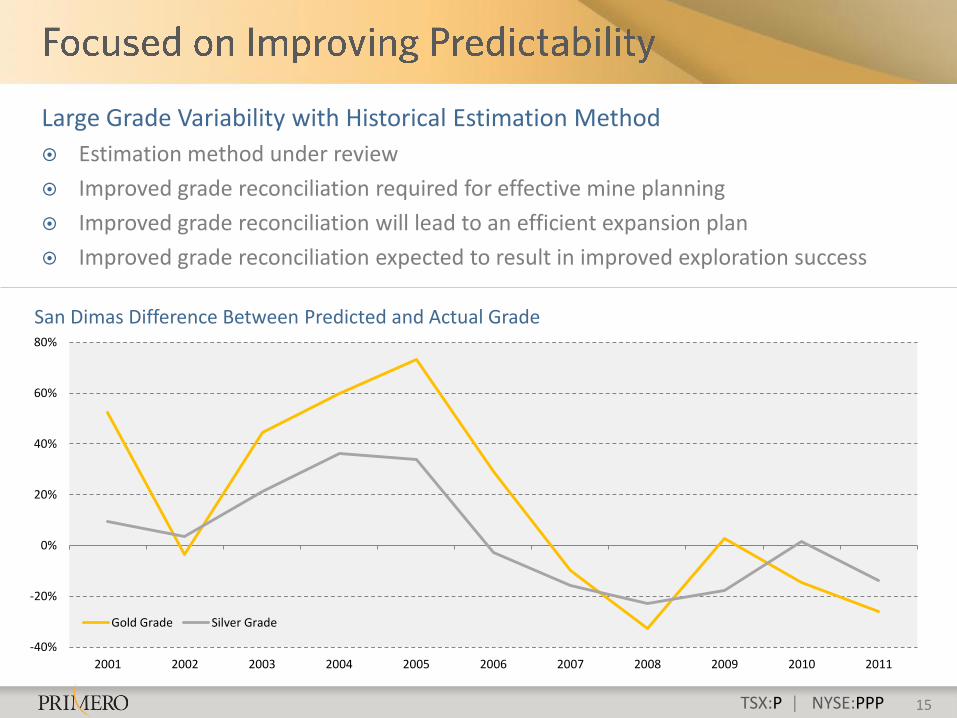
Large Grade Variability with Historical Estimation Method
Estimation method under review
Improved grade reconciliation required for effective mine planning
Improved grade reconciliation will lead to an efficient expansion plan
Improved grade reconciliation expected to result in improved exploration success
San Dimas Difference Between Predicted and Actual Grade
15
-40%
-20%
0%
20%
40%
60%
80%
2001 2002 2003 2004 2005 2006 2007 2008 2009 2010 2011
Gold Grade Silver Grade
TSX:P | NYSE:PPP
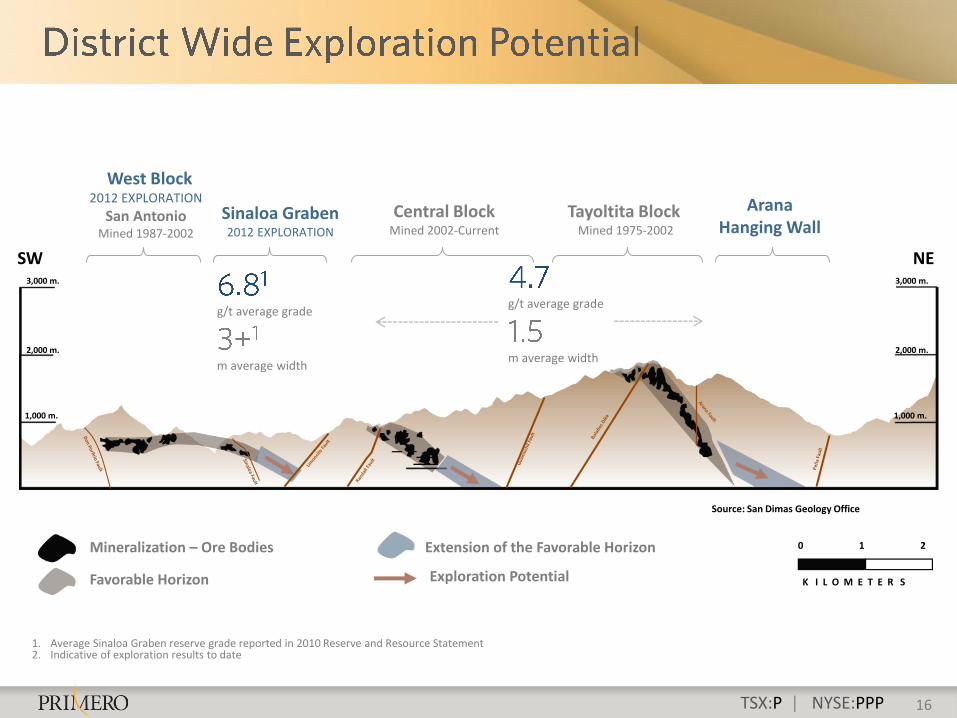
g/t average grade
m average width
g/t average grade
m average width
1. Average Sinaloa Graben reserve grade reported in 2010 Reserve and Resource Statement 2. Indicative of exploration results to date
Favorable Horizon
Mineralization – Ore Bodies Extension of the Favorable Horizon
Exploration Potential
SW
0 1 2
K I L O M E T E R S
West Block 2012 EXPLORATION
San Antonio Mined 1987-2002
Central Block Mined 2002-Current
Tayoltita Block Mined 1975-2002
Arana Hanging Wall
2,000 m.
1,000 m.
Sinaloa Graben 2012 EXPLORATION
Source: San Dimas Geology Office
3,000 m.
NE
2,000 m.
1,000 m.
3,000 m.
16
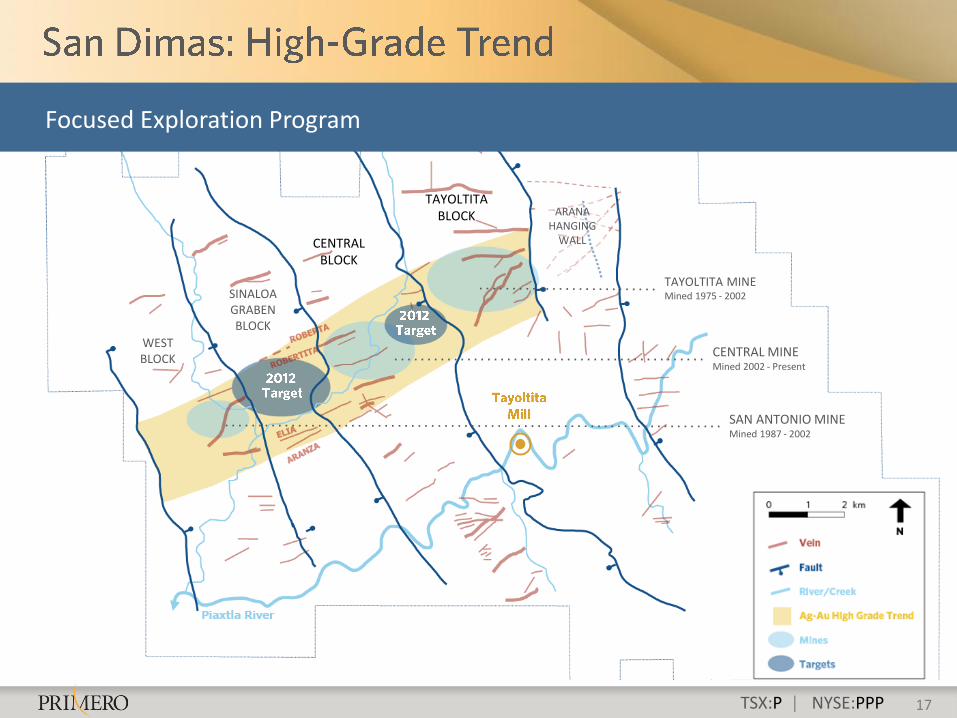
TSX:P | NYSE:PPP 17
TAYOLTITA MINE Mined 1975 - 2002
CENTRAL MINE Mined 2002 - Present
SAN ANTONIO MINE Mined 1987 - 2002
CENTRAL BLOCK
TAYOLTITA BLOCK
SINALOA GRABEN BLOCK
WEST BLOCK
ARANA HANGING
WALL
Focused Exploration Program
TSX:P | NYSE:PPP
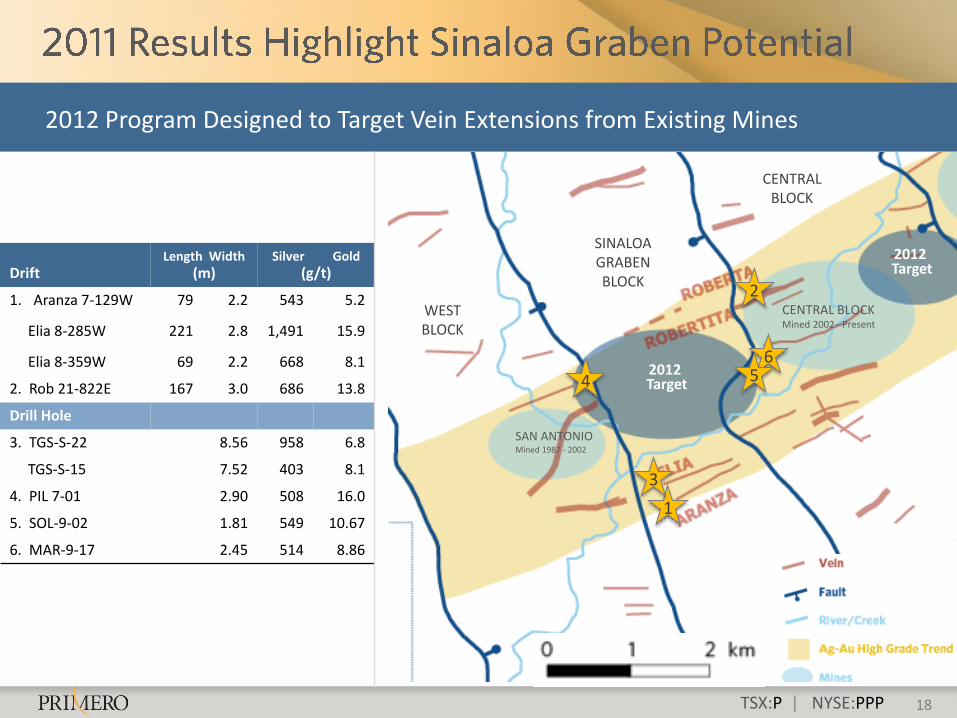
Drift
Length Width (m)
Silver Gold (g/t)
1. Aranza 7-129W 79 2.2 543 5.2
Elia 8-285W 221 2.8 1,491 15.9
Elia 8-359W 69 2.2 668 8.1
2. Rob 21-822E 167 3.0 686 13.8
Drill Hole
3. TGS-S-22 8.56 958 6.8
TGS-S-15 7.52 403 8.1
4. PIL 7-01 2.90 508 16.0
5. SOL-9-02 1.81 549 10.67
6. MAR-9-17 2.45 514 8.86
18
2012 Program Designed to Target Vein Extensions from Existing Mines
1
2
6 5 4
3
2012 Target
2012 Target
CENTRAL BLOCK
SINALOA GRABEN BLOCK
WEST BLOCK
CENTRAL BLOCK Mined 2002 - Present
SAN ANTONIO Mined 1987 - 2002
TSX:P | NYSE:PPP 19
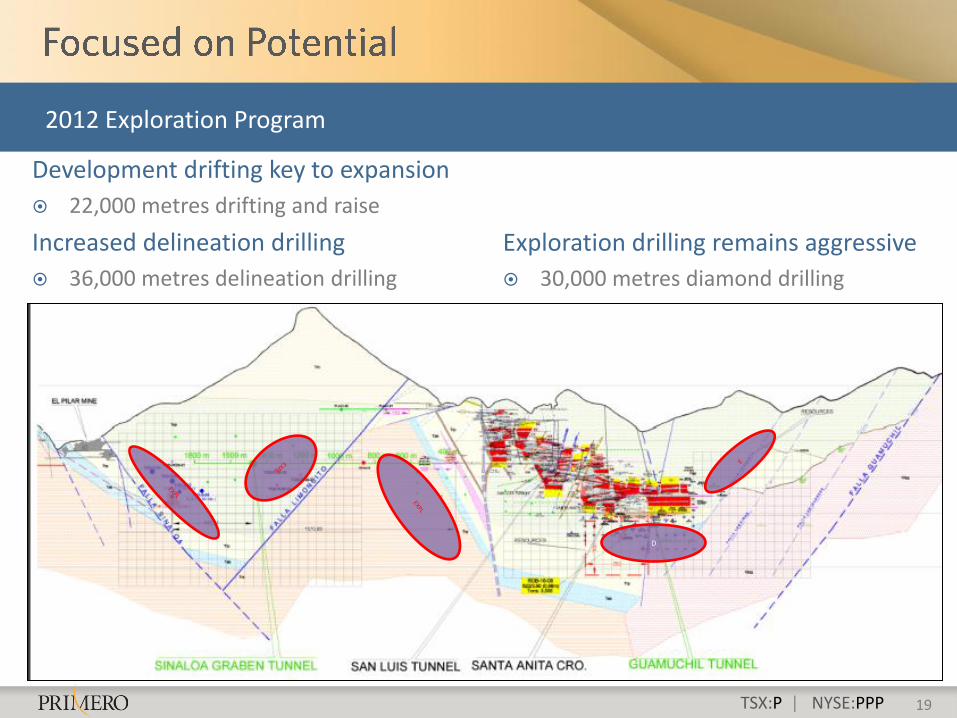
Development drifting key to expansion
22,000 metres drifting and raise
Increased delineation drilling
36,000 metres delineation drilling
D
2012 Exploration Program
Exploration drilling remains aggressive
30,000 metres diamond drilling
TSX:P | NYSE:PPP 20
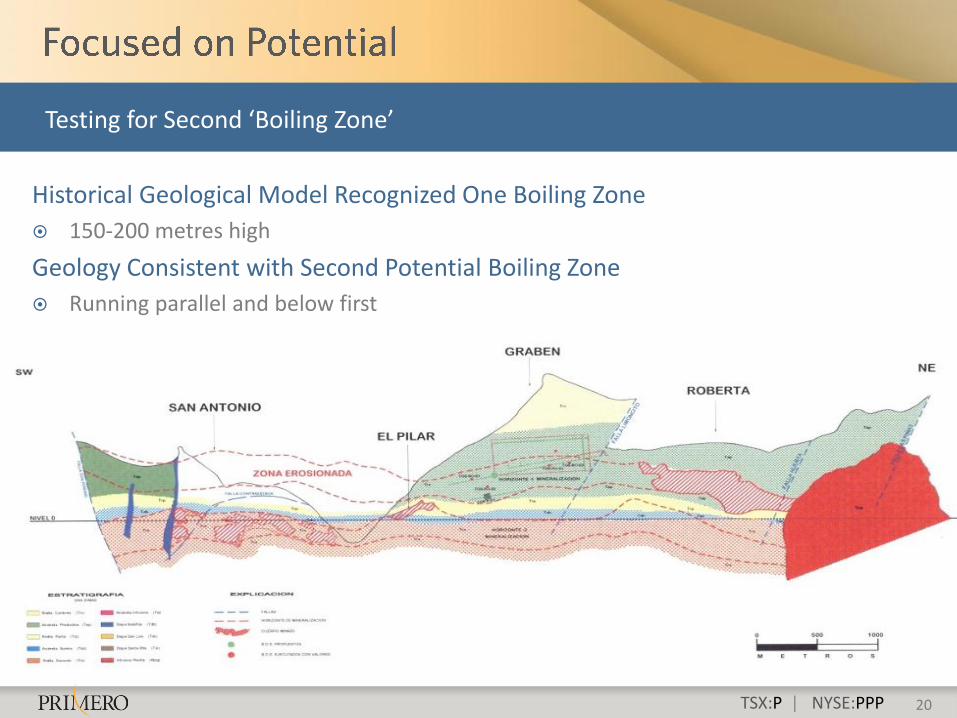
Historical Geological Model Recognized One Boiling Zone
150-200 metres high
Geology Consistent with Second Potential Boiling Zone
Running parallel and below first
Testing for Second ‘Boiling Zone’
TSX:P | NYSE:PPP
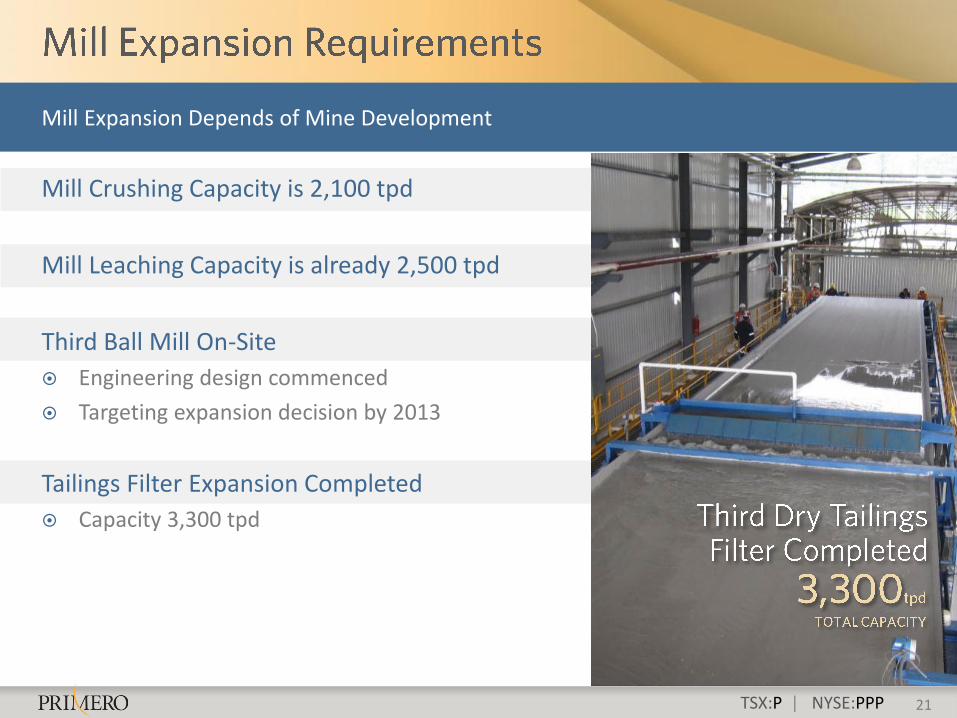
Mill Crushing Capacity is 2,100 tpd
Mill Leaching Capacity is already 2,500 tpd
Third Ball Mill On-Site
Engineering design commenced
Targeting expansion decision by 2013
Tailings Filter Expansion Completed
Capacity 3,300 tpd
21
Mill Expansion Depends of Mine Development
TSX:P | NYSE:PPP
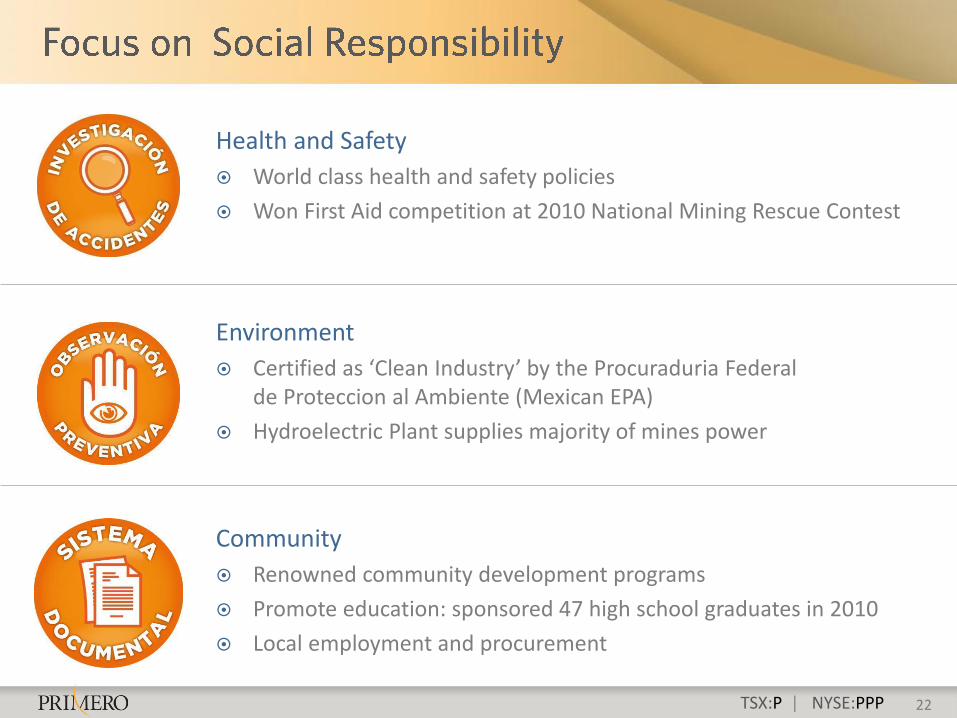
Health and Safety
World class health and safety policies
Won First Aid competition at 2010 National Mining Rescue Contest
Environment
Certified as ‘Clean Industry’ by the Procuraduria Federal de Proteccion al Ambiente (Mexican EPA)
Hydroelectric Plant supplies majority of mines power
Community
Renowned community development programs
Promote education: sponsored 47 high school graduates in 2010
Local employment and procurement
22
TSX:P | NYSE:PPP
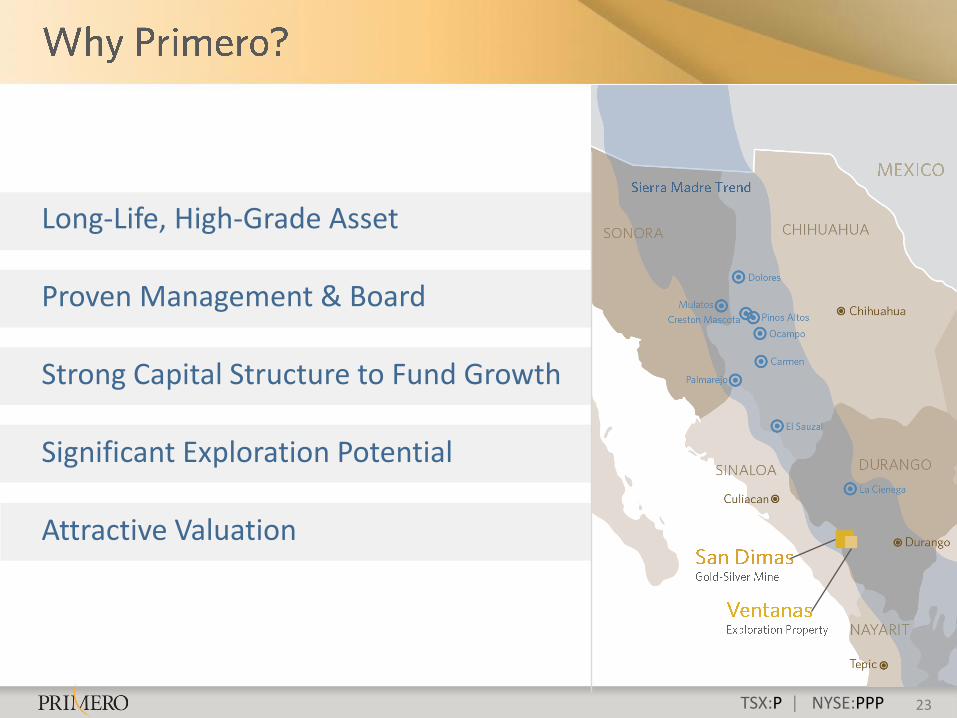
Long-Life, High-Grade Asset
Proven Management & Board
Strong Capital Structure to Fund Growth
Significant Exploration Potential
Attractive Valuation
23