
This work is licensed under a
Creative Commons Attribution-NonCommercial-NoDerivatives 4.0 International licence
Newcastle University ePrints - eprint.ncl.ac.uk
Capano G, Milne CJ, Chergui M, Rothlisberger U, Tavernelli I, Penfold TJ.
Probing Wavepacket Dynamics using Ultrafast X-ray Spectroscopy. Journal of
Physics B 2015, 48(21), 1-11.
Copyright:
©2015 IOP Publishing Ltd. The final version of this article can be found at
http://dx.doi.org/10.1088/0953-4075/48/21/214001
Date deposited:
01/10/2015
Embargo release date:
23 September 2016

Probing Wavepacket Dynamics using Ultrafast
X-ray Spectroscopy
G. Capano1, C.J. Milne2 M. Chergui1, U. Rothlisberger3, I.
Tavernelli4 and T.J. Penfold2
1 Ecole polytechnique Federale de Lausanne, Laboratoire de spectroscopie
ultrarapide, ISIC, FSB, CH-1015 Lausanne, Switzerland
2 SwissFEL, Paul Scherrer Inst, CH-5232 Villigen, Switzerland.
3 Ecole polytechnique Federale de Lausanne, Laboratoire de chimie et biochimie
computationnelles, ISIC, FSB-BSP, CH-1015 Lausanne, Switzerland
4 IBM Research GmbH, Zurich Research Laboratory 8803 Rueschlikon Switzerland.
E-mail: [email protected]
Submitted to: J. Phys. B: At. Mol. Phys.
Probing Wavepacket Dynamics using Ultrafast X-ray Spectroscopy 2
Abstract. The advent of X-ray Free Electron Lasers (X-FELs) is providing new
opportunities for probing the ultrafast excited state dynamics using structurally
sensitive techniques. Herein we use excited state wavepacket dynamics of a
prototypical Cu(I)-phenanthroline complex, [Cu(dmp)2]+ (dmp = 2,9-dimethyl-1,10-
phenanthroline) to investigate how femtosecond vibrational and electronic relaxation is
translated into transient X-ray absorption (XAS) and emission (XES). Using realistic
experimental parameters we also derive the anticipated signal strengths for these
transient features. This indicates that although recording a signal capturing the
strongest transient (i.e. excited state - ground state) changes will be possible for
all cases, only with X-ray Absorption Near-Edge Structure (XANES) and Extended
X-ray Absorption Fine Structure (EXAFS) will it be possible to resolve the fine details
associated with the wavepacket dynamics within realistic experimental acquisition
times.
1. Introduction
Probing ultrafast non-equilibrium dynamics became possible with the advent of ultrafast
time-resolved linear and non-linear optical spectroscopies [1, 2]. However, because
optical spectroscopy consists of transitions between delocalised valence states, the link
between the spectroscopic observable and structure is ambiguous for systems of more
than one nuclear degree of freedom, i.e. >2 atoms. To overcome this, the last decades
have witnessed a significant research effort aimed at exploiting short wavelength probe
pulses to achieve direct structural sensitivity in time-resolved pump-probe experiments.
This has led to the development of time-resolved diffraction methods using X-rays
[3, 4, 5] or electrons [6, 7] and core level spectroscopies using either X-rays [8, 9, 10, 11]
or electrons [12, 13]
For the implementation of time-resolved X-ray spectroscopy, the focus of this
present work, third generation light sources are most suited because of their wide
tuneability, stability and high photon flux. However, for normal operational modes,
the X-ray pulses from these light sources have a temporal width of 50-100 ps.
They are therefore unable to probe the initial ultrafast dynamics that can often
be critical in determining the outcome of non-equilibrium dynamics. While this
can, to a certain extent, be overcome using the laser-slicing scheme [14] which has
been used to demonstrate femtosecond X-ray spectroscopy [15, 16, 17, 18], these
experiments are extremely challenging due to low photon counts. With an X-ray
flux per pulse that is typically 10-11 orders of magnitude higher than the laser-slicing
scheme, X-ray Free electron lasers (X-FELs) [19] offer new perspectives for performing
ultrafast X-ray experiments. Indeed, femtosecond X-ray spectroscopy at X-FELs
has been demonstrated for photoexcited [Fe(bpy)3]2+ [20, 21], [Fe(phen)2(NCS)2][22]
[Fe(C2O4)3]3− [23] and Fe(CO)5 [24].
These studies have been used to shed light into the evolving electronic structure,
changing spin states and overall structural changes occurring after photoexcitation.
However, none of these studies have probed the nuclear wavepacket dynamics, which

Probing Wavepacket Dynamics using Ultrafast X-ray Spectroscopy 3
is commonly elucidated from femtosecond optical spectroscopy [25, 26]. Indeed
directly observing signatures of (coherent) vibrational dynamics, electronic relaxation,
intramolecular energy redistribution and vibrational cooling can shed important insight
into how a particular system dissipates the energy after photoexcitation. Consequently,
the absence of these dynamics in any time-resolved X-ray spectroscopic experiment
reported to date poses a number of questions: i) What is the sensitivity of X-
ray spectroscopic techniques to wavepacket dynamics? ii) What is the measurement
sensitivity and therefore number of photons required to successfully observe these
dynamics? iii) What is the best X-ray spectroscopic technique to observe these
dynamics?
To address these questions, in this paper we use first principles quantum dynamics
simulations [27, 28] of a prototypical Cu(I)-phenanthroline complex, [Cu(dmp)2]+ (dmp
= 2,9-dimethyl-1,10-phenanthroline), initiated after photoexcitation into the optically
bright metal-to-ligand charge-transfer (MLCT) state to investigate how femtosecond
nuclear wavepacket dynamics are reflected in X-ray spectroscopic signals. This is
achieved by studying the Extended X-ray Absorption Fine Structure (EXAFS), pre-edge
X-ray Absorption Near-Edge Structure (XANES), Kα1,2, Kβ1,3 and Kβ2,5 (sometimes
referred to as valence-to-core) X-ray emission (XES) spectra. Subsequently, using
realistic experimental parameters we derive the anticipated signal strengths for these
transient (i.e. excited state - ground state) features. For the present complex, these
simulations show that while recording a signal capturing the strongest transient changes
is possible for each spectroscopic method, only for XANES and EXAFS will it be
possible to resolve the fine details associated with wavepacket dynamics within realistic
experimental acquisition times.
2. Theory and computational details
2.1. Quantum Dynamics of [Cu(dmp)2]+
In this work we derive ultrafast X-ray spectroscopic signals from our recent quantum
dynamics of a prototypical Cu(I)-phenanthroline complex, [Cu(dmp)2]+ [27, 28]. The
ultrafast dynamics of [Cu(dmp)2]+ have previously been well characterised using optical
absorption and emission spectroscopies [29, 30, 31, 32, 33, 34]. The general picture
that emerges from these studies indicates that following photoexcitation, the complex
relaxes into the lowest singlet excited state in ∼100 fs. This is followed by a structural
distortion (flattening of the dihedral angle between the ligands, see Figure 1a), and
intersystem crossing (ISC) to the lowest triplet state T1 [34]. Of particular relevance to
the present work, Tahara and co-workers [32, 33, 34] have demonstrated the presence of
distinct wavepacket dynamics occurring in the excited state. These coherent vibrational
dynamics are dominated by a vibrational mode with frequency 125 cm−1 (period of ∼300
fs), which was assigned to a breathing mode of the complex that causes a symmetric
stretching of the four Cu-N bonds [33].

Probing Wavepacket Dynamics using Ultrafast X-ray Spectroscopy 4
Ground state Lowest 3MLCT
(a) 1.0
0.8
0.6
0.4
0.2
0.0
Popu
latio
n
10008006004002000
Time (fs)
(b) Population S1 Population S2 Population S3 Population T1 Total Triplet Population
Figure 1. (a) DFT (B3LYP)-optimized geometry of the ground state (left) and lowest
triplet state (right) of [Cu(dmp)2]+. (b) Relative diabatic state populations of S1
(blue), S2 (green), S3 (red), T1 (black) and all the triplet (T1-T4) states (purple), for
1 ps following photoexcitation. Figure replotted from ref. [28]
The quantum dynamics used herein are presented in detail in refs [27, 28] and
were performed using the Heidelberg Multi Configuration Time Dependent Hartree
(MCTDH) package [35, 36]. The Hamiltonian was described using the vibronic coupling
model [37]. It included 8 nuclear degrees of freedom, the three lowest singlet states and
the four lowest triplet states [27]. The population kinetics during the first picosecond
after photoexcitation are shown in Figure 1b. After photoexcitation, which populates
the S3 state (red trace, Figure 1b), we observe rapid population decay into the S2 and
S1 states. Due to a degeneracy of these states with the lowest lying triplet states, there
is rapid intersystem crossing into the triplet manifold (purple line) and after 1 ps ∼80%
of the wavepacket is in the triplet states. Of this population, just under half is in the
T1 state. Further details of the quantum dynamics simulations used in this study can
be found in refs [27, 28]
As discussed below, much of this study focuses upon the dynamics along modes ν8and ν21 in the T1 state. ν8 is the totally symmetric breathing mode responsible for the
contraction of the Cu-N distance in the excited state and ν21, is the mode associated
with the pseudo Jahn-Teller (PJT) distortion. Figure 2 shows the position and width of
the wavepacket in the T1 state along these modes. The position of the wavepacket along
ν8 shows an oscillation with a period of ∼300 fs in good agreement with the wavepacket
dynamics reported by Tahara et al. [55], The width only shows small oscillators, and
remains roughly constant throughout the first picosecond. In contrast, ν21 exhibits
no significant displacement from the Franck-Condon geometry. Instead, due to the
vibrational hot system, in these states the dynamics are reflected in the width of the
wavepacket, rather than position. Here, at early times we observe a large increase in the
width of the wavepacket along ν21. The gradual decrease in this width is highlighting

Probing Wavepacket Dynamics using Ultrafast X-ray Spectroscopy 5
-0.6
-0.4
-0.2
0.0
0.2
0.4
0.6
<q>
10008006004002000Time (fs)
(a)
3.5
3.0
2.5
2.0
1.5
1.0
0.5
0.0
<dq>
10008006004002000Time (fs)
(b)
Figure 2. Expectation value of the position, 〈q〉 (a), and of the width, 〈dq〉 (b), of
the wavepacket in the T1 state. Colors: red, ν8; blue, ν21.
the beginning of vibrational relaxation.
2.2. Simulations of the time-resolved spectra
The X-ray spectrum of the non-stationary wavepacket is calculated as the weighted sum
of the spectra calculated at each grid point used to describe the nuclear wavepacket.
The weighting corresponds to the magnitude of the nuclear wavepacket at that grid
point. For the EXAFS spectra, a sum over each electronic state was also performed,
thus achieving a description of the full nuclear wavepacket. All of the other spectra
(pre-edge XANES and XES) only considered the wavepacket, and thus the dynamics,
on the T1 state.
This is because, in contrast to EXAFS spectra, the valence electronic structure is
expected to influence the spectrum, meaning that for the excited states (i.e. S1, S2,
S3 and T2, T3, T4), one must simulate the core-level spectrum of each excited state.
Due to the two excitation steps, the transition dipole matrix elements between the
valence excited state and the final core-excited state cannot be computed within linear
response theories, such as Linear response-time-dependent density functional theory
(LR-TDDFT). However, since DFT is rigorously valid for the lowest state of a given
Probing Wavepacket Dynamics using Ultrafast X-ray Spectroscopy 6
spin, we are able to simulate the T1 state.
At present, the most rigorous approach of simulating the core-level spectra of
electronically excited states is Restricted Active Space Self Consistent Field (RASSCF)
method [38]. However, since these calculations are extremely computationally
intensive they are unrealistic to describe the time-evolution of a nuclear wavepacket.
Consequently, this approach is best applied to probe selected important points of the
dynamics, as recently demonstrated in the study of photoexcited Fe(CO)5 [24]. An
alternative approximate way to address the excited state is using a ∆SCF approach,
such as the maximum overlap method (MOM) [39, 40]. However, this requires that the
excited state is well describe by a single electron excitation, such as a HOMO-LUMO
transition. Unfortunately this is not the case for the present system. In addition, the
character of the excited states changes along the main reaction path making it impossible
to assign a single configuration to represent each of the excited states.
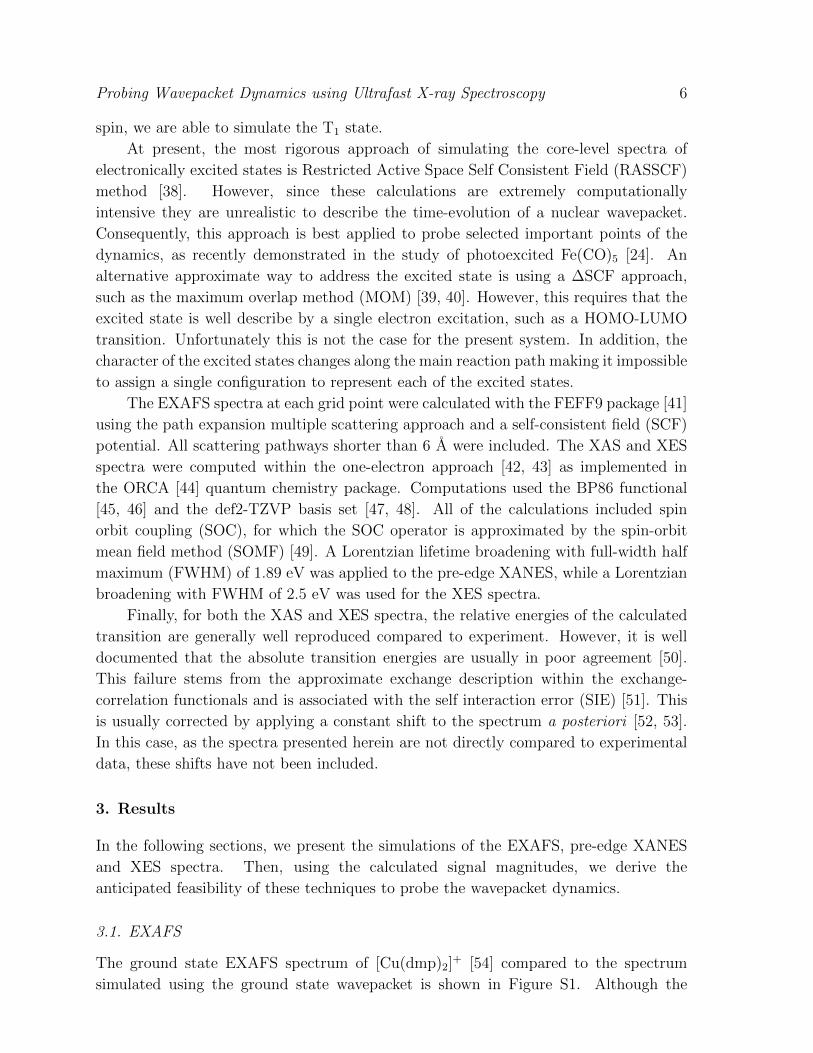
The EXAFS spectra at each grid point were calculated with the FEFF9 package [41]
using the path expansion multiple scattering approach and a self-consistent field (SCF)
potential. All scattering pathways shorter than 6 A were included. The XAS and XES
spectra were computed within the one-electron approach [42, 43] as implemented in
the ORCA [44] quantum chemistry package. Computations used the BP86 functional
[45, 46] and the def2-TZVP basis set [47, 48]. All of the calculations included spin
orbit coupling (SOC), for which the SOC operator is approximated by the spin-orbit
mean field method (SOMF) [49]. A Lorentzian lifetime broadening with full-width half
maximum (FWHM) of 1.89 eV was applied to the pre-edge XANES, while a Lorentzian
broadening with FWHM of 2.5 eV was used for the XES spectra.
Finally, for both the XAS and XES spectra, the relative energies of the calculated
transition are generally well reproduced compared to experiment. However, it is well
documented that the absolute transition energies are usually in poor agreement [50].
This failure stems from the approximate exchange description within the exchange-
correlation functionals and is associated with the self interaction error (SIE) [51]. This
is usually corrected by applying a constant shift to the spectrum a posteriori [52, 53].
In this case, as the spectra presented herein are not directly compared to experimental
data, these shifts have not been included.
3. Results
In the following sections, we present the simulations of the EXAFS, pre-edge XANES
and XES spectra. Then, using the calculated signal magnitudes, we derive the
anticipated feasibility of these techniques to probe the wavepacket dynamics.
3.1. EXAFS
The ground state EXAFS spectrum of [Cu(dmp)2]+ [54] compared to the spectrum
simulated using the ground state wavepacket is shown in Figure S1. Although the

Probing Wavepacket Dynamics using Ultrafast X-ray Spectroscopy 7
0 100 200 300 400 500
Time [fs]
3
4
5
6
7
8
9
10k
[Å−
1 ]
−0.005
0
0.005
0.01
0 100 200 300 400 500
Time [fs]
3
4
5
6
7
8
9
10
k [Å−
1 ]
−0.005
0
0.005
0.01
0 100 200 300 400 500
Time [fs]
3
4
5
6
7
8
9
10
k [Å−
1 ]
−0.005
0
0.005
0.01
0 100 200 300 400 500
Time [fs]
3
4
5
6
7
8
9
10
k [Å−
1 ]
−0.005
0
0.005
0.01
−0.008
−0.004
0.000
0.004
0.008
0.012
a) b)
c) d)
Figure 3. The simulated transient Cu K-edge EXAFS spectrum, ∆χ, of [Cu(dmp)2]+
for the first 500 fs after photoexcitation. In each case the spectra are calculated using
the nuclear wavepacket dynamics along one degree of freedom; ν8 (a), ν19 (b), ν21 (c),
ν25 (d).
simulated spectrum is slightly more structured than the experimental spectrum, fairly
good agreement between the two is observed with the main features, especially those
at low k, well captured. As previously reported [54], this EXAFS spectrum is largely
dependent on the Cu-N distance, which is 2.09 A in the ground state.
Figure 3 shows the transient EXAFS spectrum for the first 500 fs of the photoexcited
dynamics projected along 4 (ν8, ν19, ν21, ν25) of the 8 nuclear degrees of freedom included
in the model Hamiltonian. This shows that two modes, ν8 and ν21, would be expected
to dominate the transient features. The other two modes, ν19, ν25 have a weak signal
as they are not strongly displaced from their ground state configuration during the
dynamics [28]. Of the two active modes, ν8 is the totally symmetric breathing mode
responsible for the contraction of the Cu-N distance in the excited state. This shows
an oscillation, caused by a phase shift in the transient EXAFS spectrum, with a period
of ∼300 fs in good agreement with the wavepacket dynamics reported by Tahara et al.
[55]. In contrast ν21, which is the mode associated with the pseudo Jahn-Teller (PJT)
distortion, exhibits a strong transient signal that is out of phase with the features
occurring in the ground state EXAFS spectrum (Figure S1), pointing to a damping of
the EXAFS features in the excited state. It occurs because the excited state potential
along this mode is flatter than the ground state, leading to a nuclear wavepacket that is
more spread in the excited state. This additional width has the same dampening effect
on the EXAFS spectrum as a Debye-Waller term [56].
Probing Wavepacket Dynamics using Ultrafast X-ray Spectroscopy 8
0 100 200 300 400 500
Time [fs]
3
4
5
6
7
8
9
10k
[Å−
1 ]
−0.01
0.00
0.01
0.02
0 100 200 300 400 500
Time [fs]
3
4
5
6
7
8
9
10
k [Å−
1 ]
−0.002
0.000
0.002
0.004
a)
b)
20 fs
60 fs
100 fs
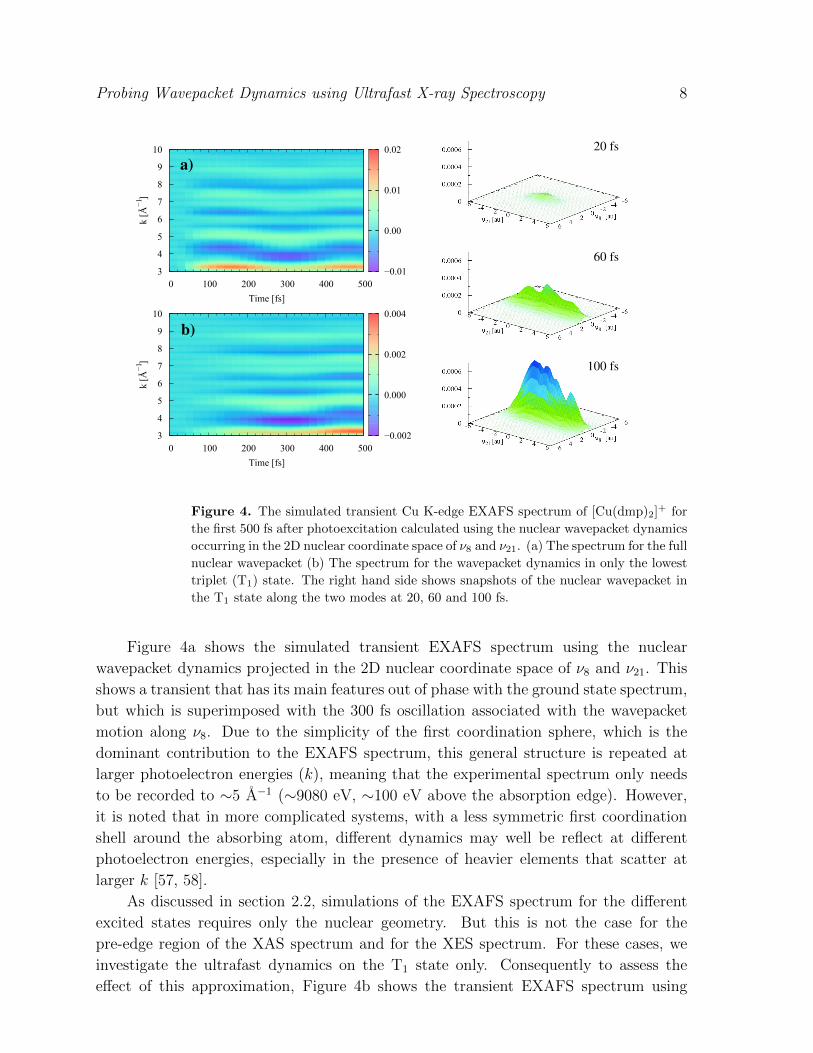
Figure 4. The simulated transient Cu K-edge EXAFS spectrum of [Cu(dmp)2]+ for
the first 500 fs after photoexcitation calculated using the nuclear wavepacket dynamics
occurring in the 2D nuclear coordinate space of ν8 and ν21. (a) The spectrum for the full
nuclear wavepacket (b) The spectrum for the wavepacket dynamics in only the lowest
triplet (T1) state. The right hand side shows snapshots of the nuclear wavepacket in
the T1 state along the two modes at 20, 60 and 100 fs.
Figure 4a shows the simulated transient EXAFS spectrum using the nuclear
wavepacket dynamics projected in the 2D nuclear coordinate space of ν8 and ν21. This
shows a transient that has its main features out of phase with the ground state spectrum,
but which is superimposed with the 300 fs oscillation associated with the wavepacket
motion along ν8. Due to the simplicity of the first coordination sphere, which is the
dominant contribution to the EXAFS spectrum, this general structure is repeated at
larger photoelectron energies (k), meaning that the experimental spectrum only needs
to be recorded to ∼5 A−1 (∼9080 eV, ∼100 eV above the absorption edge). However,
it is noted that in more complicated systems, with a less symmetric first coordination
shell around the absorbing atom, different dynamics may well be reflect at different
photoelectron energies, especially in the presence of heavier elements that scatter at
larger k [57, 58].
As discussed in section 2.2, simulations of the EXAFS spectrum for the different
excited states requires only the nuclear geometry. But this is not the case for the
pre-edge region of the XAS spectrum and for the XES spectrum. For these cases, we
investigate the ultrafast dynamics on the T1 state only. Consequently to assess the
effect of this approximation, Figure 4b shows the transient EXAFS spectrum using
Probing Wavepacket Dynamics using Ultrafast X-ray Spectroscopy 9
nuclear wavepacket in the 2D nuclear coordinate space of ν8 and ν21, for which only the
wavepacket on the T1 has been considered. Importantly, the same wavepacket dynamics
are observed, although the signal is a factor of ∼5 weaker. This is due to the smaller
(<30%) population (see Figure 1) of the T1 state.
3.2. Pre-edge X-ray Absorption
Figure 5a shows the Cu K-edge pre-edge XANES spectrum in the ground and T1 states
(500 fs after photoexcitation) calculated using the 2D nuclear coordinate space of ν8and ν21. The transient spectra simulated at every time-delay (τ) of 20 fs between
τ=0 to 500 fs are shown in Figure S2. Ideally, one would wish to simulate the entire
XANES spectrum. However, as a result of the difficulties associated with a quantitative
description of these transient features [59], a quantitative agreement between the
experimental spectrum recorded at a time-delay of 50 ps and the corresponding
simulations [54] could not be achieved. Consequently, we focus upon the pre-edge region
of the spectrum.
0 100 200 300 400 500
Time (fs)
8746
8748
8750
8752
8754
Energ
y (e
V)
-12000
-9000
-6000
-3000
0
3000
(a) (b) (c)
-3000
-2000
-1000
0
1000
2000
Abs
. T1
(t)-A
bs. T
1(at
20
fs)
(Arb
. Uni
ts)
500400300200100
Time (fs)
8753.5 eV
8747.5 eV
25x103
20
15
10
5
0
Abs
orpt
ion
(Arb
. Uni
ts)
87548752875087488746
Energy (eV)
-20x103
-15
-10
-5
0
5
10
15
∆Absorption (A
rb. Units)
Ground State (*0.25) Transient at 500 fs
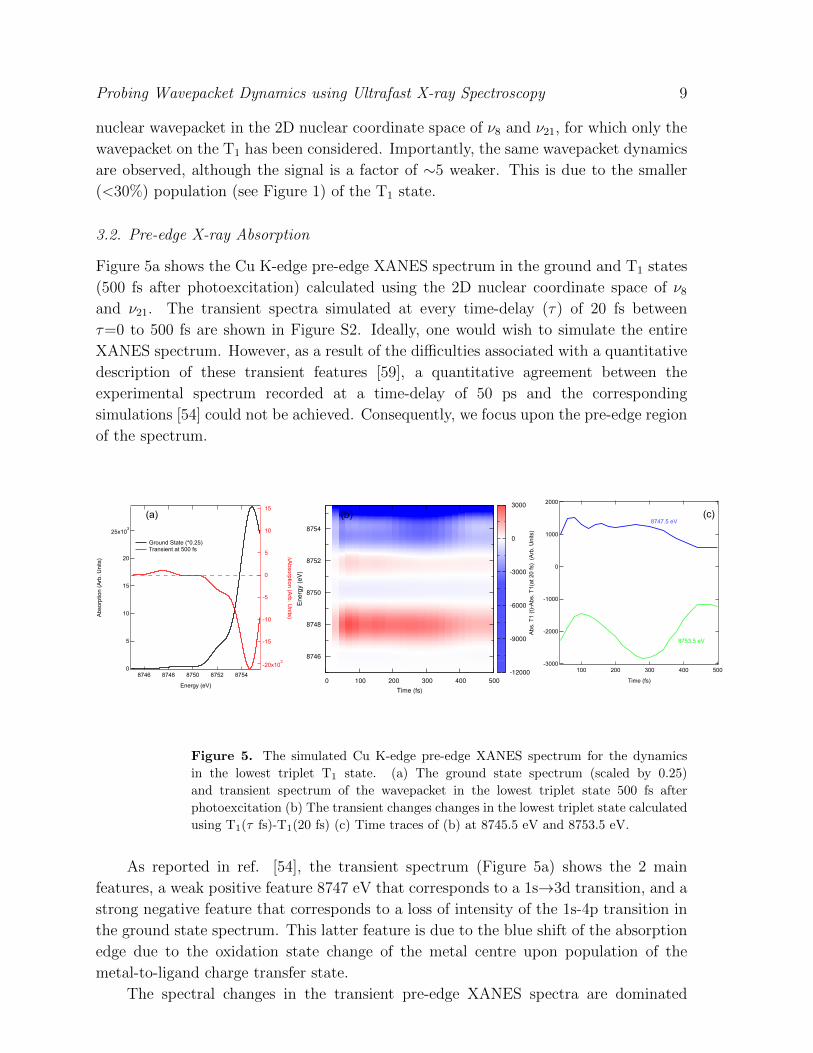
Figure 5. The simulated Cu K-edge pre-edge XANES spectrum for the dynamics
in the lowest triplet T1 state. (a) The ground state spectrum (scaled by 0.25)
and transient spectrum of the wavepacket in the lowest triplet state 500 fs after
photoexcitation (b) The transient changes changes in the lowest triplet state calculated
using T1(τ fs)-T1(20 fs) (c) Time traces of (b) at 8745.5 eV and 8753.5 eV.
As reported in ref. [54], the transient spectrum (Figure 5a) shows the 2 main
features, a weak positive feature 8747 eV that corresponds to a 1s→3d transition, and a
strong negative feature that corresponds to a loss of intensity of the 1s-4p transition in
the ground state spectrum. This latter feature is due to the blue shift of the absorption
edge due to the oxidation state change of the metal centre upon population of the
metal-to-ligand charge transfer state.
The spectral changes in the transient pre-edge XANES spectra are dominated
Probing Wavepacket Dynamics using Ultrafast X-ray Spectroscopy 10
by the oxidation shift of the absorption edge and the change of the population of
the T1 (see Figure S2). As a consequence they do not exhibit any distinct changes
associated with the wavepacket dynamics. To remove these two effects, Figure 5b
shows the transient changes occurring in the T1 state only, i.e. T1(τ fs)-T1(20 fs).
Time traces at specific energies are shown in Figure 5c. The time-trace at 8753.5 eV,
corresponding to just below the 1s-4p transition in the ground state spectrum, captures
the oscillatory dynamics observed in the EXAFS spectra and exhibits a signal change
∼1%. Importantly, as the main features in the transient spectrum and the vibrational
dynamics are unrelated, the energy region most sensitive to the wavepacket dynamics,
in this case 8753.5 eV, does not necessarily correspond to the largest changes in the
transient spectrum. Given the energy range considered here, we also cannot rule out
these changes also occurring at higher energies in the XANES region of the spectrum,
these will be significantly smaller than the transient changes associated with the 1s-4p
transition and much closer to those of the EXAFS region.
3.3. X-ray emission
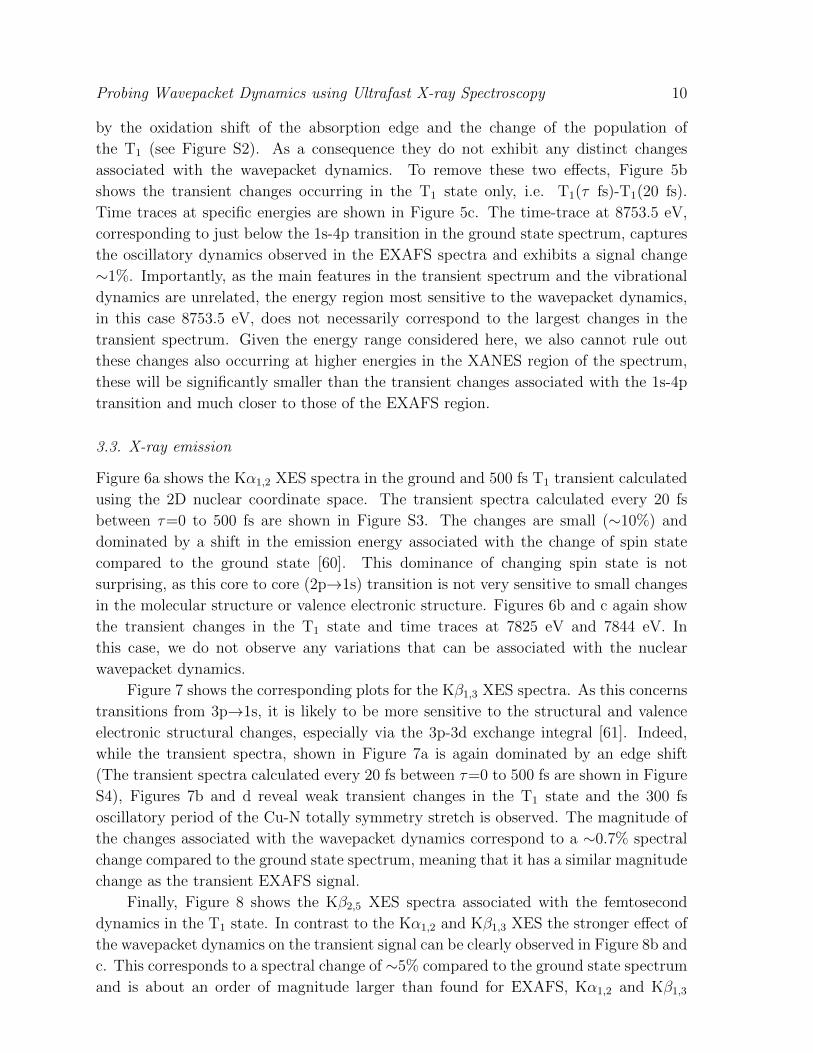
Figure 6a shows the Kα1,2 XES spectra in the ground and 500 fs T1 transient calculated
using the 2D nuclear coordinate space. The transient spectra calculated every 20 fs
between τ=0 to 500 fs are shown in Figure S3. The changes are small (∼10%) and
dominated by a shift in the emission energy associated with the change of spin state
compared to the ground state [60]. This dominance of changing spin state is not
surprising, as this core to core (2p→1s) transition is not very sensitive to small changes
in the molecular structure or valence electronic structure. Figures 6b and c again show
the transient changes in the T1 state and time traces at 7825 eV and 7844 eV. In
this case, we do not observe any variations that can be associated with the nuclear
wavepacket dynamics.
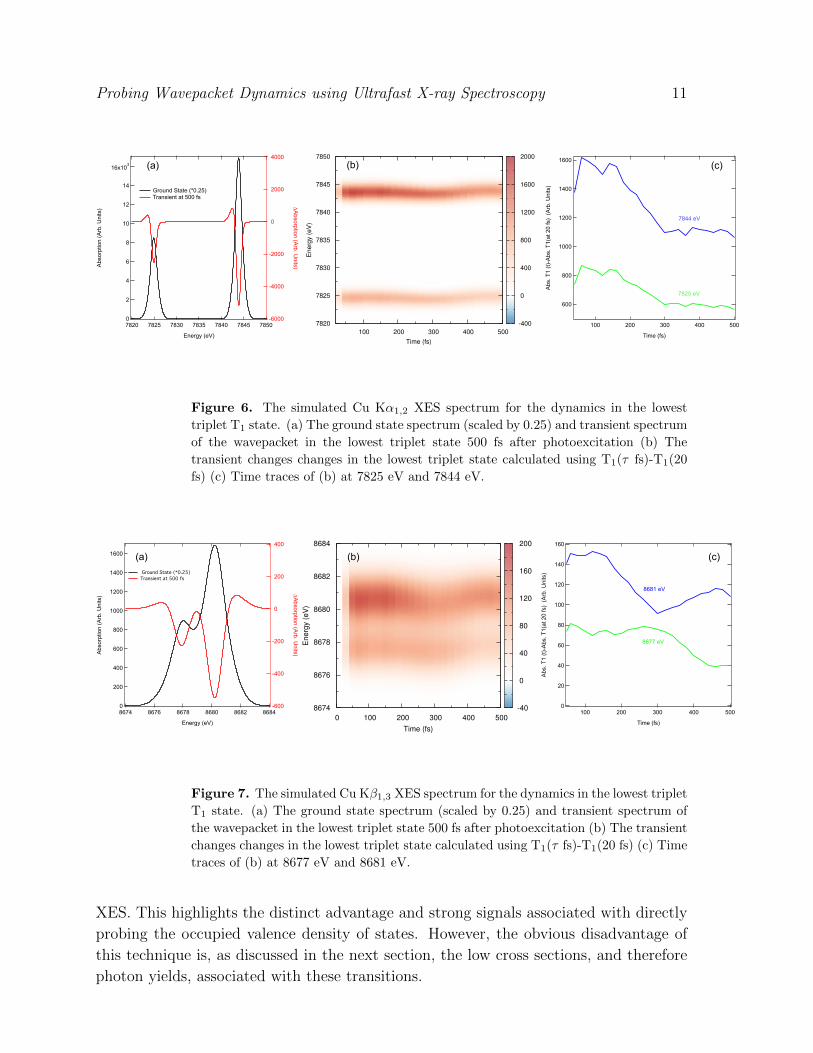
Figure 7 shows the corresponding plots for the Kβ1,3 XES spectra. As this concerns
transitions from 3p→1s, it is likely to be more sensitive to the structural and valence
electronic structural changes, especially via the 3p-3d exchange integral [61]. Indeed,
while the transient spectra, shown in Figure 7a is again dominated by an edge shift
(The transient spectra calculated every 20 fs between τ=0 to 500 fs are shown in Figure
S4), Figures 7b and d reveal weak transient changes in the T1 state and the 300 fs
oscillatory period of the Cu-N totally symmetry stretch is observed. The magnitude of
the changes associated with the wavepacket dynamics correspond to a ∼0.7% spectral
change compared to the ground state spectrum, meaning that it has a similar magnitude
change as the transient EXAFS signal.
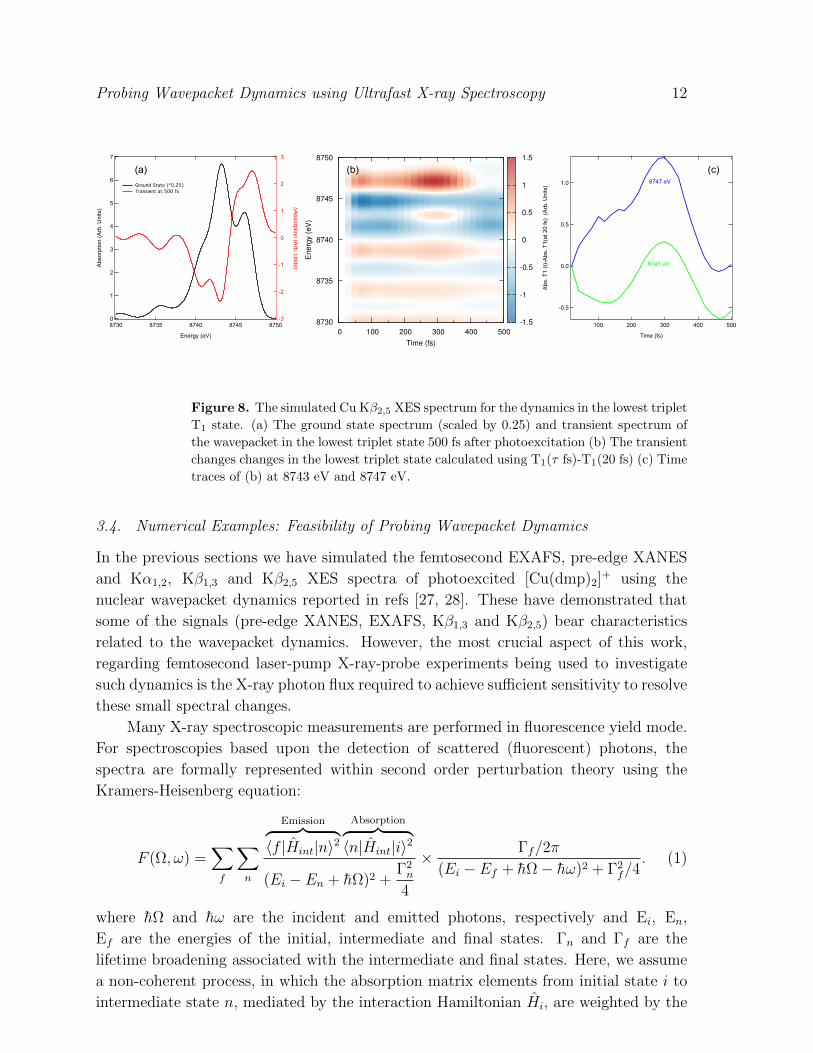
Finally, Figure 8 shows the Kβ2,5 XES spectra associated with the femtosecond
dynamics in the T1 state. In contrast to the Kα1,2 and Kβ1,3 XES the stronger effect of
the wavepacket dynamics on the transient signal can be clearly observed in Figure 8b and
c. This corresponds to a spectral change of ∼5% compared to the ground state spectrum
and is about an order of magnitude larger than found for EXAFS, Kα1,2 and Kβ1,3
Probing Wavepacket Dynamics using Ultrafast X-ray Spectroscopy 11
100 200 300 400 500
Time (fs)
7820
7825
7830
7835
7840
7845
7850
En
erg
y (e
V)
-400
0
400
800
1200
1600
2000 1600
1400
1200
1000
800
600
Abs
. T1
(t)-A
bs. T
1(at
20
fs)
(Arb
. Uni
ts)
500400300200100
Time (fs)
7844 eV
7825 eV
(a) (b) (c) 16x103
14
12
10
8
6
4
2
0
Abs
orpt
ion
(Arb
. Uni
ts)
7850784578407835783078257820
Energy (eV)
-6000
-4000
-2000
0
2000
4000
∆Absorption (A
rb. Units)
Ground State (*0.25) Transient at 500 fs
Figure 6. The simulated Cu Kα1,2 XES spectrum for the dynamics in the lowest
triplet T1 state. (a) The ground state spectrum (scaled by 0.25) and transient spectrum
of the wavepacket in the lowest triplet state 500 fs after photoexcitation (b) The
transient changes changes in the lowest triplet state calculated using T1(τ fs)-T1(20
fs) (c) Time traces of (b) at 7825 eV and 7844 eV.
160
140
120
100
80
60
40
20
0
Abs
. T1
(t)-A
bs. T
1(at
20
fs)
(Arb
. Uni
ts)
500400300200100
Time (fs)
8681 eV
8677 eV
1600
1400
1200
1000
800
600
400
200
0
Abs
orpt
ion
(Arb
. Uni
ts)
868486828680867886768674
Energy (eV)
-600
-400
-200
0
200
400
∆Absorption (A
rb. Units)
Ground State (*0.25) Transient at 500 fs
0 100 200 300 400 500
Time (fs)
8674
8676
8678
8680
8682
8684
Energ
y (e
V)
-40
0
40
80
120
160
200
(a) (b) (c)
Figure 7. The simulated Cu Kβ1,3 XES spectrum for the dynamics in the lowest triplet
T1 state. (a) The ground state spectrum (scaled by 0.25) and transient spectrum of
the wavepacket in the lowest triplet state 500 fs after photoexcitation (b) The transient
changes changes in the lowest triplet state calculated using T1(τ fs)-T1(20 fs) (c) Time
traces of (b) at 8677 eV and 8681 eV.
XES. This highlights the distinct advantage and strong signals associated with directly
probing the occupied valence density of states. However, the obvious disadvantage of
this technique is, as discussed in the next section, the low cross sections, and therefore
photon yields, associated with these transitions.
Probing Wavepacket Dynamics using Ultrafast X-ray Spectroscopy 12
1.0
0.5
0.0
-0.5
Abs
. T1
(t)-A
bs. T
1(at
20
fs)
(Arb
. Uni
ts)
500400300200100
Time (fs)
8747 eV
8743 eV
7
6
5
4
3
2
1
0
Abs
orpt
ion
(Arb
. Uni
ts)
87508745874087358730
Energy (eV)
-3
-2
-1
0
1
2
3
∆Absorption (A
rb. Units)
Ground State (*0.25) Transient at 500 fs
0 100 200 300 400 500
Time (fs)
8730
8735
8740
8745
8750
Energ
y (e
V)
-1.5
-1
-0.5
0
0.5
1
1.5
(a) (b) (c)
Figure 8. The simulated Cu Kβ2,5 XES spectrum for the dynamics in the lowest triplet
T1 state. (a) The ground state spectrum (scaled by 0.25) and transient spectrum of
the wavepacket in the lowest triplet state 500 fs after photoexcitation (b) The transient
changes changes in the lowest triplet state calculated using T1(τ fs)-T1(20 fs) (c) Time
traces of (b) at 8743 eV and 8747 eV.
3.4. Numerical Examples: Feasibility of Probing Wavepacket Dynamics
In the previous sections we have simulated the femtosecond EXAFS, pre-edge XANES
and Kα1,2, Kβ1,3 and Kβ2,5 XES spectra of photoexcited [Cu(dmp)2]+ using the
nuclear wavepacket dynamics reported in refs [27, 28]. These have demonstrated that
some of the signals (pre-edge XANES, EXAFS, Kβ1,3 and Kβ2,5) bear characteristics
related to the wavepacket dynamics. However, the most crucial aspect of this work,
regarding femtosecond laser-pump X-ray-probe experiments being used to investigate
such dynamics is the X-ray photon flux required to achieve sufficient sensitivity to resolve
these small spectral changes.
Many X-ray spectroscopic measurements are performed in fluorescence yield mode.
For spectroscopies based upon the detection of scattered (fluorescent) photons, the
spectra are formally represented within second order perturbation theory using the
Kramers-Heisenberg equation:
F (Ω, ω) =∑f
∑n
Emission︷ ︸︸ ︷〈f |Hint|n〉2
Absorption︷ ︸︸ ︷〈n|Hint|i〉2
(Ei − En + hΩ)2 +Γ2n
4
× Γf/2π
(Ei − Ef + hΩ− hω)2 + Γ2f/4
. (1)
where hΩ and hω are the incident and emitted photons, respectively and Ei, En,
Ef are the energies of the initial, intermediate and final states. Γn and Γf are the
lifetime broadening associated with the intermediate and final states. Here, we assume
a non-coherent process, in which the absorption matrix elements from initial state i to
intermediate state n, mediated by the interaction Hamiltonian Hi, are weighted by the
Probing Wavepacket Dynamics using Ultrafast X-ray Spectroscopy 13
emission matrix elements [11, 62].
For measurements of the XAS spectra, performed in total fluorescence yield (TFY)
mode, the cross section of the absorption matrix element (〈n|Hint|i〉) at a particular X-
ray incident energy is integrated over all of the emission matrix elements (〈f |Hint|n〉).Consequently, as discrimination of the energy of the emitted photons is not required,
one can use a point detector, such as a silicon photodiode [20]. These can be placed
close (∼15 mm) to the sample, and can therefore achieve a larger solid angle. Using the
relation:
θ =πr2APD4πR2
(2)
and assuming that the detector’s active radius, rAPD=7mm the solid angle (θ) is ∼5%.
Given the efficiency of the fluorescence process at Cu K-edge is ∼45% [63] and assuming
a detector with a quantum efficiency of∼0.8 [64, 65], we can combine these 3 components
to yield a loss factor (of the photons in vs the photons out) of 2×10⁻².
In contrast, detection of the X-ray emission elements is proportional to the cross
section of the absorption matrix element (〈n|Hint|i〉) multiplied by the cross section
of the emission line of interest (〈f |Hint|n〉), i.e. Kα1,2, Kβ1,3. Consequently, the
photon yield for each spectrum will be significantly lower making it harder to achieve
a large signal to noise ratio (SNR) for these photon hungry techniques. In addition,
for these experiments the X-ray emission spectrometer is further away from the sample
causing additional losses and a smaller solid angle [60, 66]. For each emission line
of interest, the fluorescence efficiency are Cu Kα1,2=0.3, Cu Kβ1,3-edge=0.03 and Cu
Kβ2,5-edge=0.00001 [63, 66]. Consequently given a reduced solid angle arising from the
larger sample detector distance of θ ∼ 0.04% (∼5 millisteradians) [66, 67], the X-ray
attenuation in air due to the larger distance from the detector [68], which is assumed
to be 0.3, the total losses are Cu Kα1,2-edge=3.0×10⁻⁵, Cu Kβ1,3-edge= 3.0×10⁻⁶ and
Cu Kβ2,5-edge = 9.6×10⁻⁹.
Assuming a 100 µm thick jet of 25 mM solution, the absorbed fraction of photons,
according to the Beer-Lambert law is ∼2%. It is stressed that this approximation is only
strictly valid for solvents containing light elements (e.g., water, acetonitrile, hexane) and
may change for heavier solvents, like CCl4 [65]. With these conditions in mind, given
1010 photons per pulse achievable for the monochromatic mode of the LCLS [69], the
number of useful photons per pulse detected (see Table 1), i.e. once the loss factors have
been included, is: 4×10⁶ (TFY), 6×10³ (Cu Kα1,2), 6.0×10² (Cu Kβ1,3) and 2.0×100
(Cu Kβ2,5).
In an experiment, provided that most of the electronic noise is suppressed, the
detection sensitivity can be close to the shot-noise limit. This inherent noise is given as√N , where N is the signal, i.e. the number of photons detected. The signal to noise
ratio is therefore given SNR=N/√N . Using these boundary conditions, Table 1 shows
the number of X-ray photons, and consequently of X-ray pulses, required to measure
with a SNR=10 for i) a transient X-ray spectroscopic signal and ii) the wavepacket
dynamics. The number of X-ray photons (INpho) required to measure a given signal
Probing Wavepacket Dynamics using Ultrafast X-ray Spectroscopy 14
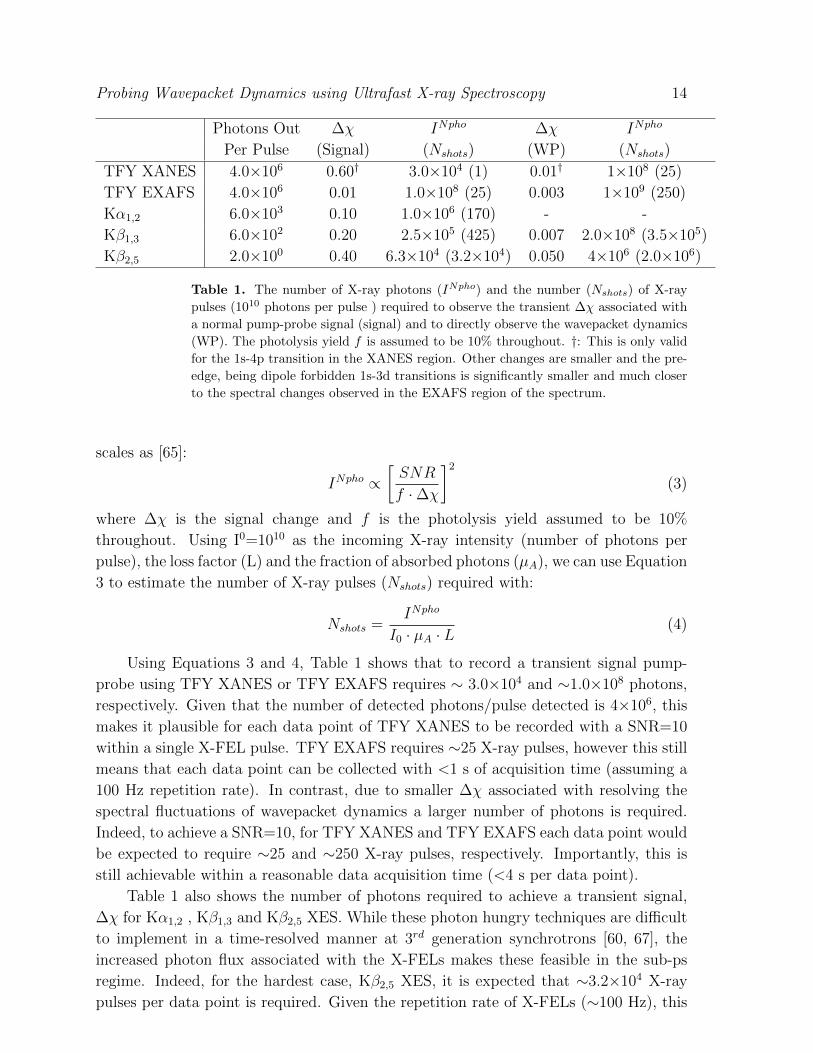
Photons Out ∆χ INpho ∆χ INpho
Per Pulse (Signal) (Nshots) (WP) (Nshots)
TFY XANES 4.0×10⁶ 0.60† 3.0×10⁴ (1) 0.01† 1×10⁸ (25)
TFY EXAFS 4.0×10⁶ 0.01 1.0×10⁸ (25) 0.003 1×10⁹ (250)
Kα1,2 6.0×10³ 0.10 1.0×10⁶ (170) - -
Kβ1,3 6.0×10² 0.20 2.5×10⁵ (425) 0.007 2.0×10⁸ (3.5×10⁵)
Kβ2,5 2.0×100 0.40 6.3×10⁴ (3.2×10⁴) 0.050 4×10⁶ (2.0×10⁶)
Table 1. The number of X-ray photons (INpho) and the number (Nshots) of X-ray
pulses (1010 photons per pulse ) required to observe the transient ∆χ associated with
a normal pump-probe signal (signal) and to directly observe the wavepacket dynamics
(WP). The photolysis yield f is assumed to be 10% throughout. †: This is only valid
for the 1s-4p transition in the XANES region. Other changes are smaller and the pre-
edge, being dipole forbidden 1s-3d transitions is significantly smaller and much closer
to the spectral changes observed in the EXAFS region of the spectrum.
scales as [65]:
INpho ∝[SNR
f ·∆χ
]2(3)
where ∆χ is the signal change and f is the photolysis yield assumed to be 10%
throughout. Using I0=1010 as the incoming X-ray intensity (number of photons per
pulse), the loss factor (L) and the fraction of absorbed photons (µA), we can use Equation
3 to estimate the number of X-ray pulses (Nshots) required with:
Nshots =INpho
I0 · µA · L(4)
Using Equations 3 and 4, Table 1 shows that to record a transient signal pump-
probe using TFY XANES or TFY EXAFS requires ∼ 3.0×10⁴ and ∼1.0×10⁸ photons,
respectively. Given that the number of detected photons/pulse detected is 4×10⁶, this
makes it plausible for each data point of TFY XANES to be recorded with a SNR=10
within a single X-FEL pulse. TFY EXAFS requires ∼25 X-ray pulses, however this still
means that each data point can be collected with <1 s of acquisition time (assuming a
100 Hz repetition rate). In contrast, due to smaller ∆χ associated with resolving the
spectral fluctuations of wavepacket dynamics a larger number of photons is required.
Indeed, to achieve a SNR=10, for TFY XANES and TFY EXAFS each data point would
be expected to require ∼25 and ∼250 X-ray pulses, respectively. Importantly, this is
still achievable within a reasonable data acquisition time (<4 s per data point).
Table 1 also shows the number of photons required to achieve a transient signal,
∆χ for Kα1,2 , Kβ1,3 and Kβ2,5 XES. While these photon hungry techniques are difficult
to implement in a time-resolved manner at 3rd generation synchrotrons [60, 67], the
increased photon flux associated with the X-FELs makes these feasible in the sub-ps
regime. Indeed, for the hardest case, Kβ2,5 XES, it is expected that ∼3.2×10⁴ X-ray
pulses per data point is required. Given the repetition rate of X-FELs (∼100 Hz), this
Probing Wavepacket Dynamics using Ultrafast X-ray Spectroscopy 15
would require acquisition times of∼10-20 mins per data point. For these experiments the
potentially high X-ray fluency and repetition rate of the European X-FEL could make
such measurements significantly easier [70]. However, Table 1 shows that although
measuring the transient signal is possible even for Kβ2,5 XES, the number of X-ray
pulses, ∼105−6 required to achieve sufficient SNR to observe the wavepacket dynamics
with these spectroscopies makes them completely unfeasible (∼6 hours per data point
at 100 Hz).
4. Discussions and Conclusions
Ultrafast time-resolved linear and non-linear optical spectroscopies have a strong history
of providing important insight into photoexcited dynamics within the femtosecond
regime. Owing to the development of the X-FELs, these dynamics can now also be
observed in the short-wavelength regime and provide direct snapshots of interatomic
distances and changes in charge distribution of molecules. These techniques hold great
promise of yielding important new insight into fundamental dynamical processes such
as vibrational excitation, bond formation and breaking, relaxation, and time-dependent
solvation processes.
In this paper we have used wavepacket dynamics simulations to predict femtosecond
EXAFS, pre-edge XANES, Kα1,2, Kα1,3 and Kβ2,5 XES spectra. These have
demonstrated that for the present system, femtosecond pre-edge XANES, EXAFS,
Kβ1,3 and Kβ2,5 XES spectra all reveal information about the wavepacket dynamics.
However using realistic experimental parameters, while it will be possible to record a
signal capturing the strongest transient changes for all of the spectroscopies studies
herein, we have demonstrated that the wavepacket dynamics can only be observed
experimentally within realistic acquisition times for XANES and EXAFS, as the small
cross section associated with Kβ1,3 and Kβ2,5 XES makes the number of X-ray pulses
required unfeasible.
In the present study we have not considered L-edge spectroscopy. However recent
work has demonstrated that it is possible to record high quality L-edge spectra of dilute
3d transition metals using a high transmission zone-plate spectrometer implemented
at the Linac Coherent Light Source (LCLS). [71] Although the L-edges have a smaller
fluorescence yield (∼10%), these transitions (2p-3d) could be a interesting alternative
approach that should also be explored.
Importantly, in terms of a general feasibility, the transient signals for the present
case [Cu(dmp)2]+ are dominated by an oxidation shift associated with the charge
transfer of an electron from the metal to the ligands upon excitation. As this has
no correspondence with the wavepacket dynamics, the changes associated with these
vibrational coherences will be a small change on top of the large underlying transient of
the edge shift. This means that resolving the wavepacket dynamics for the present
system represents a challenging case. Given that it remains possible, this holds
significant promise for future experiments in this area. It should be stressed that as the
Probing Wavepacket Dynamics using Ultrafast X-ray Spectroscopy 16
main features in the transient spectrum and the vibrational dynamics are unrelated, the
energy region most sensitive to the wavepacket dynamics does not necessarily correspond
to the largest changes in the transient spectrum making it important to record the whole
spectrum at each time-delay and not just a time scan at one particular energy. For other
cases, such as [Fe(bpy)3]2+ [15, 72, 73, 60, 74] determining the wavepacket dynamics
could be expected to be easier. In this case, the transient spectrum is not dominated
by a feature unrelated to the vibrational coherences. Instead, here the wavepacket
dynamics reported by Chergui and co-workers [75] occurs along this Fe-N coordinate,
which is also responsible for the principal transient changes in the Fe K-edge XAS
spectrum. In this case the wavepacket dynamics would therefore be expected to yield
larger changes making observing these dynamics easier. This highlights the strong
emphasis that should be placed upon fully understanding the dominant contributions
to a transient signal at longer times (i.e. using a 3rd generation synchrotrons) before
determining if a particular experiment is possible.
Acknowledgments
We thank the Swiss National Science Foundation (Grant 200021-137717) and the NCCR
MUST for funding.
5. References
[1] A H Zewail. Laser Femtochemistry. Science, 242(4886):1645–1653, 1988.
[2] Shaul Mukamel. Principles of nonlinear optical spectroscopy. Oxford University Press, USA, 1995.
[3] David A Reis and Aaron M Lindenberg. Ultrafast X-ray scattering in solids. Light Scattering In
Solids IX, 108:371–422, 2007.
[4] Thomas Elsaesser and Michael Woerner. Photoinduced structural dynamics of polar solids studied
by femtosecond X-ray diffraction. Acta Crystallographica Section A, 66:168–178, 2010.
[5] S. L. Johnson, P Beaud, E Vorobeva, C J Milne, E D Murray, S Fahy, and G Ingold. Non-
equilibrium phonon dynamics studied by grazing-incidence femtosecond X-ray crystallography.
Acta Crystallographica Section A, 66:157–167, 2010.
[6] German Sciaini and R J Dwayne Miller. Femtosecond electron diffraction: heralding the era of
atomically resolved dynamics. Reports on Progress in Physics, 74:096101, 2011.
[7] Majed Chergui and Ahmed H Zewail. Electron and X-Ray Methods of Ultrafast Structural
Dynamics: Advances and Applications. ChemPhysChem, 10(1):28–43, 2009.
[8] TJ Penfold, CJ Milne, and M Chergui. Recent advances in ultrafast x-ray absorption spectroscopy
of solutions. Advances. in Chemical Physics, 153:1–41, 2013.
[9] Christian Bressler and Majed Chergui. Molecular Structural Dynamics Probed by Ultrafast X-Ray
Absorption Spectroscopy. Annual Review Of Physical Chemistry, 61:263–282, 2010.
[10] LX Chen. Probing transient molecular structures with time-resolved pump/probe XAFS
using synchrotron X-ray sources. Journal of Electron Spectroscopy and Related Phenomena,
119(2):161–174, 2001.
[11] C.J. Milne, T.J. Penfold, and M. Chergui. Recent experimental and theoretical developments
intime-resolved x-ray spectroscopies. Coordination Chemistry Reviews, (0):–, 2014.
[12] AH Zewail. 4D ultrafast electron diffraction, crystallography, and microscopy. Annual Review Of
Physical Chemistry, 57:65–103, 2006.
Probing Wavepacket Dynamics using Ultrafast X-ray Spectroscopy 17
[13] Renske M van der Veen, Thomas J Penfold, and Ahmed H Zewail. Ultrafast core-loss spectroscopy
in four-dimensional electron microscopy. Structural Dynamics, 2(2):024302, 2015.
[14] RW Schoenlein, S Chattopadhyay, HHW Chong, TE Glover, PA Heimann, CV Shank,
AA Zholents, and MS Zolotorev. Generation of femtosecond pulses of synchrotron radiation.
Science, 287(5461):2237–2240, 2000.
[15] Christian Bressler, Christopher J Milne, Van-Thai Pham, Amal el Nahhas, Renske M van der Veen,
Wojciech Gawelda, Steven Lee Johnson, Paul Beaud, Daniel Grolimund, Maik Kaiser, Camelia N
Borca, Gerhard Ingold, Rafael Abela, and Majed Chergui. Femtosecond XANES Study of the
Light-Induced Spin Crossover Dynamics in an Iron(II) Complex. Science, 323(5913):489–492,
2009.
[16] N Huse, H Cho, K Hong, L Jamula, FMF de Groot, TK Kim, JK McCusker, and RW Schoenlein.
Femtosecond Soft X-ray Spectroscopy of Solvated Transition-Metal Complexes: Deciphering the
Interplay of Electronic and Structural Dynamics. The Journal of Physical Chemistry Letters,
2:880–884, 2011.
[17] Van-Thai Pham, Thomas J Penfold, Renske M van der Veen, Frederico Lima, Amal el Nahhas,
Steve L Johnson, Paul Beaud, Rafael Abela, Christian Bressler, Ivano Tavernelli, Christopher J
Milne, and Majed Chergui. Probing the Transition from Hydrophilic to Hydrophobic Solvation
with Atomic Scale Resolution. Journal Of The American Chemical Society, 133(32):12740–
12748, 2011.
[18] A Cavalleri, M Rini, HHW Chong, S Fourmaux, TE Glover, PA Heimann, JC Kieffer, and
RW Schoenlein. Band-selective measurements of electron dynamics in vo 2 using femtosecond
near-edge x-ray absorption. Physical review letters, 95(6):067405, 2005.
[19] S Khan. Free-electron lasers. Journal of Modern Optics, 55(21):3469–3512, 2008.
[20] Henrik T Lemke, Christian Bressler, Lin X Chen, David M Fritz, Kelly J Gaffney, Andreas
Galler, Wojciech Gawelda, Kristoffer Haldrup, Robert W Hartsock, Hyotcherl Ihee, Jeongho
Kim, Kyung Hwan Kim, Jae Hyuk Lee, Martin M Nielsen, Andrew B Stickrath, Wenkai Zhang,
Diling Zhu, and Marco Cammarata. Femtosecond X-ray Absorption Spectroscopy at a Hard
X-ray Free Electron Laser: Application to Spin Crossover Dynamics. The Journal of Physical
Chemistry A, 117(4):735–740, 2013.
[21] Wenkai Zhang, Roberto Alonso-Mori, U. Bergmann, C Bressler, M Chollet, Andreas Galler,
W Gawelda, Ryan G Hadt, Robert W. Hartsock, Thomas Kroll, Kasper S Kjaer, Katharina
Kubicek, Henrik T Lemke, Huiyang W Liang, Drew A Meyer, Martin M Nielsen, Carola Purser,
Joseph S Robinson, EI Solomon, Zheng Sun, Dimosthenis Sokaras, Tim B van Driel, G Vanko,
Tsu-Chien Weng, Diling Zhu, and K J Gaffney. Tracking excited-state charge and spin dynamics
in iron coordination complexes. Nature, 509(7500):345–348, May 2014.
[22] Marco Cammarata, Roman Bertoni, Maciej Lorenc, Herve Cailleau, Sergio Di Matteo, Cindy
Mauriac, Samir F Matar, Henrik Lemke, Matthieu Chollet, Sylvain Ravy, et al. Sequential
activation of molecular breathing and bending during spin-crossover photoswitching revealed by
femtosecond optical and x-ray absorption spectroscopy. Physical review letters, 113(22):227402,
2014.
[23] Y Ogi, Y Obara, T Katayama, Y-I Suzuki, SY Liu, NC-M Bartlett, N Kurahashi, S Karashima,
T Togashi, Y Inubushi, et al. Ultraviolet photochemical reaction of [fe (iii)(c2o4) 3] 3- in aqueous
solutions studied by femtosecond time-resolved x-ray absorption spectroscopy using an x-ray free
electron laser. Structural Dynamics, 2(3):034901, 2015.
[24] Ph Wernet, K Kunnus, I Josefsson, I Rajkovic, W Quevedo, M Beye, S Schreck, S Grubel, M Scholz,
D Nordlund, W Zhang, R W Hartsock, W F Schlotter, J J Turner, B Kennedy, F Hennies, F M F
de Groot, K J Gaffney, S Techert, M Odelius, and A Fohlisch. Orbital-specific mapping of the
ligand exchange dynamics of Fe(CO)5 in solution. Nature, 520(7545):78–81, April 2015.
[25] Albert Stolow, Arthur E Bragg, and Daniel M Neumark. Femtosecond time-resolved photoelectron
spectroscopy. Chemical reviews, 104(4):1719–1758, 2004.
[26] Shaul Mukamel. Femtosecond optical spectroscopy: a direct look at elementary chemical events.
Probing Wavepacket Dynamics using Ultrafast X-ray Spectroscopy 18
Annual Review of Physical Chemistry, 41(1):647–681, 1990.
[27] G Capano, T J Penfold, U Rothlisberger, and I Tavernelli. A Vibronic Coupling Hamiltonian
to describe the ultrafast excited state dynamics of a Cu(I)-phenanthroline complex. Chimia,
68:227–230, 2014.
[28] Gloria Capano, Majed Chergui, Ursula Rothlisberger, Ivano Tavernelli, and Thomas James
Penfold. A quantum dynamics study of the ultrafast relaxation in a prototypical cu(i)-
phenanthroline. The Journal of Physical Chemistry A, 0(ja):null, 2014.
[29] LX Chen, GB Shaw, I Novozhilova, T Liu, G Jennings, K Attenkofer, GJ Meyer, and P Coppens.
MLCT state structure and dynamics of a copper(I) diimine complex characterized by pump-
probe X-ray and laser spectroscopies and DFT calculations. Journal Of The American Chemical
Society, 125:7022–7034, 2003.
[30] ZA Siddique, Y Yamamoto, T Ohno, and K Nozaki. Structure-dependent photophysical properties
of singlet and triplet metal-to-ligand charge transfer states in copper(I) bis(diimine) compounds.
Inorganic Chemistry, 42(20):6366–6378, 2003.
[31] George B Shaw, Christian D Grant, Hideaki Shirota, Edward W CASTNER, Gerald J Meyer,
and Lin X Chen. Ultrafast structural rearrangements in the MLCT excited state for copper(I)
bis-phenanthrolines in solution. Journal Of The American Chemical Society, 129(7):2147–2160,
2007.
[32] M Iwamura, S Takeuchi, and T Tahara. Real-time observation of the photoinduced
structural change of bis(2,9-dimethyl-1,10-phenanthroline)copper(I) by femtosecond fluorescence
spectroscopy: A realistic potential curve of the Jahn-Teller distortion. Journal Of The American
Chemical Society, 129:5248–5256, 2007.
[33] M Iwamura, H Watanabe, K Ishii, S Takeuchi, and T Tahara. Coherent Nuclear Dynamics in
Ultrafast Photoinduced Structural Change of Bis (diimine) copper (I) Complex. J. Am. Chem.
Soc., 133:7728, 2011.
[34] M Iwamura, S Takeuchi, and Tahara, T. Substituent effect on the photoinduced structural
change of Cu(I) complexes observed by femtosecond emission spectroscopy. Physical Chemistry
Chemical Physics, 16(9):4143–4154, 2014.
[35] H.-D. Meyer, U. Manthe, and L. S. Cederbaum. The multi-configurational time-dependent Hartree
approach. Chemical Physics Letter, 165:73–78, 1990.
[36] M. H. Beck, A. Jackle, G. A. Worth, and H.-D. Meyer. The multiconfiguration time-dependent
Hartree method: A highly efficient algorithm for propagating wavepackets. Phys. Rep., 324:1–
105, 2000.
[37] H. Koppel, W. Domcke, and L. S. Cederbaum. Multimode molecular dynamics beyond the Born-
Oppenheimer approximation. 57:59–246, 1984.
[38] Ida Josefsson, Kristjan Kunnus, Simon Schreck, Alexander Fohlisch, Frank de Groot, Philippe
Wernet, and Michael Odelius. Ab Initio Calculations of X-ray Spectra: Atomic Multiplet and
Molecular Orbital Effects in a Multiconfigurational SCF Approach to the L-Edge Spectra of
Transition Metal Complexes. The Journal of Physical Chemistry Letters, pages 3565–3570,
2012.
[39] Nicholas A Besley, Andrew T B Gilbert, and Peter M W Gill. Self-consistent-field calculations of
core excited states. The Journal of Chemical Physics, 130(12):124308, 2009.
[40] Nicholas A Besley, Equation of motion coupled cluster theory calculations of the X-ray emission
spectroscopy of water. Chem. Phys. Lett., 542:42-46, 2012.
[41] JJ Rehr, JJ Kas, MP Prange, AP Sorini, Y Takimoto, and F Vila. Ab initio theory and calculations
of X-ray spectra. Comptes Rendus Physique, 10:548, 2009.
[42] Martha A Beckwith, Michael Roemelt, Marie-Noelle Collomb, Carole DuBoc, Tsu-Chien Weng,
Uwe Bergmann, Pieter Glatzel, Frank Neese, and Serena DeBeer. Manganese kβ x-ray emission
spectroscopy as a probe of metal–ligand interactions. Inorganic chemistry, 50(17):8397–8409,
2011.
[43] Nicole Lee, Taras Petrenko, Uwe Bergmann, Frank Neese, and Serena DeBeer. Probing valence

Probing Wavepacket Dynamics using Ultrafast X-ray Spectroscopy 19
orbital composition with iron kβ x-ray emission spectroscopy. Journal of the American Chemical
Society, 132(28):9715–9727, 2010.
[44] Frank Neese. The ORCA program system. Wiley Interdisciplinary Reviews-Computational
Molecular Science, 2(1):73–78, 2012.
[45] AD Becke. Density-functional exchange-energy approximation with correct asymptotic behavior.
Phys. Rev. A, 38:3098–3100, 1988.
[46] J. P Perdew. Density-Functional Approximation for the Correlation-Energy of the Inhomogeneous
Electron-Gas. Physical Review B, 33:8822–8824, 1986.
[47] Ansgar Schafer, Hans Horn, and Reinhart Ahlrichs. Fully optimized contracted gaussian basis
sets for atoms li to kr. The Journal of Chemical Physics, 97(4):2571–2577, 1992.
[48] Florian Weigend and Reinhart Ahlrichs. Balanced basis sets of split valence, triple zeta valence
and quadruple zeta valence quality for h to rn: design and assessment of accuracy. Physical
Chemistry Chemical Physics, 7(18):3297–3305, 2005.
[49] Bernd A Hess, Christel M Marian, Ulf Wahlgren, and Odd Gropen. A mean-field spin-orbit method
applicable to correlated wavefunctions. Chemical Physics Letters, 251(5):365–371, 1996.
[50] M Stener. Time dependent density functional theory of core electrons excitations. Chemical
Physics Letters, 373(1-2):115–123, 2003.
[51] NA Besley, MJG Peach, and DJ Tozer. Time-dependent density functional theory calculations
of near-edge X-ray absorption fine structure with short-range corrected functionals. Physical
Chemistry Chemical Physics, 11(44):10350, 2009.
[52] S DeBeer-George, T Petrenko, and F Neese. Prediction of Iron K-Edge Absorption Spectra Using
Time-Dependent Density Functional Theory. Journal Of Physical Chemistry A, 112:12936–
12943, 2008.
[53] G Capano, T J Penfold, N A Besley, C J Milne, M Reinhard, H Rittmann-Frank, P Glatzel,
Rafael Abela, U Rothlisberger, M Chergui, and I Tavernelli. The role of Hartree-Fock exchange
in the simulation of X-ray absorption spectra: A study of photoexcited [Fe(bpy)3]2+. Chemical
Physics Letters, 580:179–184, 2013.
[54] T J Penfold, S Karlsson, G Capano, F A Lima, J Rittmann, M Reinhard, M H Rittmann-
Frank, O Braem, E Baranoff, Rafael Abela, I Tavernelli, U Rothlisberger, C J Milne, and
M Chergui. Solvent-Induced Luminescence Quenching: Static and Time-Resolved X-Ray
Absorption Spectroscopy of a Copper(I) Phenanthroline Complex. The Journal of Physical
Chemistry A, 117(22):4591–4601, 2013.
[55] Munetaka Iwamura, Satoshi Takeuchi, and Tahei Tahara. Ultrafast excited-state dynamics of
copper (i) complexes. Accounts of chemical research, 48(3):782–791, 2015.
[56] Bret Jackson and Horia Metiu. An examination of the use of wave packets for the calculation of
atom diffraction by surfaces. The Journal of chemical physics, 82(12):5707–5716, 1985.
[57] DC Koningsberger, BL Mojet, GE Van Dorssen, and DE Ramaker. XAFS spectroscopy;
fundamental principles and data analysis. Topics in catalysis, 10(3):143–155, 2000.
[58] T J Penfold, I Tavernelli, C J Milne, M Reinhard, A El Nahhas, Rafael Abela, U Rothlisberger,
and M Chergui. A wavelet analysis for the X-ray absorption spectra of molecules. The Journal
of Chemical Physics, 138(1):014104, 2013.
[59] JJ Rehr and RC Albers. Theoretical approaches to x-ray absorption fine structure. Reviews Of
Modern Physics, 72(3):621–654, 2000.
[60] Gyorgy Vanko, A Bordage, P Glatzel, E Gallo, M Rovezzi, W Gawelda, A Galler, C Bressler,
G Doumy, A M March, E P Kanter, L Young, S H Southworth, S E Canton, J Uhlig,
G Smolentsev, V Sundstrom, K. Haldrup, T B van Driel, M. M. Nielsen, K S Kjær, and H. T.
Lemke. Spin-state studies with XES and RIXS: From static to ultrafast. Journal Of Electron
Spectroscopy And Related Phenomena, 188:166–171, 2013.
[61] Frank de Groot. High-Resolution X-ray Emission and X-ray Absorption Spectroscopy. Chemical
Reviews, 101(6):1779–1808, 2001.
[62] F De Groot and A Kotani. Core Level Spectroscopy of Solids. CRC Press, 2008.
Probing Wavepacket Dynamics using Ultrafast X-ray Spectroscopy 20
[63] MO Krause. Natural widths of atomic K and L levels, Ka X-ray lines and several KLL Auger
lines. J Phys Chem Ref Data, 1979.
[64] W Gawelda. Time-resolved x-ray absorption spectroscopy of transition metal complexes. EPFL
Thesis, pages 1–307, November 2006.
[65] Christian Bressler and Majed Chergui. Ultrafast X-ray absorption spectroscopy. Chemical
Reviews, 104:1781–1812, 2004.
[66] J. Szlachetko, M Nachtegaal, E de Boni, M Willimann, O Safonova, J Sa, G Smolentsev,
M. Szlachetko, J. A. van Bokhoven, J. Cl. Dousse, J Hoszowska, Y Kayser, P Jagodzinski,
A Bergamaschi, B Schmitt, C David, and A Lucke. A von Hamos x-ray spectrometer based on a
segmented-type diffraction crystal for single-shot x-ray emission spectroscopy and time-resolved
resonant inelastic x-ray scattering studies. Review Of Scientific Instruments, 83(10):103105,
2012.
[67] Anne Marie March, Tadesse A Assefa, Christian Bressler, Gilles Doumy, Andreas Galler, Wojciech
Gawelda, Elliot P Kanter, Zoltan Nemeth, Matyas Papai, Stephen H Southworth, et al.
Feasibility of valence-to-core x-ray emission spectroscopy for tracking transient species. The
Journal of Physical Chemistry C, 2015.
[68] Uwe Bergmann and Pieter Glatzel. X-ray emission spectroscopy. Photosynthesis research, 102(2-
3):255–266, 2009.
[69] John D Bozek. Amo instrumentation for the lcls x-ray fel. The European Physical Journal-Special
Topics, 169(1):129–132, 2009.
[70] Massimo Altarelli, R Brinkmann, M Chergui, W Decking, B Dobson, S Dusterer, G Grubel,
W Graeff, H Graafsma, J Hajdu, et al. The european x-ray free-electron laser. Technical
Design Report, DESY, 97:2006, 2006.
[71] R. Mitzner, J. Rehanek, J Kern, S Gul, J. Hattne, T. Taguchi, R Alonso-Mori, R Tran, C
Weniger, H. Schrder et al. L-edge X-ray absorption spectroscopy of dilute systems relevant
to metalloproteins using an X-ray free-electron laser. In Journal of Physical Chemistry Letters,
4:3641–3647, 2013
[72] A Cannizzo, C J Milne, C Consani, W Gawelda, Ch Bressler, F van Mourik, and M Chergui. Light-
induced spin crossover in Fe(II)-based complexes: The full photocycle unraveled by ultrafast
optical and X-ray spectroscopies. In Coordination Chemistry Reviews, 254:2677–2686, 2010.
[73] W Gawelda, V T Pham, R M van der Veen, D Grolimund, Rafael Abela, M Chergui, and C Bressler.
Structural analysis of ultrafast extended x-ray absorption fine structure with subpicometer
spatial resolution: Application to spin crossover complexes. The Journal of Chemical Physics,
130(12):124520, 2009.
[74] K. Haldrup, G Vanko, W Gawelda, A Galler, G Doumy, A M March, E P Kanter, A Bordage,
A Dohn, T B van Driel, K S Kjær, H. T. Lemke, S E Canton, J Uhlig, V Sundstrom, L Young,
S H Southworth, M. M. Nielsen, and C Bressler. Guest–Host Interactions Investigated by
Time-Resolved X-ray Spectroscopies and Scattering at MHz Rates: Solvation Dynamics and
Photoinduced Spin Transition in Aqueous Fe(bipy)2+3 . The Journal of Physical Chemistry A,
116(40):9878–9887, 2012.
[75] Cristina Consani, Mirabelle Premont-Schwarz, Amal ElNahhas, Christian Bressler, Frank van
Mourik, Andrea Cannizzo, and Majed Chergui. Vibrational Coherences and Relaxation in
the High-Spin State of Aqueous [FeII(bpy)3]2+. Angewandte Chemie International Edition,
48(39):7184–7187, 2009.


