

PRODUCTION AND MARKETING SYSTEMS OF SHEEP AND GOATS IN ALABA,
SOUTHERN ETHIOPIA
MSc THESIS
TSEDEKE KOCHO KETEMA
UNIVERSITY OF HAWASSA, AWASSA
APRIL, 2007

PRODUCTION AND MARKETING SYSTEMS OF SHEEP AND GOATS IN ALABA,
SOUTHERN ETHIOPIA
TSEDEKE KOCHO KETEMA
A THESIS SUBMITTED TO THE
DEPARTMENT OF ANIMAL AND RANGE SCIENCES,
AWASSA COLLEGE OF AGRICULTURE, SCHOOL OF GRADUATE STUDIES
HAWASSA UNIVERSITY
AWASSA, ETHIOPIA
IN PARTIAL FULFILLMENT OF THE
REQUIREMENTS FOR THE
DEGREE OF
MASTER OF SCIENCE IN ANIMAL SCIENCES
(SPECIALIZATION: ANIMAL PRODUCTION)
APRIL, 2007

APPROVAL SHEET 1 OF THE THESIS
SCHOOL OF GRADUATE STUDIES
HAWASSA UNIVERSITY
This is to certify that the thesis entitled Production and Marketing Systems of Sheep and Goats
in Alaba, Southern Ethiopia, submitted in partial fulfillment of the requirements for the degree
of masters of sciences in Animal Sciences with specialization in Animal Production of the
graduate program of the Department of Animal and Range Sciences, Awassa college of
Agriculture, and is a record of original research carried out by Tsedeke Kocho Ketema ID No
AWR/3007/97 under my supervision, and no part of the thesis has been submitted for any
other degree or diploma.
The assistance and help received during the course of this investigation have been duly
acknowledged. Therefore I recommend that it be accepted as fulfilling the thesis requirements.
Dr. Girma Abebe ------------------------------- -------------------
Name of major advisor Signature Date
Dr. Ayele Taye --------------------------------- -------------------
Name of co-advisor Signature Date
Dr. Azage Tegegne --------------------------------- -------------------
Name of co-advisor Signature Date
Dr. Berhanu Gebremedhin --------------------------------- -------------------
Name of co-advisor Signature Date

APPROVAL SHEET 2 OF THE THESIS
SCHOOL OF GRADUATE STUDIES
UNIVERSITY OF HAWASSA
We, the undersigned members of the Board of Examiners of the final open defense, by
Tsedeke Kocho Ketema have read and evaluated his thesis entitled “Production and Marketing
Systems of Sheep and Goats in Alaba, Southern Ethiopia” and examined the candidate. This is
therefore to certify that the thesis has been accepted in partial fulfillment of the requirements
for the degree of: Master of Science in Animal Sciences with specialization in Animal
Production, Awassa College of Agriculture.
………………………. ……………………… ……………………. Name of the Chairman Signature Date ………………… ……………………… ……………………… Name of Major Advisor Signature Date ………………… ………………………. …………………………… Name of Co-Advisor Signature Date ………………… ………………………. …………………………… Name of Co-Advisor Signature Date ………………… ………………………. …………………………… Name of Co-Advisor Signature Date …………………. …………………………. …………………………. Name of Internal Examiner Signature Date ……………………….. ……………………… ……………… Name of External Examiner Signature Date Final approval and acceptance of the thesis is contingent upon the submission of the final copy
of the thesis to the Council of Graduate Studies (CGS) through the Department Graduate
Committee (DGC) of the candidate’s major department.
iii
ACKNOWLEDGMENTS
God, Your eternal mercy, love and protection through Your Son Lord Jesus Christ made all this possible and
“I will praise You, O Lord, with my wholeheart” (Psalm 9:1).
I would like to express my sincere gratitude and heartfelt thanks to my major advisor, Dr.
Girma Abebe, UH, for his meticulous guidance and couragement throughout the study period.
His continuous urge to appropriately recognize the smallholder circumstances were very
crucial all over the study period. I’m also thankful to my co-advisor Dr. Ayele Taye, UH, for
his readily available supports. My co-advisors, Dr. Azage Tegegne and Dr. Berhanu
Gebremedhin, IPMS/ILRI provided thought provoking comments and insightful suggestions
and I’m enthusiastic to them. Dr Azage was the key person to obtain the financial grant and
again I’m indebted to him.
My thanks are due to Improving Productivity and Market Success (IPMS/ILRI) project for the
financial and facility supports to the study. My thanks are also due to Areka Agricultural
Research Center, Southern Agricultural Research Institute for granting me the study leave.
Alaba Special Woreda OoARD and Alaba PLW of IPMS project provided versatile supports
during the field data collection and are duly acknowledged.
Feyedu Fekadu, Esayas Petros, Meseret Arega, Teshome Yohannes, Ashebir Kedir, Temesgen
Demboba, Desalegn Teshome, Ibrahim Degu and Geremu Kedir conducted the household
survey and on-farm monitoring and are sincerely accredited. Kebele administrations and DAs
in the study sites provided immense assistances during the data collection and duly

iv
appreciated. Sheep and goat owning farmers shared us their time, thoughts and generosity and
I’m very grateful to them.
My thank goes to Muluhiwot Getachew of IPMS for her understanding and timely settlement
of budget and logistics. Abebe Shiferaw of IPMS at Alaba PLW provided valuable supports
and is duly acknowledged. Yasin Getahun of IPMS mapped the study area and market
locations and is duly recognized. I’m grateful to Asebech Eshete of ILRI InfoCenter for her
service as a bridge to ILRI’s documentations and for her sympathetic helps. My sincere thanks
goes to Yoseph Mekasha for his continuous advices and encouragements.
My several friends, colleagues and family, too many to list here, were behind my effort and
God bless you all! My dad Kocho Ketema and caring mama Almaz Dilbo inspired and
fulfilled all my needs all through my way and with love I thank you.

v
DECLARATION
I declare that this thesis is my original work and that all sources of material that are used for
this thesis have been duly acknowledged. This thesis have submitted in partial fulfillment of
the requirements for an MSc degree at the University of Hawassa and is deposited at the
university library to be made available to borrowers under rules of the library. I solemnly
declare that this thesis is not submitted to any other institution anywhere for the awards of any
academic degree, diploma, or certificate.
Brief quotations from this thesis are allowable with out special permission provided that
accurate acknowledgment of source is made. Request for this manuscript in whole or in part
may be granted by the head of the major department or the dean of the School of Graduate
Studies when in his or her judgment the proposed use of the material is in the interest of
scholarship. In all other instances, however, permission must be obtained from the Author.

vi
TABLE OF CONTENETS
ACKNOWLEDGMENTS ......................................................................................................... iii DECLARATION .........................................................................................................................v TABLE OF CONTENETS .........................................................................................................vi DEDICATION......................................................................................................................... viii LIST OF ACRONYMS/ABBREVATIONS ..............................................................................ix LIST OF TABLES.......................................................................................................................x LIST OF FIGURES/ILLUSTRATIONS ....................................................................................xi LIST OF TABLES/FIGURES IN THE APPENDIX ............................................................... xii ABSTRACT............................................................................................................................. xiii 1. INTRODUCTION ...................................................................................................................1 2. REVIEW OF LITERATURE ..................................................................................................3
2.1 Population and genetic diversity of sheep and goats in Ethiopia.......................................3 2.2 Importance of sheep and goat in smallholder systems.......................................................4
2.2.1 Special features of sheep and goats.............................................................................4 2.2.2 Contribution of sheep and goats to food security and household economy................5
2.3 Performances of smallholder sheep and goat production ..................................................7 2.3.1 Small ruminant production system .............................................................................7
2.3.1.2 Mixed crop-livestock farming system..................................................................8 2.3.1.2 Agro pastoral and pastoral system .......................................................................8
2.3.2 Flock productivity .......................................................................................................8 2.4 Description of smallholder sheep and goat production system..........................................9 2.5 Sheep and goat marketing system....................................................................................10
2.5.1 Structure and performance of small ruminant markets.............................................11 2.5.2 Marketing of small ruminant skins ...........................................................................15
3. MATERIALS AND METHODS...........................................................................................18 3.1 Description of the study area ...........................................................................................18 3.2 Agricultural production and vegetation of the area .........................................................20 3.3 Sampling procedure .........................................................................................................21 3.4 Household survey.............................................................................................................24 3.6 Data management and analysis ........................................................................................26 3.7 Statistical model...............................................................................................................28
4. RESULTS AND DISCUSSION ............................................................................................29 4.1 Sheep and goat production system...................................................................................29
4.1.1 Demographic and socio-economic characteristics of the households.......................29 4.1.1.1 Demographic characteristics ..............................................................................29 4.1.1.2 Household holdings in study sites......................................................................32 4.1.1.3 Land holding and land use systems....................................................................34 4.1.1.4 Livestock holding and composition ...................................................................35 4.1.1.5 Purpose of keeping sheep and goat ....................................................................41 4.1.1.6 Labor allocation and gender role in sheep and goat management .....................43
4.1.2 Sheep and goat husbandry practices .........................................................................45 4.1.2.1 Feed and water resources, seasonal availability and utilization.........................45 4.1.2.2 Sheep and goat health managements .................................................................54 4.1.2.3 Breed types and preference to sheep and goats..................................................59

vii
4.1.2.4 Sheep and goat breeding management...............................................................63 4.1.2.5 Productive and reproductive performances of sheep and goat ..........................64 4.1.2.6 Housing and management practices...................................................................69 4.1.2.7 Acquisition, disposal and culling practices of sheep and goats .........................74 4.1.2.8 Consumption of sheep, goats and their products ...............................................76 4.1.2.9 Sheep and goat skin production and preservation..............................................78 4.1.2.10 Extension services in sheep and goat production.............................................80 4.1.2.11 Institutions and innovations in sheep and goat production and marketing ......80
4.2 Sheep and goat marketing system....................................................................................82 4.2.1 Market participants ...................................................................................................82 4.2.2 Mode of marketing and price setting ........................................................................84 4.2.3 Household marketing ................................................................................................86
4.2.3.1 Purposes of sales ................................................................................................86 4.2.3.2 Types of animals marketed and their prices.......................................................87
4.2.4 Market locations and routes ......................................................................................89 4.2.5 Seasonality in marketing...........................................................................................92 4.2.6 Preferences of domestic markets to the local animals ..............................................94 4.2.7 Consumption patterns of individual and catering services .......................................96 4.2.8 Marketing infrastructures and price information ......................................................96 4.2.9 Sheep and goats skin marketing................................................................................98
4.4 Sheep and goats production and marketing: constraints and opportunities ...................100 4.4.1 Sheep and goat production constraints....................................................................100 4.4.2 Marketing constraints of sheep and goats and skin.................................................102 4.4.3 Opportunities...........................................................................................................105
5. SUMMERY AND CONCLUSIONS...................................................................................107 6. REFERENCES.....................................................................................................................112 APPENDICES .........................................................................................................................130 BIOGRAPHICAL SKETCH ...................................................................................................159

viii
DEDICATION
To my wholehearted uncle,
Paulos Dilbo
Whose incessant support, adore, care, schooling and fulfilling all my desires
beyond his capability shaped my life and enabled me to contribute this to farmers
akin our family.

ix
LIST OF ACRONYMS/ABBREVATIONS
ATVET = Agricultural Technical, Vocational and Educational Training colleges ANOVA = Analysis of Variances CACC = Central Agricultural Census Commission CCPP = Contagious Caprine Pleuropneumonia Cm = Centimeter CSA = Central Statistical Authority DA = Development Agents EARO = Ethiopian Agricultural Research Organization FAO = Food and Agriculture Organization of the United Nations, Rome GDP = Gross Domestic Product GOs = Governmental Organizations GIS = Geographical Information System GPS = Geographical Positioning System Ha = Hectare Hrs = Hours ILCA = International Livestock Center for Africa, Addis Ababa, Ethiopia ILRI = International Livestock Research Institute, Nairobi, Kenya IPMS = Improving Productivity and Market Success of Ethiopian Farmers Kg = Kilogram LW = Liveweight M a.s.l. = Meters above sea level MoA = Ministry of Agriculture of the Ethiopian Government MT = Metric Tones (MT) NGOs = Non Governmental Organizations OoARD = Office of Agriculture and Rural Development (Alaba Special Woreda) PLW = Pilot Learning Woreda RMA = Rapid Market Appraisals SARI = Southern Agricultural Research Institute SNNPRS = Southern Nations Nationalities and Peoples Regional State SPSS = Statistical Package for Social Sciences TLU = Tropical Livestock Unit (an animal of 250 kg LW) UNIDO = United Nations Industrial Development Organization UH = University of Hawassa US$ = United States (US) Dollar

x
LIST OF TABLES
Table 1: Socio-economic characteristics of households in the three studied sites of Alaba. ....30 Table 2: Average land and livestock holdings/household in the three studied sites..................33 Table 3: Land holding and land use systems of the households. ..............................................34 Table 4: Purposes of keeping sheep and goats. .........................................................................42 Table 5: Division of labor in sheep and goat managements......................................................44 Table 6: Available feed resources and use patterns. .................................................................47 Table 7: Reasons for tether feeding of sheep and goats. ...........................................................48 Table 8: Common local supplements offered to sheep and goats. .............................................50 Table 9: Reported reasons for feeds shortage. ..........................................................................51 Table 10: Time taken to travel to primary and secondary water sources.................................52 Table 11: Watering frequency of sheep and goats in dry seasons. ............................................53 Table 12: Major causes of sheep and goat mortality.................................................................55 Table 13: Mean and rate of mortality in sheep and goat flocks. ...............................................56 Table 14: Household preferences to sheep and goats................................................................60 Table 15: Linear measurements of mature sheep and goats......................................................62 Table 16: Productive and reproductive parameters of sheep and goat flocks...........................66 Table 17: Management practices of young, breeding and fattening flocks. ..............................71 Table 18: Selection of sheep and goats for castration and fattening.........................................72 Table 19: Desirable physical traits of sheep and goats for breeding and fattening. .................73 Table 20: Sheep and goat flock dynamics. .................................................................................75 Table 21: Main uses of sheep and goat skins.............................................................................79 Table 22: Sheep and goat development supportive interventions and institutions. ...................81 Table 23: Purposes of sale of sheep and goats. .........................................................................87 Table 24: Classes and sizes of household marketed flocks and their prices.............................88 Table 25: Percentage of households target seasonal festival markets. .....................................93 Table 26: Major constraints of sheep and goat production.....................................................101 Table 27: Sheep, goat and skin marketing constraints. ...........................................................103

xi
LIST OF FIGURES/ILLUSTRATIONS
Figure 1: Typical Ethiopian livestock market structure.............................................................14 Figure 2: Market channel of hides and skin in Ethiopia. ..........................................................17 Figure 3: The location of Alaba Special Woreda and studied Kebeles......................................19 Figure 4: Stratification and staging of study Kebeles and households. ....................................23 Figure 5: Total TLU holdings in the study sites. ........................................................................36 Figure 6: Flock structures of sheep and goats. ..........................................................................38 Figure 7: Normal distribution of adult flock weight. .................................................................62 Figure 8: Classes of sheep and goats sold for urgent income needs..........................................85 Figure 9: Geographical location of sheep and goat markets.....................................................90 Figure 10: Market chains of sheep and goats. ...........................................................................91

xii
LIST OF TABLES/FIGURES IN THE APPENDIX Appendix 1: Questionnaire. .....................................................................................................130 Appendix 2: Composition, structure, ownership and origin of livestock . ..............................145 Appendix 3: Correlation of major holdings in the overall study sites.....................................146 Appendix 4: Correlation of major holdings in the mixed flock site.........................................147 Appendix 5: Correlation of major holdings in the goat dominating site.................................148 Appendix 6: Correlation of major holdings in the sheep dominating site...............................149 Appendix 7: Seasonal calendar of sheep and goats feed resources and cropping..................150 Appendix 8: Major sheep and goat diseases. ..........................................................................151 Appendix 9: Mean monthly price of agricultural commodities in Alaba................................152 Appendix 10: Mean yearly price of agricultural commodities in Alaba. ...............................153 Appendix 11: Geographical locations of sheep and goat markets. .........................................154 Appendix 12: Census of livestock population data for Alaba. ................................................156 Appendix 13: Conversion equivalents of sub-Saharan Africa livestock into TLU . ................156 Appendix 14: Yearly sheep and goat skin production. ............................................................157 Appendix 15: Routes of flock entry and exit. ...........................................................................158

xiii
PRODUCTION AND MARKETING SYSTEMS OF SHEEP AND GOATS IN ALABA, SOUTHERN ETHIOPIA
BY: Tsedeke Kocho Ketema Major advisor Girma Abebe, PhD, University of Hawassa Co-advisors 1. Ayele Taye, PhD, University of Hawassa
2. Azage Tegegne, PhD, International Livestock Research Institute (ILRI) 3. Berhanu Gebremedhin, PhD, ILRI
ABSTRACT This study has undertaken to describe the sheep and goat production and marketing systems and identify constraints to and improvement options for smallholder farms of Alaba, southern Ethiopia. Results are based on survey of 150 sample households and rapid appraisal of major sheep and goat markets. Flock distribution and holdings in different parts of the woreda vary and thus the study sites were stratified into mixed sheep-goat flock, goat dominating and sheep dominating sites. Average family size of the study area was 6.7. Literacy of household heads accounts 30%. Across the sites, mean holdings of total land, grazing land, cattle, sheep, goat and equine numbers varied significantly (P<0.05) with the goat dominating site having higher values) than the others. With respect to livestock holdings above half of the total TLU was recorded in goat dominant site. The mean holding of 7.4 sheep (P<0.05) and 11.5 goats (P<0.05), respectively are higher in sheep and goat dominating sites. Sheep and goats are primarily kept for sale to generate cash and majorities (98.9%) of goat owners extensively milk their flock for household consumption. Sucking young (22.8% lambs; 26.7% kids) and breeding female (39.3% ewes; 39.4% does) dominate the flock. Respondents reported that grazing on crop stubble (13.4%), private pastures (13.3%) and road sides (13.2%), weeds (11.6%), tillers and fillers (8.9%) from crop fields, cut-and-carry of browse species and grasses (9.1%) and communal pastures (9.4%) are major feedstuffs of sheep and goats. Flock water are largely comes from rivers (Bilate and Dijo) (55.2%), artificial ponds (21.9%), trough and harvested water. Diseases and parasites cause significant (P<0.05) losses of flocks (34.6%). Rate of loss is higher in young (35.0% lambs; 35.5% in kids) and mothers (42.9% in ewes; 30.6% in does). Losses by predators is noticeably higher (P<0.05) in goat dominating site. Body conformation, physical characteristics (coat color, horn and tail), known local ecotypes and age are the major criteria household considers in selecting sheep and goats for castration and fattening. Smallholder farmers make fattening management targeting the seasonal holiday markets. Major destination of fattened flocks is the Addis Ababa market while young flocks to the export abattoirs. Addis Ababa consumers demonstrated high preferences to animals from study areas and evidently pay higher prices. This is largely exploitable opportunity for development of smallholder sheep and goat production. Flock production is constrained by outbreaks of disease and parasite, predators, feed and water shortage, lack of production technology and seasonality of markets. Interventions covering flock health, feed production and managements, water development, marketing, credits to build flock holdings, and extension supports delivering the necessary training and production technologies/inputs could help farmers to built their flock and improve productivity. KEY WORDS: Sheep, Goats, Smallholder farmers, Production systems, Marketing
systems, Constraints, Improvement options, Alaba, Southern Ethiopia

1
1. INTRODUCTION
Ethiopia’s vast sheep and goat population, estimated at 24 million and 22.3 million heads,
respectively (CSA, 2004) is found widely distributed across the different agro-ecological
zones of the country (EARO, 2000; Kassahun, 2004). Sheep and goats are owned by
smallholder farmers as an integral part of the livestock sub-sector (Tekelye and Kasali, 1992;
Workneh, 2000), and contribute to both subsistence and cash income generation (Shapiro,
1991; EARO, 2000; Ehui et al., 2000).
The human population density of SNNPR ranges from 4 to 9000 persons per km2 and is often
cited as the most densely populated area of the country. Half of the total population is confined
in the mid-and high-altitudes which comprise only 2.82% of the total regional land area.
Diverse and huge numbers of livestock with density up to 420 TLU/Km2 are also confined in
mid-and high-altitudes. Areas with high human and livestock population density practiced
intensive cultivation in which land for livestock is scarce (Regional Atlas, 2004). As a result,
grazing land occupies only about 13.3 percent of total land area (CACC, 2003).
As population pressure increases further and farm sizes decrease, the role of large ruminants
reduces and small ruminants that constitute less competition for arable land predominate
(Jahnke, 1982). Sheep and goats, kept in the vast geographical locations, diverse socio-
economic and cultural settings and a range of farming practices in the SNNPR play immense
role in the livelihoods of rural farms.
The lack of up-to-date and location-specific information on production and marketing systems
is often a major limitation to productivity and production improvement endeavors in sheep and

2
goats (Peters and Horpew, 1989; Ayele et al., 2003). To design improvement measures
relevant to specific systems and thereby properly respond to the growing domestic and foreign
sheep and goats requirements, systematic description of the production and marketing systems
is indispensable.
Alaba Special Woreda is one of the PLWs (Pilot Learning Woreda) of the IPMS (Improving
Productivity and Market Success) project (IPMS, 2005). The woreda has immense sheep and
goat population potential which is considerably higher than flocks in adjacent woredas
(Appendix 12) (CACC, 2003). The adjacent Badawacho and Kedida Gemila woredas are
remarkably known in sheep fattening and marketing. In Alaba, sheep and goats production is
an integral part of the farming systems and provides enormous contribution to the livelihood of
the smallholder farmers. Next to chicken, sheep and goats are the most important marketable
livestock. Thus, IPMS and the woreda OoARD have identified sheep and goats as potential
and priority commodity for improvement. However, information on the smallholder sheep and
goat production situations, marketing systems, production constraints, opportunities and
improvement options which are required for appropriate intervention are not available.
The main objective of this study was, therefore, to investigate the prevailing smallholder sheep
and goat production and marketing systems with the specific objectives:-
To assess the smallholder sheep and goat production system
To describe the sheep and goats and their skin marketing system
To identify sheep and goat production and marketing constraints and improvement
options
3
2. REVIEW OF LITERATURE
2.1 Population and genetic diversity of sheep and goats in Ethiopia
Domestic sheep (Ovis aries) and goats (Capra hiricus) are the first ruminants to be
domesticated between 10,000 and 6,000 BC in Southwestern Asia (Iran and Iraq). Ethiopia has
long been recognized as a gateway of genetic material from Asia to Africa, and its diverse
ecology served to further diversify and develop the genotypes it received (IBC, 2004). The
sheep and goat population of Ethiopia estimated at 24 million and 22.3 million, respectively
(CSA, 2004) is one of the largest and most diverse in Africa (EARO, 2000; Workneh et al.,
2004; Getinet et al., 2005). Sheep and goats, maintained virtually under the traditional
subsistence oriented management systems, constitute an important livestock component in all
ecological zones and agricultural systems in the country (EARO 2000; CACC, 2003).
In a national systematic breed survey, 11 phenotypically distinct indigenous goats (FARM
Africa, 1996) and 14 sheep (IBC, 2004; Workneh et al., 2004) populations have been
identified based on a combination of their morphological appearance and management
systems. Molecular characterization based on the traditionally recognized populations using
microsatellite reported eight goats (Tesfaye et al., 2006) and nine sheep (Solomon, 2006)
separate genetic entities or breeds in the country.
Indigenous sheep and goat genetic resources have developed specific adaptations to survive
and produce under adverse local environmental conditions (climatic stresses, poor quality feed,
seasonal feed and water shortage, endemic disease and parasite challenge) that make them
suitable for use in the traditional, low-external-input production system (IBC, 2004).

4
2.2 Importance of sheep and goat in smallholder systems
Sheep and goats are widely distributed and adapted to a wide range of environmental diversity
(EARO, 2000; Ibrahim, 1998). They are of great importance as major sources of livelihood
(Tembely, 1998) and contribute to the sustenance of landless, smallholder and marginal
farmers (Adugna, 1998) especially to the poor in the rural areas throughout the developing
countries (Devendra and Burns, 1983). Sheep and goats are very important for resource-poor
smallholder systems of rural Ethiopia due to their ease of management and significant role in
provision of food (protein, essential micro-nutrients: vitamin A, iodine, and iron) and
generation of cash income (Zelalem and Fletcher, 1993; Baars, 1998; Workneh, 1999; EARO
2000; Ewnetu et al., 2006). They serve as a living bank for many farmers, closely linked to the
social and cultural life of resource poor farmers (Workneh, 2000) and provide security in bad
crop years (Ehui et al. 2000).
2.2.1 Special features of sheep and goats
Sheep and goats are highly adaptable to a broad range of environments. Certain breeds of
sheep and goats are tolerant to diseases and parasites such as helminthosis (Rege, 1993). Sheep
and goats have short generation cycles and high reproductive rates which lead to high
production efficiency. Goats are more effective at grazing selectively and the efficiency of
converting feed into milk is higher than in other dairy animals (Winrock International, 1976
cited in Rege, 1993).
In smallholder production systems, sheep and goats are important as they require low initial
capital and maintenance costs, are able to use marginal land, produce milk and meat in readily

5
usable quantities, and easily cared for by most family members including women and children
(Ibrahim, 1998; Sinn et al., 1999). Small ruminants are prolific and need only short periods to
increase flock sizes after catastrophes or in periods of high prices and thus off-take rate can
respond to price increases (Ngategize, 1989).
The small size of sheep and goats has distinct economic, managerial, and biological
advantages. Low individual values mean a small initial investment and correspondingly small
risk of loss by individual deaths. They occupy little housing space, lower feed requirements,
and supply both meat and milk in quantities suitable for immediate family consumption, which
is important in view of lack of means of preservation (Ibrahim, 1998). For similar reasons,
Dinksew and Girma (2000) reported that sheep production is becoming a viable alternative for
urban production considered as a means to fulfill parts of home consumption and income
needs during severe shortage of cash.
2.2.2 Contribution of sheep and goats to food security and household economy
In terms of Tropical Ruminant Livestock Unit, sheep and goats represent only 13% of the
estimated total Ethiopian ruminant livestock population but contribute highly significant
product (EARO, 2000). Sheep and goats provide about 12% of the value of livestock products
consumed and 48% of the cash income generated at farm level, 46% of the value of national
meat production, 25% of the domestic meat consumption with production surplus, 58% of the
value of hide and skin production, 40% of fresh skins and hides production and 92% of the
value of semi-processed skins and hides (ILCA 1993; Zelalem and Fletcher, 1993).
6
The annual national mutton and goat meat production is 78 and 62 thousand MT, respectively,
largely because of the high average off take rates estimated to be about 35% for sheep and
38% for goats (Workneh, 2006). Sheep and goats, respectively, contribute some 20.9% and
16.8% of the total ruminant livestock meat output or about 13.9% and 11.2% of the total
domestic meat production, with a live animal and chilled meat export surpluses. Per capita
consumption of sheep and goat meat (kg/person per year) in Ethiopia is 2.1 kg (EARO, 2000).
The share of small ruminants to the total milk output is estimated at 16.7% with the major
production coming from goats (ILCA, 1991).
From the total 14 million sheep and 13 million goat skins produced annually, 95% of the sheep
and 70% of the goatskin is recovered at the market (Zewdu, 1998; Ahmed, 2000). Sheep and
goats skin together make about 40% of the total fresh skin and hides production and 92% of
the value of semi-processed skins and hides export trade (Zewdu, 1998; Ahmed, 2000). The
export value of sheep/lamb skins during 1995-1996 amounted to be about 82 million US$
(EARO, 2000). The total export value from small ruminants in the form of meat and live
animals during a 2 years period (1995-1996) is estimated to be about 4.6 million US$. Manure
of sheep and goats is mostly dried and used primarily for household fuel or sold for cash on
the market and to a lesser extent to fertilize cropland (EARO, 2000).
Farmers use sheep and goats as savings that generate cash when the environment is harsh, e.g.
during drought years and are sold to raise money to replace large ruminants lost during
droughts (spreading risk). Sheep and goats also meet social and cultural needs (e.g. payment
of dowry, celebrations and gifts to family members) (Ibrahim, 1998). Sheep and goats are
considered as investment and insurance to provide income to meet seasonal purchases of food,

7
improved seed, fertilizer and medicine during seasons of crop failure and drastic drop of crop
prices for rural households (Berhanu, 1998). Given these advantages sheep and goats are found
in many smallholder settings as an integral component of the farming system (Ngategize,
1989) enhancing the sustainability of the system (Ibrahim, 1998).
2.3 Performances of smallholder sheep and goat production
Collecting and analyzing data on economically important performance traits and management
practices under defined production conditions makes it possible to identify production
prospects, as well as different management variables and their effects on the production
process (Peters and Horpew, 1989). The testing of innovation and monitoring on farms
requires the description of existing management practices, ownership patterns and estimation,
in general terms, of flock structure, reproductive and productive parameters (Agyemang et al.,
1985; Woubshet and Anderson, 1990).
2.3.1 Small ruminant production system
Livestock production system and the relative importance and potential for increased
production by livestock species in varied areas differ markedly due to differences in resource
endowment, climate, population, disease incidence, level of economic development, research
support and government economic policies (Beets et al., 1990). In Ethiopia, sheep and goats
are maintained under two broad production systems (Tembely, 1998; EARO, 2000).

8
2.3.1.2 Mixed crop-livestock farming system
In the central highlands of Ethiopia small ruminants depend mostly on grazing fallow lands,
overgrazed natural pasture and crop residues usually with no extra-supplement and receive
minimum health care. Farmers maintain one to three rams (depending on the size of the flock)
for year round breeding (Tembely, 1998). Productivity is low and is under nutritional stress for
much of the year due to cropping intensity. Sheep carry heavy internal and external parasite
burdens (EARO, 2000).
2.3.1.2 Agro pastoral and pastoral system
Small ruminant production is associated with the purely livestock based nomadic and
transhumance pastoral production systems based largely on range, primarily using natural
vegetation. In the lowlands of Ethiopia, livestock is comprised of large flocks and herds of
sheep and goats, cattle and camels mainly transhumants, where only surplus are sold at local
markets or trekked to major consumption centers. Extensive livestock keeping is the backbone
of the economies of the lowlands (Tembely, 1998; EARO, 2000).
2.3.2 Flock productivity
Livestock production system in Ethiopia is generally subsistence-oriented and productivity of
small ruminants is very low. Reproductive performance is generally low with annual lambing
and kidding rates of 1.2 for ewes and 1.5 for does. Growth rate in indigenous sheep and goats
is low and drops dramatically from about 100g/day at the earlier stage of growth to less than
50g/day after weaning (EARO, 2000). Caracas weight of small ruminants is on average 10 kg
with annual meat production barely more than 3-3.5 kg/year/animal (EARO, 2000). The major
9
cause for the low meat yield is the slaughter of immature animals with low body weights;
estimated at about 18-20 kg for sheep and 16-18 kg for goats. The average annual growth rate
in the population and meat yield of small ruminants has remained stagnant over the years.
Annual milk production from indigenous goats is 149 thousand tones (ILRI, 2000) with less
than 0.5 kg/day/animal during early lactations (EARO, 2000). Per capita consumption of sheep
and goat meat is 2.8 kg/person per year with annual growth rates with declining rates of -2.77
(ILRI, 2000).
2.4 Description of smallholder sheep and goat production system
The performance of the livestock sector in Africa has been poor due to failure to design
projects and technologies widely applicable to the problems commonly confronted (ILCA,
1990). This basically stemmed from failure to understand the situation of the small
farmer/pastoralist. The knowledge of the factors which influence production decisions at the
farm level has been inadequate. Description of the production systems is useful in the design
of development strategies, in particular for identifying target populations and priorities and
opportunities for development (Fernandez-Rivera et al., 2004).
Attempts to improve the prevailing animal husbandry systems in the rural settings necessitate a
better understanding of the components of the production systems and its operations, the
present limitation, potentially feasible improvements and the opportunities to develop more
productive system (Adugna, 1998). A detailed comprehensive database on traditional
smallholder animal enterprises, aspects of the household, animal management and husbandry
practices, the constraints to production and the interaction of animal farming with other

10
farming activities would help to identify the major gap to be filled by research, extension and
other animal development projects (Woubshet and Anderson, 1990; Berhanu, 1998).
Development strategies should be geared to address farmers’ real problems and constraints to
help them expand their production and attain self-sufficiency. This, in turn, requires careful
and detailed analysis and understanding of farmers’ circumstances and practices before
carrying out development activity (Berhanu, 1998; Abebe et al., 2000). This, unlike the one-
size-fits-all strategy (Ehui et al., 2002), provides information on location-specific production
conditions and improvement options appropriate to particular systems (Peters and Horpew,
1989; Abebe et al., 2000).
2.5 Sheep and goat marketing system
Marketing includes moving products from producers to consumers and comprises exchange
activities of buying and selling, the physical activities designed to give the product increased
time, place and form utility, and the associated functions of financing, risk bearing and
dissemination of information to participants in the marketing process (Jabbar et al., 1997).
Livestock marketing involves the sale, purchase or exchange of products such as live animals,
and livestock products of milk, meat, skins, wool and hides for cash or goods in kind (ILCA,
1990).
The ultimate goal of interventions aimed at enhancing productivity of sheep and goats needs to
consider the market aspect simultaneously (Andargachew and Ray, 1992). Farmers need to be
aware of the preferred characteristics of animals as well as price patterns so that they can plan
breeding and fattening programmes and breed selection consistent with the best seasonal prices
11
and consumers' preferences (Peters and Horpew, 1989; Ehui et al., 2000). Alleviating
constraints to the export market and domestic trade and market structure increases the welfare
of smallholder producers, urban consumers and improves the national balance of payments
(Ayele et al., 2003).
Population growth, urbanization and income growth fuel increases in meat and milk
consumption and create a veritable Livestock Revolution (Delgado et al., 1999). This
revolution presents new and expanding market opportunities for smallholder livestock
producers (Lapar et al., 2002). On the other hand, whether smallholders are able to participate
and compete in the domestic and global markets is a critical question (Lapar et al., 2002).
Potential production and market opportunities for small ruminant meat have not been exploited
because of scant knowledge of small ruminant demand patterns (Ehui et al., 2000). An
important aspect of production and its response to demand and supply is knowledge of markets
and marketing systems. To shift production from subsistence to a more commercial outlook is
especially important to describe and intervening aspects of marketing infrastructure and
facilities, market channels and outlets, buyer preferences for live animals and their meats,
major market players, government intervention and role of the private sector (Devendra,
2007).
2.5.1 Structure and performance of small ruminant markets
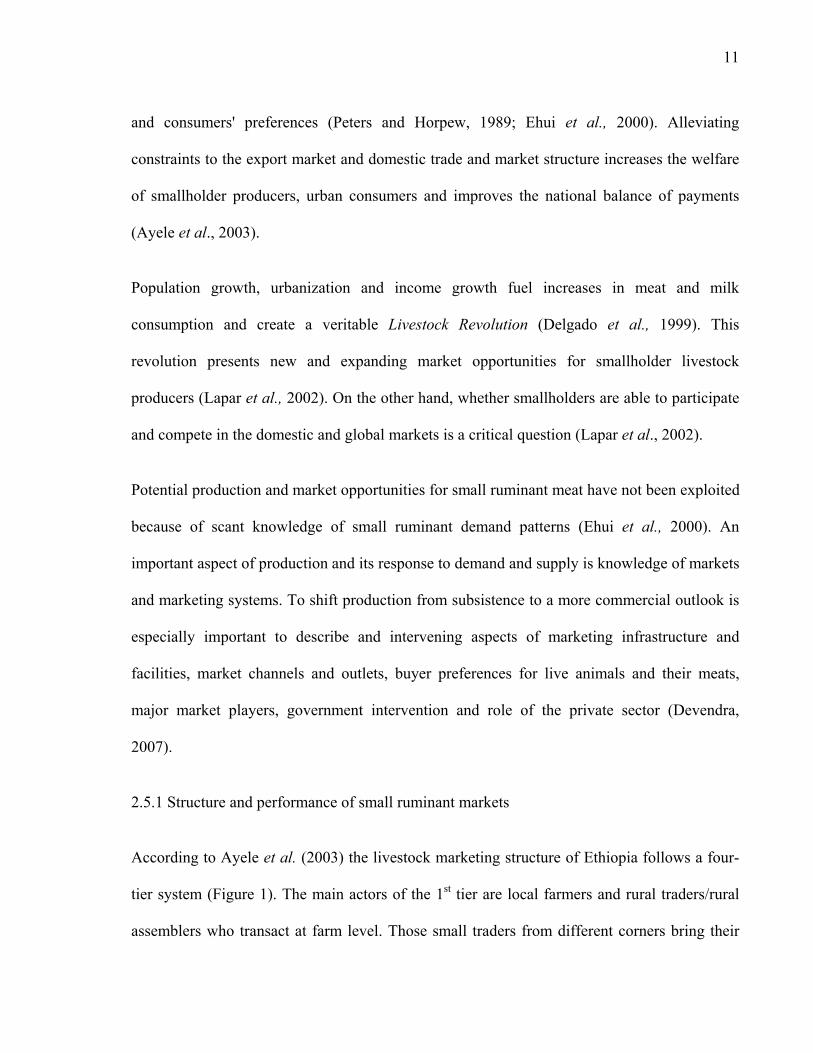
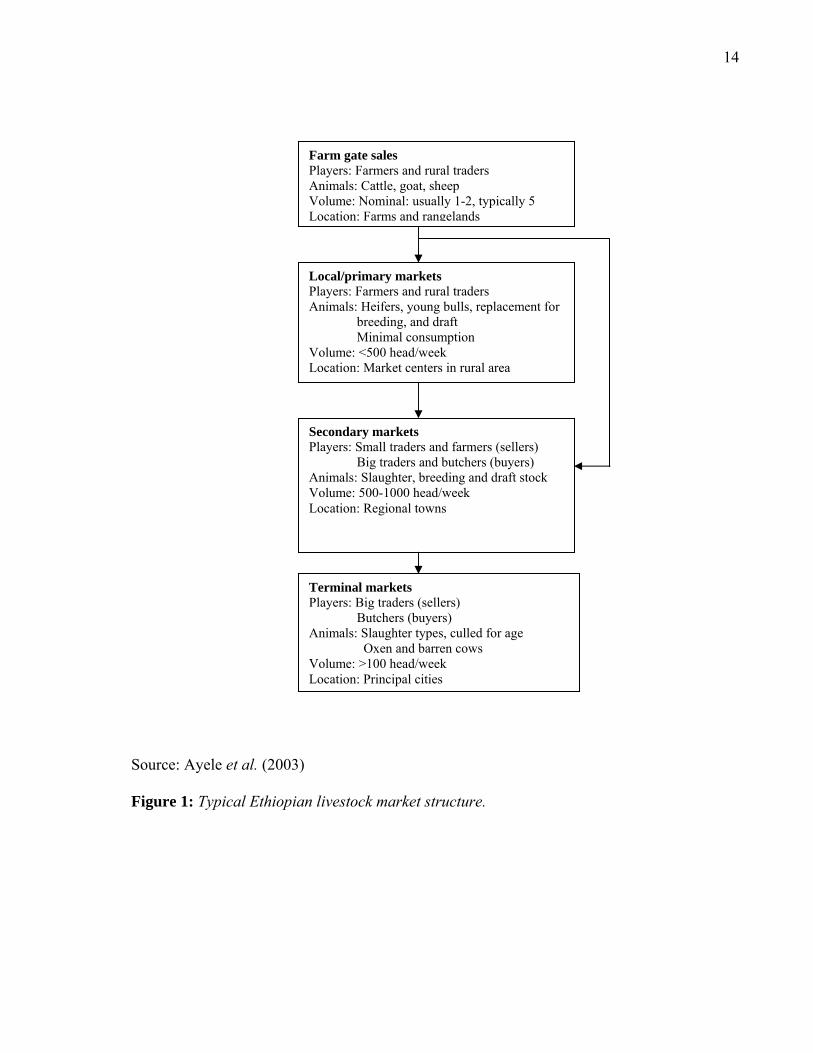
According to Ayele et al. (2003) the livestock marketing structure of Ethiopia follows a four-
tier system (Figure 1). The main actors of the 1st tier are local farmers and rural traders/rural
assemblers who transact at farm level. Those small traders from different corners bring their

12
animals to the local market (2nd tier). Traders/wholesalers purchase a few large animals or a
fairly large number of small animals for selling to the secondary markets. In the secondary
market (3rd tier), both smaller and larger traders operate and traders (wholesalers or retailers)
and butchers from terminal markets come to buy animals. In the terminal markets (4th tier), big
traders and butcher (wholesalers or retailers) transact larger number of mainly slaughter type
animals. Consumers get meat through purchase of the animals from terminal markets and
slaughters at home or they may get meat from markets or they may access from butchers who
process the meat via abattoirs.
Livestock markets are generally under the control of local authorities. Market locations in
primary and secondary markets are usually not fenced; there are no permanent animal routes
and no feed and watering infrastructures. Yet buyers and sellers are subjected to various
service charges by the local authorities as well as other bodies (Ayele et al., 2003).
Market information is crucial to producers, wholesalers and consumers to help them make
decisions on what and whether to buy and sell. In general, information is required on prices,
traded or available quantities, forecasts of future supplies and demand, and general market
conditions. Information must be relevant, accurate and timely and reflect all sectors of the
market, especially consumer demand (ILRI, 1995). Nearly in all parts of the country, there is
no regular market information on prices and supplies, nor formalized grades and standards of
sheep and goats and other livestock (Kebede and Ray, 1992; Ayele et al., 2003). Markets are
dispersed with remote markets lacking price information. Generally, there is excess supply of
animals beyond demands which effectively suppresses producer prices since the more mobile
13
trader is better informed on market prices, while better information combined with excess
supply places the trader in a better position during price negotiation.
Livestock are generally traded by ‘eye-ball’ pricing, and weighing livestock is uncommon.
Animals are sold on a per-head basis and price agreement reached by a long one-on-one
bargaining between a seller and a buyer. Under such circumstances, prices paid will reflect
buyers' preference for various animal characteristics (weight, sex, age, condition, breed, color),
the purpose of animals purchased (for resale, slaughter, fattening or reproduction), the season
of the year (occurrence of religious and cultural festivals) and the bargaining skills of buyers
and sellers (Kebede and Ray, 1992; Jabbar, 1998; EARO, 2000; Ehui et al., 2000; Ayele et al.,
2003).
Marketing of sheep and goats is characterized by strong seasonality and subject to fluctuation.
Demand and price increases during festival periods. Factors affecting market supply, as
measured by the number offered, include high demand during religious festivals, lambing season,
quality and quantity of grazing, as well as cash needs for crop inputs and, later, for food purchase
before harvesting (EARO, 2000).
It is essential to consider linking production, products and by-products to markets in the
context of the production to consumption systems in the 'food or commodity system
framework' or commodity production and marketing chain (Schaffer, 1973 and 1980 cited in
Jabbar et al., 1997; Devendra, 2007). Recognition of this chain ensures promotion of the
interdependence between the production resources, producer, processor and consumer (Jabbar
et al., 1997; Devendra, 2007). Associated with the production to consumption markets is the
need for a proactive agribusiness orientation (Devendra, 2007).
14
Source: Ayele et al. (2003)
Figure 1: Typical Ethiopian livestock market structure.
Farm gate sales Players: Farmers and rural traders Animals: Cattle, goat, sheep Volume: Nominal: usually 1-2, typically 5 Location: Farms and rangelands
Local/primary markets Players: Farmers and rural traders Animals: Heifers, young bulls, replacement for
breeding, and draft Minimal consumption
Volume: <500 head/week Location: Market centers in rural area
Secondary markets Players: Small traders and farmers (sellers) Big traders and butchers (buyers) Animals: Slaughter, breeding and draft stock Volume: 500-1000 head/week Location: Regional towns
Terminal markets Players: Big traders (sellers) Butchers (buyers) Animals: Slaughter types, culled for age Oxen and barren cows Volume: >100 head/week Location: Principal cities

15
2.5.2 Marketing of small ruminant skins
In a production to consumption chain, attention also needs to be given to by-products (skins)
from meat production that have considerable economic value, but their collection, processing
and use are underestimated (Devendra, 2007). The livestock sub sector in Ethiopia makes a
significant contribution to export earnings-second only to coffee largely earned from hides and
skins, and leather (Steele, 1998; Zewdu, 1998) with the current development scenario in the
country. However, this trend might have changed and up-to-date statistics is not available.
Based on annual off-take rates of 30% for sheep and 36% for goats the potential of sheepskins
and goatskins production in 1998/99 is estimated to be 14 and 13 million US$, respectively
(ILRI, 2000). With the existing extensive network of traders and sub-agents of hides and skins
marketing system in Ethiopia (Zewdu, 1998), the amount of skins actually reaching the
central market and, eventually the tanneries, is reduced by about 5-10% for sheepskins and
about 30-40% for goatskin (Zewdu, 1998; Ahmed, 2000).
The raw material for the leather industry is mainly derived from local areas of the country
where basic amenities for slaughtering (slaughtering, ripping and flaying procedures) and
subsequent marketing are either non-existent or limited. Additional sources include slaughter
slabs, municipal slaughterhouse, the limited number of export abattoirs, and meat product
processing plants (Zewdu, 1998; Ahmed, 2000).
The lacks of price incentive to the primary producer, illegal cross-border trade, and
competition from rural tanners are impediments to the improvement of hides and skins
collection and quality. Defects including flay-cuts, putrification, improper shape, branding,

16
scratches, diseases and parasites, as well as storage and transport conditions, down-grade the
quality of the raw material. Subsequently, the leather and leather products are also affected
with the ultimate depressing effect on prices obtained locally as well as on the export market
(Zewdu, 1998; Ahmed, 2000).
The marketing of skins starts at the producer/consumer level and passes through a chain of
middlemen until it reaches the tanneries (Ahmed, 2000) (Figure 2). The marketing chain is
principal from primary producer (rural farmer and pastoralist) to rural markets; to small
dealers and agents/collectors; to town traders and shed owners (where the hides and skins are
frame-dried and/or wet-salted); to the big traders in Addis Ababa and finally to tanneries
(Zewdu, 1998; Ahmed, 2000).
The tanneries can be supplied directly from the slaughter premises, regional big traders or
Addis Ababa big traders as well. The tanneries process the skin received from their suppliers
either in the green (fresh), air-dried or wet salted states to semi-finished or finished stages for
both local and exports markets (Ahmed, 2000).

17
Source: Ahmed (2000).
Figure 2: Market channel of hides and skin in Ethiopia.
Individual Producers
Rural Slaughter Slabs
Municipal Slaughterhouses
Meat Processing Plants
Agents Collector
Addis Ababa Big Traders
Regional Small/Medium
Trader
Regional Big Trader
Local Tanner
Tanneries
Local Market Local Market Export Market

18
3. MATERIALS AND METHODS
3.1 Description of the study area
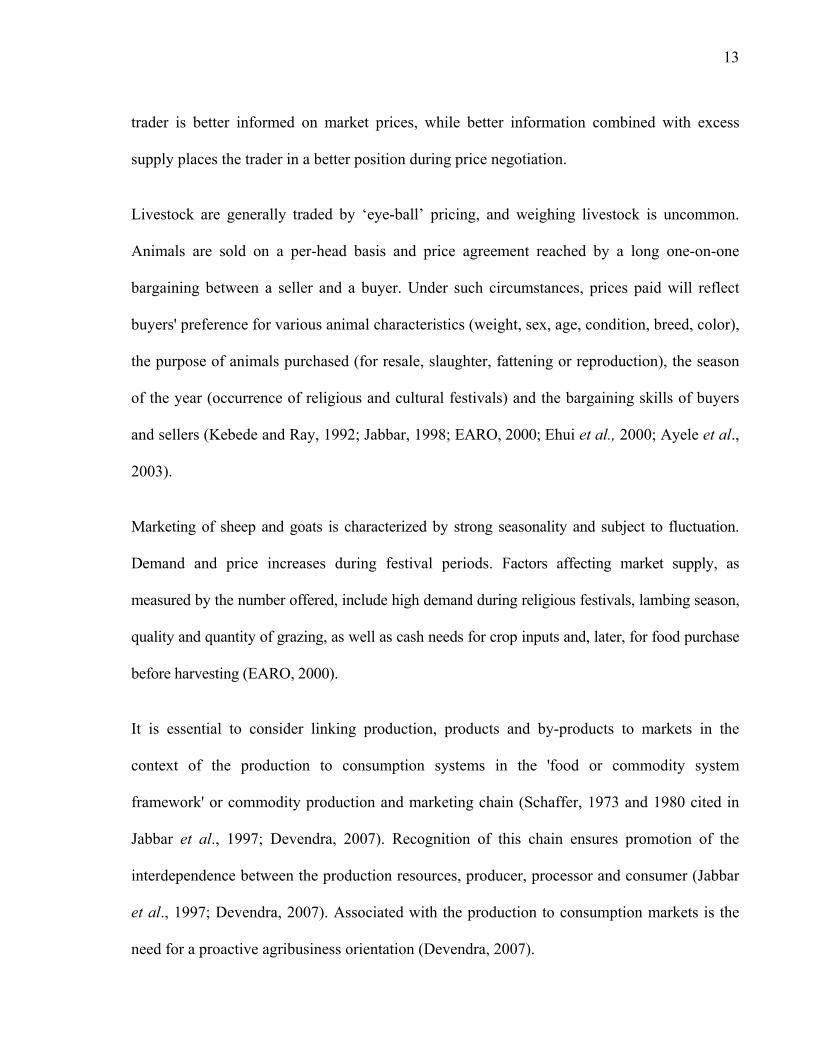
The study was conducted in Alaba Special Woreda (SNNPRS) is located 310 km south of
Addis Ababa and 85 km southwest of Awassa, the regional capital (Figure 3). The woreda is
located in 70 17’ N latitude and 38006’ E longitude. Altitude of the woreda ranges from 1554 to
2149 m a.s.l with majority found at about 1800 m a.s.l. Except for few hills, the woreda has
suitable land for agriculture in terms of topography.
Agro-ecology of the woreda is classified as dry to moist weina dega. The annual rainfall varies
from 857 to 1085 mm and occurs in a bimodal pattern with small rains between March and
April and main rains from July to September. The annual mean temperature varies from 17 0C
to 20 0C with a mean of 18 0C. The major soil types are Anosol (ferralic), Andosol (orthic),
Chromic Luvisols (orthic), Phaeozem (orthic) and Solonchak (orthic) (IPMS, 2005).
The woreda consists of 73 rural and 2 urban Kebeles. The total human population of the
woreda (in 2004/05) was 210,243 with 49.7% male and 50.3% female (IPMS, 2005). The total
number of rural households of the woreda is 35,719 among which 75% are men and 25% are
women headed. The total land area is 64,116.25 ha; out of these 75% is suitable for
agriculture. Land use of woreda shows 68.7% arable land, 6.7% grazing land, 7.2% forest,
5.7% potentially cultivable, 4.4% uncultivable land (hills) and 7.3% others.
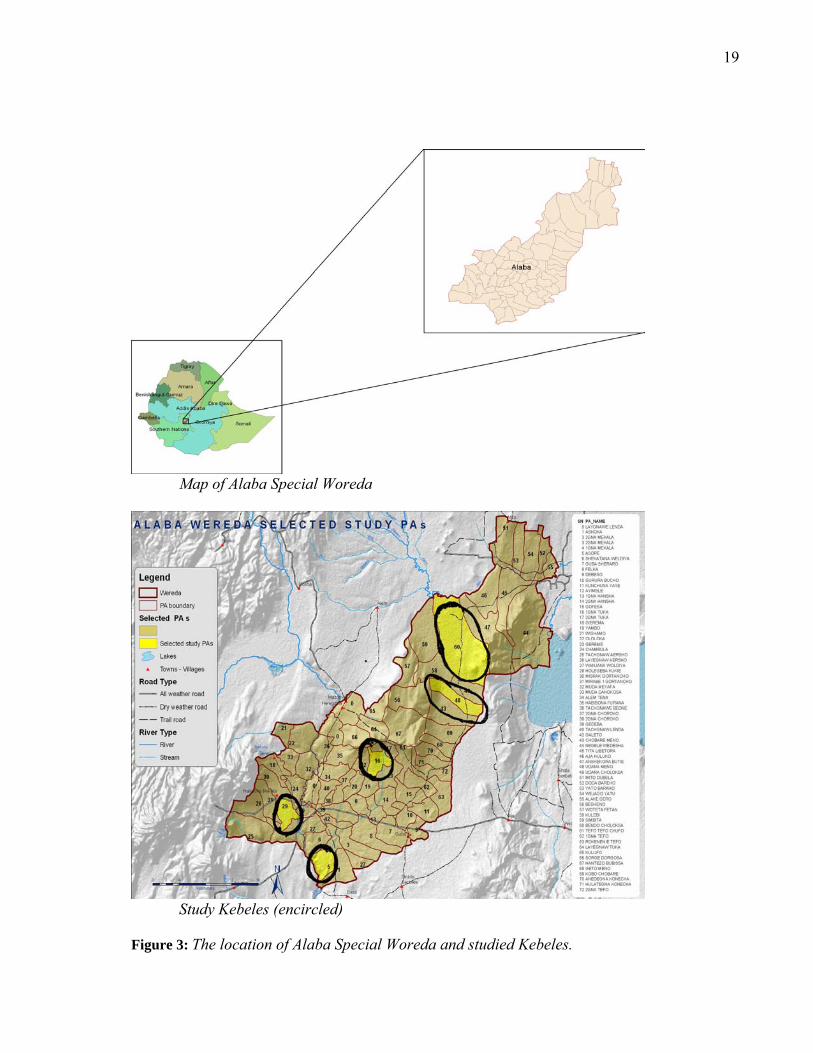
19
Map of Alaba Special Woreda
Study Kebeles (encircled)
Figure 3: The location of Alaba Special Woreda and studied Kebeles.

20
3.2 Agricultural production and vegetation of the area
Altitude, vegetation and soil of the woreda are fairly uniform and thus the use of these factors
to distinguish sub-farming systems in the woreda is not applicable. On the other hand, the
types of crops and livestock species differ in different parts of the woreda and this feature was
used to distinguish the sub-farming systems in the woreda. Accordingly, two farming systems
vis-à-vis the tef/haricot bean/livestock (43 rural Kebeles) and the pepper/livestock farming
system (30 rural Kebeles) were identified. Tef, haricot bean, sheep and cattle in the tef/haricot
bean/livestock system and pepper, wheat, goats, honey and cattle in the pepper/livestock
system were the dominant agricultural commodities produced and marketed (IPMS, 2005).
Maize, tef, wheat, pepper, haricot bean, sorghum and millet are major crops grown in the
Meher (March and April) and Belg (July to September) two cropping calendars. Cropping
totally depends on rainfall. On the other hand, the amount and reliability of rainfall in the
woreda is low and it is a major limiting factor for agricultural production. Due to the erratic
nature of rainfall, crops mostly fail in particular during the main planting season (Meher).
Crop failures occur almost every three years and the woreda is one of the most drought
affected areas in the region (IPMS, 2005).
Considerable sizes of animals are kept by smallholder farmers providing draught power,
income, food, manure, saving, and soci-economic functions. According to the recent CACC
(2003) census report, there are 161,566 cattle, 34,760 sheep, 43,141 goats, 2,583 horses,
27,661 donkeys, 2,346 mules, 221,342 poultry and 14,690 beehives in the woreda (Appendix
Table 12). Oxen are the major source of draught power. Use of donkey for transport of water
21
and farm goods is very common. Sheep and goats are an integral part of livestock playing
versatile roles in the smallholder systems. Animals kept are mostly indigenous breeds and
animals with exotic bloods constitute s few cross breed cattle (Holstein Friesian and Jersey
crosses) in urban and peri-urban dairying systems and exotic chicken distributed by OoARD.
Livestock are reared under extensive management and productivity is substantially low.
Vegetation cover of the woreda is low. Consequently, erosion hazards in the sloppy areas are
enormous. Some efforts of soil and water conservation over the last twenty years were
unsuccessful because of human intervention and unfavorable soil environments. The
commonly observed permanent tree species in the area includes Acacia species, Cordia
africana, Croton species and Eucalyptus species. These tree species are observed throughout
the woreda standing in a scattered pattern.
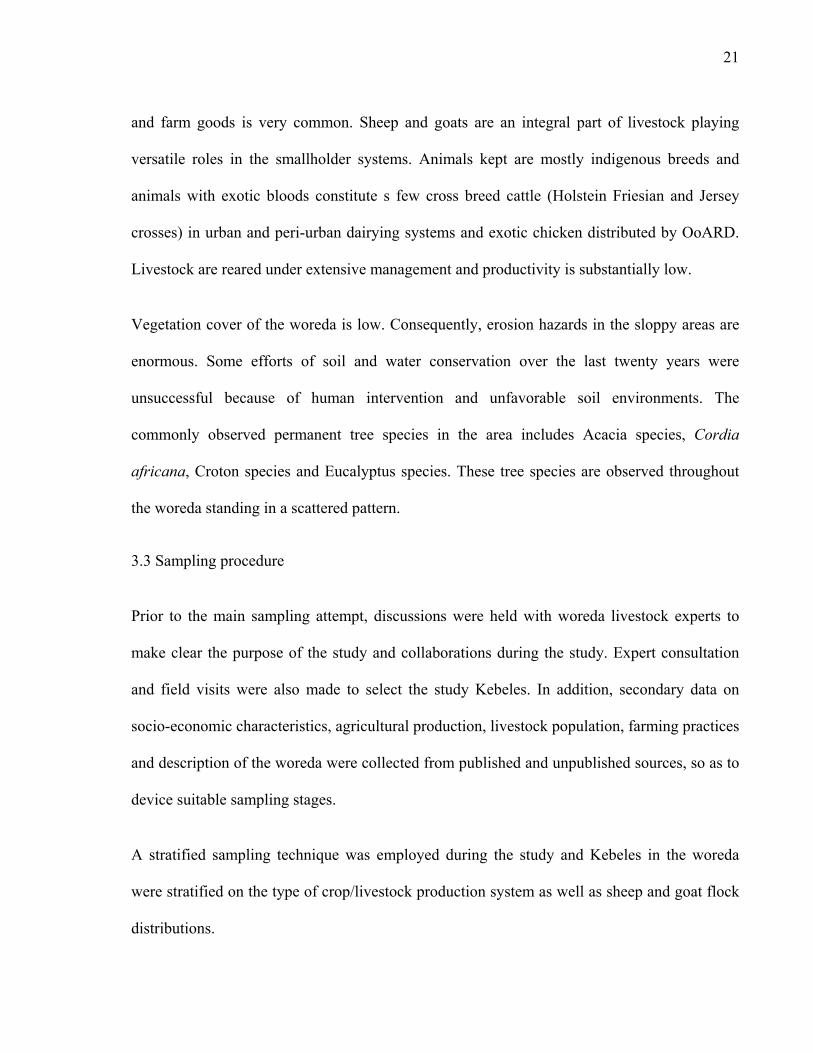
3.3 Sampling procedure
Prior to the main sampling attempt, discussions were held with woreda livestock experts to
make clear the purpose of the study and collaborations during the study. Expert consultation
and field visits were also made to select the study Kebeles. In addition, secondary data on
socio-economic characteristics, agricultural production, livestock population, farming practices
and description of the woreda were collected from published and unpublished sources, so as to
device suitable sampling stages.
A stratified sampling technique was employed during the study and Kebeles in the woreda
were stratified on the type of crop/livestock production system as well as sheep and goat flock
distributions.

22
Accordingly, based on the flock distribution, the study areas were stratified into sheep
dominating, goat dominating and sheep-goat mixed flock sites. Rural 1Kebeles (50.7%) with
relatively dense population and fragmented land holding, majority of which found in the
tef/haricot bean/livestock production system dominantly own sheep. These Kebeles are located
across the ‘Bilate river watersheds’ and towards boundaries of the Kambata and Hadiya
administrative zones (Figure 3). In the drier Kebeles (dry weina dega), northern parts of the
woreda across boundaries of the Silti administrative zone and the Oromiya regional state (Aje,
Alage), land holdings are generally large and goats are dominant. The majority (38.3%) of
these Kebeles are found within pepper/livestock system. As a third category, there were some
Kebeles (11.0%) that own reasonable crop and grazing lands and these keep sheep and goat
mixed flocks.
Proportionally, one Kebele from the sheep-goat mixed, two Kebeles from the sheep dominant
and two Kebeles from the goat dominant i.e., a total of five Kebeles with dry road accessibility
were selected (Figure 4).
Since the study was intended to describe the production situations, households who owned
flock of at least one breeding female and others were selected randomly to participate in the
household survey. Development agents (DAs) and Kebeles authorities listed the total
households who own the desired flock types and sizes in their respective Kebeles.
1 Kebeles (also called Peasant Association) is the lowest administrative unit in Ethiopia that consists of villages/gots and hundreds of households.
23
Figure 4: Stratification and staging of study Kebeles and households.
Based on this information, a total of 30 households were randomly selected from each of the
five selected Kebeles giving up 150 households.
Alaba Special woreda
(73 rural Kebeles)
Sheep flock dominating Kebeles
(37 Kebeles)
Kebeles goat flock dominating 8 Kebeles
2 Kebeles
30 households per Kebele and a total of 60 selected randomly
1 Kebele
2 Kebeles
30 households per Kebele and a total of 60 selected randomly
30 households
selected randomly
Proportional sheep and goat flock Kebeles (8 Kebeles)
Goat flock dominating Kebeles
(28 Kebeles)
1 Kebele

24
3.4 Household survey
Informal and formal survey tools were employed to gather information on sheep and goats
production and marketing details. Discussions using checklists were held with woreda
livestock experts, development agents and key informants in all the selected Kebeles to collect
relevant information on almost all aspects of livestock production in the woreda. Information
obtained from the discussions was used to prepare a structured questionnaire. The questions
were framed in such a way that farmers could provide information that is most recent and easy
to recall. The questionnaire covered various aspects of all species of livestock with more
details on sheep and goats production and marketing systems. The questionnaire was pre-
tested and then translated into Amharic (Appendix 1).
DAs (animal science graduates from ATVET colleges) working in the woreda who speak the
local Alabigna language were recruited, intensively trained and administered the questionnaire
to the 150 selected households under the close day-to-day supervision of the researcher.
Body weight and linear measurements of body length, heart girth and height at wither from
2adult males and females of 131 sheep and 104 goats in respective study Kebeles were taken
using weighing scale and tape meter to estimate adult weights and establish relationship
between body weight and the linear measurements.
2 Adult flock includes male and female flocks above sexual maturity and broken two and more pairs of milk teeth, but pregnant flock were not included

25
3.5 Rapid appraisal of marketing systems
Agricultural commodity prices including sheep and goat extending from 2000 to 2006 were
collected from the woreda Disaster Prevention and Preparedness Commission (DPPC) desk to
comprehend the price pattern of sheep, goats and other important local commodities over
years, seasons and months. Data on total skin production of over sixteen years (1991-2006)
were also collected from Desk of Livestock and Fisheries Development, OoARD to indicate
the skin production patterns over the years.
Rapid market appraisal (RMA) as outlined by Holtzman (2002) was employed to study the
marketing systems of sheep and goat in the woreda. Local traders, agents of export abattoirs,
terminal traders, export abattoirs, consumers and transporters were interviewed using
respective checklists.
All possible sheep and goat market chains to and from Alaba were identified. Geographical
Positioning System (GPS) (GARMIN® GPS72 2002-2003) readings of the market places were
taken and mapped using Geographical Information System (GIS). Seasonality of animals
supplied, demanded and prices were assessed. Alaba Kulito (in Alaba town) and Adilo market
(in neighboring town) were visited during major festivals and none-festival periods to
comprehend the types of animals marketed, volume of supplies, demands, prices, major
market participants and routes of animals to and from these markets. Preferences and
purchasing prices of consumers in Addis Ababa, the larger traditional consumer of animals
originated from the study areas were assessed during festival markets.

26
Butcher, hotel, restaurant and cafeteria owners providing catering services in the Alaba Kulito
town were interviewed regarding their consumption patterns, their preferences and uses of
sheep and goat meat, as well as preferences of their customers to mutton and goat meals.
Services and infrastructure facilities of all market places were observed. Collection, processing
and marketing operation of sheep and goat skins at Alaba Kulito legally registered skin
business centers were observed and assessed.
3.6 Data management and analysis
The survey and relevant secondary data were organized, summarized and analyzed using SPSS
statistical package (SPSS 12.0, 2003). Descriptive, chi-square, correlation, regression and one
way ANOVA (Zar, 1996) were employed in data analysis. Mean and percentage values of
various parameters were compared across the three studied areas of the woreda (mixed flock
site, goat dominating site and sheep dominating site). Accordingly, values of parameters that
differed significantly among the three studied areas were separately presented, whereas, in
case of parameters that did not differ among the three sites, values are combined and overall
estimates were reported for the woreda.
Data from household survey (most recent and easy to recall) were used to estimate mortality,
reproduction and offtakes of flocks for a period of time extending from November/December
2005 to November/December 2006. The following formulae were employed.
Overall mortality rates for particular age and sex structure of flocks (per sheep and goat):
Overall mortality rates (%) = Number of deaths per structure x 100 Number of stock within each structure

27
Overall mortality rates for the flock as a whole: Overall mortality rates (%) = Total deaths x 100 Total number of animal in flock Fertility = Number of females that gave birth x100%
Number of females exposed to males/mated Litter size/prolificacy = Number of offspring produced
Number of females that given birth Weaning rates = Number of offspring weaned x 100% Number of females exposed to males/mated Lambing/kidding rate (%) = Number of offspring produced x 100 Number of females exposed to males/mated Lamb/kid survival rate (%) = Number of offspring weaned x100% Number of offspring produced Annual reproductive rate (ARR) = 365 x litter size Days of lambing interval Gross offtake rate (%) = Gross offtake x 100 Total flock size Sale rate = Flock sales x 100 Total flock Net offtake rate (%) = Gross offtake – Acquisitions x 100 Total flock size Acquisition = Sum of purchases + exchanges or gifts Gross offtake in period (t) = sum of sales + slaughters + exchanges + gifts (t)

28
3.7 Statistical model
Wherever ANOVA test were employed, the following single factor ANOVA model was used.
Yij(i) = μ + τi + εij
Yij(i) = Production and marketing parameters
μ = Overall mean
i = 1, 2, 3 flock distribution sites
j(1) = 1, 2,…, 30 (Mixed flock site)
j(2) = 1, 2,…, 60 (Goat dominating site)
j(3) = 1, 2,…, 60 (Sheep dominating site)
εij = Random variation among individual subjects

29
4. RESULTS AND DISCUSSION
4.1 Sheep and goat production system
4.1.1 Demographic and socio-economic characteristics of the households
4.1.1.1 Demographic characteristics
Demographic characteristics of the households are presented in Table 1. All the interviewed
households belong to Alaba ethnic groups (100%) and are all Muslims (100%). The average
family size of the households was 6.7+0.18 (ranging from 2-13) and it is higher than the
average values at the national (5.2) and SNNPR (5.1) levels (CACC, 2003). This is attributed
to the common practice of polygamous marriages (26.8% two and 10.0% three wives) and low
awareness of family planning. The household size is comparable across the three studied sites
(P>0.05). Having many members of the family seems to be considered as an asset and security
in times of retirements. The family size is comparable to the value reported for Wolaita zone
(6.9) (Tsedeke and Endrias, 2006) and Umbulo-Wacha watershed of Boricha woreda, Sidama
zone (6.3) (Kebebe et al., 2006) but it is lower than 7.5 persons per household which, is
reported for Dale district of Sidama zone (Endeshaw, 2007).
Majority of the household heads (96%) are married and 57% of the household members were
males while 43% were females. The average age of the household husband and wife is
40.3+0.92 and 31.1+0.94 years, respectively. The majority (about 96%) of the households is
headed by men. In central highlands of Ethiopia, labor availability is higher for male-headed

30
Table 1: Socio-economic characteristics of households in the three studied sites of Alaba Special Woreda (Nov/Dec 2006). (Based on data from of the selected study households)
Mixed
flock site (n1=30)
Goat dom. site (n2=60)
Sheep dom. site (n3=60)
Overall (N=150)
Test
Descriptors Average(SE) Average(SE) Average(SE) Average(SE) F-value P-value
Family size
Age of household husband in years
Age of household wife in years
7.0(0.36)
42.0(1.87)
30.7(1.98)
6.3(0.29)
39.8(1.30)
31.8(1.31)
6.9(0.29)
40.0(1.68)
30.7(1.69)
6.7(0.18)
40.3(0.92)
31.1(0.94)
1.565
0.394
0.148
0.213
0.675
0.863
Percent Percent Percent Percent χ2 P-value
Family members <15years
Family members from 15 - 65 years
Males
Females
Family members > 65 years
43.5
56.0
55.6
44.4
0.5
51.1
48.1
51.6
48.4
0.8
49.5
49.5
57.3
42.7
1.0
48.9
50.3
55.0
45.0
0.8
Educational level of household heads
Literates
Children in school
30.0
15.8
18.3
10.1
51.7
22.8
34.0
16.2
19.586
11.105
0.001
0.000
Male headed households
Female headed households
93.3
6.7
98.3
1.7
95.0
5.0
96.0
4.0
1.56
0.458
dom.: dominating; Mixed flock site: Asore Kebele; Goat dominant site: Udana Meno and Bendo Choloksa Kebeles; Sheep dominant site: Hologeba Kuke and Andegna Tuka Kebeles; χ2:Chi-Square

31
households than the female-headed ones and this is because female farmers tend to use less of
their labor time in farm activities due to heavy commitment to domestic chores (Addisu et al.,
1998). Above half (56%) of the household members were with productive (active working)
age group (15-55 years) and are the main source of farm labor. Children below 15 years of age
make 48.9% of the household family and often provide the bulk of labor in sheep and goat
management. Household labour is an essential resource that influences management practices,
enterprise combinations, labour hiring/sharing strategies and overall levels of technical and
economic performance (ILCA, 1990). The amount of household labour available and the
manner of labour allocation are critical to effectively carry out farm operation and influence
livestock management techniques and adoption of improved technologies (ILCA, 1990;
Addisu et al., 1998). Farming communities of Alaba, according to this study, have better
chance of benefiting from the opportunities that could be derived from readily available family
labor.
Overall, sixty five percent of the household members are illiterates. This is nearly comparable
to the 63% illiteracy rate in the central highlands of Ethiopia (Addisu et al., 1998). Educational
status of household heads differ significantly (P<0.05) across the studied sites with better
condition in sheep dominating (51.7%) and mixed flock (30.0%) sites than in the goat
dominating site (18.3%). This could be attributed to lack of access to education in the remotely
located goat dominating Kebeles. The educated households tend to have higher productivity as
they are better able to decode new production technology (Addisu et al., 1998). A wide
difference in the rate of literacy was noted between the male and female. Literacy rate among
adult males is 29.1 % while it is only 7.7% among adult females. This agrees with the report

32
of Addisu et al. (1998) in the central highlands of Ethiopia where differences exist regarding
access to education and males had better educational status than females.
One sixth of young children below 15 years of age are enrolled in schools. Twenty three
percent of children go to school in the sheep dominating sites and 15.1% in mixed flock
Kebeles and these percentages are significantly higher (P<0.05) than that of 10.1% of children
that attend school in goat dominating Kebeles. Big responsibility of children in herding flocks,
farm responsibility, limited access to education in remote areas and low awareness of the
family are the major impediments of children education. The problem is more pronounced in
remote Kebeles where goat flocks dominate. Herding sheep and goats is a demanding job as
they wander around and easily lost or taken by predators (Solomon et al., 1991).
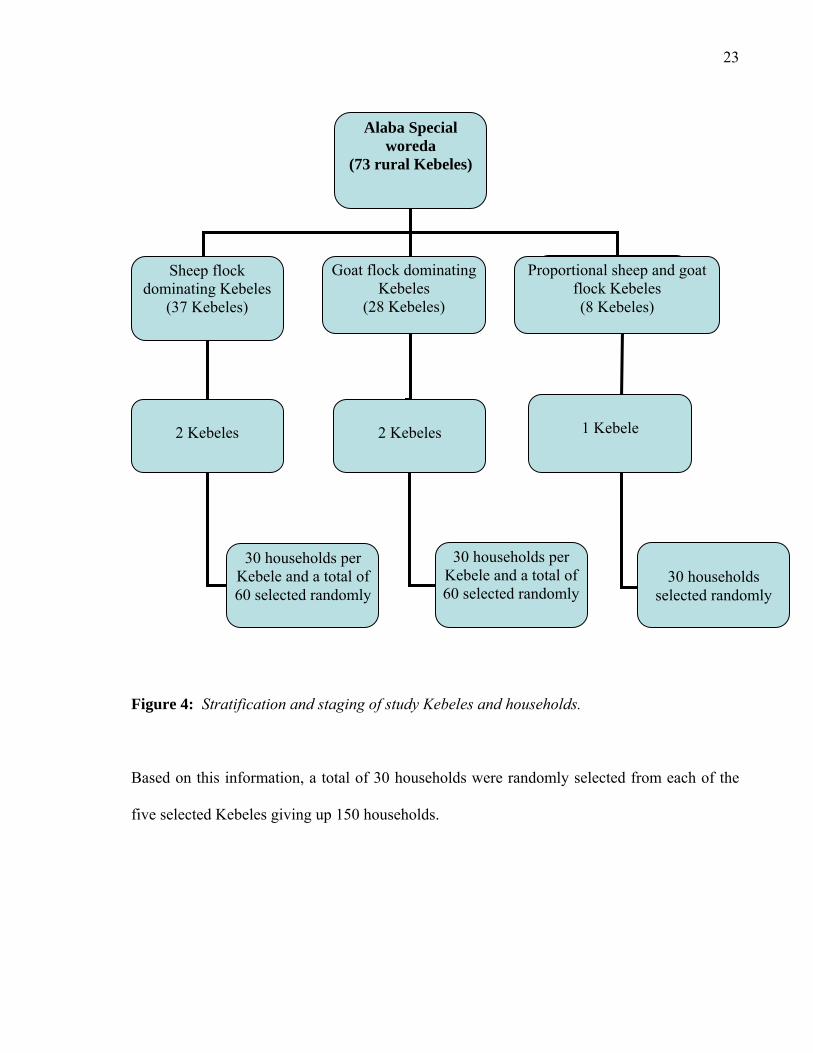
4.1.1.2 Household holdings in study sites
The sheep and goat flocks manifest a distinct pattern of distribution in the woreda. Three
clusters of sites were identified where both sheep and goat were dominant, or either sheep or
goats were dominant. Except for chicken holdings, the average holdings of total land, grazing
land, cattle, sheep, goat and equine vary significantly (P<0.05) among the three sites (Table 2).
Except for the particular species of livestock dominating in the respective sites, wherever
differences exists, mean holdings were higher for goat dominating than the other two sites.
Mean sheep holding of the households varied significantly (P<0.05) across the sites being
dominant in sheep dominating site (7.4), moderate in mixed flock site (4.7) and low in goat
dominating site (2.7). Similarly, mean holdings of goats also varied significantly (P<0.05)
across the sites and abundant in goat dominating site (11.5), moderate in mixed flock site (6.9)
33
and least in sheep dominating site (1.2). The study also confirmed that as land is getting shrink
households tend to rear more of sheep than goats and cattle or the vice versa while in areas
with modest land holding (mixed flock site) households rear proportional mixes of sheep and
goat flocks.
The sites also differ (P<0.05) in holdings of cattle and equine, both being more abundant in
goat dominating site (Table 2).
Table 2: Average land and livestock holdings/household in the three studied sites. (Based on data from of the selected study households)
Mixed
flock site Goat
dom. site Sheep
dom. site
Overall
Test Particulars Mean (SE) Mean (SE) Mean (SE) Mean (SE) F-value P-value
Total land (ha) 2.1(0.16) a 2.9(0.15) b 1.7(0.10) a 2.3(0.09) 25.610 0.000
Grazing land (ha) 0.3(0.04) a 0.6(0.06) b 0.2(0.02) a 0.4(0.03) 20.214 0.000
Cattle 8.6(0.75) a 10.8(0.90) a 6.2(0.49) b 8.5(0.47) 11.065 0.000
Sheep 4.7(0.38) a 2.7(0.39) b 7.4(0.47) c 5.0(0.31) 34.177 0.000
Goats 6.9(0.70) a 11.5(0.91) b 1.2(0.23) c 6.5(0.55) 67.896 0.000
Equines 1.4(0.20) a 2.1(0.22) b 0.8(0.14) c 1.5(0.12) 13.467 0.000
Chicken 3.4(0.82) a 3.7(0.53) a 4.2(0.61) a 3.8(0.36) 0.334 0.717 a, b, c: Different superscripts denote significant differences at P<0.05 between means within rows
The major holdings were correlated using the overall data of the three sites as well as
separately for the three study sites (Appendix Table 3, 4, 5 and 6). There is a positive and
significant correlation between total land and grazing land holding (r=0.937; P<0.05)
indicating that households with larger land holding allocate more land for grazing of their
livestock. On the other hand, total land holding had positive but insignificant correlation with
sheep and goat holdings in all the three sites. Grazing land had positive but insignificant

34
correlation with sheep and goat holdings in the mixed flock and goat dominating sites but the
relationship was negative and insignificant with sheep holdings in the sheep dominating site.
The sheep and goat holdings were positively correlated (but insignificant) in mixed flock site
as expected because in this system, both sheep and goat are found proportionally. More
fascinatingly, in the other two systems too, sheep and goats have positive but insignificant
correlation which signifies the importance and integration of both species in the farming
systems of Alaba.
4.1.1.3 Land holding and land use systems
The average land holding across all the study sites per household is 2.3+0.09 ha. This is within
the range of holdings of 2.01 to 5.00 ha for 32.6% and 16.2% of smallholder farmers in the
country and SNNPRS level, respectively. Land holdings range from 1.01 to 2.00 ha for about
30.8% of farmers in the SNNPR and for 33.3% of farmers at the national level (CACC, 2003).
Land holding found in this study is comparable with the regional and national holdings.
Table 3: Land holding (ha) and land use systems of the households.
Mixed flock site
Goat dom. site
Sheep dom. site
Overall
Test
Particulars Mean(SE)* Mean(SE) Mean(SE) Mean(SE) % F-value P-value
Crop land 1.64(0.14) a 2.05(0.12) b 1.38(0.09) a 1.70(0.07) 76.9 10.568 0.000
Grazing land 0.31(0.36) a 0.58(0.06) b 0.22(0.02) a 0.38(0.03) 17.2 20.214 0.000
Fallow land 0.01(0.01) a 0.06(0.02) b 0.03(0.01) a 0.03(0.01) 1.4 3.691 0.027
Vegetation 0.08(0.02 ) a 0.17(0.03) b 0.05(0.01) a 0.10(0.01) 4.5 7.251 0.001
*SE: Standard error *P<0.05; a, b: Different superscripts denote significant differences between means within rows

35
Total land holding is significantly higher (P<0.05) in goat dominating sites (2.9 ha) than in the
mixed flock (2.1 ha) and sheep dominating (1.7 ha) sites. Land allocated for different purposes
including grazing is also significantly (P<0.05) higher in goat dominating Kebeles than the
others. An average of 0.38 ha or 17.2% of total land, usually around the homestead (dejaf), is
grazing land.
Above half hectare of grazing land in goats dominating site is significantly (P<0.05) higher
than the 0.22 and 0.31 hectare, respectively in Kebeles where sheep and proportional sheep
and goat flocks dominates. The size of total land is an important determinant to availability of
feed from grazing which make major source of livestock nutrition in Alaba. This depict that
grazing land is better available in the goat dominating site. An average of 0.1 ha or 4.5% of the
land is covered with vegetation. Chat is the dominant vegetation in these lands. About 76.9%
of total land is allotted for crop production and this implies that majority of land is used for
crop production and further encroaching into the grazing lands.
4.1.1.4 Livestock holding and composition
The household animal species composition, holding, age and sex structures, ownership and
original acquisitions are presented in Appendix Table 2. The overall average number of
livestock per household was 8.5 cattle, 5.0 sheep, 6.5 goats, 1.5 equines and 3.8 chickens
(Table 2).
An average holding per household in terms of TLU for livestock (excluding chicken) is 8.0
and of these cattle, sheep, goat and equines constitute an average of 6.1, 0.5, 0.6 and 0.8,
respectively (Figure 5). Above half of the total TLU in the study area are found in goat
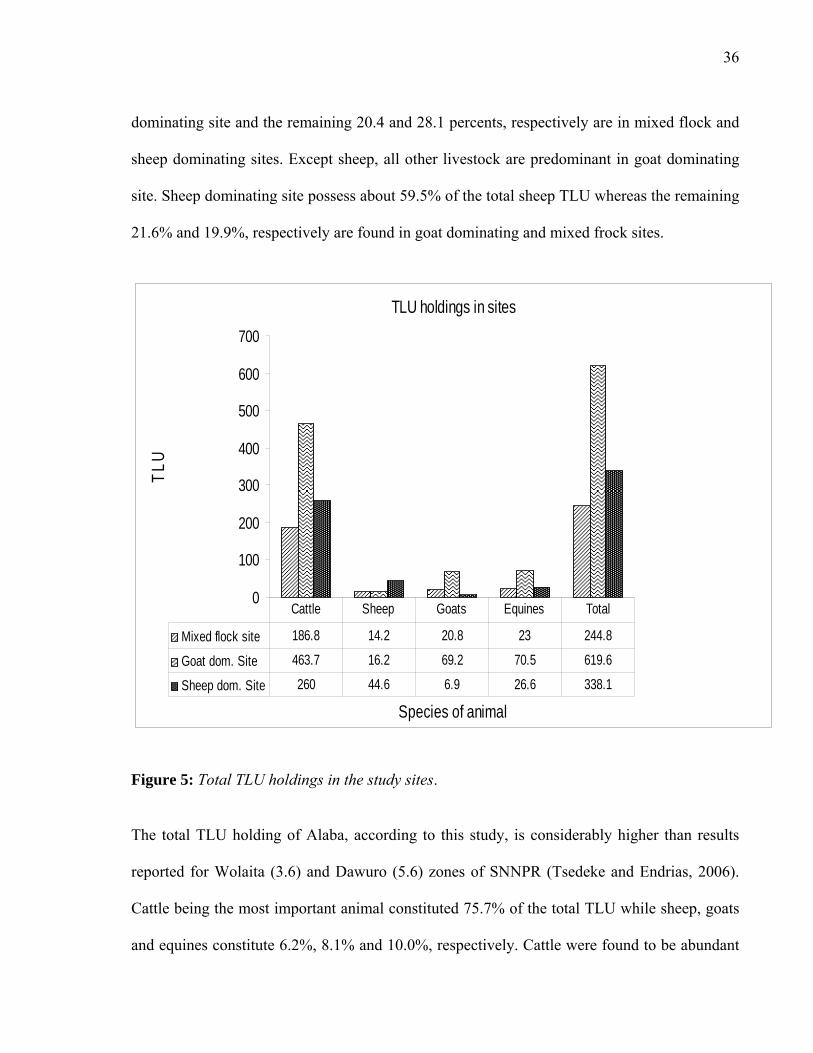
36
dominating site and the remaining 20.4 and 28.1 percents, respectively are in mixed flock and
sheep dominating sites. Except sheep, all other livestock are predominant in goat dominating
site. Sheep dominating site possess about 59.5% of the total sheep TLU whereas the remaining
21.6% and 19.9%, respectively are found in goat dominating and mixed frock sites.
TLU holdings in sites
0
100
200
300
400
500
600
700
Species of animal
TLU
Mixed flock site 186.8 14.2 20.8 23 244.8
Goat dom. Site 463.7 16.2 69.2 70.5 619.6
Sheep dom. Site 260 44.6 6.9 26.6 338.1
Cattle Sheep Goats Equines Total
Figure 5: Total TLU holdings in the study sites.
The total TLU holding of Alaba, according to this study, is considerably higher than results
reported for Wolaita (3.6) and Dawuro (5.6) zones of SNNPR (Tsedeke and Endrias, 2006).
Cattle being the most important animal constituted 75.7% of the total TLU while sheep, goats
and equines constitute 6.2%, 8.1% and 10.0%, respectively. Cattle were found to be abundant

37
livestock in terms of relative total liveweight and ILCA (1990) assert such large relative total
liveweight indicates the relative output, relative pressure exerted on feed supplies, and
constraints and management objectives of the household animal production. Across all the
study sites, household hold mixed species composition, and this according to ILCA (1990),
decreases competition for feed resources (different species tend to make use of different
components), reduces risk by lessening the dependency on one species for meat and milk and
increases the likelihood of meeting basic consumption needs, particularly milk.
The majority of livestock are privately owned. Although lower figure of livestock share
holdings were found, discussion with key informants revealed that it is an important means of
building livestock assets in the area. The majority of the inventory stocks were built through
birth. Purchase, gifts from different sources and inheritances from family are important ways
of building livestock holdings. Foundational stocks of specific age and sex classes for each
species within studied species were acquired through purchase constituting acquisitions of
29.4% for cow, 42.1% for oxen, 44.7% for ewes, 36.0% for does and 57.6% for female
donkey. This clearly indicates the high importance of these stocks for breeding and production
purposes and also objective allocation of considerable household incomes for building
livestock asset in the study area.
Flock structure of sheep and goats are shown in Figure 6. The sheep flocks were composed of
sucking lambs (22.8%), weaned male lambs of 3-6 month age (16.2%), weaned female lambs
of 3-6 month age (12.2%), intact/entire males of above six months or puberty ages (5.8%),
female of above six months age or puberty age (39.3%) and castrates and fattening males
(3.6%). Likewise, 26.7% sucking kids, 12.3% weaned male lambs of 3-6 month age, 12.7%

38
weaned female lambs of 3-6 month age, 5.9% intact males of above six months or puberty age,
39.4% breeding female of above six months age or puberty age and 3.1% castrates and
fattening males comprised the goat flocks.
Breeding female (39.4% ewes and 39.3% does) and pre-weaned young (22.8% lambs and
26.7% kids) constitute the larger proportion of both sheep and goats flocks. The sex-proportion
of the flocks represents 37.1% male and 62.9% female in sheep and 34.6% male and 65.4%
female in goats. Holdings of sheep and goat flock structures were comparable and this is in
agreement to of ILCA (1990) reports this could attributed to similarities in off-take, mortality
and management objectives of the household.
Flock structure
22.8
16.2
12.2
5.8
39.4
3.6
26.7
12.3 12.7
5.9
39.3
3.1
05
1015202530354045
Sucking Males (3-6months) Females(3-6months) Intact males Breeding females Castrates/fattening
Flocks
Per
cent
Sheep Goats
Figure 6: Flock structures of sheep and goats.
An overall ratio of breeding ewes to rams was 6.7 (4.5 for mixed flock site, 9 for goat
dominating site and 7.3 for sheep dominating site while that of the bucks to does is 6.8 (5.2 in

39
mixed flock site, 6.6 in goat dominating site and no buck in sheep dominating site). The high
ram to ewe ratio in goat dominating site is due to existence of little number of ewes (a total of
7 ram and 63 ewes). The ratio of breeding male to female observed in this study is favourable
under the extensive production system and this confirms report of Ahmadu and Lovelace
(2002). The recommended breeding male to female ratio for sheep and goat under traditional
production system is 1:25 (Wilson and Durkin, 1988).
The sheep to goat ratio of the study sites was 0.8, indicating the dominance of goats flock in
the woreda. This could be attributed to the large goat holdings per household in the goat
dominating Kebeles where larger land holding favors availability of grazing lands and browses
for the flocks. Flock structure observed in this study is in line with that of ILCA (1990) where
it was explained that flock structures formed by different age and sex classes of animals
indicate the owner's management objectives (milk or meat), problems or constraints in the
system, birth and death rates and off-take levels.
Mean holding of 5.0 sheep in the present study is close to the value of 4.2 sheep in south
western part of Ethiopia (Berhanu, 1998) whereas the value found in this study is much higher
than values reported fro different parts of the country, such as 0.5 sheep in both west and north
Shewa zones of the central Ethiopian highlands (Agajie et al., 2002), 0.8 sheep in Kombolcha
and Gursum areas of Eastern Ethiopia (Workneh, 2000), 0.6 sheep in Wolaita and 1.5 sheep in
Dawuro zones of SNNPR (Tsedeke and Endrias, 2006) and 1.4 sheep in Boricha woreda of
Sidama zone, SNNPR (Kebebe et al., 2006) were lower than the present report in Alaba. On
the other hand, an average of 15.6 sheep/household (Agyemang et al., 1985) and 24.3 sheep
(Abebe et al., 2000) were reported in Debre Berhan area. Mean holding of 6.5 goats in Alaba

40
is comparable to average reports of 7.0 Arsi-Bale goats in the rift valley areas and 6.0 Keffa
goats in south western parts of Ethiopia (FARM-Africa, 1996). As in case of sheep holdings,
goat holding of Alaba is much higher than an average goat holdings of 2.6 in Kombolcha and
Gursum (Workneh, 2000), 0.4 in Wolaita and 0.6 in Dawuro zones (Tsedeke and Endrias,
2006), 1.8 in Boricha woreda (Kebebe et al., 2006), 0.5 both in west and north Shewa zones
(Agajie et al., 2002) and 0.6 in Debre Berhan (Abebe et al., 2000). The present larger flock
holding in Alaba could be because households selected in this study were all flock owners and
not represent flock holding of an average household in the area.
The proportion of breeding ewes (39.3%) are below observations of Berhanu (1998) (54.4%)
in south western Ethiopia, Abebe et al. (2000) in Debre Berhan (42.4%) and Duguma et al.
(2005) (49.7) in East Wollega and West Shoa Zones under farmers management conditions.
This implies that flocks in the study sites are more diverse embracing other sex and age classes
unlike other locations reported the dominance of dams. The breeding rams (5.8%) found in
this study is above reports of Duguma et al. (2005) (only 2.0%) but below reports of Abebe et
al. (2000) (12.5%), Berhanu (1998) (8.6%) and Agyemang et al. (1985) (22.4%). The
relatively fewer mature rams as compared to breeding females observed in this study agree
with Duguma et al. (2005) that this may reflect that male animals are sold or consumed early
in life while female are retained for breeding. This confirms the earlier findings of Wilson and
Durkin (1988) reported that under rural production systems more males of breeding age are
sold off or slaughtered for home consumption.
About 62.9% female and 37.1% male sheep flocks of the present study are different from
74.8% female and 25.2% males observed in Debre Berhan (Agyemang et al.,1985) and 75.0%

41
female and 25.0% male in East Wollega and West Shoa Zones (Duguma et al., 2005). Castrate
sheep (3.6%) found in this study is slightly higher than the observations of Berhanu (1998) and
Agyemang et al. (1985) who reported a value of 2.8%. The relatively higher proportion of
castrates observed in this study may be attributed to the intense castration practices for
fattening management to respond to the growing market demand and price. Kids comprised
51.7% of the goat flock and this is similar to the finding of Markos (2000) i.e., 48.9% in
Sidama. Bucks of about 5.9% in this study are considerably lower than the reports of Markos
(2000) (18.9%) for Sidama goats, FARM-Africa (1996) (22.1%) for Arsi-Bale goats in rift
valley areas and 25.3% for Keffa goats in south western Ethiopia. The proportion of castrates
(3.1%) in the present study is comparable to 3.5% reported for Arsi-Bale and 4.4% for Keffa
goats (FARM-Africa, 1996). Does representing 39.4% in Alaba are comparable to the value of
32.2% in Sidama zone (Markos, 2000). Total females of the current study (65.4%) are slightly
lower than 74.4% reported for Arsi-Bale and 70.1% Keffa does (FARM-Africa, 1996).
4.1.1.5 Purpose of keeping sheep and goat
Respondents of 36.1%, 29.4% and 26.7%, respectively, in the sheep dominating, mixed flocks
and goat dominating sites kept sheep and goats for sale (Table 4). This implies that sale of
sheep and goats to generate cash constitute the primary purpose among others to rear flocks.

42
Table 4: Purposes of keeping sheep and goats.
Mixed flock site
Goat dom. Site
Sheep dom. site
Overall Test
Purposes *N (%) N (%) N (%) N (%) χ2 P-value Sale 30(29.4) 58(26.7) 60(36.1) 148(30.5) 3.041 0.219
Meat 20(19.6) 31(14.3) 47(28.3) 98(20.2) 10.994 0.004
Milk 20(19.6) 58(26.7) 1(0.6) 79(16.3) 116.973 0.000
Manure 7(6.9) 8(3.7) 9(5.4) 24(4.9) 1.563 0.458
Social capital 2(2.0) 18(8.3) 1(0.6) 21 (4.3) 21.678 0.000
Saving 23(22.5) 44(20.3) 48(28.9) 115(23.7) 0.745 0.689
Total 102(100.0) 217(100.0) 166(100.0) 485(100.0)
*Total count of responses for each factor (in this case purpose) and a household often mention multiple responses for those non-overlapping factors/parameters otherwise once
Higher (P<0.05) respondents (28.3%) in sheep dominating site slaughter sheep and goats for
family consumption than the percentages who do so in the other two sites, whereas differences
between the later two was not significant. This could attribute to high sale off-take of flock in
these drier Kebeles to purchase food items during an extended drought seasons. In the
contrary, significantly higher (P<0.05) respondents (26.9%) in goat dominating Kebeles
largely rear goats for milk consumption followed by households in mixed flock site (19.6%)
also milk their goat. Whereas in sheep dominating Kebeles goat milk consumption is rare
(1%). There is a strong perception among the farmers that goat milk has a medicinal value.
Only 4.9% of the overall respondents realize the importance of sheep and goat manure for land
fertilization and fuel. For a total of 23.7% respondents, sheep and goat provide a saving
function. In goat dominant site, large holding of flock and other livestock represent prestige
within the community and considerable (P<0.05) households (8.3%) rear flock for social
capital.

43
The importance of goats as milk producer for family consumption found in this study is in
agreement with observations of Abule (1998) and FARM-Africa (1996) in the rift valley areas,
Markos (2000) in Sidama zone and Adugna (1998) in Kochore district of Gedio zone
(SNNPR). In adjacent localities of Alaba, FARM-Africa (1996) reported extensive milking
practice of Arsi-Bale goats which is highly valued as source of nourishment for children.
About 41% of the total goat-owning households in the Oromiya Regional State, more often in
the kolla agro-ecological zone use their goats for milk production (Workneh and Rowlands,
2004).
4.1.1.6 Labor allocation and gender role in sheep and goat management
According to three-quarter of the respondents (75.7%), availability of labor for flock
management is adequate. All household members are involved in sheep and goat management.
However, women and children below 15 years are responsible for several important routine
tasks. Women clean flock barns (66.0%), care for lambs/kids (44.9%), and engage in goats
milking (80.4%) and goat milk processing (67.1%). Boys have responsibilities of flock herding
(45.8%), watering (45.6%) and deliver extensive care (26.6%) for young animals. This is in
agreement with Sinn et al. (1999) that even when men and women farm side by side
throughout the day, planting and harvesting crops, the small livestock are typically the primary
responsibility of women and children. About 85.0% traditional and veterinary services for sick
flock and 43.1% of fattening managements are rendered by men. Fattening operation usually
consists of feeding grains and mineral supplements which is done by the husband. Wives
(34.8%) and boys (17.2%) are in charge of processing (cooking and fraying) and feeding the
grains and other supplements to the animals. Girls provide assistances to their mothers and

44
carry out cleaning of barns (31.1%), milking (19.6%), milk processing (32.9%) and providing
care to the young (7.9%) and fattening flocks (4.5%).
Table 5: Division of labor in sheep and goat managements.
Responsibility
Tasks Men (%) Women (%) Boys (%) Girls (%) Hired
labor (%) Flock herding 32.1 12.3 45.8 8.3 1.4
Cut-and-carry grasses/browses 29.5 33.8 25.9 9.5 1.3
Watering flock 40.3 12.4 45.6 1.3 0.4
Clean flock barn - 66.0 2.9 31.1 -
Cares young flock 20.6 44.9 26.6 7.9 -
Fattening managements 43.1 34.8 17.2 4.5 0.4
Treat sick flock 85.0 1.8 13.2 - -
Milk goats - 80.4 - 19.6 -
Process goat milk - 67.1 - 32.9 -
Sale sheep and goats at markets 82.2 5.2 12.6 - -
Decides use of proceeds 73.7 20.2 6.1 - -
Owner of the flocks 68.2 29.0 2.8 - -
Larger flocks (68.2%) of the household are owned by the husband. Women owned
considerable (29.0%) flock while boys own some 2.8% flocks. Women owned flocks could be
sold or exchanged as the women necessitate unlike the other household flocks which often
decided by aspiration of the household heads (men). Women and children have property right
over the flocks but are not decision makers when it comes to selling or exchange. About
82.2% of sheep and goats are sold by husbands. Husbands possess more power (73.7%) in
deciding the use of incomes generated from sale of animals and skins.
45
Some households encounter labor shortage for flock herding and watering. They cope up with
the problem by using family/relative labor (37.3%), alternative herding with neighbors
(35.3%) and tethering and confining flocks within in fences (21.6%). Use of hired labor for
flock management is minimal and uncommon (5.9%).
Gender differentials in the decision making processes of the farm household chores play
significant role in the economic performance of the household (Addisu et al., 1998). Thus
policy makers, technology generators and extension agents should recognize and give due to
attention to the importance of gender towards the development of the sector (Addisu et al.,
1998).
Many women in the developing world work an average of 12-16 hours a day (Sinn et al.,
1999). In rift valley area of Adami Tulu, Abule (1998) reported that women spent over 2 hours
every day with livestock or livestock-related activities. In Ethiopia, women are the major and
important forces in performing the major portion of the animal production activities in rural
farms (Tadelech, 1998; Zinash, 1998). Traditionally, small stocks are looked after by women
and children (Zahra et al., 1998). This study also revealed the versatile role of women in rural
farm operation in general and sheep and goat production in particular.
4.1.2 Sheep and goat husbandry practices
4.1.2.1 Feed and water resources, seasonal availability and utilization
According to respondents, the major feed resources for sheep and goats includes grazing on
crop stubble (13.4%), private pastures (13.3%), road sides (13.2%) as well as weeds from crop
fields (11.6%) (Table 6). In addition, tillers (dense population of the crop competes for
46
nutrients and water and thus household uproots and offer to livestock) and fillers (crops
intentionally planted on part of crop lands or around homestead to be used as feed) (8.9%),
cut-and-carry of local browses and grasses (9.1%) and grazing on communal pastures (9.4%)
make substantial contribution in sheep and goat feeds. However, the type of feed utilized for
sheep and goat differed among the three studied sites. For example, communal grazing is
mostly practiced in goat dominated site (13.2%) than in the other two (Table 5). This could be
attributed to the availability of communal grazing land mainly in goat dominating site.
Similarly, browse species are more important (P<0.05) in goat dominating and mixed flock
Kebeles whereas the reverse is true regarding the use of cut-and-carry feeds, as these are more
used sheep and mixed flock Kebeles. Crop residues (4.7%) are utilized by sheep and goats
most often when it is fresh before over mature and dried. Apart from animal feeds, crop
residues have alternative uses for fuel, construction, sale, compost making, mattress and
thatches. Improved forage and root/tuber crops constitute small portion of the flock diets in the
studied areas. Adoption and utilization of improved forage is low. Limited use of improved
forages in the woreda is demonstrated by the existence of a small number of forage
demonstration and multiplication sites and the limited awareness towards the use of improved
forages at smallholder farms (only 0.2% respondents in sheep dominating site).

47
Table 6: Available feed resources and use patterns.
Mixed
flock site
Goat
dom. site
Sheep dom.
site
Overall Test
Feed types N (%) N (%) N (%) N (%) χ2 P-value
Communal grazing 11(4.7) 58(13.2) 36(8.1) 105(9.4) 39.048 0.000
Road sides grazing 29(12.4) 58(13.2) 60(13.5) 147(13.2) 2.041 0.360
Grazing stubble 29(12.4) 60(13.6) 60(13.5) 149(13.4) 4.027 0.134
River side grazing 17(7.3) 23(5.2) 19(4.3) 59(5.3) 5.280 0.071
Private grazing 30(12.9) 59(13.4) 59(13.3) 148(13.3) 0.507 0.776
Cut-and-carry 23(9.9) 26(5.9) 52(11.7) 101(9.1) 27.096 0.000
Crop residues 11(4.7) 19(4.3) 23(5.2) 53(4.7) 0.613 0.736
Browse species 28(12.0) 59(13.4) 31(7.0) 118(10.6) 43.737 0.000
Improved forages - - 2(0.5) 2(0.2) 3.041 0.219
Root & tuber crops 4(1.7) - 2(0.5) 6(0.5) 3.596 0.166
Weeds 28(12.0) 44(10.0) 57(12.9) 129(11.6) 13.372 0.001
Tillers and fillers 23(9.9) 34(7.7) 42(9.5) 99(8.9) 4.278 0.118
Total 233(100.0) 440(100.0) 443(100.0) 1116(100.0)
Availability of feeds depends on the season of the year when lands are covered with either
Meher or Belg season crops. Major Belg season crops including maize, sorghum, haricot bean,
finger millet and pepper and these are available on lands from around March/April to harvest
time in November/December (Appendix 7). Tef, wheat and haricot bean are major Meher
crops planted in July and harvested around November/December. The duration extending from
planting of major Belg and Meher crops until their harvest makes major challenge to the
availability of sheep and goat feeds. After harvest of Belg crops (December/January) sheep and
goats graze the crop stubbles for few months and then the Meher crops take over from July to

48
part of December. During these extended times when land is covered with crops, grazing on
communal, private, road and river sides constitute major sheep and goats feed. Sheep and
goats on average grazes for about eight hours a day either roam freely, tethered or herded. Cut-
and-carry or grazing/browsing of local grasses and browses are also major feed source for
sheep and goats from crops planting to harvest. Tillers, fillers and weeds from crop fields
make substantial part of sheep and goat feeding. After harvest, crop residues (straws and fresh
tops and thinning of stovers) and crop stubble are the major feeds for sheep and goats.
Seventy nine percent of the total households responded that during both the Meher and Belg
cropping seasons, sheep and goats graze tethered or herded. About 45.1% of the respondents in
sheep dominant and 42.9% in mixed flock sites tether their flocks to avoid crop damages,
which is higher (P<0.05) than goat dominating site (Table 7). This is because the goat
dominating Kebeles are relatively better endowed with extensive private and communal
grazing lands and browse to accommodate free roaming of their flocks.
Table 7: Reasons for tether feeding of sheep and goats.
Uniform flock site
Goat dom. site
Sheep dom. site
Overall Test
Reasons N (%) N (%) N (%) N (%) χ2 P-valueAvoid crop damages 30(42.9) 28(37.8) 60(45.1) 118(42.6) 61.017 0.000
Save labor 14(20.0) 7(9.5) 33(24.8) 54(19.5) 26.302 0.000
Protect from predators 14(20.0) 29(39.2) 34(25.6) 77(27.8) 1.161 0.590
Use marginal lands 9(12.9) 7(9.5) 5(3.8) 21(7.6) 8.25 0.016
Avoid unwanted breeding 3(4.3) 3(4.1) 1(0.8) 7(2.5) 3.147 0.207
Total 70(100.0) 74(100.0) 133(100.0) 277(100.0)
49
Tethering of flocks to save labor requirements is more common (P<0.05) in sheep dominating
site (24.8%) than the other two sites. This indicates that due to land shortages, flocks require
herding or tethering to avoid damages on crop and other garden vegetations.
Virtually one third of the total respondents tether their flock to avoid losses by predator.
Difference across the sites is non-significant and this indicates that predator is a cross-cutting
challenge to sheep and goat production in all parts of Alaba.
Occasionally, depending on availability, household food leftovers, grains (commonly maize
and haricot bean) and minerals (common salt and mineral soil, bole) are offered to sheep and
goats (Table 8). Food leftovers and attela3 from local areke and tella (36.2%) and grains
(34.9%) are often common (P<0.05) local supplements offered to flock in sheep dominating
site. This could be due to the feed shortage caused by small grazing lands and also the
emerging sheep fattening in sheep dominating Kebeles. Total respondents of 23.1% usually
offer green leaves to young and sick flocks at home. Chat garaba4 is an important feed source
for sheep and goats.
With regard to the type of animals that get supplemental feed, ewes and does are commonly
supplemented, particularly during the time of pregnancy and early lactation. The proportion of
households supplementing is more or less similar in all sites and ranged from 28 to 30.4
percents. Households of 27.9% in sheep dominating and 23.2% in mixed flock sites offer local
supplements to castrated and fattening sheep while goat receives from their owners of 31.8%
in goat dominating and 24.1% in mixed flock sites. Lambs receive green leaves and food
3 Attela is a by-product of the local areke and tella beverages. 4 Garaba is leave and stem of chat plant which is older and less succulent.

50
leftover from 26.8% respondents in uniform flock and 20.2% respondents in sheep dominating
sites. Rams are less prioritized to receive supplements from 22.2% and 21.9% respondents in
mixed flock and sheep dominating sites, respectively. Similarly, kids and bucks in mixed flock
and goat dominating sites receive supplements from comparable proportion of respondents in
sheep and mixed flock goat dominating site.
Table 8: Common local supplements offered to sheep and goats.
Mixed flock site
Goat dom. site
Sheep dom. site
Overall Test
Particulars N (%) N (%) N (%) N (%) χ2 P-value Green fodder 15(21.4) 35(28.0) 30(19.7) 80(23.1) 1.004 0.605
Food leftovers and attela
(local areke, tella)
24(34.3)a
41(32.8)b
55(36.2)b
120(34.6)
10.208
0.006
Grains (cooked/roasted) 22(31.4)a 40(32.0)b 53(34.9)b 115(33.1) 8.106 0.017
Salt, bole 9(12.9) 9(7.2) 14(9.2) 32(9.2) 2.92 0.232
Total 70(100.0) 125(100.0) 152(100.0) 347(100.0)
Major sheep and goat feed from natural pasture, crop residues, browse and bushes, crop
residues, thinning, weeds and fodder plants identified in this study are also major sheep and
goat feed source in Ethiopia (Markos, 2000; Tsige-Yohannes, 2000; Adugna et al., 2000;
Berhanu et al., 2002). Adjacent to Alaba, in the Mid Rift Valley of Ethiopia, Abule (1998) and
Amsalu et al. (2002) reported that natural pasture makes major contribution in livestock feeds.
A marked seasonal variation in the quantity and quality of feed supply and the acute problem
of feed supply during dry season found in this study is in agreement to Adugna et al. (2000)
and ILRI (2000).

51
Table 9: Reported reasons for feeds shortage.
Mixed flock site
Goat dom. site
Sheep dom. site
Overall Test
Particulars N (%) N (%) N (%) N (%) χ2 P-value Declining yields of grazing land
25(32.1) 23(26.4) 35(28.5) 83(28.8) 16.751 0.000
Increase of livestock population
12(15.4) 10(11.5) 10(8.1) 32(11.1) 7.786 0.020
Cultivation of grazing lands
23(29.5) 28(32.2) 41(33.3) 92(31.9) 9.656 0.008
Drought 10(12.8) 20(23.0) 21(17.1) 51(17.7) 0.045 0.978
Increase of human population
8(10.3) 6(6.9) 16(13.0) 30(10.4) 6.25 0.044
Total 78(100.0) 87(100.0) 123(100.0) 288(100.0)
Shrinking sizes of the grazing lands driven by the expansion of land cultivation was reported
to be the leading reasons for feed shortage across all the study sites but it was more
emphasized in sheep dominating site than in the others (Table 9). Declining yield and carrying
capacity of the grazing lands was rated as the second important impediment in adequate supply
of feeds across all the sites. Increases of human and livestock population and drought are also
mentioned to cause feed shortage.
River water is used by about 55.2% of total flock owning households and constitutes the major
source of flock water. This is in agreement to the observation of Abule (1998) who reported
the same for livestock around Adami Tulu. Most respondents (93.8%) in sheep dominating
Kebeles use river water for their flocks as rivers are found in close distance from homestead.
Rivers are often found at long distances from homestead in goat dominating Kebeles, but
considerable number of household (54.3%) use the Dijo River, which is located across
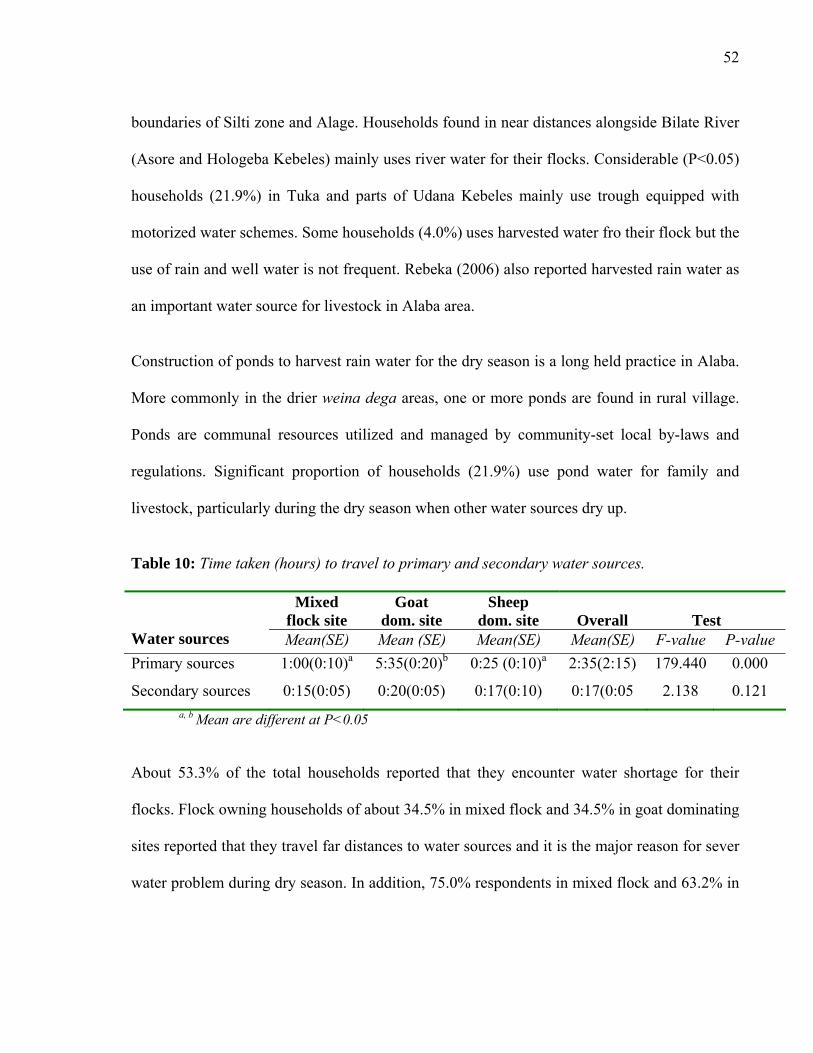
52
boundaries of Silti zone and Alage. Households found in near distances alongside Bilate River
(Asore and Hologeba Kebeles) mainly uses river water for their flocks. Considerable (P<0.05)
households (21.9%) in Tuka and parts of Udana Kebeles mainly use trough equipped with
motorized water schemes. Some households (4.0%) uses harvested water fro their flock but the
use of rain and well water is not frequent. Rebeka (2006) also reported harvested rain water as
an important water source for livestock in Alaba area.
Construction of ponds to harvest rain water for the dry season is a long held practice in Alaba.
More commonly in the drier weina dega areas, one or more ponds are found in rural village.
Ponds are communal resources utilized and managed by community-set local by-laws and
regulations. Significant proportion of households (21.9%) use pond water for family and
livestock, particularly during the dry season when other water sources dry up.
Table 10: Time taken (hours) to travel to primary and secondary water sources.
Mixed flock site
Goat dom. site
Sheep dom. site
Overall Test
Water sources Mean(SE) Mean (SE) Mean(SE) Mean(SE) F-value P-value Primary sources 1:00(0:10)a 5:35(0:20)b 0:25 (0:10)a 2:35(2:15) 179.440 0.000
Secondary sources 0:15(0:05) 0:20(0:05) 0:17(0:10) 0:17(0:05 2.138 0.121
a, b Mean are different at P<0.05
About 53.3% of the total households reported that they encounter water shortage for their
flocks. Flock owning households of about 34.5% in mixed flock and 34.5% in goat dominating
sites reported that they travel far distances to water sources and it is the major reason for sever
water problem during dry season. In addition, 75.0% respondents in mixed flock and 63.2% in

53
goat dominating sites added that it is more aggravated due to drying of the water sources in
their locality. Farmers in sheep dominating site did not report any watering problem.
Table 11: Watering frequency of sheep and goats in dry seasons.
Sheep Goats Frequencies N (%) N (%)
Daily 15(10.0) 2(1.3)
Every two days 63(42.0) 6(4.0)
Every three days 63(42.0) 52(34.7)
Every four days 9(6.0) 64(42.7)
Above four days - 26(17.3)
Total 150(100.0) 150(100.0)
Overall, trekking flocks forth and back to major water sources (usually rivers) takes about an
average of three hours (Table 10). Distances to secondary water sources (pond water and
troughs) take about twenty minutes. An average round trip of about five and half hours to a
water source is common in goat dominant Kebeles (P<0.001) than in others.
As to water scarcity arise from drying up of water sources and long distances, 42.0% of sheep
and 34.7% goat owners water their flock commonly every three days (Table 11). Among goat
owning households about 42.7% indicated that they water their animals every four days and
occasionally about 17.3% households water in further extended interval of five or more days.
This is because in major goat distributed areas water source is far away from the homestead.
Besides, goats are better adaptive to water scarcity than sheep (Ibrahim, 1998).

54
4.1.2.2 Sheep and goat health managements
Almost all (99%) and 64.0% of respondents, respectively, reported the occurrence of
morbidity and loss of their sheep and goats during the year 2005/2006. Overall, 34.6% flock
owners rated diseases and parasites are the main cause of mortality (Table 12). Fasciolosis,
pneumonia, sheep pox, blackleg and anthrax were reported as the most prevalent flock health
threats across all the sites (Appendix 8). Major diseases and parasites causing mortality and
morbidity in this study are in agreement to reports of Markos (2000) for goats in Awassa Zuria
woreda and Berhanu (1998) for sheep in south western parts of Ethiopia. This confirms
findings of Tekelye et al. (1992) who reported considerable morbidity and mortality of sheep
primary caused by infectious causes under farmers’ management condition of Debre Berhan
area. Pneumonia at large (Tekelye et al., 1992) and endoparasites (fascioliasis, cestodiasis and
gastrointestinal nematodes and lung worms) (Tekelye and Kasali, 1992) are major causes of
morbidity and mortality in sheep. Similarly, Tembely (1998) reported that parasitic diseases
(gastrointestinal nematodes and fasciolosis) and infectious diseases (Peste des Petits
Ruminants/PPR, Contagious Caprine Pleuro-Pneumonia/CCPP and respiratory disease
syndrome) are major causes of morbidity and mortality of sheep and goats in Ethiopia.
Mastitis was reported to be a major health problem in lactating goats.
In the study sites large flocks from radius areas usually use common water points (river and
pond) and this might have contributed to the spread of infectious and parasitic diseases.
Further, the major water sources of flocks in the study sites including rivers (Bilate and Dijo)
and ponds; and these may make the microecology favourable for transmission of F. hepatica
by the snail, Lymnaea truncatula.

55
Considerable loss of animals by predators (mainly foxes and hyenas) was reported by 19.2%
of the total respondents. This is particularly apparent in the bush and forest abundant extensive
grazing areas where wild animals are concentrated.
Table 12: Major causes of sheep and goat mortality.
Mixed flock site
Goat dom. site
Sheep dom. site
Overall Test
Causes of death N (%) N (%) N (%) N (%) χ2 P-value Diseases and parasites 29 (33.0) 59(34.3) 60(35.7) 148(34.6) 1.774 0.412
Feed poisoning
and deficiency
25(28.4)
20(11.6)
36 (21.4)
81(18.9)
21.578
0.000
Physical damages 2(2.3) 2(1.2) 2(1.2) 6(1.4) 0.694 0.707
Predators 7(8.0) 50(29.1) 25(14.9) 82(19.2) 35.872 0.000
Undetermined reasons 16(18.2) 24(14.0) 25(14.9) 65(15.2) 1.561 0.458
Ectoparasites 9(10.2) 17(9.9) 20(11.9) 46(10.7) 0.361 0.835
Total 88(100.0) 172(100.0) 168(100.0) 428(100.0)
The loss by predators is significantly higher in goat dominating Kebeles (P<0.05) than in
others. This is in agreement to FARM-Africa’s (1996) report of high loss of goat flocks in
Keffa area of SNNPR. Respondents of about 19.8% and 14.0%, respectively reported flock
mortality due to severe feed deficiency and/or poisonous local botanicals and undetermined
reasons. Respondents and key informants listed variety of local grasses and browses causing
poisoning to their flock and the problem is more apparent during dry season when flock are
less fortune to obtain adequate feed.
This study found high mortality rates of pre-weaned young (28.4% for lambs and 12.2% for
kids) and breeding female (23.7% for ewes and 9.4% for does) flocks (Table 13). These values

56
are lower than the proportions reported by Markos (2000) who said that lamb and kid mortality
represented half of the total mortality in small ruminants of Awassa Zuria woreda.
Table 13: Mean and rate of mortality in sheep and goat flocks.
Sheep Goat
Flock structure Mean (SD) % Rate Mean (SD) % Rate
Prenatal mortality5 0.02(0.1) 1.2 0.3(0.8) 11.0
Sucking flock 0.6(1.2) 35.0 28.4 1.0(2.3) 35.5 12.2
Young flocks (3-12 months) 0.3(0.7) 14.1 12.3 0.4(0.9) 14.7 31.5
Dams/breeding female 0.8(1.4) 42.9 23.7 0.8(1.7) 30.6 9.4
Intact/breeding males 0.1(0.4) 5.5 20.5 0.2(0.6) 6.9 30.4
Castrates and fattening 0.1(0.4) 1.2 8.7 0.03(0.3) 1.2 8.6
Overall mortality rates 21.7 25.3
However, this study confirms the reports of Armbruster and Peters (1993) in southern Cote
d’Ivoire that under traditional sheep and goat production systems, mortality rates of lambs and
kids up to 365 days was 48.1 and 44.2%, respectively. The same author also reported that
mortality rates of 18.1% for sheep and 19.6% for goats from 0-90 days. ILCA (1990) reported
that high mortality in young stock is a major cause of low productivity in many African
livestock production systems.
Mortality rate of breeding rams and bucks observed in this study are 20.5 and 30.4%,
respectively. Mortality rates in post-weaned young (28.4% for lambs and 35.5 for kids) and
dams (42.9% for ewes and 30.6% for does) are high. Mortality rates for different age and sex
classes of goat flock found in this study lies within range of values reported by other
5 Reproduction losses including embryonic mortality and abortions before normal delivery of the dams

57
investigators. Mortality rate of goats (25.3%) and sheep (21.7%) in this study is comparable to
findings of ILCA’s (1990) report of mortality rates between 25 and 35% for African sheep and
goats. Result of the present study also confirms the finding of Armbruster and Peters (1993)
who reported mortality rate of 20.9% in sheep and 23.3% in goats. Webb and Mamabolo
(2004) reported mortality rates of goats ranging between 3.8 and 40.1% in Mpumalanga, South
Africa. Ahmadu and Lovelace (2002) reported mortality rates of 51, 26 and 23%, respectively,
for suckling kids, young (rearing) flocks and breeding male and females flocks under
traditional production systems of Zimbabwe.
The present study confirmed that mortality of young flock (0-365 days) represented nearly half
of the total mortality in both sheep and goats and that of breeding female represented 42.9% of
the total mortality in sheep and 30.6% in goats, which is quit indicating that these flocks are
highly prone to death than others. The 6prevalence of PPR and other diseases caused
devastating loss of flocks in woreda (complete loss of flock in some households of the study
sites was noted) during the study period and this could attribute to the present exacerbated
mortality rates.
Sixty percent of the respondent reported that mortality is the major cause of (45.5% for sheep
and 49.2% for goats) flock loss from the systems. Moreover, about 17.6% of respondents
culled their flocks because of health problems by diseases and parasites (37.3%). Thus, this
study confirmed that diseases and parasites are the major impediment of flock management
hindering productivity of smallholder sheep and goat at Alaba.
6 Public Animal Health Clinic, Alaba OoARD

58
Households apply various methods of treatments for their flocks with health problems. Fifty
four percent respondents apply traditional treatments using different parts of various plants
(leaves, stems, roots), water, kerosene, soil and local extractions mixed in varying proportions
or alone for different diseases and parasites and flock structures. Similarly, Markos (2000) and
Tsedeke and Endrias (2006) reported the wide application of ethno-veterinary practices to
flock and herd with health problem. Elders are often skilled and experienced in providing the
treatments.
Branding of flocks with hot wood and metal is one of the traditional methods practiced to treat
sick animal that 40.0% of the respondents apply. This is in agreement to observation of Gebre-
Egziabher et al. (1998) that farmers around Bako brand their cattle which have been adopted
through a long time trial and error exercise often applied for curative purpose when veterinary
services are inaccessible. The same author noted that considerable loss of skins and hides is
due to branding and thus farmers need to be thought and provided efficient veterinary services.
About 60.0% of the considered flock owners do not practice branding of animals. About
56.7% of them do not brand because it causes serious infection of the branded body parts
which often causes mortality or further health complications. The other respondents do not
brand to avoid subsequent drop of skin quality (24.4%) and value (18.9%).
Respondents of 28.5% take their sick flocks to veterinary centers. Only about 22.8% of the
respondents have access to veterinary services and even this is practical for households in
Asore and Hologeba Kebeles that are close to Alaba. On average, the veterinary center is
located at 20.5km from considered households with so long variation for households in both
goat and sheep dominating sites. Less adequately, flocks of about 57.3% respondents received

59
vaccination. Some 2.9 and 2.1 percent of the respondents indicated that they immediately
slaughtered and sold the sick animals, respectively.
Alaba Kulito animal health clinic is the only public veterinary unit serving the vast
geographical area and numerous livestock resources in the woreda. About 13.0% of the flock
owners treat their flocks with veterinary supplies purchased from open (illegal) markets.
Among the respondents, 27.3% indicated that inaccessibility of the public veterinary services
and 16% reported availability and affordability of contraband drugs in local markets are the
major reasons for the use of illegal drugs.
However, about 59.3% of the respondents do not use contraband drugs. About 50.0% of the
respondents do not use as it usually does not cure their flocks and about 28.4% received
advices from health professional not to use illegal drugs. The other 20.6 and 1.0%,
respectively, do not use it because they either can not afford it or it is not available in their
area.
4.1.2.3 Breed types and preference to sheep and goats
Types of sheep observed in the study areas are of fat-tailed coarse hair type. It may belong to
the Arsi-Bale breed (Workneh et al., 2004; Solomon, 2006). Likewise, goats observed may
belong to Arsi-Bale breeds (FARM-Africa, 1996; Tesfaye et al., 2006) that they share
explanatory characteristics employed in the phenotypic description of the Arsi-Bale goats.
Respondents of 27.2%, 24.0% and 23.2%, respectively prefer sheep to goats for they are easy
to manage, high market demand and high market prices (Table 14). Immediate return due to
high reproduction efficiency is comparably appreciated by about 25.6% sheep and 23.9% goat
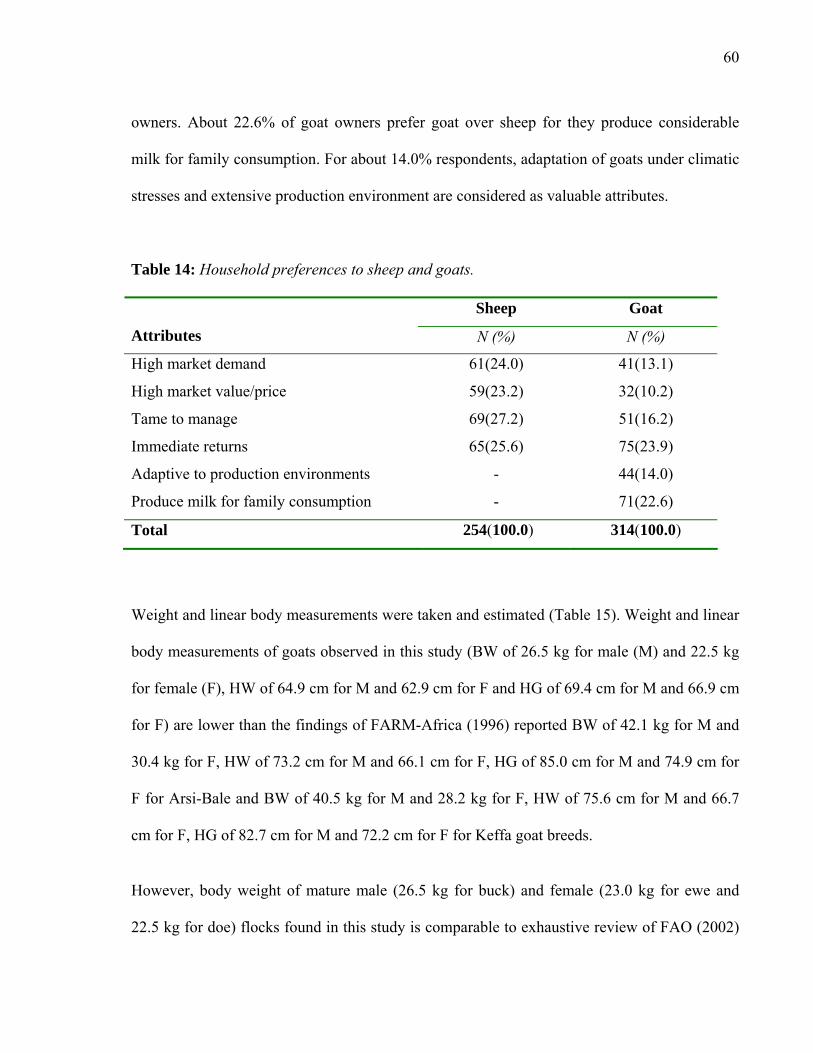
60
owners. About 22.6% of goat owners prefer goat over sheep for they produce considerable
milk for family consumption. For about 14.0% respondents, adaptation of goats under climatic
stresses and extensive production environment are considered as valuable attributes.
Table 14: Household preferences to sheep and goats.
Sheep Goat
Attributes N (%) N (%)
High market demand 61(24.0) 41(13.1)
High market value/price 59(23.2) 32(10.2)
Tame to manage 69(27.2) 51(16.2)
Immediate returns 65(25.6) 75(23.9)
Adaptive to production environments - 44(14.0)
Produce milk for family consumption - 71(22.6)
Total 254(100.0) 314(100.0)
Weight and linear body measurements were taken and estimated (Table 15). Weight and linear
body measurements of goats observed in this study (BW of 26.5 kg for male (M) and 22.5 kg
for female (F), HW of 64.9 cm for M and 62.9 cm for F and HG of 69.4 cm for M and 66.9 cm
for F) are lower than the findings of FARM-Africa (1996) reported BW of 42.1 kg for M and
30.4 kg for F, HW of 73.2 cm for M and 66.1 cm for F, HG of 85.0 cm for M and 74.9 cm for
F for Arsi-Bale and BW of 40.5 kg for M and 28.2 kg for F, HW of 75.6 cm for M and 66.7
cm for F, HG of 82.7 cm for M and 72.2 cm for F for Keffa goat breeds.
However, body weight of mature male (26.5 kg for buck) and female (23.0 kg for ewe and
22.5 kg for doe) flocks found in this study is comparable to exhaustive review of FAO (2002)

61
in sub-Saharan Africa regions reported mature weight of ewe ranging between 22.7 to 34.1kg,
ram between 26.7 to 31.6kg, doe between 25.0 to 31.8kg and bucks between 29.2 to 30.4kg.
Often infrastructures required in production and marketing of livestock at smallholder systems
are lacking. These days, marketing of flocks on live weight basis is common in local and urban
market centers of Alaba areas. Considerable households reported that they prefer to market in
live weight basis. However, in some local markets weighing scale are not available. Thus, it
needs to estimate weight from other easily measurable linear parameters. Similarly, Adugna
(1998) estimated body weight using heart girth measurements for sheep and goat flocks in
Kochore district of SNNPR.
A step-wise regression of linear measurements was run and heart girth was found to fit to
estimating body weight in both species. Mature male sheep and goats constitute less parts of
the flock structure and thus their numbers were few.
Linear equation fitted to the flock data provided
Body weight = 0.725 (Heart Girth) – 26.17 (r =0.921; P<0.01) for sheep;
Body weight = 0.935 (Heart Girth) – 39.68 (r = 0.963; P<0.01) for goats
The models are both significant at 5% level. About ninety three percent of the variability in
body weight of goat is explained by its heart girth while it is eighty five percent in sheep.

62
Table 15: Linear measurements of mature sheep and goats.
Sheep Goat
Male (N=17)
Female (N=114)
Overall (N=131)
Male (N=21)
Female (N=83)
Overall (N=104)
Linear measurements Mean(SD) Mean(SD) Mean(SD) Mean(SD) Mean(SD) Mean(SD)
Body weight (BW), kg 19.9(4.1) 23.0(4.4) 22.6(4.5) 26.5(11.0) 22.5(5.5) 23.3(7.1)
Height at wither (HW), cm 60.6(4.6) 63.6(4.3) 63.6(4.4) 64.9(8.0) 62.9(4.6) 63. 3(5.5)
Heart girth (HG), cm 63.2(5.7) 67.9(4.9) 67.3(5.2) 69.4(10.1) 66.9(6.0) 67.4(7.0)
Body length (BL), cm 82.3(6.8) 86.3(6.1) 86.8(6.4) 81.7(10.3) 81.9(9.1) 81.9(9.3)
Figure 7: Normal distribution of adult flock weight.
10.00 15.00 20.00 25.00 30.00 35.00
Sheep wt
0
5
10
15
20
Freq
uenc
y
Mean = 22.574Std. Dev. = 4.47634N = 131
Sheep wt
10.00 20.00 30.00 40.00 50.00
Goat wt
0
5
10
15
20
25
Frequency
Mean = 23.0084Std. Dev. = 6.69545N = 104
Goat wt

63
4.1.2.4 Sheep and goat breeding management
There is often no selective mating policy in the study sites. Ram and bucks run with flock
throughout the year. Thus mating and conception could occur all-year round. This is in
agreement to previous observations reported for sheep and goat flocks (Rawlings et al., 1992;
FARM-Africa, 1996; Berhanu, 1998).
Only 37.3% of all sheep and goat respondents owned breeding ram and buck. Larger
households retain young male for castration and fattening. This implies that retention of young
male for breeding is seldom practiced by owners.
The majority of breeding rams and bucks originated from the same or another village. In dry
season, immediately after crop harvest ram and buck from different flocks while roam freely
mates females within the same village or from other villages. Berhanu (1998) and Jaitner et al.
(2001) reported similar situations. Two possible breeding seasons of the flocks were identified.
As to 60% sheep and 58.0% goat owners, major breeding time of the flocks is between
November and January. Until crops are harvested, flocks are usually tethered and maintained
under nutritional stress. Between November and January, immediately after harvest the flocks
freely graze on crop stubbles and aftermaths. Thus, adequate nutrition for reproductive process
and access to breeding males creates favorable situation to the reported intensive flock
breeding. This in agreement to findings of Mukasa-Mugerwa (2002) observed peak
conceptions of ewe in response to feed flushes or when crop residues are available. Similarly,
Takele et al. (2006) reported availability of adequate feeds immediately following crop harvest
allows free access to aftermath improve testicular sizes and semen characteristics in rams.
64
About 32.7% of the sheep and 34.7% of goat keepers reported that the second minor breeding
season is between April and June. As in main season, this is also attributed to improved feed
supply from grasses and browses grown immediately after the belg shower rains. Lambing and
kidding of the flocks mated in major breeding season occur in an entry to wet season from
April to May whereas births of the minor breeding season during occurs in dry season from
October to December. Mukasa-Mugerwa et al. (2002) found that mating of ewes in the dry
season lead to higher fertility than those mated in the wet season that ewes from the previous
wet season came with enough body reserves. The same author confirmed that lambing in the
subsequent wet season further enhanced weaning rates and productivity due to better grazing
during lactation. In rams, Takele et al. (2006) confirmed that adequate seasonal feed
availability result superior reproductive performance. This implies that major lambing and
kidding during wet season is favourable to the new borne.
It was observed that there is no deliberate practice of making selective breeding to avoid risks
of the inbreeding depression in the flocks. It is of more concern that almost all breeding rams
and bucks originated from their respective flocks might imply that the relationship of animals
within a flock and even within a village is narrow and inbreeding is widespread and increasing.
This is in agreement with Berhanu (1998) and Jaitner et al. (2001).
4.1.2.5 Productive and reproductive performances of sheep and goat
Weaning age of 4 month for kids and 4.6 month for lambs in this study is early than 5.9 and
6.6 months, respectively for kids and lambs of Kochere district (Adugna, 1998) and 4.8 and
5.3 months, respectively for kids and lambs in Wolaita area (Adugna, 1990). This could
attribute to the relative better feed supply compared to the densely populated Kochore and
65
Wolaita areas. Tesfaye et al. (2000) reported weaning age of 90.18 days for Boran Somali and
92.46 days for Mid Rift Valley goats. Records of birth and weaning weights to estimate birth
and weaning weights and weight gains up to weaning were small at present.
Age at puberty for sheep (6.7 months for male and 6.9 months for female) observed in this
study is below 300 days reported for male but comparable to 231 days for female tropical
sheep elsewhere (Combellas, 1980). About 7.0 months for female goats is in agreement with
observation of Markos (2000) reported 7 to 8 months for female but that of males (6.6 months)
is vary widely than the 12 months for male in Awassa Zuria woreda. Payne and Wilson (1999)
reported tropical male goats reach sexual maturity at 132 days.
Beginning from ages of comparable 7.1 and 7.2 months, respectively male goat and sheep are
slaughtered for family consumption. Female are often retained for breeding but when
necessary slaughtered from an ages of 7.4 months in kids and 7.7 months in lambs. Slaughter
ages observed in this study are early than findings of Adugna (1998) reported 10.8 months for
both male and female kids and 13.5 months for female and 13.8 months for male lambs. In
rural Alaba, there is strong consumption tradition of young lambs and kids that believed to
well build body and health of sick family and mothers and this could attributed to the observed
early slaughter ages.
Age at first parturition observed in this study (12.7 months for lambing and 12.1 months for
kidding) is comparable to findings of Awotwi and Fynn (1992) reported mean ages of 13.2+
0.2 and 11.0+0.1 months, respectively at first lambing and kidding in backyard systems of
southern Ghana. FAO (2002) reported age at first lambing ranges between 16.2 and 16.9
months and that of at first kidding from 13.5 to 17.5 months in mixed farming systems of sub-
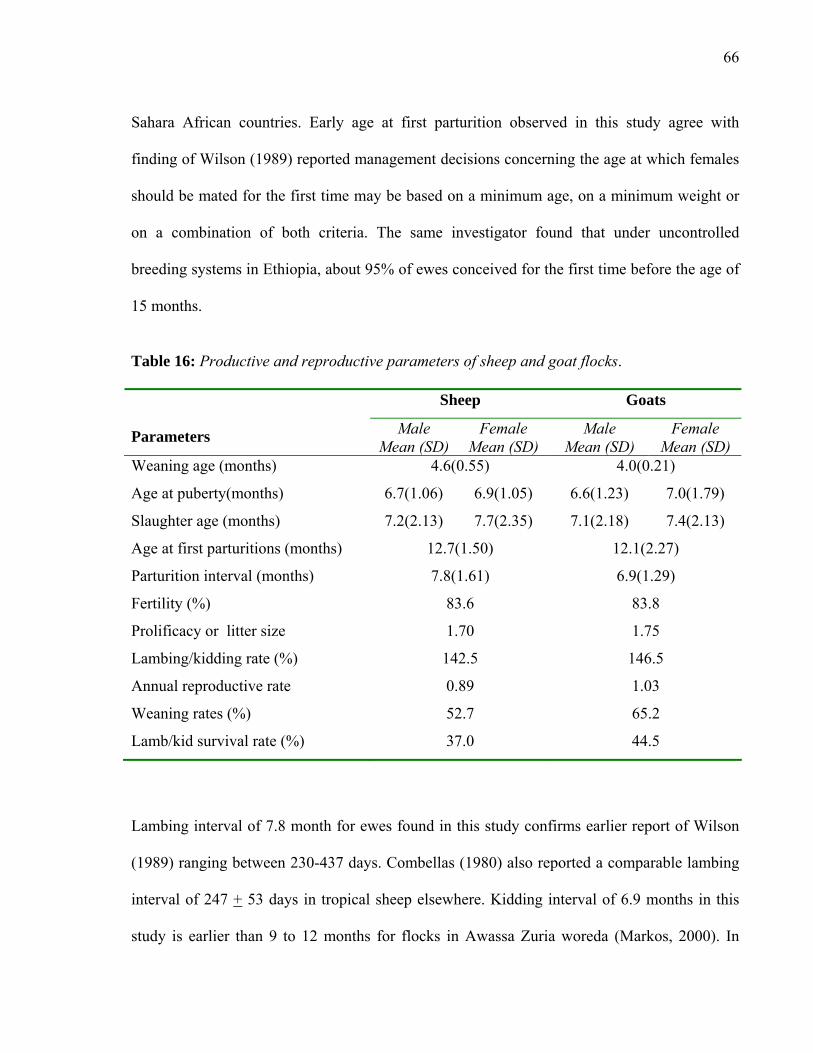
66
Sahara African countries. Early age at first parturition observed in this study agree with
finding of Wilson (1989) reported management decisions concerning the age at which females
should be mated for the first time may be based on a minimum age, on a minimum weight or
on a combination of both criteria. The same investigator found that under uncontrolled
breeding systems in Ethiopia, about 95% of ewes conceived for the first time before the age of
15 months.
Table 16: Productive and reproductive parameters of sheep and goat flocks.
Sheep Goats Parameters Male
Mean (SD)Female
Mean (SD) Male
Mean (SD) Female
Mean (SD) Weaning age (months) 4.6(0.55) 4.0(0.21)
Age at puberty(months) 6.7(1.06) 6.9(1.05) 6.6(1.23) 7.0(1.79)
Slaughter age (months) 7.2(2.13) 7.7(2.35) 7.1(2.18) 7.4(2.13)
Age at first parturitions (months) 12.7(1.50) 12.1(2.27)
Parturition interval (months) 7.8(1.61) 6.9(1.29)
Fertility (%) 83.6 83.8
Prolificacy or litter size 1.70 1.75
Lambing/kidding rate (%) 142.5 146.5
Annual reproductive rate 0.89 1.03
Weaning rates (%) 52.7 65.2
Lamb/kid survival rate (%) 37.0 44.5
Lambing interval of 7.8 month for ewes found in this study confirms earlier report of Wilson
(1989) ranging between 230-437 days. Combellas (1980) also reported a comparable lambing
interval of 247 + 53 days in tropical sheep elsewhere. Kidding interval of 6.9 months in this
study is earlier than 9 to 12 months for flocks in Awassa Zuria woreda (Markos, 2000). In

67
neighboring Arsi Negelle area, Tatek et al. (2004) reported comparable interval of 8.07 months
for Arsi-Bale goats under farmers’ management conditions. Wilson (1989) reported kidding
interval ranging between 238 and 391 days for African does. The shorter interval observed in
this study could attribute to the uncontrolled breeding systems.
Litter size or prolificacy of 1.70 in sheep and 1.75 in goats observed in this study are
comparable to observations in African flocks ranging between 1.08 and 1.75 for does but
slightly higher than repots for ewes ranging between 1.02 and 1.43 (Wilson, 1989). Endeshaw
(2007) reported litter size of 2.07 for goats in drier parts of Dale district. Awotwi and Fynn
(1992) reported prolificacy of 1.3 in sheep and 1.8 for goats under backyard systems of
southern Ghana. Combellas (1980) also reported comparable litter sizes ranging between 1.2
and 1.6 for tropical sheep elsewhere. Foote (1991) (cited in Mukasa-Mugerwa et al., 2002)
reported litter size of tropical sheep ranging between 1.01-1.60. Tatek et al. (2004) reported
litter size of 1.21 for Arsi-Bale goats in Arsi Negelle. Mukasa-Mugerwa et al. (2002) reported
litter sizes of 1.13 in Menz and 1.14 in Horro Ethiopian highlands sheep. Armbruster and
Peters (1993) reported litter size of 1.19 for Djallonke sheep and 1.52 for Djallonke goats in
southern Cote d’Ivoire under traditional production systems. FAO (2000) reported prolificacy
of sheep ranging between 1.09 and 1.16 for sheep and 1.26 and 1.52 for goats in mixed
farming systems. Twining is most common among Alaba flocks constituting 80% in sheep and
82.2% in goats and this could attribute to the present litter sizes.
Fertility rate of 83.6 percent in ewe and 83.8 percent in does observed in this study is below
the findings of Awotwi and Fynn (1992) who reported 93.3% in sheep and 99% in goats under
backyard systems of southern Ghana. However, it is higher than findings of Mukasa-Mugerwa

68
et al. (2002) reported 76% in Menz and 67% in Horro Ethiopian highlands sheep. Lambing
rate, a product of fertility and prolificacy is a good measure of ewe reproduction (Foote, 1991
cited in Mukasa-Mugerwa et al., 2002) and the present 142.5% lambing and 146.5% kidding
rates fall within the 65-200% vales reported for tropical hairy sheep (Foote, 1991 cited in
Mukasa-Mugerwa et al., 2002) but higher than the findings of Mukasa-Mugerwa et al. (2002)
who reported 87% in Menz and 81% in Horro ewes. FAO (2000) reported lambing rate
ranging between 108.2 and 119.1 and kidding rates between 120.1 and 133.6 for sub-Saharan
Africa flocks. A composite parameter ARR, a product of the size of the litter and the number
of days in the year divided by the parturition interval (Wilson, 1989) is 0.89 for sheep and 1.03
for goat in this study and comparable to Wilson (1989) reported values ranging between 0.98
and 1.97 for sheep and 1.17 and 2.41 for goats. The same author reported 0.82, 0.85 and 1.46
vales Yatenga sheep in three different years in elsewhere tropical sub-Saharan Africa.
Weaning rate of 52.7% in lambs and 65.2% in kids observed in this study is below findings of
Awotwi and Fynn (1992) reported 85.7% for lambs and 85.8% for kids. Mukasa-Mugerwa et
al. (2002) reported comparable 57% in Horro and higher a 73% in Menz ewes. Lamb survival
rates of 37.0% observed in this study is significantly lower than finding of Mukasa-Mugerwa
et al. (2002) reported 83 and 68 percent, respectively for Menz and Horro sheep. The low
weaning rates and young survival observed in this study clearly depict the high pre-weaning
loss of kid and lamb. This could clearly depict that loss of lamb and kid crops at Alaba
condition is critical.
The reproductive performance of the breeding female is possibly the single most important
factor influencing flock productivity (ILCA, 1990) and there is evident potential of high
69
reproductive efficiency in African indigenous small ruminants (Wilson, 1989; Armbruster and
Peters, 1993; Tatek et al., 2004). Traditional breeders appear to exploit this potential relatively
well, especially in regard to age at first parturition and the intervals between successive births
(Wilson, 1989). Mortality rates reduced the potential productivity. Management and hygienic
measures are important approaches to reduce high lamb and kid losses in traditional flocks.
4.1.2.6 Housing and management practices
About 98.6% of respondents accommodate their flocks in the main houses together with the
family members. Confining of flocks in separate barns (only 0.7% respondents) or adjoining
structures (0.7% respondents) is uncommon. Key informant farmers during group discussion
indicated that the local tradition is that ‘sheep, goats and honey bees survive less in the
absence of smoke from the house fire.’ Flocks are kept in house at night and during the day
when the heat intensity is high. Young animals are kept around the homestead until weaning to
avoid walking long distances in search of feed and water and to minimize exposure to
predators. The major reason for housing flocks at night with the family is to minimize attack
by predators and to avoid theft. Predators rarely destroy barns and also main houses and causes
complete loss of flocks. Fox and hyenas are the major predators. Housing of flocks in the main
house is more common than other reports in the country (Nigatu, 1994; FARM-Africa, 1996;
Berhanu, 1998; Markos, 2000). Confining of flocks together with family has zoonotic health
implications, nevertheless, to reduce predator and theft losses household for long held the
tradition of sharing the same roof with their flocks.
Lambs and kids are often offered with green leaves and leftover food until weaning. In cases
of loss of their dams, young animals are offered with cow’s milk and household leftover foods

70
until they start grazing and browsing. Respondents of 10.7% practiced early weaning
(preventing suckling by herding separately or tethering) of young animals to maintain body
condition of mothers for the subsequent reproduction.
Respondents of 91.3% castrate their male animals. Ninety percent of the households use
traditional methods of castration (stick, stone to crash vas deference of the testes) and the
remaining use modern methods (using Burdizzo) at the Alaba Kulito animal clinic. According
to 68.7% of the total respondents the major reason of castration, is to fatten and sale. Thirteen
percent of the total flock owners in all sites castrate males with undesirable physical
characteristics like black coat color and small body size at early age to avoid breeding. Several
intact males in a household make noises and become restless and difficult to handle thus
18.7% of the respondent castrate their animals to tame. The average age of castration is 1.1
year for sheep and 1.6 year for goat. This is attributed to the households’ interest to castrate
and fatten sheep as early as possible to take advantage of the higher demand and prices at the
present market.
Sheep owing respondents of 65.5% dock the tail of female sheep at an average age of 3.7 days
to facilitate mating. Tail docking at a very early age is done to minimize stress and enhance
recovery. Docking of tail often around middle is done using knife.
Respondents of 57.3% practiced selection of flocks for breeding and fattening purposes.
Breeding female goats are selected for high milk yields considering long ear, large teat and
udder, known local ecotypes for their milking potential from adjacent Arsi (Ropi and Aje) and
other niches.

71
Table 17: Management practices of young, breeding and fattening flocks. Particulars N (%)
Practice weaning 16(10.7)
Castrate male sheep and goats 137(91.3)
Traditional methods 123(89.8)
Modern methods 11(8.0)
Both traditional and modern methods 3(2.2)
Provide special management for fattening animals 120(80.0)
Practice culling of sheep and goat 114(75.8)
Dock tail of female sheep 98(65.5)
Average
Age at tail dock of female sheep (SD) (days) 3.7 (1.94)
Age at castration of rams (SD)( years) 1.1 (0.48)
Age at castration of bucks (SD) (years) 1.6 (0.66)
Sheep for sale at targeted festival/holyday markets either home born or purchased are
selectively castrated and receive fattening managements of supplementation with locally
available feeds and health management (deworming and treatment). For satisfactory final
weights and condition households select fattening sheep with desirable physical characteristics
and known local ecotypes. Sheep from Adilo and other parts of Kambata areas are preferred
for their quick response to fattening management, better adaptation to the local environments
and posses market desirable physical traits (coat colors, ear and horns). Above one-third
respondents of both sheep and goat owners select animals for fattening based on body
conformation (length and body height). Notably, 31.2% of both sheep and goat owning
respondents consider the physical characteristics of the animals.

72
Table 18: Selection of sheep and goats for castration and fattening.
Sheep Goat
Characteristics N (%) N (%)
Conformation 59(34.1) 54(35.1)
Known local ecotypes 20(11.6) 27(17.5)
Physical traits 54(31.2) 48(31.2)
Age 40(23.1) 25(16.2)
Total 173(100.0) 154(100.0)
Respondents of 32.3% sheep and 41.9% goat owners indicated that coat color is one of the
most important traits. White, light brown and mixture coat colors have a preference in that
order in both sheep and goats. The orientation of horns is prominently considered among
41.0% goat and 29.3% sheep owners. The presence, medium size and up-ward orientation of
horns add high aesthetic value. The width, length and fatness of the tail are vitally important in
sheep that 31.7% of the respondents look intently.
Respondents of 23.1% sheep and 16.2% goat owners mentioned that age of the animals is
important factor at the market. Young fattened animals fetch higher prices because of the
tenderness of their meat. Thus, farmers respond to the market requirements by fattening
animals that have often erupted not more than three pairs of incisors during sale. Higher
proportion of households considered age of sheep implies that they are well responding to the
consumers preference that larger terminal traders and consumers in final markets highly
requires the age of animal.

73
Table 19: Desirable physical traits of sheep and goats for breeding and fattening. Physical traits Sheep Goat
Coat color 54(32.3) 49(41.9)
Horn 50(29.9) 48(41.0)
Ear 10(6.0) 14(12.0)
Tail 53(31.7) 6(5.1)
Total 167(100.0) 117(100.0)
About 11.6% sheep and 17.5% goat owning respondents prefer to fatten sheep and goat from
certain known areas or flocks. Adilo is the most preferred site to acquire breeding and
fattening sheep. Goats are preferably acquired from Ropi and Aje localities of south- west
Arsi. The main criteria for choice of animals from specific localities are better response to
management, adaptation to the production environments, good outputs (milk and meat) and
desirable physical characteristics (coat color, conformation, tail, horn, etc).
The study identified that body conformation (height and length) and physical characteristics
(coat color, horn, tail) are the major criteria that household consider to select sheep and goats
for castration and fattening. This is in agreement to the findings of Jaitner et al. (2001) who
reported that growth (conformation and growth rates), color, horns and breeds are important
traits of owners in The Gambian. Coat color and horn in both sheep and goats and tail in sheep
are very important traits. This clearly depicts body conformation and certain physical traits
(tail, coat color, horn) are foremost criteria that producers, traders and consumers critically
consider and accordingly breeding efforts needs to assimilate the stakeholder preferences.

74
4.1.2.7 Acquisition, disposal and culling practices of sheep and goats
The major factors that account to increase and reduction of flock size are shown in Table 20.
Mortality represented 45.5% of total loss in sheep and 49.2% in goats and it was found to be
the major cause for flock size decline in the studied areas. This is considerably higher than the
findings of Workneh (2000) who reported 22.5% of death and other losses for goat flock in
Eastern Ethiopia. Sale removed an average of 1.5 sheep and 1.6 goats per household over a
year time and it constituted total disposal of about 31.1% in sheep and 29.4% in goats.
Workneh (2000) reported comparable result of 35.7% goat exit through sales in Eastern
Ethiopia. Intact male, castrate and weaned young animals are usually sold in need of
immediate cash. Pre-weaned young and breeding females are disposed as the last resort.
Fattened flocks are sold at targeted seasonal festival markets.
Slaughter represents a total disposal of 14.3% in sheep and 8.0% in goat. Workneh (2000)
reported higher exit of goats through slaughter (15.2%) in Eastern Ethiopia. Total loss of
10.7% in goat due to predators attack is higher than 1.0% in sheep. This is due to the fact that
the majority of goats are found in localities where predators are abundant. Share holding is
apparent in sheep flocks represented 5.9% of the total disposal. This could attribute to the
current rising demand and prices for sheep encouraging farms to expand more of sheep flock
through purchase, share holding and gifts.
Birth at home was a major source of building household flock and constituted about 54.9% in
sheep and 63.3% in goat flocks. Purchase, gifts from family and relatives and share holding,
respectively contribute 18.5%, 14.2% and 12.4% of the total sheep acquisitions, while 15.6%,
10.5% and 10.5% for goats.

75
Table 20: Sheep and goat flock dynamics.
Sheep Goat
Routes Percent Percent
Exit through (Subtraction)
Sales 31.1 29.4
Mortality 45.5 49.2
Slaughter 14.3 8.0
Theft/robber 1.4 2.1
Predator 1.0 10.7
Gift/inheritance 0.7 0.6
Share holding 5.9 -
Enter through (Addition)
Home born 54.9 63.3
Share holding 12.4 10.5
Gifts/inheritance 14.2 10.5
Purchased 18.5 15.6
Gifts or inheritances from family and relative are important sources of flock build up. Young
family units are presented with sheep and goat flocks from relatives and family. Share holding
is a local strategy that is of mutual benefit to the poor as well as the rich also harmonizes the
relationship between poor and rich farmers. Flocks are held in share for breeding or fattening
purposes. Agreements are made between the donors and recipients either to share incomes
from sale of the flock or offspring with agreed proportion. Share holding among resource poor
farmers is imperative for efficient utilization of farm resources (feeds, family labor and
housing space) and to build flocks under their existing situations of capital limitation. Framers
with large holdings of flock and scarce farm resources (land, labor, feed, space) share out their

76
flock and gains substantial returns in forms of cash and offspring. This implies that such local
arrangement of flock acquisition may be due to lack of credit services in the area and provision
of credit could further support the ownership and development of sheep and goats. The gross
offtake, total voluntary disposal of animals through sale, slaughter, exchange and/or giving
(ILCA, 1990) accounting 19.1 percent in sheep is higher than goats (12.8 percent). Sale-
offtake accounts 11.9% in sheep and 9.9% in goat flocks while net off-take is 11.3% in sheep
and 9.1% in goats.
Besides to the dynamics of flocks through major exit routes, 75.8% of the respondents
practiced culling out of unproductive or poor performing flocks. Of these 28.4% and 26.8%
respondents, respectively cull flocks with reproductive problems and old age. Breeding
females of both species, with poor mothering ability, and that fails to conceive through
repeated mating and has a known history of repeated abortion are primarily culled from the
system. Aged breeding females are also culled and replaced by young flocks.
Respondents of 17.6% cull their animals for health problems. Similarly, 12.6% respondents
cull animals with physical damage due to mechanical or pathogenic factors. According to
14.5% of the respondents, animals with some undesirable phenotypic characteristics, for
example black coat color, are also culled.
4.1.2.8 Consumption of sheep, goats and their products
Sheep and goat are slaughtered for household meat consumption. Major slaughter are made
during festivals and various family and cultural events representing total slaughter of 53.2 and
42.0 percents, respectively contribute to considerable flock off-take. Major festival of large

77
flock slaughter is during Id Al Fetir fasting periods. Large volumes of flocks are also
slaughtered for Id Al Maulid festivals. In occasions when there is birth, burials, circumcision,
etc sheep and goats are slaughtered. Some 4.5% of the respondents indicated that they
slaughter sheep and goats for wedding ceremony. Slaughter for regular family consumption
other than the major festivals and events is rare and only 0.4% of the respondents do so.
Of those slaughtering households, 97.8% sheep and 83.3% goat owners commonly slaughter
male flock. Female are primarily kept for breeding and seldom slaughtered. Some 13.3 goat
and 2.2% sheep owners responded that when available at home they non-selectively slaughter
either male or female animal during festivals and events. Few households (3.4%) in goat
dominating site slaughter female goats.
The majority (98.9%) of goat keeping respondents in goat dominating and mixed flock sites
milk their flock for household consumption. Within the household member children are the
most frequent consumers (89.9%) of the goat milk. However, in all goat rearing areas, all
household members consume goat milk with coffee. Households having sizeable milking goats
mix goat milk with cow milk and processes into dairy products. Goat milk is believed to have
medicinal value and is consumed by about 5.6% sick family and 4.5% aged people. This is in
agreements with previous reports by Nigatu (1994). Sheep are not milked at all in the area as
there is no custom of consuming sheep milk. However, key informants affirmed that this is due
to the low lactation yield of sheep and they do not produce surplus besides to their offspring.
This is in agreement to findings of Legesse et al. (2007) reported that sheep are not milked in
the adjacent Adilo areas. Due to uses of goats milk and milk products for home consumption
78
(97.8%) and lack marketing tradition and access (2.2%) goat milk and milk products are not
marketed.
4.1.2.9 Sheep and goat skin production and preservation
Sheep and goat skins are important by-products. Respondents of 68.2% and 59.2%,
respectively produced sheepskins and goatskins sold the skin. However, 20.5% sheepskins and
26.7% goatskins producers used the skins locally as prayer’s mat. About 64.0% of the total
respondents make certain precaution during flaying and apply preservations. This is in
agreement to Akloweg and Workneh (2004) reported that air drying and curing with salt are
common practice of skin preservation in Ethiopia. Respondents of 68.1% and 31.9%,
respectively employ common preservation measures of sun or smoke drying and application of
salt to retain the quality of the skins. Respondents pass skins to markets on average of 2.2 days
after slaughter. This is one of the reasons for the poor quality of skins in the woreda, as it is
characterized by hot climate which enhances deterioration of skin quality. Akloweg and
Workneh (2004) highlighted that when skin is left uncured, the combination of water and
bacteria will cause putrefaction at a rate dependent upon the surrounding temperature.
The major quality defects respondents confront are flay-cut (52.1%) and contamination with
bacteria and dirt (29.0%). Damages due to excessive drying of skins constitutes about 15.4%
of the total defects. Small size of skins and meat left on skins contributes to 1.3 and 1.5 percent
of the skin defects. Sixty percent of the total respondents do not brand their flocks (Table 15)
to avoid damage to the skin and to get better prices from quality skin they present to market
and thus defects due to branding were not worth mentioning.

79
Development efforts in production and supply of quality skin have been carried out in the
woreda and rewarding outcomes were reported. For example, a UNIDO pilot project aimed at
reducing losses in skins and hides related with poor production, collection, preservation and
marketing has been implemented in Alaba woreda. The project provided training for
professionals, slaughter house and private skin and hides workers), financial and material
supports (Zewdu, 1998; OoARD7, 2007).
Table 21: Main uses of sheep and goat skins.
Sheepskin Goatskin Purposes N (%) N (%) Sale 90(68.2) 89(59.3)
Bed/seat sheet 12(9.1) 16(10.7)
For pack animals 3(2.3) 3(2.0)
Prayer mat 27(20.5) 40(26.7)
House decoration (put on wall) - 2(1.3)
Total 132(100.0) 150(100.0)
One of the outcomes of the projects was institutionalization of identifying defects and grading
systems of the hides and skins. Identification of defects has created awareness in the common
defects and their effects on grade of the skins and this might have equipped both traders and
producers with basic knowledge that has probably helped them to minimize defects and
produce acceptable grades of skins.
7 Project document from the Desk of Livestock and Fisheries Development, Alaba Special Woreda OoARD

80
4.1.2.10 Extension services in sheep and goat production
The majority of the respondents (75.2%) reported that the existing extension system is not
providing any assistance in sheep and goat development. Some 10% of the respondents who
had received improvement techniques did not apply to their flocks because it was not relevant
to their problems, affordable, and accessible or was not easy to apply. Development agents
provided about 73.0% of the development techniques. Support from NGOs (5.4%) is very low.
Respondents of 13.5 and 8.1 percent, respectively learnt improvement practices from their
neighbors and Kebele administrators.
About 52.8% of the respondents indicated that the improvement practices obtained through
meetings in the Kebele. The other 25.0, 19.4 and 2.8 percent respondents, respectively had
trained, heard from friends and made practical tour. Training was mainly offered to the safety-
net program beneficiaries. The intervention embraces distribution of sheep and goats coupled
with training on feeding, health and fattening managements.
4.1.2.11 Institutions and innovations in sheep and goat production and marketing
Institutional support in sheep and goat production is limited to health services which are
basically irregular on-farm flock vaccinations and services at the Kulito station. About 76.3%
of the respondents obtain health services from the woreda OoARD with modest cash charge.
About 19.3 and 4.4 percent of flock owners obtain alternative veterinary services from illegal
sources and private veterinary centers.
Access to credit services in the area is very much limited and only 6.7% of the total
respondents received credit. Ninety percent of the credit received in kind (animals). The major

81
source of credit is the OoARD offered about 80.0% of the total credit for fattening of sheep,
goats and cattle. About 40.0% of the total credit targeted women and the remaining 60.0% to
men.
Flock building through credit and gifts from NGOs and GOs comprises 23.3% and 20.0%,
respectively. On the other hand, the majority (56.7%) of the total respondents received
breeding and fattening flocks through share holding arrangements. About 22.1% of the total
respondents confirmed the existence of cooperatives in their localities mainly operates in crop
production through delivery of inputs to producers and later collect, store, market the products
and allocate income to members.
Table 22: Sheep and goat development supportive interventions and institutions. Particulars N Percent
Households received credit
In cash
In kind
From governmental offices (OoARD)
From NGOs
For crop production
For sheep, goats and cattle fattening
Husband taken
Wives taken
10
1
9
8
2
1
9
6
4
6.7
10.0
90.0
80.0
20.0
10.0
90.0
60.0
40.0
Received sheep and goats in gifts or other means
Credit
Gift from NGOs, GOs
Share [fattening = 5.9%; breeding = 94.1%]
30
7
6
17
20.1
23.3
20.0
56.7
82
4.2 Sheep and goat marketing system
4.2.1 Market participants
As indicated in section 4.1.1.6 nearly one-third of the respondents (31%) (Table 5) rear sheep
and goats to generate income. Smallholder farmers are the main suppliers of the animal and
sale at any time when immediate income is required.
One-third (33%) of the considered households also purchase animals for breeding (76%),
slaughter (16%) and fattening purposes (8%). Rural assemblers buy animals from farm gates
and local markets to sale in Alaba Kulito and other surrounding markets. They are usually
farmers who run business often during off-farm seasons to generate income from trade of
sheep and goats or other animals (cattle and equines). They purchase few animals usually
below 10 and visit different incentive markets (Alaba, Besheno, Adilo, etc). They maintain the
unsold animals on their farms until sold in subsequent market days. This implies that local
assemblers are in a better position to maintain flocks to sale in incentive season and market
place unlike medium and large traders in urban areas face serious difficulty of holding the
unsold animals.
Individual consumers or those provide catering services purchase animals from Alaba Kulito
and other local markets. Household consumers often purchase during cultural and religious
holidays/festivals. Agents for export abattoirs purchases animals from Alaba and other
surrounding markets. They usually purchase young male sheep and goats on live weight basis
within body weight range of 13-30 kg for both sheep and goats. They supply animals to the

83
export abattoirs. The demand of export abattoirs often reach peak during Muslim fasting
period for the export market in the Gulf of Arabia regions.
Specialized and large traders of terminal markets (Addis Ababa and Shashemene) purchase
sheep and goats from Alaba Kulito and other surrounding markets for major cultural and
religious holidays/festivals. They visit only during holidays/festivals seasons however,
purchase large number of fattened male animals with higher body weight and body condition
and gorgeous physical characteristics (color, tail, horn). Animals purchased from local markets
get to their destination by truck. Transporters prefer to carry small ruminants that they have
light weight compared to other agricultural commodities (cattle and grains).
Various governmental and non-governmental organizations purchase large number of breeding
and fattening sheep and goats from Alaba area. These include institutions within the region or
other regions. The Alaba woreda OoARD also purchases large number of animals from the
local markets with ‘Safety-Net’ funds obtained from donors channeled through the regional
food security coordination office and targets the destitute and vulnerable farmers to support
food security at the household level. These excess demands and raised purchases tend to
shoots-up sale prices and this in turn motivates local farmers to sale as many animals as
possible; affecting household flock production through the removal of young breeding flocks.
This is in agreement to Workneh (2006) reported that the current market prices may offer
greater incentives in the short-term than the longer-term advantages of retaining inputs for
breeding and this place serious concern to the present sudden surge of the rising off-take on
supplies of replacement breeding stock.

84
Brokers are involved in transactions and transportations of animals and obtain commission of
unfixed amount from sellers, buyers and transporters. They are not legalized and their roles
are controversial for the different market participants. Farmers complain about the high
commission charges, misbehavior, misinformation and repel buyers if not involved. However,
traders who come from distant locations require guarantee of local brokers for any
disagreement arising after purchase of the animals (when sold by thieves/robbers and family or
share holders disagree to sale). Brokers often involve personal and residential details of sellers
and buyers and easily manage discrepancies.
4.2.2 Mode of marketing and price setting
The majority of the producers, about 96.7% market their animals on ‘eye-ball’ estimation. Few
farmers (2.0%) prefer to sale on live weight basis for it fetches better prices. Animals marketed
on live weight basis are only young male animals required by the export abattoirs. Producers
of 37.0% prefer “eye-ball” marketing for it fetches better prices and that of 36.3% prefer for
majority of their customers purchases on ‘eye-ball’. Animals are marketed on individual basis
and agreement to prices reached after a long one-to-one bargaining between buyers and sellers
and some times brokers. Local and terminal traders and exporter agents are better informed of
the demands and prices of animals and are decisive to fix prices. Producers usually sale with
the trader prices for their immediate income needs. This is in agreement with findings of
Kebede and Rey (1992). However, 17.1% respondents market in ‘eye-ball’ due to lack of
marketing on live weight bases and conversely some 9.6 percent respondents do not thrust
measurement accuracy (weighing scale). Households preferring live weight marketing
acknowledge incentive prices (50%), save energy and time (25%) and preference of their
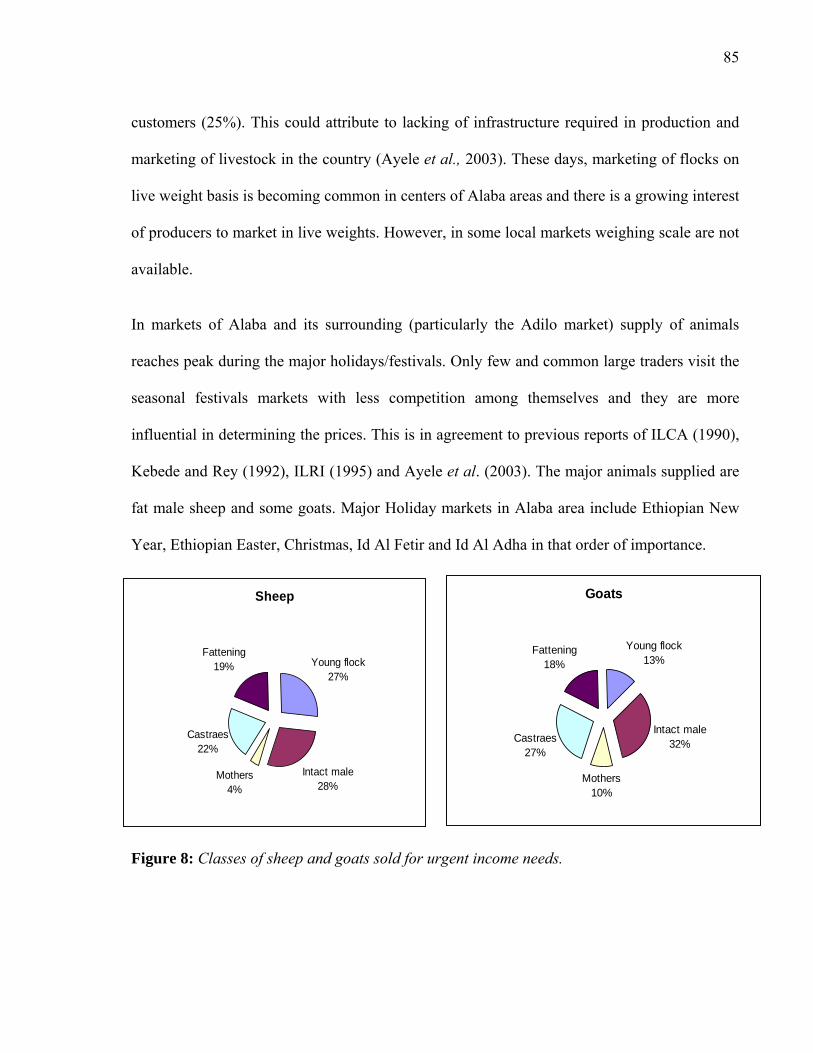
85
customers (25%). This could attribute to lacking of infrastructure required in production and
marketing of livestock in the country (Ayele et al., 2003). These days, marketing of flocks on
live weight basis is becoming common in centers of Alaba areas and there is a growing interest
of producers to market in live weights. However, in some local markets weighing scale are not
available.
In markets of Alaba and its surrounding (particularly the Adilo market) supply of animals
reaches peak during the major holidays/festivals. Only few and common large traders visit the
seasonal festivals markets with less competition among themselves and they are more
influential in determining the prices. This is in agreement to previous reports of ILCA (1990),
Kebede and Rey (1992), ILRI (1995) and Ayele et al. (2003). The major animals supplied are
fat male sheep and some goats. Major Holiday markets in Alaba area include Ethiopian New
Year, Ethiopian Easter, Christmas, Id Al Fetir and Id Al Adha in that order of importance.
Goats
Young flock 13%
Intact male 32%
Mothers10%
Castraes 27%
Fattening 18%
Figure 8: Classes of sheep and goats sold for urgent income needs.
Sheep
Young flock 27%
Intact male 28%
Mothers4%
Castraes 22%
Fattening 19%
86
For urgent farm income requirements, 32% of goat and 28% of sheep owners largely prefer to
dispose intact male followed by castrates (22% sheep and 27% goats) for they earn reasonable
income. Young lambs (27%) and kids (13%) are often sold by the households but fetches low
price. Comparable fattened sheep (19%) and goats (18%) are also sold for immediate cash.
Breeding females are considered as a last resort (does 10% and ewes 4%) to sale when other
flocks are all sold. Higher sale of breeding does (10%) might attributes to the high sale rate of
flocks including breeding does in goat dominant site. These Kebeles are drought prone and
often encounter crop failures for household consumption and sale and the households sale as
large as possible flocks to generate income and purchase food for their family.
4.2.3 Household marketing
4.2.3.1 Purposes of sales
Sheep and goat are sold to fulfill immediate farm cash requirements. Thirty-five of the total
respondents sold their sheep and goats to purchase food items. The woreda is known to be
drought prone and the sale rate is highest during crop failures and before harvest of staple food
crops. Households of 17.6% sale sheep and goats to generate incomes for purchasing farm
inputs during cropping seasons. Sheep and goat are often at immediate disposal for several
income requirements in the rural households. In these household sheep and goats are
considered as the major farm buffering assets. Rural households do not sale large animals and
other farm resources for urgent needs because acquiring back them is not easy. Therefore
sheep and goat are always at disposal to buffer disaster of the farm households.

87
Table 23: Purposes of sale of sheep and goats.
Mixed flock site
Goat dom. site
Sheep dom. site
Overall Test
Purposes N (%) N (%) N (%) N (%) χ2 P-value Purchase farm inputs 7(12.7) 9(18.0) 19(20.2) 35(17.6) 6.265 0.180
School expenses 59.1 () 7(14.0) 13(13.8) 25(12.6) 2.463 0.651
Medical expenses 8(14.5) 4(8.0) 12(12.8) 24(12.1) 3.556 0.469
Escape loss risks 2(3.6) - 1(1.1) 3(1.5) 0.750 -
Purchase food items 19(34.5) 22(44.0) 28(29.8) 69(34.7) 4.139 0.388
Pay back credits 7(12.7) 7(14.0) 13(13.8) 27(13.6) 7.902 0.095
Purchase livestock, cloth, assets, etc
7(12.7)
1(2.0)
8(8.5)
16(8.0)
0.686
0.953
Total 55(100.0) 50(100.0) 94(100.0) 199(100.0)
4.2.3.2 Types of animals marketed and their prices
All age, sex and weight classes of sheep and goats with majority of young flocks are marketed.
An average number of 1.8 male and 1.4 female young sheep and 1.8 of both male and female
young goats per household are the dominantly sold flock compared to others. Sale price of
378.1 Birr and 334.4 Birr for fattened sheep and goats, respectively and purchase prices of
190.0 Birr and 220.0 Birr for fatten sheep and goats, respectively are high. Average sale price
for all animals of similar category is higher than that of purchase prices except for ewes and
young female lambs their purchase price is higher than sale price. This could be attributed to
the fact that female animal are required for breeding and purchased usually after crop harvests.
Thus the relatively sufficient cash after crop harvests and the high demand of female sheep
(lamb and ewes) for breeding purpose contribute to higher purchasing prices than the selling
prices.

88
Table 24: Classes and sizes of household marketed flocks and their prices (Birr).
Sold Sale prices Purchased Purchase prices
Types and classes of flocks Mean(SD) Mean(SD) Min Max Mean(SD) Mean(SD) Min Max
Sheep
Breeding females/ewes 1.5(0.9) 121.8(23.8) 80 167 1.9(1.4) 139.5(24.5) 100 190
Breeding/intact male 1.2(0.4) 136.2 (37.0) 80 210 1.0(0.0) 145.0(26.5) 120 180
Young females (3-12 months) 1.4(0.7) 89.0(24.6) 40 120 1.3(0.5) 107.7(32.1) 65 190
Young males (3-12 months) 1.8(0.9) 88.1(27.0) 54 150 1.7(1.2) 97.3(32.6) 60 120
Castrate/fatten 1.5(0.9) 334.4(105.3) 245 550 1.0 190.0 190 190
Goats
Breeding females/does 1.7(0.8) 140.3(36.9) 85 210 1.3(0.5) 134.0(30.4) 93 180
Breeding/intact male 1.5(0.7) 110.2 (27.7) 63 155 1.1(0.4) 90.7(21.9) 60 120
Young females (3-12 months) 1.8(0.8) 92.5(32.1) 53 170 1.0 60.0(14.1) 50 70
Young males (3-12 months) 1.8(0.9) 91.6(24.9) 50 150 1.0 75.0 75 75
Castrate/fatten 1.4(0.5) 378.1(126.3) 220 600 1.0 220.0 220
89
4.2.4 Market locations and routes
Farmers market sheep and goats at farm gates or the nearest local/primary markets. Farmers
use all markets found in their localities regardless of political boundaries and ethnic and
cultural differences. Farmers of Alaba Special Woreda found adjacent to the Oromia Region
State, Silti, Hadiya and Kambata administrative zones of SNNP enter to their nearest
respective markets. Aje and Ropi markets (Oromia), Alem Gebeya and Silti Mazoria markets
(Silti Zone, SNNP), Bonosha market (Hadiya zone, SNNP), Damboya and Adilo markets
(Kambata zone) are the main markets farmers use. Besheno, Guba, Mito and Kobo are the
small local markets found in the woreda that farmers in nearby localities use. Households in
the mixed flock and sheep dominant sites market their sheep and goats in Alaba Kulito market
whereas producers in goat dominant sites often enters to Besheno market. Sale price of
animals in Alaba Kulito is perceived to be better than other local markets. However, farmers
sale in markets near to their localities to avoid walking long distances, and to minimize
transaction costs and personal expenses. For urgent income needs farmers also visit markets in
the nearest days in either near or distant locations. Except on Sundays, one can find market
days throughout the week in near radius areas.
Farmers and rural assemblers from different local markets (Figure 9 and Appendix 11) supply
animals to Alaba Kulito market. Thursday followed by Tuesday, is the major market day for
sheep and goats of varying sex, age and weight. There are two possible exit market routes
through which animals from Alaba area reach to the final consumers (Figure 10). The first
route is agents of export abattoirs collect young male sheep and goats from the local markets.
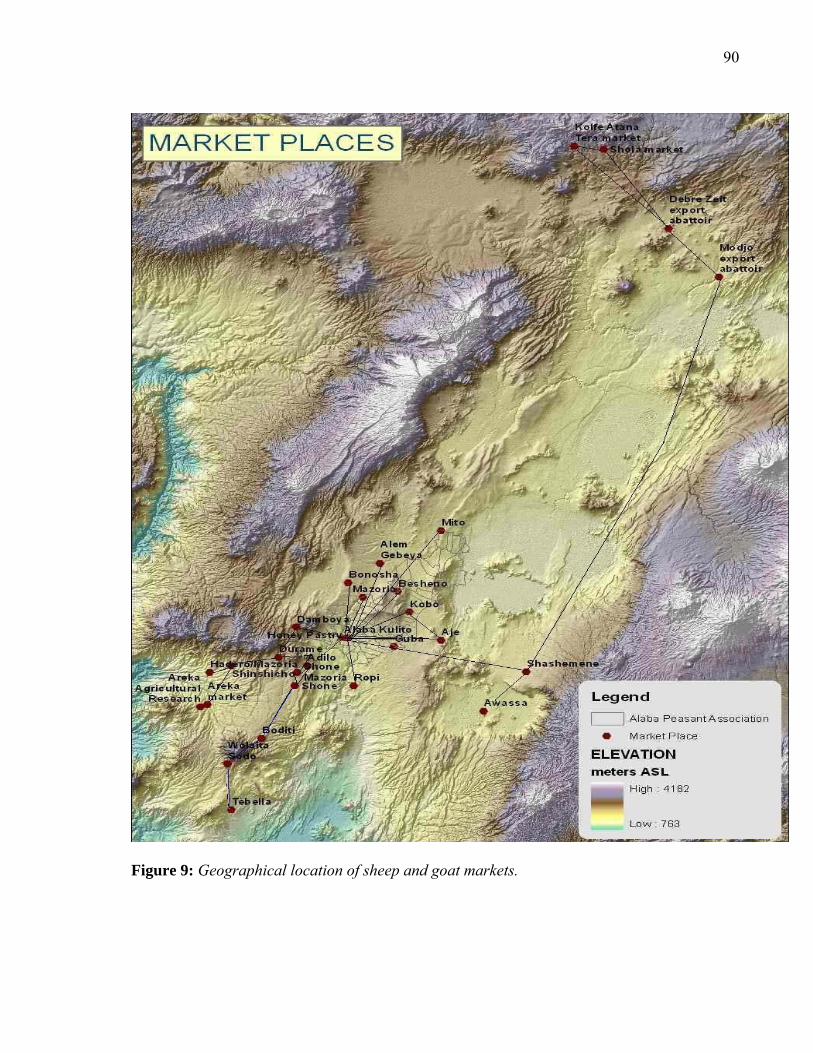
90
Figure 9: Geographical location of sheep and goat markets.
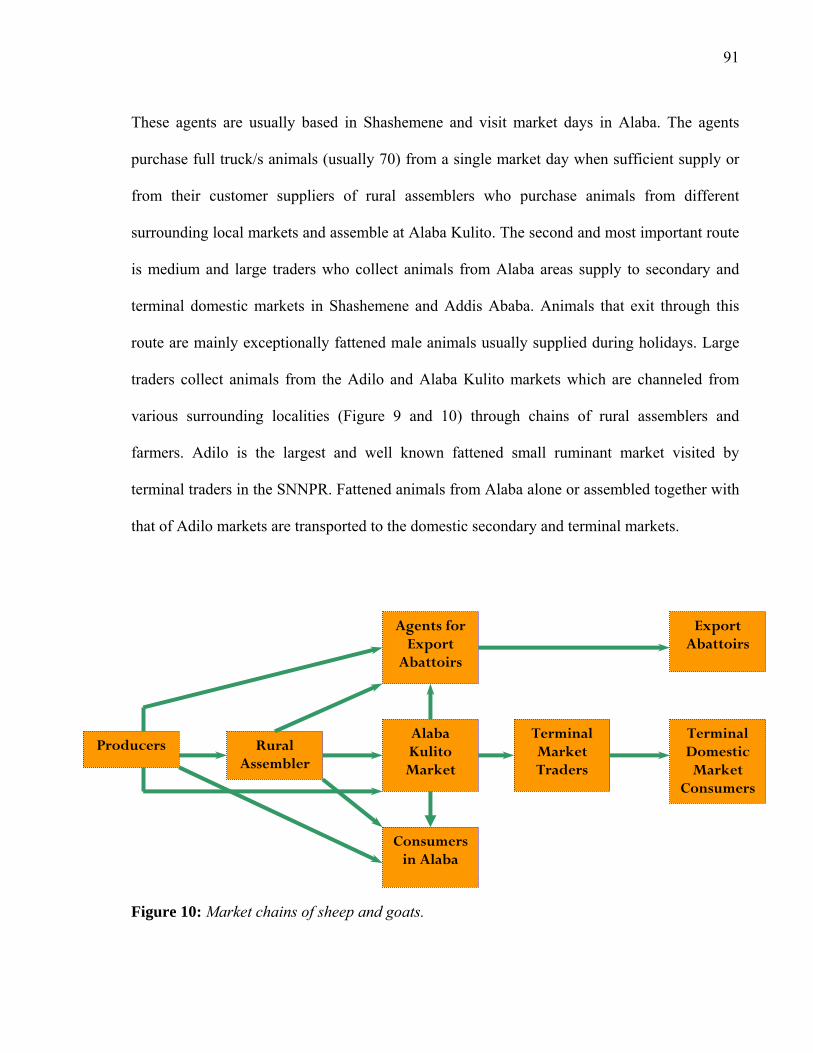
91
These agents are usually based in Shashemene and visit market days in Alaba. The agents
purchase full truck/s animals (usually 70) from a single market day when sufficient supply or
from their customer suppliers of rural assemblers who purchase animals from different
surrounding local markets and assemble at Alaba Kulito. The second and most important route
is medium and large traders who collect animals from Alaba areas supply to secondary and
terminal domestic markets in Shashemene and Addis Ababa. Animals that exit through this
route are mainly exceptionally fattened male animals usually supplied during holidays. Large
traders collect animals from the Adilo and Alaba Kulito markets which are channeled from
various surrounding localities (Figure 9 and 10) through chains of rural assemblers and
farmers. Adilo is the largest and well known fattened small ruminant market visited by
terminal traders in the SNNPR. Fattened animals from Alaba alone or assembled together with
that of Adilo markets are transported to the domestic secondary and terminal markets.
Figure 10: Market chains of sheep and goats.
Consumers in Alaba
Terminal Domestic Market
Consumers
Terminal Market Traders
Alaba Kulito
Market
Rural Assembler
Producers
Agents for Export
Abattoirs
Export Abattoirs

92
Agents of export abattoirs and medium and larger terminal traders purchase considerable
number of sheep and goats from Alaba Kulito market and represent major channel of flock exit
from Alaba area.
4.2.5 Seasonality in marketing
There is a remarkable pattern of seasonal variation of animal supply, demand and price. The
variability in sales is typical to the seasonal holiday markets, crop planting and harvesting
seasons and drought seasons and years. During major cultural and religious holidays demand
for animals, supply by the producers and prices of animals increases. Accordingly, the
majority (67.0%) of the households prefer to sales their animals during festival markets. Major
targeted markets in Alaba area are Muslim holidays.
Majority (66.2%) of flock purchase is made immediately after crop harvest with income from
sale of crop. Sheep and goats serve as savings and accumulation of assets. Respondents of 33.8
and 20.3 percent respectively purchase and sale flocks during planting seasons. Flock sales of
20.3% were made during planting seasons to purchase farm inputs (seed, fertilizer and farm
implements). Demand for animals during holidays and crop harvest seasons is high and the
prices paid is also higher than other seasons in the year. Household supply of animals
corresponds to the seasonal holiday markets. Trends of prices for sheep and goats over years
and seasons also had shown variation (Appendix Table 9 and 10). Sheep and goats prices in
recent years are growing. April and May had higher price of sales than other months
throughout the considered year. Sale rates during crop failure and drought seasons are
considerably high to generate income for purchasing family food and consumption items.

93
Table 25: Percentage of households target seasonal festival markets.
Mixed flock site
Goat dom. site
Sheep dom. site
Overall Test
Target markets N (%) N (%) N (%) N (%) χ2 P-value New Year 18(18.9) 21(15.9) 37(21.8) 76(19.1) 9.842 0.007
Easter 22(23.2) 11(8.3) 32(18.8) 65(16.4) 28.710 0.000
Christmas 9(9.5) 17(12.9) 21(12.4) 47(11.8) 0.651 0.722
Meskel - 5(3.8) - 5(1.3) 7.759 0.021
Id Al Adha 20(21.1) 39(29.5) 35(20.6) 94(23.7) 0.826 0.662
Id Al Fetir 26(27.4) 39(29.5) 45(26.5) 110(27.7) 4.943 0.084
Total 95(100.0) 132(100.0) 170(100.0) 397(100.0)
About 27.7% and 23.7% of the total respondents, respectively targets the Id Al Fetir and Id Al
Adha Muslim holidays/festivals. Large proportion of the respondents in goat dominating
Kebeles targets these markets in particular. New Year and Easter are commonly targeted by
respondents in Kebeles where sheep or mixed flocks dominate. Meskel is rarely targeted only
reported in goat dominating Kebeles where households in these Kebeles take their animals to
the adjacent Meskel celebrating Gurage and Silti areas.
This is in agreement to previous findings reported peak supplies, sales and prices of sheep and
goats during holidays in Nigeria (Jabbar, 1998) and Ethiopia (Kebede and Ray, 1992; Ehui et
al., 2000). Ehui (2000) reported that in Addis Ababa households are more likely to buy live
sheep during the quarters in which the Ethiopian New Year and Easter fell (August–October
and May–July, respectively). Jabbar (1998) highlighted that higher price at short mainly
festival-related peak periods may not contribute much to the increased small ruminant
production. The same author proposed that production technologies that require extra cash or
94
labor may not be in high demand among subsistence oriented farmers and under such
circumstances, production technologies that contribute to year-round increased supply, such as
disease control measures that would increase flock size and provide farmers with better
leverage, may make a better overall contribution to aggregate supply.
4.2.6 Preferences of domestic markets to the local animals
New Year, Easter, Christmas, Id Al Fetir and Id Al Adha in that order are peak seasonal
markets when the supply, demand and prices of animals reaches peak in Addis Ababa sheep
and goat markets. For these distinctive markets, traders from Addis Ababa visit different sheep
and goat markets in the country. Animals are collected, assembled and transported to terminal
markets as the festival days approach. This is to minimize animal management requirements
and to avoid loss/decline in condition of fattened animals.
Visits by large traders to the various parts of the country is based on their prior knowledge to
the locations, the type, condition and volume of animals supplied, financial capacity for
purchase and transport, transport accessibility, preferences and requirements of the major
urban customers and the production and marketing skills of the local producers.
In Addis Ababa, sheep and goats are sold along asphalt road sides and it is the mode of animal
display to attract consumers/travelers. ‘Shola’, ‘Kolfe Atana Tera’, ‘Addisu Gebeya’ and
‘Kera’ localities are the main market locations. Traders take their animals to these locations
based on the requirements and preferences of the major customers of respective locations.
Sheep are dominant over goat in supply, demand as well as in price in Addis Ababa markets.

95
Sheep from Debre Berhan, South region, Wollega, Jimma and Jiru areas are well known local
animals demanded in Addis Ababa.
In Addis Ababa, sheep from various niches of southern region particularly from Adilo, Alaba,
Kambata Tambaro, Dawuro, Wolaita, Gamo Gofa and Hadiya areas are collectively termed as
“Wolaita sheep”. They are highly preferred by the Addis Ababa consumers and fetch highest
prices than sheep from other parts of the country. According to the consumers, the major
reason they prefer these animals is the pleasant flavor and tenderness of meat, relatively young
aged (usually break not more than to two three pairs of milk teeth), high carcass and edible
non-carcass component yields and high aesthetic value (attractive physical appearance in terms
of coat color, conformation, hair types and body condition).
According to Jabbar (1998) such significant volume of purchase and strong preference by
buyers for specific species and breeds attribute due to long established consumer preferences
and cultural tradition. Higher prices for certain breeds paid by buyers indicate that there is
excess demand for the breed and this imply that producers and sellers could benefit from
increased production by targeting specific buyer categories and times of the year to sale their
animals, thereby taking advantage of existing market niches (Jabbar, 1998). This study clearly
depicts that areas producing the fattened “Wolaita sheep”, including Alaba and other broad
woredas and zones of SNNPR could have enormous room of incentive domestic market
provided that the smallholder production situations are well addressed and intervened.

96
4.2.7 Consumption patterns of individual and catering services
Catering service providers and individual consumers in Alaba utilize sheep and goats. The use
of goat meat in both Muslim and Christian catering services is scarce. This is attributed to the
attitude of local consumers who perceive goat meat makes digestive discomforts.
In Alaba area both service providers and consumers prefers beef over small ruminant meats.
Service providers prefer to slaughter cattle that it is more profitable with satisfactory services
in terms of reasonable quantities, diverse meals and acceptable prices. For reasons of low
carcass and edible non-carcass yields, high mutton and goat meat prices and small quantity and
few meal types (tibs, dulet and wots), sheep and goats are less preferred in the service
businesses. A variety of meals including kurt, kitfo, milas-senber, gored-gored, zilzil and betin
tibs, kornis, gubet, mahiberawi, sekondo, etc are prepared from beef with satisfactory
quantities and reasonable prices. In Alaba Kulito town, few service providers with accustomed
consumers slaughter 2-5 sheep per day.
Rural households and urban resident in Alaba slaughter large numbers of sheep and goats
during the Id Al Fetir fasting period and Id Al Adha holidays. Considerable number of sheep
and goats are also slaughtered for New Year, Easter and Christmas in Alaba town.
4.2.8 Marketing infrastructures and price information
Of the total visited sheep and goat rural market places that enter to and exit from Alaba, 61%
are fenced. All terminal markets are not fenced. The fences were constructed by the respective
town municipalities. In all the markets, animals whether marketed or not are charged once at
the enclosure exit routes. The amount of charge varies from 1 to 2 birr, with an average of 1.13

97
birr. Farmers complained that they are repeatedly charged for a single animal until it sold in
subsequent market days. This is in agreement to Tsedeke and Endrias (2006) who reported
similar complaints of Wolaita and Dawuro farmers on repetitive tax. In fenced areas,
collection of the charges is undertaken properly. However, in markets without enclosures, like
Adilo the process of collecting taxes sometimes involves armed police force and various other
people and it is so tiresome, time consuming and complicated. Occasionally, in an attempt to
by-pass the charge collectors, conflicts between the rural producers and police causing
physical injuries are apparent. Terminal markets are free of charges however traders are
charged 1.00 birr/head of animals on purchase markets and in entry to Addis Ababa.
There is no any market infrastructure facilitating marketing of small ruminants and other
animals in all the surveyed markets. Price information, animal holding grounds and other
marketing supportive schemes are lacking in all the surveyed markets. This is in concord
among others with Kebede and Ray (1992), Ayele et al. (2003) and Workneh (2006) who
reported very weak or non-existence of livestock market support services and infrastructure in
the country. Market information/intelligence at rural farms is practiced in such a way that total
farmers of about 38.7% planned to sale their animal obtain status of current price information
from their neighbors/friends/relatives visited or who marketed animals in the nearest market
days or the farmer himself makes reconnaissance market survey. When the income required
from the sale of an animal is not for urgent purposes, farmers wait for incentive market
seasons or uses to the nearby market places.
Price information of domestic and export markets is not clear in the current marketing systems
and traders are sensitive and unwilling to inform the purchasing and sale prices in end markets.
98
In the absence of market information system, the share of the total value that producers receive
is minimal and discourages production (ILCA, 1990; ILRI 1995).
Export agents purchase animals on live weight basis with varying prices across market
locations of Alaba area based on distance and accessibility for transportation. This is a more
organized marketing system that they purchase and sale on a live weight basis however, the
seasonal purchase price is vague for producers and other market participants. Workneh (2006)
affirmed that most of the livestock keepers in Ethiopia have a very weak market orientation
and their mode of production is largely subsistent; they do not have easy access to up-to-date
market information; they rely heavily on the limited and seasonal domestic livestock markets.
Market information is crucial to producers, wholesalers and consumers to help them make
decisions on what and whether to buy and sell (ILRI, 1995).
4.2.9 Sheep and goats skin marketing
Sheep and goat skin is an important by-product marketable in Alaba area. The skins are sold in
rural markets for individual collectors, in Alaba Kulito town for legal collectors and illegal
individuals. In Alaba skins are used for various purposes and the majority (60% of sheepskins
and 59.3% of goatskins) is sold at rural and urban markets. Muslim households use
considerable sizes of sheepskins (18.0%) and goatskins (26.7%) for prayer mat. However,
goatskin is commonly used compared with the sheepskin which might be due to lower price of
goatskin compared to sheepskin. Considerable, 31.8 and 40.7 percent, respectively total sheep
and goat skins produced at household were not marketed and instead used for various
household purposes.
99
This clearly indicates that large proportion of skins produced in rural areas like observed in
Alaba might used for various household purposes and such tradition of misusing the skins in
various parts of the country make large cumulative loss to the national benefit obtained from
domestic leather industry utilizing the raw material and export markets.
One-third (33.3%) of the total households sale their sheep and goat skins to illegal individual
collectors and only 19.3% sales to legal collectors in Alaba Kulito town. Illegal collector sale
skins to the large trader in Shashemene town. These individuals are headache for the legal hide
and skin businesses in the town. They do not pay trade taxes and other legal fees and also do
not spend preservation costs. As a result they pay modestly higher prices for producers. Rural
collectors purchases about 24.5% of the total skins and they are usually agents for legalized
traders in Alaba Kulito or sometimes sale to the illegal collectors. Collectors in Besheno
market which is large market located in near distances to Andegna Tuka, Bendo Choloksa and
Udana Meno Kebeles collects considerable skins of about 22.7%.
An average sale price of 24.82 Birr ranging from 19 to 30 Birr for sheepskin is nearly about
four fold higher values to the 6.53 Birr ranging from 3 to 14 Birr of goatskin. One of the
reasons households prefers sheep over goats is the high value of its skins.

100
4.4 Sheep and goats production and marketing: constraints and opportunities
Smallholder farmers rearing sheep and goat confess a range of interlinked technical, socio-
economic and institutional bottlenecks. Constraints requiring proper and timely intervention
towards improved smallholder sheep and goat production were identified. Existing and
emerging opportunities that tie-up improved production and incentive benefit to producers and
traders were also identified.
4.4.1 Sheep and goat production constraints
Constraints hampering performances of smallholder sheep and goat are presented in Table 26.
One quarter of total flock owners across all the study sites reported that diseases and parasites
are overriding problems in sheep and goat production. Respondents reported the problem of
diseases and parasites across the sites were not significantly different (P>0.05). This clearly
depict that it is a major cross-cutting impediment to the flock production. Considerable flock
owners, 98.7 and 64.0 percent, respectively reported the occurrence of morbidity and mortality
to their flocks. Diseases and parasites contributing 34.6% of the total flock loss is the largest
single factor to the immense flock mortality (21.7% in sheep and 25.3% in goats). The effect
of morbidity on productive and reproductive performances of the flocks is also apparently
higher. Limited capacity and coverage of the existing public veterinary institution to serve the
broad geographical area and vast livestock population in the woreda further worsen
consequence of diseases and parasites.
The situation of inadequate quantity and quality of feed and nutrition reported across the study
sites differ significantly (P<0.05). About one quarter percent respondents both in mixed flock

101
and sheep dominating sites are significantly higher (P<0.05) than that of 9.2 percent
households in goat dominating site face difficulty of providing adequate and quality feeds to
their flocks. Feed shortages encounter often during cropping seasons but widespread through
out the year when lands are covered with both Belg and Meher crops.
Table 26: Major constraints of sheep and goat production.
Mixed
Flock site
Goat
dom. site
Sheep
dom. site
Overall Test
Constraints N (%) N (%) N (%) N (%) χ2 P-value
Diseases and parasites 30(24.4) 59 (25.8) 60(24.0) 149(24.8) 1.510 0.470
Feeds and nutrition 29(23.6) 21(9.2) 55(22.0) 105(17.4) 58.571 0.000
Water 2(1.6) 53(23.1) 4(1.6) 59(9.8) 100.619 0.000
Labor shortage 2(1.6) 1(0.4) 4(1.6) 7(1.2) 2.023 0.364
Drought 8(6.5) 16(7.0) 14(5.6) 38(6.3) 0.211 0.900
Predators 4(3.3) 50(21.8) 15(6.0) 69(11.5) 57.206 0.000
Lack of technologies/inputs 17(13.8) 10(4.4) 29(11.6) 56(9.3) 18.85 0.000
Lack of extension support 22(17.9) 14(6.1) 44(17.6) 80(13.3) 36.161 0.000
Lack of capital 9(7.3) 5(2.2) 25(10.0) 39(6.5) 17.637 0.000
Total 123(100.0) 229(100.0) 250(100.0) 602(100.0)
In contrast, shortage of water is a major constraint in goat dominating Kebeles than in others.
About 6.3% of the total respondents mentioned that the recurrent drought is major ground to
the feed and water scarcity. Flock losses by predator are devastating in goat dominating site
than the others. Group discussants exasperatingly responded the massive attack of fox to
young and that of hyena and other wild animals to the adult flock. Significant (P<0.05)
households (29.1%) in this site reported destruction of their flock by predator.
102
An overall of about 9.3% respondents reported lack of improved technologies and inputs for
intensive and market-oriented sheep and goat production. This is more noticeable (P<0.05) in
mixed flock and sheep dominating Kebeles that have better market access and limited land
holdings. Technological inputs to mitigate the clear and present danger of flock health and
nutrition are critical requisite. Lack of capital to build flock holding and purchase production
inputs (largely health and feeding) is among limiting factor for about 6.5% of the total
respondents.
The total and significant (P<0.05) households (13.3%) condemned that the current extension
system is providing them little support to enable them expand their flock production. It is
anticipated that the extension service system could impartially support the farming activities
that uphold the livelihood of the smallholder farmers. Sheep and goat are providing an evident
contribution through income, food, manure, saving and social and cultural functions. However,
the current extension system in the woreda is undergoing insignificant intervention towards
addressing the identified bottlenecks.
4.4.2 Marketing constraints of sheep and goats and skin
Marketing of sheep and goat and their skins generate significant incomes to the rural
households. However, they face various marketing constraints. Households selling sheep and
goat are often interfered by brokers.
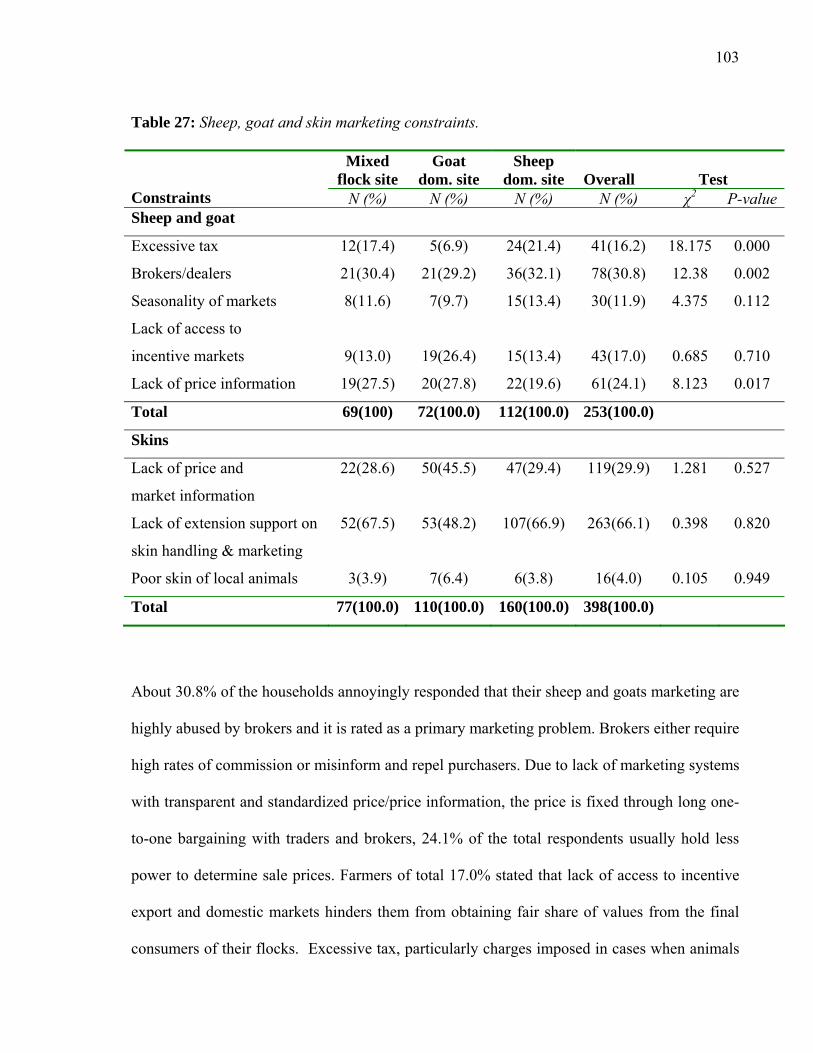
103
Table 27: Sheep, goat and skin marketing constraints.
Mixed flock site
Goat dom. site
Sheep dom. site
Overall Test
Constraints N (%) N (%) N (%) N (%) χ2 P-valueSheep and goat
Excessive tax 12(17.4) 5(6.9) 24(21.4) 41(16.2) 18.175 0.000
Brokers/dealers 21(30.4) 21(29.2) 36(32.1) 78(30.8) 12.38 0.002
Seasonality of markets 8(11.6) 7(9.7) 15(13.4) 30(11.9) 4.375 0.112
Lack of access to
incentive markets
9(13.0)
19(26.4)
15(13.4)
43(17.0)
0.685
0.710
Lack of price information 19(27.5) 20(27.8) 22(19.6) 61(24.1) 8.123 0.017
Total 69(100) 72(100.0) 112(100.0) 253(100.0)
Skins
Lack of price and
market information
22(28.6) 50(45.5) 47(29.4) 119(29.9) 1.281 0.527
Lack of extension support on
skin handling & marketing
52(67.5) 53(48.2) 107(66.9) 263(66.1) 0.398 0.820
Poor skin of local animals 3(3.9) 7(6.4) 6(3.8) 16(4.0) 0.105 0.949
Total 77(100.0) 110(100.0) 160(100.0) 398(100.0)
About 30.8% of the households annoyingly responded that their sheep and goats marketing are
highly abused by brokers and it is rated as a primary marketing problem. Brokers either require
high rates of commission or misinform and repel purchasers. Due to lack of marketing systems
with transparent and standardized price/price information, the price is fixed through long one-
to-one bargaining with traders and brokers, 24.1% of the total respondents usually hold less
power to determine sale prices. Farmers of total 17.0% stated that lack of access to incentive
export and domestic markets hinders them from obtaining fair share of values from the final
consumers of their flocks. Excessive tax, particularly charges imposed in cases when animals

104
are not sold in one or more market days, was complained by about 16.2% of the total
households. Incentive sheep and goats markets appear only during major festival and thus
about 11.9 percent of the total respondents should bound themselves to these seasonal
marketing.
Regardless of the high value of skins to the rural households, traders, processors and the
nation, the current extension system is not providing any support to farmers in aspects of skin
production, preservation and marketing. As the result, 66.1% of the farmers produce poor
quality skins with various defects and receives low price. Households of 29.8% consider lack
of marketing and price information affected their skin marketing while some 4% reported that
flocks affected by ectoparasites and poor nutrition produced poor quality skin.
Skin marketing involves multifaceted problems from the local producers until it reaches the
processing plants. Farmers usually supply skins through extended days contaminated with dirt
and microbes and deteriorated. Traders collect and apply a range of preservation processes
including removing meat leftovers, applying salt, drying, washing, packing, trade certifying
and transporting. The processors at terminal markets are few in number and could alone fix
prices. Further, they have affinity to skins from certain locations and markets. According to
skin traders, skins from Alaba area are rated to be poor compared with that of Awassa,
Shashemene, Wolaita Sodo, and Arba Minch areas in the southern region. The local hides and
skins processing units operate with poor processing and preservation facilities and
inexperienced workers. Illegal traders make high competition to the raw materials in local
areas. These all coupled with the poor marketing systems (ambiguous grading and

105
standardization, absence of price information and non-competitive trade) makes potential
drawbacks on production and marketing of skins from Alaba area.
4.4.3 Opportunities
Modest interventions on the existing flock impediments, for example minimizing flock loss
through diseases and parasites control and protection against predators and proper feeding
during Belg and Meher cropping seasons could potentially boost the flock performances. The
local sheep flocks demonstrate remarkable response to the local fattening management
practices and possess desirable physical characteristics adding high aesthetic value. The local
feeding management system entirely depended on natural pastures of spicy herbs drawn the
preference of urban consumers like the present “organic agricultural products”.
There is a growing demand for sheep and goats in both the domestic and export markets.
Young male flocks have huge demand of export abattoirs. Rural assemblers and agents for
export abattoirs collect these young flocks at farm gates and local markets. Fattened flocks
have high demand and incentive price during seasonal Holiday markets with peak demands in
New Year and Easter holidays. Adilo is a potential local market for fattened flocks.
Smallholder farmers are aware of the current high market values and demand for sheep and
goats. Several development partners involved in higher learning, research and development are
currently committed to sheep and goat development in the woreda. These could facilitate entry
of intervention (inputs, technology and recommendation). The support of safety-net
programme of OoARD is making substantial contribution in building flock holdings targeting
women and destitute households.

106
Considering these emerging and existing opportunities, the extension system needs to organize
and guide to focus on sheep and goat production and marketing in order to improve income
and enhance smallholder livelihoods.
107
5. SUMMERY AND CONCLUSIONS
The sheep and goat flocks manifest a distinct pattern of distribution in the woreda with
different flock sizes. Intervention works in different parts of the woreda needs to correspond to
the household flock holdings and preferences; relevant to either the larger sheep, largely goat
or both sheep and goat mixed holding.
Larger part of the flock is composed of young lambs and kids and ewes and does while others
often exit through high sale off-take to fulfill immediate household cash needs for which sheep
and goat are at immediate disposal.
Major sheep and goat feeds obtained from grazing on crop stubble, private pasture, road side,
communal pasture, weeds, tillers and fillers, local browses and cut-and-carry of local browses
and grasses. Feed availability largely depends on the season of the year when lands are
covered with either Meher or Belg season crops. Quality and quantity of the seasonal available
feeds are usually inadequate. Optimum utilization of seasonal available feeds through
preservation of crop residues and grasses and strategic supplementation with low cost
alternatives like development of improved forage is vital to balance seasonal feed supply and
animal requirements.
River, pond, trough water, harvested water, rain and well water are common source of flock
water. Flocks inaccessible to rivers suffer from severe water shortage and households often in
goats dominating Kebeles water their flocks at extended intervals. Strategic development and
use of the village ponds (proper collection of the rain water, proper use systems optimizing the

108
livestock density and other purposes using the pond water) to alleviate severe water shortage is
indispensable.
Flock morbidity and mortality are exceedingly noticeable and diseases and parasites cause
massive loss of the flocks. Predators cause immense loss of young kids in goat dominating
Kebeles. The veterinary service needs to provide strategic disease and parasite control and
treatment measures. Timely reaction to the disease outbreaks and establishment of low-cost
and readily available local veterinary service through trained community members needs to be
devised. Housing and close supervision of young lambs and kids is obligatory to avoid the
devastating attack of predator. Diseases and parasites causing high flock morbidity and
mortality are not evidently identified and requires further clinical and laboratory investigation
to pinpoint diagnostic and preventive measures. Various ethno-veterinary practices are applied
in the study area. However, its veterinary importance needs further investigation.
Major lambing and kidding come about in wet season when adequate feed available both for
the lactating mothers and new borne. Reproductive performances of the flocks are within
satisfactory ranges with the possibility of further improvement through appropriate strategies
of feeding management and husbandry practices.
Households make intense selection of breeding and fattening flocks considering body
conformation, physical characteristics and known local ecotypes for higher marketable weight
together with desirable body characteristics in sheep and premium dairy characteristics in
goats. Goats are extensively milked for family consumption. Breeding systems strictly needs
to consider the animal traits producers and consumers demand.

109
Households enter into nearest market places within and outside the region. Adilo is a potential
local flock market. Marketing, supply, demand and price of sheep and goats are typically
seasonal and reaches peak during the major holidays. Fattened flocks are largely marketed
during festival markets and highly demanded by Addis Ababa consumers. New Year, Easter,
Christmas, Id Al Fetir and Id Al Adha are peak seasonal holidays in major terminal markets.
Majority of the Muslim households are accustomed to the Muslim holidays. However,
nowadays there is apparent awareness to the incentive religious and traditional festivals and
they are evenly targeting incentive Christian and traditional festival markets. Demand for
young flocks in the export abattoirs are also reaching peak during the Muslim fasting period.
There are more than five potential holiday markets with sufficient duration to complete
fattening cycles. Households rear few sheep and goats mixed with other livestock. Targeting
the seasonal holiday market demands and consumer preferences could largely benefit the
producers and requires planned breeding or acquisition of flocks with moderate prices (poor
conditioned or young flocks), appropriate inputs (feeds, supplements, deworming, etc) and
intensive management practices.
Extension and institutional supports rendered in sheep and goat development are minimal.
Sheep and goat are crucial in the livelihood of the smallholder farmers. Taking this into
consideration the extension and institutional systems are mandated to commit in alleviating the
widespread barriers hindering the performance of flocks so that the producers could benefit
from the flocks they keep. Inputs and improved technologies relevant to the smallholder need
to be delivered.

110
Minimizing the involvement of brokers in marketing processes and delivery of update
marketing information requires consideration of marketing development. Marketing
intervention of equipping marketing infrastructures and delivery of market and price
information for efficient marketing requires national policy platforms. Barriers to local and
export markets should disappear and encourage producers and traders.
Goat meat consumption in Alaba area is limited. However, there is an emerging pattern of goat
meat consumption in big cities. In Awassa there is an exceptional way of roasting goat meat
and high interest and demand of consumption. Likewise, consumption of raw goat meat in
Addis Ababa and other big cities is noticeable. Simple cooking techniques and consumption
behavior from big cities could be adopted to Alaba and this possibly enhances the offtake and
prices of animals at local markets thereby benefit the producers.
Household level fattening managements is extensive through extended period using generous
farm inputs. Partial budget analyses of the smallholder fattening operation could show
profitability of the enterprise. Research needs to provide information on efficient and
economic utilization of the available resources.
In drier weina dega Kebeles of the woreda sale off-take of flocks including breeding stock
during severe drought seasons is considerably higher to generate income for purchase of food
items. Considerable number of household awfully raised their complete removal of flocks to
purchase food items during severe drought. Copping strategies to alleviate the food shortage
during severe drought season through food-for-work, cash-for-work, food-aids or credit needs
to be devised.

111
Quantitative aspects of marketing (supply, demand, prices, producer and consumer behavior)
require prompt further investigation to provide complete marketing information.
The private sector needs to be encouraged in areas of sheep and goat development like the
currently growing floriculture industry by generating and availing appropriate information for
investment on the potential benefits to be gained from the growing domestic and export
markets.

112
6. REFERENCES
Abebe Mekoya, Alemu Yami and Mekonen H/Mariam. 2000. Management of traditional
sheep production in Lallomamma Mider Woreda, North Shoa, Amhara Region. In:
ESAP (Ethiopian Society of Animal Production) 2000. Livestock production and the
environment-Implication for sustainable livelihoods. Proceedings of the 7th conference
of the Ethiopian Society of Animal Production (ESAP) held in Addis Ababa, Ethiopia,
26-27 May 1999. ESAP (Ethiopian Society of Animal Production), Addis Ababa,
Ethiopia. pp143-153.
Abule Ebro. 1998. Role and decision making power of women in livestock production around
Adami Tulu. ESAP (Ethiopian Society of Animal Production). Proceedings of 6th
Annual Conference of the ESAP held in Addis Ababa, Ethiopia, August 14-15 May
1998. pp95-102.
Addisu Tiruneh, Teklu Tesfaye, Wilfred Mwangi and Hugo Verkuiji. 1998. Gender
differentials in smallholder livestock production in the central highlands of Ethiopia.
ESAP (Ethiopian Society of Animal Production). Proceedings of 6th Annual
Conference of the ESAP held in Addis Ababa, Ethiopia, August 14-15 May 1998.
pp19-27.
Adugna Tolera. 1990. Animal production and feed resource constraints in Wolaita Sodo and
the supplementary value of Desmodium intortum, Stylosanthes guianensis and
Macrotyloma axillare, when fed to growing sheep feeding on a basal diet of maize
stover. MSc. Thesis, Agricultural University of Norway, Aas, Norway. 134pp.

113
Adugna Tolera. 1998. Production Situation and Some Productivity and physical Characters of
Traditionally Managed Sheep and Goats in Kochore District, Southern Ethiopia. J.
Appl. Anim. Res. 13 (1998): 49-59.
Adugna Tolera., Markel, R.C., Goetsch, A.R., Sahlu, T. and Tegene Negesse. 2000.
Nutritional Constraints and future prospects for goat production in East Africa. In:
The opportunities and challenges of enhancing goat production in East Africa.
Proceeding of a conference. Markel, R.C., Abebe, G. and Goetsch, A.L. (eds.) 113-
117. Langston Univ., OK (USA). E (Kika) da la Garza Inst. for Goat Research; Debub
Univ. Awassa (Ethiopia). College of Agriculture, 10-12 Nov. 2000, Awassa, Ethiopia.
Agajie Tesfaye, Chilot Yirga, Mengistu Alemayehu, Elias Zerfu and Aster Yohannes. 2002.
Smallholder livestock production systems and constraints in the Highlands of North
and West Shewa zones. ESAP (Ethiopian Society of Animal Production). Proceedings
of 9th annual conference of the ESAP held in Addis Ababa, Ethiopia, August 30-31,
2001. ESAP pp49-71.
Agyemang, K., Negussie Akalework, Vurtuizen, A. and Anderson, F.M. 1985. A rapid survey
of sheep production in the traditional sector of Debre Berhan area, Ethiopian highlands.
In: Wilson, R.T. and Bourzat, D. (eds). Small ruminant in African Agriculture. ILCA,
Addis Ababa, Ethiopia. pp 175-185.
Ahmadu B. and Lovelace C.E.A. 2002. Production characteristics of local Zambian goats
under semi-arid conditions. Small Ruminant Research 45 (2002) 179–183.

114
Ahmed Mahmud. 2000. Development potential and constraints of hides and skins marketing in
Ethiopia. In: The opportunities and challenges of enhancing goat production in East
Africa. Proceeding of a conference. Markel, R.C. ,Abebe, G. and Goetsch, A.L. (eds.)
113-117. Langston Univ., OK (USA). E(Kika) da la Garza Inst. for Goat Research;
Debub Univ. Awassa (Ethiopia). College of Agriculture, 10-12 Nov. 2000, Awassa,
Ethiopia.
Akloweg Nigatu and Workneh Ayalew. 2004. Observation on the Effect of Levels of Salt and
Stocking Periods on Putrefaction in Preserving Sheep skin at Three Altitudes in
Ethiopia. Asfaw Yimegnuhal and Tamrat Degefa (Eds). Proceedings of the 11th
Annual conference of the Ethiopian Society of Animal Production (ESAP) held in
Addis Ababa, Ethiopia, August 28-30, 2003. ESAP, Addis Ababa. pp121-127.
Amsalu Sisay, Baars, R. and Zinash Sileshi. 2002. Herbaceous species composition, dry
matter production and condition of the major grazing areas in the mid rift valley of
Ethiopia. Proceedings of 9th annual conference of the Ethiopian Society of Animal
Production (ESAP) held in Addis Ababa, Ethiopia, August 30-31, 2001. ESAP
(Ethiopian Society of Animal Production) pp 267-283.
Armbruster, T and Peters, K.J. 1993. Traditional sheep and goat production in southern Côte
d’Ivoire. Small Ruminant Research, 11 (1993) 289-304.
Awotwi, E.K and Fynn, K.E. 1992. Reproductive performance of sheep and goats on
“backyard farms” in southern Ghana. African Livestock Research (1992) 2: 46-49.

115
Ayele Solomon, Assegid Workalemahu, Jabbar M.A., Ahmed M.M and Belachew Hurissa.
2003. Livestock marketing in Ethiopia: A review of structure, performance and
development initiatives. Socio-economics and Policy Research Working Paper 52.
ILRI (International Livestock Research Institute), Nairobi, Kenya.
Baars, R.M.T. 1998. Costs and return of camels and small ruminants in pastoral herds of
Eastern Ethiopia. P. 162-175. In: Proceedings of the Sixth Ethiopian Society of
Animal Production, 14-15 May 1998. A. Ababa, Ethiopia.
Beets, W. C. 1990. Raising and sustaining productivity of smallholder farming systems in the
tropics. A hand book of sustainable agricultural development. Alkmaar, Holland, AgBe
publisher, 1800GC.
Berhanu Belay. 1998. Traditional Sheep Management and Production Situation in The South
Western Parts of Ethiopia. Proceeding of 5th Conference of ESAP. pp. 117-127.
Berhanu Gebremedhin, Pender J. and Girmay Tesfay. 2002. Collective action for grazing land
management in mixed crop–livestock systems in the highlands of northern Ethiopia.
Socio-economics and Policy Research Working Paper 42. ILRI (International
Livestock Research Institute), Nairobi, Kenya. 28 pp.
Bureau of Statistics and Population (BSP). 2004. Regional Atlas. Awassa, Ethiopia.
Central Agricultural Census Commission (CACC). 2003. Ethiopian Agricultural Sample
Enumeration, 2001/02. Results for Southern Nations, Nationalities and Peoples’
Region. Statistical Report on Livestock and Farm implements. Part IV. (July 2003),
Addis Ababa, Ethiopia.

116
Central Agricultural Census Commission (CACC). 2003. Ethiopian Agricultural Sample
Enumeration, 2001/02. Results at country level. Statistical Report on Farm
Management Practices, Livestock and Farm implements. Part II. (July 2003), Addis
Ababa, Ethiopia.
Central Agricultural Census Commission (CACC). 2003. Ethiopian Agricultural Sample
Enumeration, 2001/02. Results at country level. Statistical report on socio-economic
characteristics of the population in agricultural household, land use, and area and
production of crops. Part I. (July 2003), Addis Ababa, Ethiopia.
Combellas, J. 1980. Production and reproduction parameters of tropical sheep breeds in
improved production systems. Trop Anim Prod 1980 5:3.
CSA (Central Statistics Authority). 2004. The 2001/02 Ethiopian Agricultural Sample
Enumeration (EASE), Executive Summary, May, 2004, Addis Ababa, Ethiopia.
Delgado C., Rosegrant M., Steinfeld H., Ehui S. and Courbis C. 1999. Livestock to 2020: The
next food revolution. Food, Agriculture, and the Environment Discussion Paper 28.
IFPRI (International Food Policy Research Institute), Washington, DC, USA. 72 pp.
Devendra, C. (2007). Small ruminants in Asia; Contribution to food security, poverty
alleviation and opportunities for productivity enhancement.
http://www.mekarn.org/procsr/Devendra.pdf (Accessed in February 2007).
Devendra, C. and Burns, M. 1983. Goat Production in the Tropics. Commonwealth
Agricultural Bureaux (CAB). Farnham Royal, UK. 184pp.

117
Dinksew Taye and Girma Abebe. 2000. Socioeconomic aspect and husbandry practices of
sheep in Awassa. In: The opportunities and challenges of enhancing goat production in
East Africa. Proceeding of a conference. Markel, R.C., Abebe, G. and Goetsch, A.L.
(eds.) 113-117. Langston Univ., OK (USA). E (Kika) da la Garza Inst. for Goat
Research; Debub Univ. Awassa (Ethiopia). College of Agriculture, 10-12 Nov. 2000,
Awassa, Ethiopia.
EARO (Ethiopian Agricultural Research Organization). 2000. National Small Ruminants
Research Strategy Document. EARO, Addis Ababa, Ethiopia.
Ebrahim Jemal, Abdissa Abelti, Tatek Woldu, Mengistu Nigussie and Berhanu Shelima. 2004.
Smallholder Cattle Marketing in the Central Rift Valley of Oromiya, Ethiopia. Asfaw
Yimegnuhal and Tamrat Degefa (Eds). Proceedings of the 11th Annual conference of
the Ethiopian Society of Animal Production (ESAP) held in Addis Ababa, Ethiopia,
August 28-30, 2003. ESAP, Addis Ababa. pp129-140.
Ehui S.K., Benin S. and Nega Gebreselassie. 2000. Factors affecting urban demand for live
sheep: The case of Addis Ababa, Ethiopia. Socio-economics and Policy Research
Working Paper 31. ILRI (International Livestock Research Institute), Nairobi, Kenya.
32 pp.
Endeshaw Assefa. 2007. Assessment on production system and marketing of goats at Dale
district (Sidama Zone). MSc Thesis. University of Hawassa, Awassa, Ethiopia.
Ewnetu Ermias, Alemu Yami and Rege, J.E.O. 2006. Slaughter characteristics of Menz and
Horro Sheep. Small Ruminant Research 64 (2006) 10-15.
FAO (Food and Agriculture Organization of the United Nations). 1994. Production Yearbook.
Food and Agriculture Organization. Rome, Italy.

118
FAO (Food and Agriculture Organization of the United Nations). 1997. An international
statistical database 1961-1998 on CD-ROM. FAO, Rome, Italy.
FAO (Food and Agriculture Organization of the United Nations). 2002. Cattle and Small
Ruminant Production Systems in sub-Saharan Africa - A Systematic Review. Otte, M.J.
and Chilonda, P. (eds). Livestock Information Sector Analysis and Policy Branch.
FAO, Rome, Italy.
FARM-Africa. 1996. Goat Types of Ethiopia and Eritrea. Physical description and
management systems. Published jointly by FARM-Africa, London, UK and
International Livestock Research Institute, Nairobi, Kenya.
Fernanddez-Rivera,S., Okike, I., Manyong, V., Williams, T.O., Kruska, R.L. and Tarawali,
S.A. 2004. Classification and description of then major farming systems incorporating
ruminant livestock in west Africa. Williams T.O., Tarawali S.A., Hienaux and
Fernandez-Rivera S (eds). 2004. Sustainable crop-livestock production for improved
livelihoods and natural resource management in West Africa. Proceeding of an
international conference held at then International institute of Tropical Agriculture
(IITA), Ibadan, Nigeria, 19-22 November 2001. ILRI (International Livestock
Research Institute), Nairobi, Kenya and CTA (Technical Centre for Agriculture and
Rural Cooperation, ACP-EC), Wageningen, The Netherlands. 528+12pp.
Foote, W.C. 1991. Reproduction in hair sheep under different climatic conditions. In:
Wildeus, S. (Ed.), Proceedings of the Symposium on Hair Sheep Research.
Agricultural Experiment Station. University of the Virgin Islands, St. Croix, USA. pp
273-290.

119
Gebre-Egziabher Gebre-Yohannes, Mulugeta Kebede and Gemeda Duguma. 1998. Cattle
branding: animal curative or skin destructive? Case study around Bako. ESAP
(Ethiopian Society of Animal Production). Proceedings of 6th Annual Conference of
the ESAP held in Addis Ababa, Ethiopia, August 14-15 May 1998. pp95-102.
Gemeda Duguma, Takele Kumsa, Ulfina Galmessa, Solomon Abegaz and Gebregziabher
Gebreyohannes. 2005. Mortality and Reported Clinical Signs in Horro Sheep at
Smallholder Farms in East Wollega and West Shoa Zones, Ethiopia. Eth. J. Anim.
Prod. 5(1) - 2005: 33-42.
Getinet Ameha, B.P.Hegde, Bekele Taffese, Enyew Negusse and Workneh Ayalew. 2005.
Phenotypic Characterization of Goat Types in Northwestern Ethiopia. Eth. J. Anim.
Prod. 5(1) - 2005: 13-31.
Girma Abebe, Maerkel, R. C. and Sahlu, T. 2000. Enhancing food security and income
generation potential of families in Southern Ethiopia through improved goat
production and extension: A progress report of an ALO-funded project. In: The
opportunities and challenges of enhancing goat production in East Africa. Proceeding
of a conference. Markel, R.C., Abebe, G. and Goetsch, A.L. (eds.) 113-117. Langston
Univ., OK (USA). E (Kika) da la Garza Inst. for Goat Research; Debub Univ. Awassa
(Ethiopia). College of Agriculture, 10-12 Nov. 2000, Awassa, Ethiopia.
Gryseels, G. 1988. Role of livestock on mixed smallholder farms in the Ethiopian highlands. A
case study from the Baso and Worena near Debre Berhan. Dissertation. Agricultural
University, Wageningen. The Netherlands.

120
Holtzman, J.S. 2002. A guide to developing agricultural markets and Agro-Enterprise. AA Inc
- lnweb18.worldbank.org.
http://lnweb18.worldbank.org/essd/essd.nsf/a235c63e6d2292758525686600709883/37
343b58a4cf229c852568ae0012cbff/$FILE/Rapid%20Appraisals.pdf (Accessed in
February 2007).
IBC (Institute of Biodiversity Conservation). 2004. The State of Ethiopia’s Farm animal
Genetic Resources: Country Report. A Contribution to the First Report on the State of
the World’s Animal Genetic Resources. IBC, May 2004. Addis Ababa, Ethiopia.
Ibrahim H. 1998. Small Ruminant Production Techniques. ILRI Manual 3. ILRI (International
Livestock Research Institute), Nairobi, Kenya. 207 pp.
ILCA (International Livestock Centre for Africa). 1990. Livestock systems research manual.
Working Paper 1, Vol. 1. ILCA, Addis Ababa, Ethiopia. 287 pp.
ILCA (International Livestock Center for Africa). 1991. A hand Book of African Livestock
Statistics. Working Document No. 15. August 1991. A. Ababa, Ethiopia.
ILCA (International Livestock Center for Africa). 1993. ILCA’s Long term strategy,
1993-2010. ILCA, Addis Ababa, Ethiopia, pp.102.
ILRI (International Livestock Research Institute). 1995. Livestock Policy Analysis. ILRI
Training Manual 2. ILRI, Nairobi, Kenya. pp. 264.
ILRI (International Livestock Research Institute). 2000. Handbook of livestock statistics for
developing countries. Socio-economic and Policy Research Working papers 26. ILRI
(International Livestock Research Institute), Nairobi, Kenya. 299pp.
ILRI (International Livestock Research Institute). 2000. Livestock Strategy to 2010: Making
the Livestock Revolution Work for the Poor. ILRI, Nairobi, Kenya.

121
Improving Productivity and Market Success (IPMS) Ethiopia. 2005. Alaba Pilot Learning Site
diagnosis and program design. IPMS, ILRI (International Livestock Research
Institute), Addis Ababa, Ethiopia. Unpublished Report.
Jabbar, M.A. 1998. Buyer preferences for sheep and goats in southern Nigeria: A hedonic
price analysis. Livestock Policy Analysis Brief No. 7. International Livestock Research
Institute (ILRI), Nairobi, Kenya.
Jabbar, M.A. 1998. Market niches for increased small ruminant production in southern
Nigeria. Livestock Policy Analysis Brief No. 18, International Livestock research
Institute (ILRI), Nairobi, Kenya.
Jabbar, M.A., Tambi, E. and Mullins, G. 1997. A methodology for characterizing dairy
marketing systems. Market-Oriented Smallholder Dairying Research Working
Document 3. International Livestock Research Institute (ILRI), Nairobi, Kenya.
Jahnke Hans E. 1982. Livestock production systems and livestock development in tropical
Africa. Kieler Wissenschaftsverlag Vauk, kiel, Germany. 273pp.
Jaitner, J., Sowe, J., Secka-Njie, E. and Dempfle, L. 2001. Ownership pattern and management
practices of small ruminants in The Gambia - implication for a breeding programme.
Small Ruminant Research 40 (2001) 101-108.
Kassahun Awgchew. 2004. The State of Ethiopia's Farm Animal Genetic Resources-Country
Report: A Contribution to the First Report on the State of the World's Animal Genetic
Resources. ESAP (Ethiopian Society of Animal Production) Newsletter. Issue No. 10,
2004.

122
Kebebe Ergano, Tewodros Tefera and Waktole Tiki. 2006. Sustainability of livelihoods
strategies in Southern Ethiopia: Evidence from Umbullo watershed. Getnet Alemu,
Atsede Assefa, Edilegnaw Wale and Yihenew Zewdie (Eds). Proceedings of the 3rd
International Conference on the Ethiopian Economy held in Addis Ababa, Ethiopia,
June 2-4, 2005. Volume 1. Ethiopian Economic Association (EEA), Addis Ababa,
Ethiopia. pp187-212.
Kebede Andargachew and Ray B. 1992. Intra-annual sheep price patterns and factors
underlying price variations in the central highlands of Ethiopia. Rey B., Lebbie
S.H.B., and Reynolds L. (eds). 1992. Small ruminant research and development in
Africa. Proceedings of the First Biennial Conference of the African Small Ruminant
Research Network, ILRAD, ILCA Nairobi, Kenya, 10-14 December 1990.
Lakew Desta, Menale Kassie, Benin S. and Pender J. 2000. Land degradation and strategies
for sustainable development in the Ethiopian highlands: Amhara Region. Socio-
economics and Policy Research Working Paper 32. ILRI (International Livestock
Research Institute), Nairobi, Kenya. 122 pp.
Getahun Legesse, Girma Abebe, Siegmund-Schultze, M. and Valle Zarate, A. 2007. Small
ruminant production in two mixed-farming systems of southern Ethiopia: Status and
prospects for improvement. Experimental Agriculture (In press).

123
Markos Tibbo. 2000. Livestock production constraints in a M2-2 sub-agro ecological zone with
special reference to goat production. In: The opportunities and challenges of
enhancing goat production in East Africa. Proceeding of a conference. Markel, R.C.,
Abebe, G. and Goetsch, A.L. (eds.) 113-117. Langston Univ., OK (USA). E (Kika) da
la Garza Inst. for Goat Research; Debub Univ. Awassa (Ethiopia). College of
Agriculture, 10-12 Nov. 2000, Awassa, Ethiopia.
Mukasa-Mugerwa, E., Anindo, D., Sovani, S., Lahlou-Kassi, A., Tebely, S., Rege, J.E.O. and
Baker, R.L. 2002. Reproductive performance and productivity of Menz and Horro
sheep lambing in the wet and dry seasons in the highlands of Ethiopia. Small Ruminant
Research 45 (2002) 261-271.
Ngategize, P.K. 1989. Constraint identification and analysis in African small ruminant
systems. In. Wilson R T and Azeb M (eds). African small ruminant research and
development. ILCA, Addis Ababa, Ethiopia.
Nigatu Alemayehu. 1994. Characterization of indigenous goat types of Eritrea, Northern and
Western Ethiopia. M.Sc. Thesis. Alemaya University of Agriculture, Alemaya,
Ethiopia. 148 pp.
Payne, W.J.A. and Wilson, R.T. 1999. An introduction to Animal Husbandry in the tropics.
Blackwell Science Ltd, pp. 447-484.
Peters, K. J. and Horpew, T. 1989. Trends in on-farm performance testing of cattle and sheep
in sub-Saharan Africa. ILCA African Livestock Research (editor). Cattle and sheep
performance testing in sub-Saharan Africa. ILCA Bulletin No. 35–December 1989.
International Livestock Centre for Africa, Addis Ababa, Ethiopia.
124
Rawlings, P., Agyemang, D., Clifford, D. and Bojang, N. 1992. Ownership pattern and
management of small ruminants, equines and pigs in The Gambia. African Livestock
Research (1992) 2:50-56.
Rebeka Amha. 2006. Impact Assessment of rainwater harvesting ponds: The case of Alaba
woreda, Ethiopia. MSc Thesis. Addis Ababa University, Addis Ababa, Ethiopia.
Rege, J.E.O. 1993. Indigenous African small ruminants: a case for characterization and
improvement. In: Lebbie S H B. Rey B and Irungu E K. (Eds). Small Ruminant
Research and Development in Africa. Proceedings of the Second Biennial Conference
of the African Small Ruminant Research Network, AICC, Arusha, Tanzania, 7-11
December 1992. ILCA (International Livestock Centre for Africa)/CTA (Technical
Centre for Agricultural and Rural Co-operation). ILCA, Addis Ababa, Ethiopia. 268
pp.
Schaffer, J. D. 1973. "On the concept of subsector studies", American Journal of Agricultural
Economics 55: 333-335.
Schaffer, J. D. 1980. "Food system organization and performance: Toward a conceptual
framework", American Journal of Agricultural Economics 62(2): 310-318.
Sinn, R., Ketzis, J., Chen, T. 1999. The role of women in the sheep and goat sector. Small
Ruminant Research 34 (1999) 259-269.
Solomon Bekure, de Leeuw P N. Grandin B E and Neate P J H (eds). 1991. Maasai herding:
An analysis of the livestock production system of Maasai pastoralists in eastern
Kajiado District, Kenya. ILCA Systems Study 4. ILCA (International Livestock Centre
for Africa), Addis Ababa, Ethiopia. 172 pp.

125
Solomon Gizaw Gebremichael. 2006. Genetic diversity and conservation priorities
for Ethiopian sheep. Proceedings of a workshop on Sheep Breeding Strategies for
Ethiopia held at ILRI, Addis Ababa, Ethiopia on 21 November 2006. ILRI
(International Livestock Research Institute), Nairobi, Kenya.
SPSS. Version 12.0. 2003. Software Package for Social Sciences for Window.
Steele, P. 1998. The International Marketing of Hides and Skins and Leather. Proceeding of
conference. Phase II. Ministry of Agriculture, Addis Ababa, Ethiopia and Technical
Cooperation Programme, FAO, Italy, Rome: MoA Conference on In-Service Training
Exercise on Hides and Skins Improvement, Addis Ababa (Ethiopia), 9-12 Feb 1998.
Tadelech Hailemichael. 1998. Opening Address. ESAP (Ethiopian Society of Animal
Production). Proceedings of 6th Annual Conference of the ESAP held in Addis Ababa,
Ethiopia, August 14-15 May 1998. pp5-6.
Takele Kumsa, Gemeda Duguma, Ulfina Galmessa, Solomon Abegaz and Yohannes Gojjam.
2006. Seasonal Changes in Testis Size and Semen Characteristics of Horro Rams. Eth.
J. Anim. Prod. 6(1) - 2006: 9-17.
Tatek Woldu, Hailu Dadi, Mieso Guru and Dadi Gelashe. 2004. Productivity of Arsi Bale goat
types under farmers’ management condition: a case of Arsi Negelle. Tamrat Degefa
and Fekede Feyissa (Eds). Proceedings of the 13th Annual conference of the Ethiopian
Society of Animal Production (ESAP) held in Addis Ababa, Ethiopia, August 25-27,
2004. ESAP, Addis Ababa. pp67-71.
126
Tekelye Bekele and Kasali, O.B. 1992. The effect of endoparasites on the productivity of
Ethiopian highland sheep. Rey B., Lebbie S.H.B., and Reynolds L. (eds). 1992. Small
ruminant research and development in Africa. Proceedings of the First Biennial
Conference of the African Small Ruminant Research Network, ILRAD, ILCA Nairobi,
Kenya, 10-14 December 1990.
Tekelye Bekele, Tadesse Woldeab, Lahlou-Kassi and Sherington, J. 1992. Factors affecting
morbidity and mortality on-farm and on-station in the Ethiopian highland sheep. Acta
Tropica, 52(1992)99-109.
Tembely, S. 1998. Small Ruminant Production in Ethiopia: Prospects for Improving
Productivity. Proceeding of 5th Conference of ESAP. p.82-90.
Tesfaye Alemu Tucho, Alemu Regassa and Lemma Fita. 2000. Preliminary production and
reproduction of performance evaluation of Mid Rift Valley and Boran goats. In: The
opportunities and challenges of enhancing goat production in East Africa. Proceeding
of a conference. Markel, R.C., Abebe, G. and Goetsch, A.L. (eds.) 113-117. Langston
Univ., OK (USA). E (Kika) da la Garza Inst. for Goat Research; Debub Univ. Awassa
(Ethiopia). College of Agriculture, 10-12 Nov. 2000, Awassa, Ethiopia.
Tesfaye Alemu Tucho, Yadav, B. R, Hanotte, O. and Jianlin, H. 2006. Genetic
characterization of indigenous goat populations of Ethiopia using microsatellite DNA
markers. Proceedings of a workshop on Sheep Breeding Strategies for Ethiopia held at
ILRI, Addis Ababa, Ethiopia on 21 November 2006. ILRI (International Livestock
Research Institute), Nairobi, Kenya.
127
Tiffen, M. 2004. Population pressure, migration and urbanization: Impacts on crop-livestock
systems development in West Africa. Williams T.O., Tarawali S.A., Hienaux and
Fernandez-Rivera S (eds). 2004. Proceeding of an international conference held at then
International institute of Tropical Agriculture (IITA), Ibadan, Nigeria, 19-22 November
2001. ILRI (International Livestock Research Institute), Nairobi, Kenya and CTA
(Technical Centre for Agriculture and Rural Cooperation, ACP-EC), Wageningen, The
Netherlands. pp3-27.
Tsedeke Kocho and Endrias Geta. 2006. Production and marketing of livestock in Wolaita and
Dawuro zones, SNNPR. Paper presented in Annual Workshop of the Agricultural
Economics Society (In press).
Tsige-Yohannes Habte. 2000. Livestock feed security and associated impacts on sustainable
agricultural development. Proceedings of the 7th conference of the Ethiopian Society of
Animal Production (ESAP) held in Addis Ababa, Ethiopia, 26-27 May 1999. ESAP
(Ethiopian Society of Animal Production), Addis Ababa, Ethiopia. pp 51-61.
Webb, E.C. and Mamabolo, M.J. 2004. Production and reproduction characteristics of South
African indigenous goats in communal farming systems. South African Journal of
Animal Science 2004, 34 (Supplement 1).
Wilson, R.T. 1988. Small Ruminant Production Systems in Tropical Africa. Small Ruminant
Research, 1 (1988) 305-325.
Wilson, R.T. and Durkin, J.W. 1988. Small ruminant production in central Mali: reproductive
performance in traditionally managed goats and sheep. Livestock Prod. Sci. 19, 523–
529.

128
Wilson, R.T. Reproductive performance of African indigenous small ruminant under various
management systems: a review. Animal Reproduction Science, 20 (1989) 265-286.
Winrock International. 1976. Proceedings of a Workshop on the Role of Sheep and Goats in
Agricultural Development held at Winrock International Center, Morrilton, Arkansas,
USA, 15-17 November 1976. Winrock International Livestock Research and Training
Centre, Morrilton, Arkansas, USA. 43 pp.
Workneh Ayalew, Ephrem Getahun, Markos Tibbo, Yetnayet Mamo and J.E.O. Rege. 2004.
Current state of knowledge on characterization of farm animal genetic resources in
Ethiopia. ESAP (Ethiopian Society of Animal Production). Asfaw Yimegnuhal and
Tamrat Degefa (Eds). Proceedings of the 11th Annual Conference of the Ethiopian
Society of Animal Production (ESAP) held in Addis Ababa, Ethiopia, August 28-3,
2003.
Workneh Ayalew. 2000. Do smallholder farmers benefit more from crossbred (Somali x
Anglo-Nubian) than from indigenous goats? PhD Thesis. Georg-August University of
Goettingen, Goettingen, Germany. Cuvillier Verlag, Goettingen.
Workneh Ayalew. 2006. Getting the Incentives Right: Concerns Associated with Expansion of
Cattle Export Markets in Ethiopia. Eth. J. Anim. Prod. 6(2) - 2006: 99-103.
Workneh Ayalew and Rowlands J. (eds). 2004. Design, execution and analysis of the livestock
breed survey in Oromiya Regional State, Ethiopia. OADB (Oromiya Agricultural
Development Bureau), Addis Ababa, Ethiopia, and ILRI (International Livestock
Research Institute), Nairobi, Kenya. 260 pp.

129
Yibrah Abadi. 2000. Current problems of the leather industry. In: The opportunities and
challenges of enhancing goat production in East Africa. Proceeding of a conference.
Markel, R.C., Abebe, G. and Goetsch, A.L. (eds.) 113-117. Langston Univ., OK
(USA). E (Kika) da la Garza Inst. for Goat Research; Debub Univ. Awassa (Ethiopia).
College of Agriculture, 10-12 Nov. 2000, Awassa, Ethiopia.
Zahra Ali, Teffera Gebre Meskel, Kettema Yilma, Gezu Kebede and Christie Peacock. 1998.
Experience of community-based and women-oriented goat improvement program.
ESAP (Ethiopian Society of Animal Production). Proceedings of 6th Annual
Conference of the ESAP held in Addis Ababa, Ethiopia, August 14-15 May 1998.
pp47-54.
Zar, J.H. 1996. Biological Analysis. 3rd edition. Northern Illinois University. Prentice-Hall
International Inc., USA.
Zelalem Alemayehu and Fletcher, I. 1993. Small ruminant productivity in the central
Ethiopian mixed farming systems. In: Proceedings of the fourth National Livestock
Improvement Conference, 13-15 Nov. 1991. Addis Ababa, Ethiopia. IAR, Addis
Ababa, Ethiopia.
Zewdu Kebede. 1998. Marketing of Sheep and Goat Skins in Ethiopia. Proceeding of
conference. Phase II. Ministry of Agriculture, Addis Ababa, Ethiopia and Technical
Cooperation Programme, FAO, Italy, Rome: MoA Conference on In-Service Training
Exercise on Hides and Skins Improvement, Addis Ababa (Ethiopia), 9-12 Feb 1998.
Zinash Sileshi. 1998. Welcome Address. ESAP (Ethiopian Society of Animal Production).
Proceedings of 6th Annual Conference of the ESAP held in Addis Ababa, Ethiopia,
August 14-15 May 1998. pp3-4.

130
APPENDICES Appendix 1: Questionnaire. Sheep and Goat Production and Marketing Systems in Alaba, Southern Ethiopia
SECTION ONE: GENERAL A. Demography, occupation and education in the last 12 months
Occupation
Rainy season Dry season
S N
Name
Marital status
1=Single 2=Married 3=Widowed 4=Divorced
Age
Sex
1=Male 2=Female
Education
1=Illiterate 2=Read&write3=High school
4=Others
Major
Second
Major
Second
1 2 3 Code for occupation 1=Farmer 2=House wife 3=Student 4=Herder
5=Trader 6=Handicraft maker 7=Unemployed 8=Government or Kebele employee 9=NGO employee 10=House
maid 11=Pensioned (or retired) 12=Others
B. Land holding and land use systems 1. What is the size of your total land holding? (Exactly as indicated on land holding certificate) ____ha 2. How much is your land allocated for the followings? 1=Crop land________ timad 3=Fallow land________timad
2=Grazing/pasture land _____timad 4=Others_____ _timad C. Purpose of keeping sheep and goat in the three cluster groups of households 1. Why you keep sheep and goats? (Rank)
1=Sale (income source) 2=Meat 3=Milk 4=Manure 5=Sacrifices/rituals 6=Social and cultural functions 7=Saving
8=Distribute benefits/risks with other animals 9=Others, specify

131
D. Compositions and ownership of household livestock in the last 12 months 1. How many of the following animals you keep?
Ownership Origin S N
Structures Size owned Own Share Ribi Family Home
born Purchase Gift
Cattle herd 1 Cows 2 Bulls 3 Heifers 4 Male calves 5 Female calves 6 Oxen (draft) 7 Oxen (fatten)
Sheep flock 1 Lambs (<3 months) 2 Male lambs (3-6 months) 3 Female lambs (6-12
months)
4 Ewes 5 Rams (intact) (>6months) 6 Castrates/fattening
Goat flock 1 Kids (<3 months) 2 Male kids (3-6months) 3 Female kids (6-12 months) 4 Does 5 Bucks (>6months) 6 Castrates/fattening
Equines 1 Stallion /male horses 2 Mare/female horses 3 Female donkey 4 Male donkey 5 Mules
Chicken 1 Total

132
SECTION TWO: SHEEP AND GOAT PRODUCTION A. Feed and water resources, seasonal calendars and feeding managements 1. What are the major basal feed resources of sheep and goats and their availability?
Seasonal availability S Feed types and sources Sep Oct Nov Dec Jan Feb Mar Apr May Jun Jul Aug
1 Communal grazing land 2 Road sides grazing 3 Grazing aftermath 5 Grazing in river sides 6 Private grazing land 7 Cut grass and browses 7 Crop residues (straws,
stovers)
9 Indigenous browses 10 Fodder /improved
forages
11 Enset and banana 12 Root crops (tubers,
leaves)
13 Weeds 14 Tillers and fillers 15 Others, specify 2. Do you graze your sheep and goats? 1=Yes 2=No 3. If yes, for how long? ___________days in a week ___________hours a day 4. How sheep and goat graze? 1=Sheep alone 2=Goat alone
3=Both alone 4=Together with other livestock 5. How you practiced grazing your sheep and goats in the dry season?
1=Free grazing 2=Partly kept/tethered grazing 3=Fully kept/tethered grazing 6. How you practiced grazing your sheep and goats in the wet season?
1=Free grazing 2=Partly kept/tethered grazing 3=Fully kept/tethered grazing 7. Is there any poisoning grasses and browses that kills or make sick sheep and goats in this area? 1=Yes 2=No 8. If yes, what are they (local and Amharic names)? _____________________________ 9. Do you usually provide your sheep and goats with supplementary feeds in addition to grazing?
1=Yes 2=No
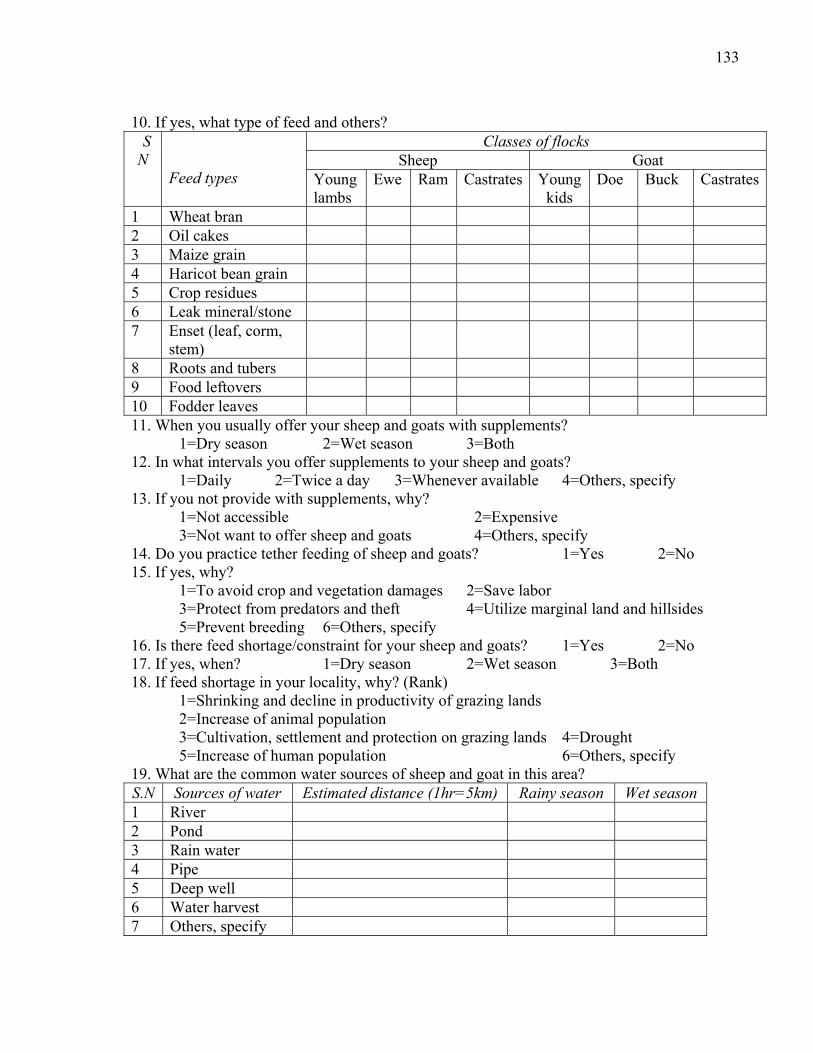
133
10. If yes, what type of feed and others? Classes of flocks
Sheep Goat S N
Feed types Young lambs
Ewe Ram Castrates Young kids
Doe Buck Castrates
1 Wheat bran 2 Oil cakes 3 Maize grain 4 Haricot bean grain 5 Crop residues 6 Leak mineral/stone 7 Enset (leaf, corm,
stem)
8 Roots and tubers 9 Food leftovers 10 Fodder leaves 11. When you usually offer your sheep and goats with supplements? 1=Dry season 2=Wet season 3=Both 12. In what intervals you offer supplements to your sheep and goats? 1=Daily 2=Twice a day 3=Whenever available 4=Others, specify 13. If you not provide with supplements, why? 1=Not accessible 2=Expensive
3=Not want to offer sheep and goats 4=Others, specify 14. Do you practice tether feeding of sheep and goats? 1=Yes 2=No 15. If yes, why? 1=To avoid crop and vegetation damages 2=Save labor
3=Protect from predators and theft 4=Utilize marginal land and hillsides 5=Prevent breeding 6=Others, specify 16. Is there feed shortage/constraint for your sheep and goats? 1=Yes 2=No 17. If yes, when? 1=Dry season 2=Wet season 3=Both 18. If feed shortage in your locality, why? (Rank) 1=Shrinking and decline in productivity of grazing lands
2=Increase of animal population 3=Cultivation, settlement and protection on grazing lands 4=Drought
5=Increase of human population 6=Others, specify 19. What are the common water sources of sheep and goat in this area? S.N Sources of water Estimated distance (1hr=5km) Rainy season Wet season 1 River 2 Pond 3 Rain water 4 Pipe 5 Deep well 6 Water harvest 7 Others, specify

134
20. At what intervals you give sheep and goats with water? Sheep Goats
S.N Frequency
Dry season Wet season Dry season Wet season 1 Any time needed 2 Once a day 3 Twice a day 4 Every three day 5 Every four day 6 Others, specify 21. Is there any water shortage/problem to sheep and goats? 1=Yes 2=No 22. If yes, when? 1=Dry season 2=Wet season 3=Both 23. Why shortage of water? (Rank) 1=Drying of water sources 2=Far distant from water sources
3=Not allowed to use sources 4=Provide other livestock than sheep and goats 5=Others, specify
B. Sheep and goats health management 1. What are the common diseases and parasites that affect health and production of sheep and goat?
S N
Local name
Sheep, goat or both affected
Symptoms
Seasons/months
1 2 3 2. What would you do when your sheep and goats sick? 1=Treat with ethno veterinary practices 2=Sales immediately
3=Slaughters immediately 4=Takes to veterinary center 5=Treat with treatments from local traders 6=Others, specify 3. From where you usually obtain veterinary services? 1=OoARD 2=DA offices 3=NGOs 4=Private institutions 5=Open markets 4. Are you accessible to veterinary services in your locality/near distance?
1=Yes 2=No 5. If yes, how far? __________Km 6. How did you obtain services from these institutions? 1=Free of charge 2=Payment 3=Credit 4=Others, specify 7. Did your sheep and goats get vaccine in recent times? 1=Yes 2=No 8. If yes, how? 1=After report of disease cases 2=After certain animals died
3=Before outbreaks 9. Do you use medicines and drugs from open markets/illegal traders for sheep and goats? 1=Yes 2=No 10. If yes, why? 1=Cheap 2=Not accessible to veterinary center
3=Not want to use veterinary center 4=Others 11. If not use, why?
1=Not cures 2=DAs and health experts advised not to use 3=Expensive 4=Not accessible 5=Others

135
12. Do you cut and/or brand your sick sheep and goats with hot iron? 1=Yes 2=No
13. If yes, why? 1= Treatment of sick animals 2=Identify/tag the animals 3=Others, specify 14. If not, why? 1=Learnt that it affects quality of skin
2= Reduce price of skin 3=Not to form infection 4=Others 15. Has there been any death of your sheep and goats over the last 12 months?
1=Yes 2=No 16. If yes, (specify total number)
Sheep Goats S N Structure Died Structure Died 1 Abortion Abortion 2 <3 months <3 months 3 3-6 months 3-6 months 4 Ewes Does 5 Rams Bucks 6 Castrates/fattening Castrates/fattening 17. What were the major causes for death/loss of your sheep and goats? (Rank) 1=Diseases and parasite infections 2=Nutritional deficiency and toxicity 3=Mechanical causes 4=Predators
5=Undetermined 6= Ectoparasites 7=Others, specify C. Sheep and goats breeding and reproductive managements 1. Do you select your male and female animals for breeding purpose?
1=Yes 2=No 2. Do you have your own breeding male animals (ram & buck)? 1=Yes 2=No 3. What are the common sources of breeding males for your flocks? S.N Sources of breeding males Ram Buck 1 Own 2 Neighbors 4 Others, specify 4. When (season/month) during the year you observes intense breeding and conception?
Intense breeding and conception months S. N
Species Sep Oct Nov Dec Jan Feb Mar Apr May Jun Jul Aug Ewe 1 Ram Doe 2 Buck

136
4. How is the reproductive performance of sheep and goats in your farm? Sheep Goats S
N Particulars
Male Female Male Female 1 Age at first mate 2 Age at first parturition (months) 3 Parturition interval (months) 4 Average litter sizes (single, twin, triplets) 5 Infertile 6 Slaughter age (months) 7 Number of females mated in the past 12 months 8 Number of females gave offspring in the past 12 months 9 Total number of offspring born from mated females in the
past 12 months
10 Total number of offspring weaned out of total born in the past 12 months
5. What are the reasons you justify that hinders fertility and reproduction of sheep and goats? 1=Inadequate feed and water supply 2=Inconvenient climatic conditions 3=Disease and parasite burdens 4=Lack/shortage of breeding male 5=Drought in the area 6=Others, specify D. Lamb and kid rearing, castration and culling 1. Do you provide lambs and kids additional feed to their mother’s milk until they begin
grazing? 1=Yes 2=No 2. If yes, what types of feed resources and feeding?
Lambs Kids Feed types ______________ _________________________________________ How feed _____________ _________________________________________
3. Do you practice weaning of lambs and kids? 1=Yes 2=No 4. If yes, when? Lambs__________ months Kids ___________ months 5. Do you practice castration of sheep and goats? 1=Yes 2=No 6. If yes, why? 1=To fatten and sale 2=To control unwanted breeding
3=To tame them 4=Others 7. At what age you usually castrate? Sheep __years (months) Goat __years/months 8. How you select sheep and goats for fattening? (Rank) 1=Conformation (height, length and appearance) 2=Breed (known local ecotypes) 3=Physical characteristics (color, horn, tail length and width, ear etc) 4=Age 5=Others, specify 9. If you practice select with physical characteristics, (Rank) 1=Color 2=Horn 3=Ear 4=Tail
5=Body length and height 6=Others, specify 10. Do offer specific feeding and other management practices for castrated sheep and goats?
1=Yes 2=No
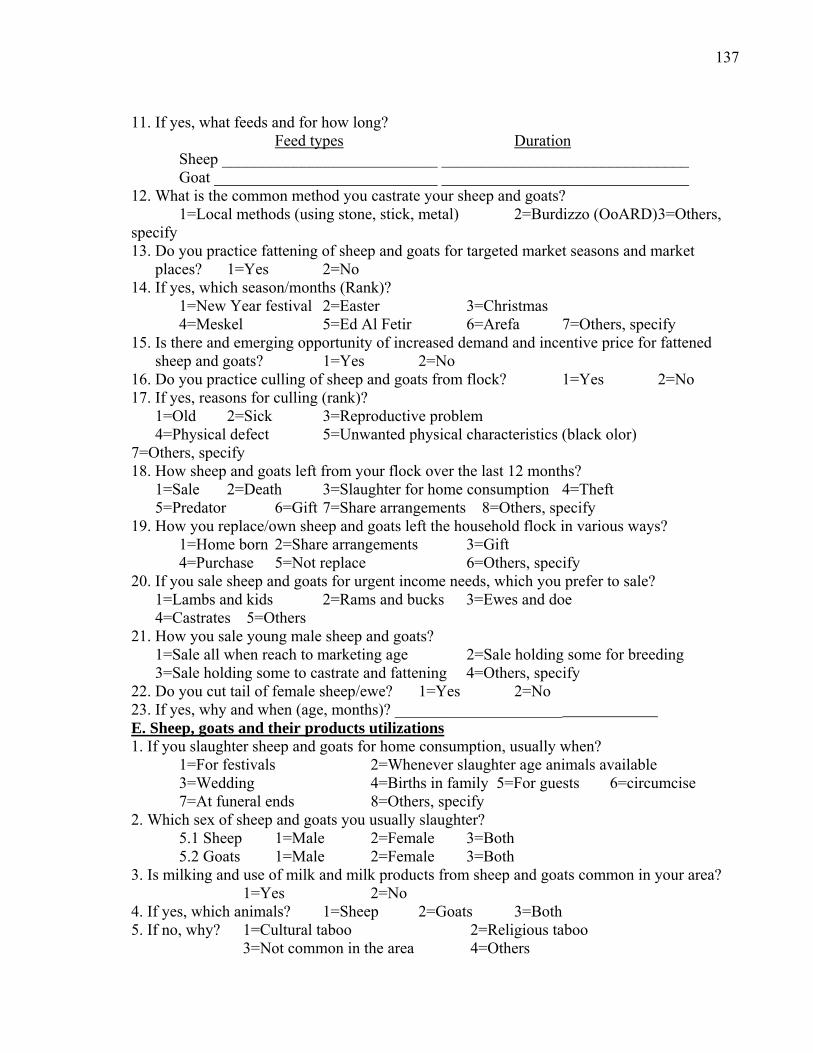
137
11. If yes, what feeds and for how long? Feed types Duration
Sheep ___________________________ _______________________________ Goat ____________________________ _______________________________ 12. What is the common method you castrate your sheep and goats? 1=Local methods (using stone, stick, metal) 2=Burdizzo (OoARD) 3=Others, specify 13. Do you practice fattening of sheep and goats for targeted market seasons and market
places? 1=Yes 2=No 14. If yes, which season/months (Rank)? 1=New Year festival 2=Easter 3=Christmas 4=Meskel 5=Ed Al Fetir 6=Arefa 7=Others, specify 15. Is there and emerging opportunity of increased demand and incentive price for fattened
sheep and goats? 1=Yes 2=No 16. Do you practice culling of sheep and goats from flock? 1=Yes 2=No 17. If yes, reasons for culling (rank)? 1=Old 2=Sick 3=Reproductive problem 4=Physical defect 5=Unwanted physical characteristics (black olor) 7=Others, specify 18. How sheep and goats left from your flock over the last 12 months? 1=Sale 2=Death 3=Slaughter for home consumption 4=Theft
5=Predator 6=Gift 7=Share arrangements 8=Others, specify 19. How you replace/own sheep and goats left the household flock in various ways? 1=Home born 2=Share arrangements 3=Gift 4=Purchase 5=Not replace 6=Others, specify 20. If you sale sheep and goats for urgent income needs, which you prefer to sale? 1=Lambs and kids 2=Rams and bucks 3=Ewes and doe
4=Castrates 5=Others 21. How you sale young male sheep and goats? 1=Sale all when reach to marketing age 2=Sale holding some for breeding 3=Sale holding some to castrate and fattening 4=Others, specify 22. Do you cut tail of female sheep/ewe? 1=Yes 2=No 23. If yes, why and when (age, months)? _____________________ E. Sheep, goats and their products utilizations 1. If you slaughter sheep and goats for home consumption, usually when? 1=For festivals 2=Whenever slaughter age animals available 3=Wedding 4=Births in family 5=For guests 6=circumcise
7=At funeral ends 8=Others, specify 2. Which sex of sheep and goats you usually slaughter?
5.1 Sheep 1=Male 2=Female 3=Both 5.2 Goats 1=Male 2=Female 3=Both
3. Is milking and use of milk and milk products from sheep and goats common in your area? 1=Yes 2=No 4. If yes, which animals? 1=Sheep 2=Goats 3=Both 5. If no, why? 1=Cultural taboo 2=Religious taboo 3=Not common in the area 4=Others
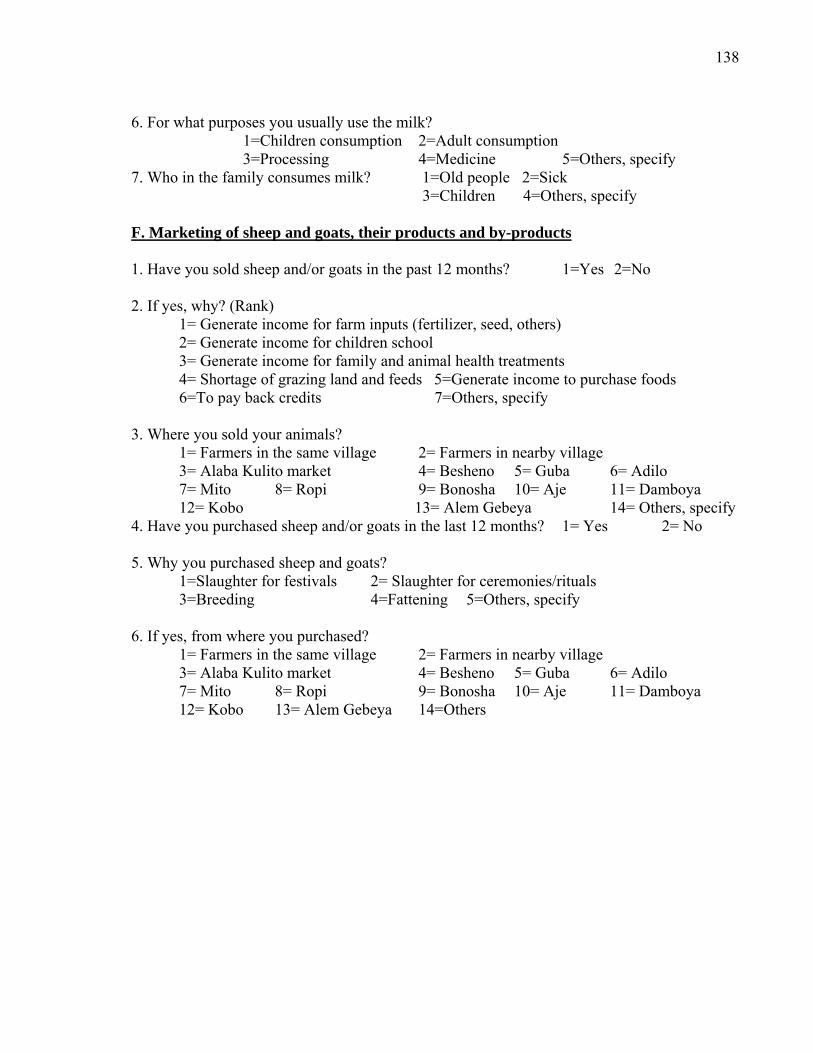
138
6. For what purposes you usually use the milk? 1=Children consumption 2=Adult consumption 3=Processing 4=Medicine 5=Others, specify 7. Who in the family consumes milk? 1=Old people 2=Sick 3=Children 4=Others, specify F. Marketing of sheep and goats, their products and by-products 1. Have you sold sheep and/or goats in the past 12 months? 1=Yes 2=No 2. If yes, why? (Rank)
1= Generate income for farm inputs (fertilizer, seed, others) 2= Generate income for children school 3= Generate income for family and animal health treatments 4= Shortage of grazing land and feeds 5=Generate income to purchase foods 6=To pay back credits 7=Others, specify
3. Where you sold your animals?
1= Farmers in the same village 2= Farmers in nearby village 3= Alaba Kulito market 4= Besheno 5= Guba 6= Adilo 7= Mito 8= Ropi 9= Bonosha 10= Aje 11= Damboya 12= Kobo 13= Alem Gebeya 14= Others, specify
4. Have you purchased sheep and/or goats in the last 12 months? 1= Yes 2= No 5. Why you purchased sheep and goats?
1=Slaughter for festivals 2= Slaughter for ceremonies/rituals 3=Breeding 4=Fattening 5=Others, specify
6. If yes, from where you purchased?
1= Farmers in the same village 2= Farmers in nearby village 3= Alaba Kulito market 4= Besheno 5= Guba 6= Adilo 7= Mito 8= Ropi 9= Bonosha 10= Aje 11= Damboya 12= Kobo 13= Alem Gebeya 14=Others

139
7. How many sheep and goats you sold and purchased in the last 12 months and with how much cost?
Sold Purchased S N
Structure Number When/
monthsUnit Price
Total price
Number When/ months
Unit Price
Total price
Sheep 1 Ewe 2 Ram 3 Male lamb 4 Female lamb 5 Fatten Goats 1 Doe 2 Buck 3 Male kid 4 Female kid 5 Fatten 8. When in the year you prefers to sale and/or purchase sheep and goats?
Sheep Goats S N
When Sale Purchase Sale Purchase
1 During festivals (specify) 2 During planting 3 During harvesting 4 Others, specify 9. How you sales your animals? 1= Live weight basis
2= ‘Eye ball’ estimation 3=Both 10. Why you prefer this mode of marketing? (Selected above)
1= Incentive prices 2= Avoids mischief 3= Most purchasers like this way 4= Saves my time and energy 5= Other, specify
11. Did you ever obtain animal market price information? 1= Yes 2= No 12. If yes, from where?
1= DAs 2= Governmental organizations, specify 3= NGOs 4= Others, specify 13. Do you face any problem in marketing of your animals? 1= Yes 2= No 14. If yes, what? (Rank)
1= Tax burden 2= Unwanted broker disorder and high commission fees 3= Seasonality of market demand and prices 4= Lack of market road from my areas 5= Lack of market and price information 6= Others, specify
15. Do your family sales milk products from sheep and goats? 1= Yes 2= No 16. If not market your products, why not?
1= Not produce at all 2= Produce but consume at home 3= Not fetches reasonable price 4= Don’t have any market demand in my locality 5= Others, specify

140
17. What you do with the skin(s) of sheep and goats? 17.1 Sheepskin
1= Sales 2= Used for making household materials (seat, bed materials, containers) 3= Used for ride horse/mule seat 4=Prayers mat 5=Home decoration 6=Pomp for metal workers 7=Others, specify
17.2 Goat Skin 1= Sales 2= Used for making household materials (seat, bed materials, containers) 3= Used for ride horse/mule seat 4= Prayers mat 5=Home decoration 6=Pomp for metal workers 7=Others, specify
18. If sold, how much was the average prices (in the last 12 months)? 1= Sheepskins _________Birr 2= Goatskins __________Birr 19. Do you preserve/process skins at home immediately after flaying? 1= Yes 2= No 20. If yes, what? 1= Apply salts 2= Dry 3= Others, specify 21. After how many days (usually) you take the skins to the traders or collectors? __days 22. Where and to whom you usually sales skins?
1=Sub-agents in my locality 2=In Alaba town for any traders 3=Agents/collector in Alaba town 4=Others, specify
23. Did any of your customers have complained on quality of the skins you sold? 1=Yes 2=No
24. If yes, what were the defects they usually complain? 1=Cut during flay 2=Cut during drying 3=Spoiled with bacteria and dirt 4=Too much dried on the sun 5=Others, specify?
25. What are the common problems you encounter in skin production and marketing? (Rank) 1= Lack of market information and markets 2= Lack of capacity building on skin production, preservations and marketing 3= Lack of local organization supports preservation, storage and marketing 4= Animals produce poor quality skins 5= Others, specify

141
G. Sheep and goats production and marketing constraints 1. Do you want to expand sheep and goats flock sizes and production in the future?
1=Yes 2=No S.N Reasons to expand Sheep Goats Both sheep and
goats 1 High market demand 2 Incentive market prices 3 Easy to manage and keep 4 Distribute benefits and losses 5 Immediate returns 6 Appropriate for slaughter and home
consumption
7 Others, specify 2. If no, why? 1=Shortage of grazing lands and feeds 2=Shortage of labor 3=Prefer another animal species 4=Marketing problem 5=Lack of capital to purchase animals and inputs 6=Others, specify 3. What are major constraints hinder production of sheep and goats in this area? (Rank) 1=Disease and parasites 2=Feed and grazing land shortages
3=Water shortage 4=Labor shortage 5=Drought 6=Predators 7=Marketing problems 8=Inadequate/lack of inputs
9= Inadequate/lack of extension and support 10=Inadequate/lack of technologies and innovations 11=Lack of capital and credits 12=Others
SECTION THREE: SOCIAL, CULTURAL AND ECONOMIC CHARACTERISTICS A. Gender, labor allocation and decision on benefits from sheep and goats 1. Do you encounter labor shortage in sheep and goat production? 1=Yes 2=No 2. For what major tasks you face labor shortage? 1=Herding and tethering 2=Watering 3=Looking after lambs and kids
4=Construction of shelter 5=Take care of sick animals 6=Others, specify 3. How you overcome the labor shortage?
1=Hire laborer 2=Use family labor 3=Use fence 4=Keep turn by turn with neighbor 5=Others, specify
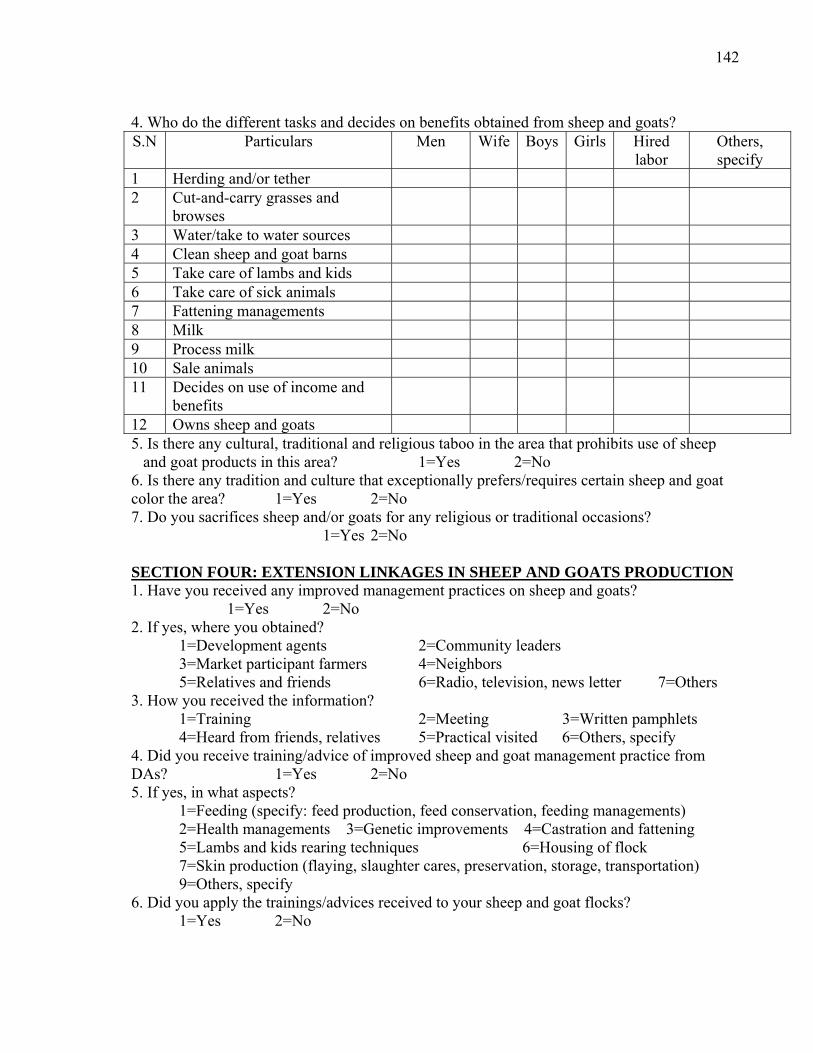
142
4. Who do the different tasks and decides on benefits obtained from sheep and goats? S.N Particulars Men Wife Boys Girls Hired
labor Others, specify
1 Herding and/or tether 2 Cut-and-carry grasses and
browses
3 Water/take to water sources 4 Clean sheep and goat barns 5 Take care of lambs and kids 6 Take care of sick animals 7 Fattening managements 8 Milk 9 Process milk 10 Sale animals 11 Decides on use of income and
benefits
12 Owns sheep and goats 5. Is there any cultural, traditional and religious taboo in the area that prohibits use of sheep
and goat products in this area? 1=Yes 2=No 6. Is there any tradition and culture that exceptionally prefers/requires certain sheep and goat color the area? 1=Yes 2=No 7. Do you sacrifices sheep and/or goats for any religious or traditional occasions?
1=Yes 2=No SECTION FOUR: EXTENSION LINKAGES IN SHEEP AND GOATS PRODUCTION 1. Have you received any improved management practices on sheep and goats?
1=Yes 2=No 2. If yes, where you obtained? 1=Development agents 2=Community leaders
3=Market participant farmers 4=Neighbors 5=Relatives and friends 6=Radio, television, news letter 7=Others
3. How you received the information? 1=Training 2=Meeting 3=Written pamphlets 4=Heard from friends, relatives 5=Practical visited 6=Others, specify
4. Did you receive training/advice of improved sheep and goat management practice from DAs? 1=Yes 2=No 5. If yes, in what aspects? 1=Feeding (specify: feed production, feed conservation, feeding managements) 2=Health managements 3=Genetic improvements 4=Castration and fattening 5=Lambs and kids rearing techniques 6=Housing of flock 7=Skin production (flaying, slaughter cares, preservation, storage, transportation) 9=Others, specify 6. Did you apply the trainings/advices received to your sheep and goat flocks?
1=Yes 2=No

143
7. If you applied the trainings/advices, did you achieve any improvements in your flocks? 1=Yes 2=No
8. If not, why? 1=Not affordable
2=Not simple to apply (not understood) 3=Not accessible (not found in my areas) 4=Socially and culturally not acceptable in my area 5=Not relevant to problems of my flock
6=Labor shortage 7=Others, specify
SECTION FIVE: INSTITUTIONS AND INNOVATIONS IN SHEEP AND GOAT PRODUCTION AND MARKETING
1. Did you receive credit in recent years? 1=Yes 2=No 2. If yes, in what form? 1=Cash 2=Kind (specify) 3=Both 3. If you received with credit, what was the source? 1=Governmental banks 2=Private banks 3=Credit institutions 4=Governmental offices (OoARD, etc) 5=NGOs 6=Cooperatives 7=Others, specify 4. If received credit, it was for what major purposes? 1=Crop production (improved seeds, fertilizer) 2=Petty trade 3=Cattle and small ruminants fattening 4=Others, specify 5. Who received the credit in your family? 1=Husband 2=Wife 3=Young boys 4=Young girls 4=Others, specify 6. How you made credit arrangements? ______________________________________ 7. Are you satisfied with the lending regulations and terms to repay the credit? 1=Yes 2=No 8. Did you receive sheep and goats from any sources? 1=Yes 2=No 9. If yes, from which sources?
1=Credit 2=Gift from NGOs 3=Gift from GOs (safety-net, credit) 5=Share arrangements 6=Exchange (crop, other livestock, inputs)
10. If you received sheep and goats from share arrangements, why? 1=To keep 2=To Fatten 3=To Breed 4=Others, specify 11. How you made the share agreements? 1=Share incomes from sale of animals received 2=Share new born animals 3=Share the original animals after certain years 4=Others, specify 12. Is there any cooperative in your area to which you are member? 1=Yes 2=No 13. If yes, in what sector and what services it renders? 1=Crop production (storage, marketing, deliver inputs to members, etc) 2=Livestock (Marketing, deliver inputs, assemble products, etc) 3=Inputs and credits (deliver different inputs, credits, insurance, etc) 4=Others, specify SECTION SIX: BUILDINGS 1. Where you confine sheep and goats? 1=Main house 2=Adjoin house 3=Separate constructed house 4=Grazing area (open kraals) 5=Others, specify
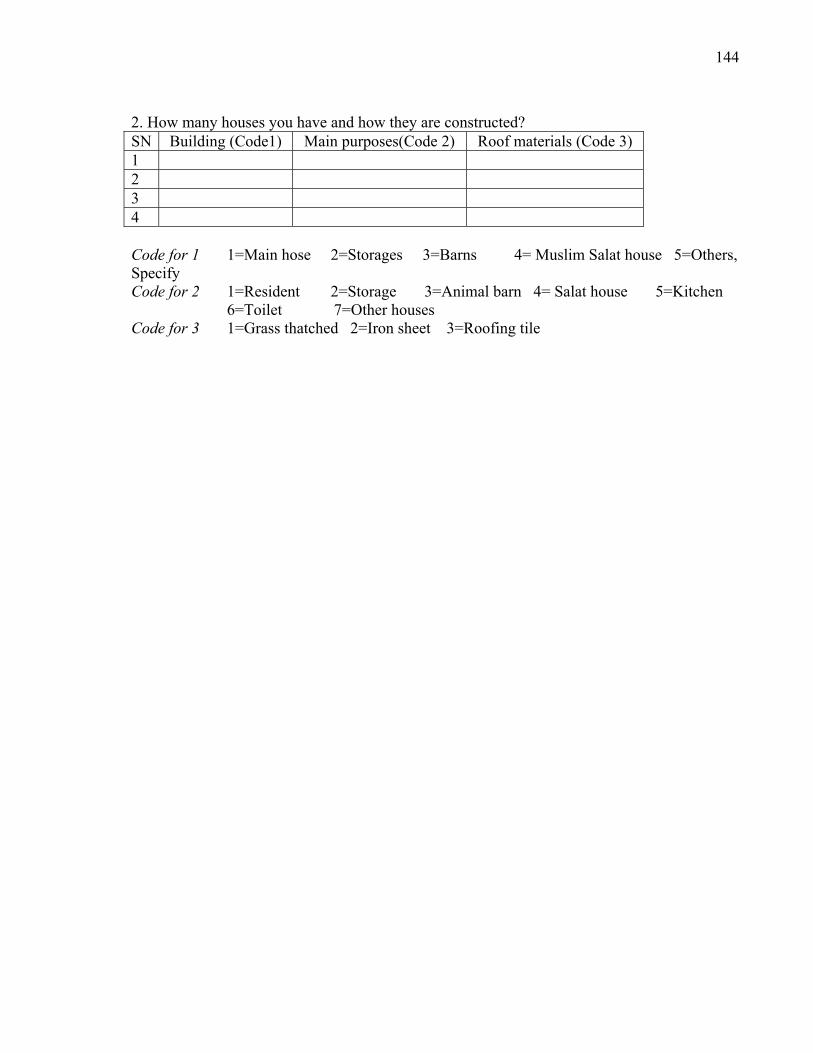
144
2. How many houses you have and how they are constructed? SN Building (Code1) Main purposes(Code 2) Roof materials (Code 3) 1 2 3 4 Code for 1 1=Main hose 2=Storages 3=Barns 4= Muslim Salat house 5=Others, Specify Code for 2 1=Resident 2=Storage 3=Animal barn 4= Salat house 5=Kitchen
6=Toilet 7=Other houses Code for 3 1=Grass thatched 2=Iron sheet 3=Roofing tile
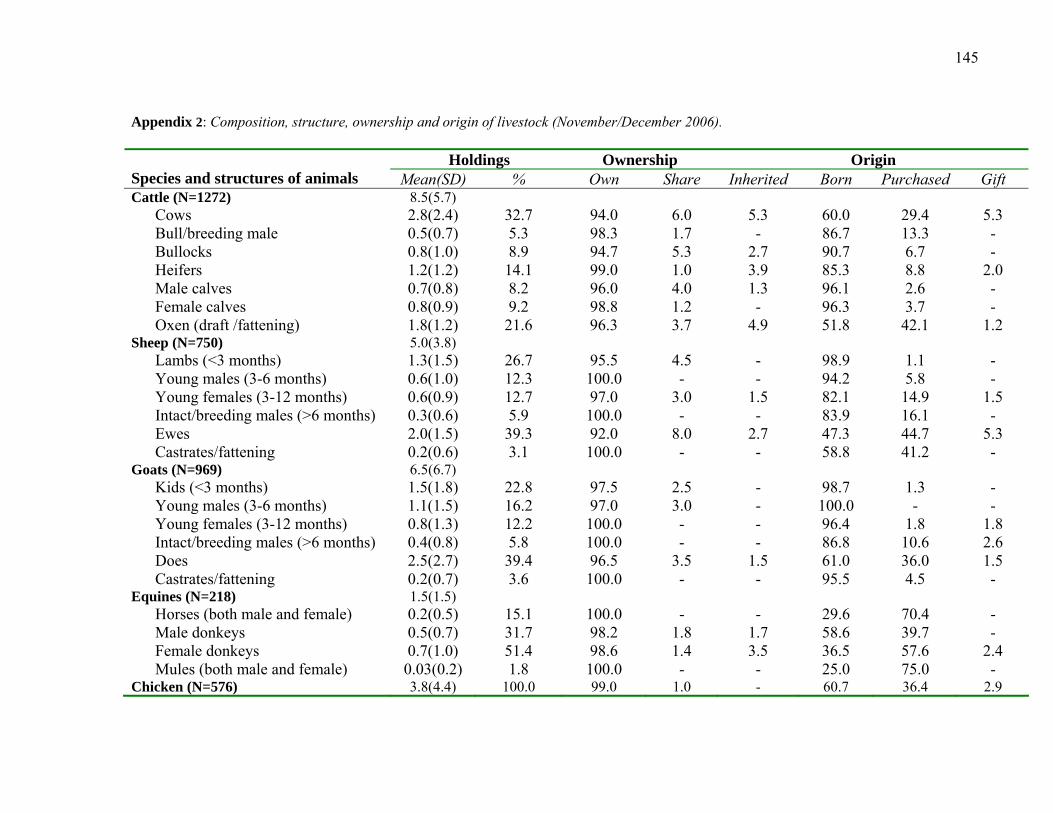
145
Appendix 2: Composition, structure, ownership and origin of livestock (November/December 2006).
Holdings Ownership Origin Species and structures of animals Mean(SD) % Own Share Inherited Born Purchased Gift Cattle (N=1272) 8.5(5.7)
Cows 2.8(2.4) 32.7 94.0 6.0 5.3 60.0 29.4 5.3 Bull/breeding male 0.5(0.7) 5.3 98.3 1.7 - 86.7 13.3 - Bullocks 0.8(1.0) 8.9 94.7 5.3 2.7 90.7 6.7 - Heifers 1.2(1.2) 14.1 99.0 1.0 3.9 85.3 8.8 2.0 Male calves 0.7(0.8) 8.2 96.0 4.0 1.3 96.1 2.6 - Female calves 0.8(0.9) 9.2 98.8 1.2 - 96.3 3.7 - Oxen (draft /fattening) 1.8(1.2) 21.6 96.3 3.7 4.9 51.8 42.1 1.2
Sheep (N=750) 5.0(3.8) Lambs (<3 months) 1.3(1.5) 26.7 95.5 4.5 - 98.9 1.1 - Young males (3-6 months) 0.6(1.0) 12.3 100.0 - - 94.2 5.8 - Young females (3-12 months) 0.6(0.9) 12.7 97.0 3.0 1.5 82.1 14.9 1.5 Intact/breeding males (>6 months) 0.3(0.6) 5.9 100.0 - - 83.9 16.1 - Ewes 2.0(1.5) 39.3 92.0 8.0 2.7 47.3 44.7 5.3 Castrates/fattening 0.2(0.6) 3.1 100.0 - - 58.8 41.2 -
Goats (N=969) 6.5(6.7) Kids (<3 months) 1.5(1.8) 22.8 97.5 2.5 - 98.7 1.3 - Young males (3-6 months) 1.1(1.5) 16.2 97.0 3.0 - 100.0 - - Young females (3-12 months) 0.8(1.3) 12.2 100.0 - - 96.4 1.8 1.8 Intact/breeding males (>6 months) 0.4(0.8) 5.8 100.0 - - 86.8 10.6 2.6 Does 2.5(2.7) 39.4 96.5 3.5 1.5 61.0 36.0 1.5 Castrates/fattening 0.2(0.7) 3.6 100.0 - - 95.5 4.5 -
Equines (N=218) 1.5(1.5) Horses (both male and female) 0.2(0.5) 15.1 100.0 - - 29.6 70.4 - Male donkeys 0.5(0.7) 31.7 98.2 1.8 1.7 58.6 39.7 - Female donkeys 0.7(1.0) 51.4 98.6 1.4 3.5 36.5 57.6 2.4 Mules (both male and female) 0.03(0.2) 1.8 100.0 - - 25.0 75.0 -
Chicken (N=576) 3.8(4.4) 100.0 99.0 1.0 - 60.7 36.4 2.9

146
Appendix 3: Correlation of major holdings in the overall study sites.
Family size Total land Grazing land Cattle Sheep Goats Equines Chicken Family size Pearson Correlation .158 .191(*) .208(*) .117 -.056 .113 .226(**) Sig. (2-tailed) .053 .019 .011 .153 .499 .167 .005 N 150 150 150 150 150 150 150 Total land Pearson Correlation .878(**) .350(**) -.253(**) .408(**) .262(**) .130 Sig. (2-tailed) .000 .000 .002 .000 .001 .114 N 150 150 150 150 150 150 Grazing land Pearson Correlation .252(**) -.229(**) .275(**) .197(*) .150 Sig. (2-tailed) .002 .005 .001 .016 .067 N 150 150 150 150 150 Cattle Pearson Correlation .081 .451(**) .632(**) .067 Sig. (2-tailed) .325 .000 .000 .413 N 150 150 150 150 Sheep Pearson Correlation -.298(**) -.011 .017 Sig. (2-tailed) .000 .894 .834 N 150 150 150 Goats Pearson Correlation .549(**) .027 Sig. (2-tailed) .000 .745 N 150 150 Equines Pearson Correlation .143 Sig. (2-tailed) .081 N 150 Chicken Pearson Correlation Sig. (2-tailed) N
* Correlation is significant at the 0.05 level (2-tailed). ** Correlation is significant at the 0.01 level (2-tailed).

147
Appendix 4: Correlation of major holdings in the mixed flock site. Family size Total land Grazing land Cattle Sheep Goats Equines Chicken Family size Pearson Correlation .233 .270 .366(*) .132 .362(*) .118 -.131 Sig. (2-tailed) .216 .149 .047 .487 .050 .536 .491 N 30 30 30 30 30 30 30 Total land Pearson Correlation .894(**) .484(**) .044 .198 .478(**) .122 Sig. (2-tailed) .000 .007 .819 .293 .008 .522 N 30 30 30 30 30 30 Grazing land Pearson Correlation .397(*) .113 .195 .331 .183 Sig. (2-tailed) .030 .553 .303 .074 .333 N 30 30 30 30 30 Cattle Pearson Correlation .187 .410(*) .659(**) -.260 Sig. (2-tailed) .321 .025 .000 .165 N 30 30 30 30 Sheep Pearson Correlation .041 .397(*) -.105 Sig. (2-tailed) .829 .030 .580 N 30 30 30 Goats Pearson Correlation .187 .016 Sig. (2-tailed) .322 .934 N 30 30 Equines Pearson Correlation -.018 Sig. (2-tailed) .923 N 30 Chicken Pearson Correlation Sig. (2-tailed) N
* Correlation is significant at the 0.05 level (2-tailed). ** Correlation is significant at the 0.01 level (2-tailed).

148
Appendix 5: Correlation of major holdings in the goat dominating site. Family size Total land Grazing land Cattle Sheep Goats Equines Chicken Family size Pearson Correlation .352(**) .351(**) .199 .055 .020 .059 .321(*) Sig. (2-tailed) .006 .006 .127 .676 .881 .655 .012 N 60 60 60 60 60 60 60 Total land Pearson Correlation .977(**) .270(*) .029 .057 .094 .170 Sig. (2-tailed) .000 .037 .825 .666 .477 .193 N 60 60 60 60 60 60 Grazing land Pearson Correlation .249 .021 .039 .079 .130 Sig. (2-tailed) .055 .876 .770 .548 .322 N 60 60 60 60 60 Cattle Pearson Correlation .544(**) .132 .520(**) .094 Sig. (2-tailed) .000 .316 .000 .474 N 60 60 60 60 Sheep Pearson Correlation .209 .257(*) -.064 Sig. (2-tailed) .108 .047 .628 N 60 60 60 Goats Pearson Correlation -.040 .226 Sig. (2-tailed) .760 .083 N 60 60 Equines Pearson Correlation .048 Sig. (2-tailed) .717 N 60 Chicken Pearson Correlation Sig. (2-tailed) N
** Correlation is significant at the 0.01 level (2-tailed). * Correlation is significant at the 0.05 level (2-tailed).

149
Appendix 6: Correlation of major holdings in the sheep dominating site. Family size Total land Grazing land Cattle Sheep Goats Equines Chicken Family size Pearson Correlation .233 .184 .315(*) .039 -.015 .287(*) .285(*) Sig. (2-tailed) .074 .160 .014 .769 .910 .026 .027 N 60 60 60 60 60 60 60 Total land Pearson Correlation .805(**) .129 .047 .094 -.024 .214 Sig. (2-tailed) .000 .325 .722 .474 .853 .101 N 60 60 60 60 60 60 Grazing land Pearson Correlation .036 -.146 .020 -.011 .225 Sig. (2-tailed) .783 .264 .877 .931 .084 N 60 60 60 60 60 Cattle Pearson Correlation .338(**) .314(*) .574(**) .214 Sig. (2-tailed) .008 .015 .000 .101 N 60 60 60 60 Sheep Pearson Correlation .207 .291(*) .086 Sig. (2-tailed) .112 .024 .514 N 60 60 60 Goats Pearson Correlation .554(**) .093 Sig. (2-tailed) .000 .479 N 60 60 Equines Pearson Correlation .353(**) Sig. (2-tailed) .006 N 60 Chicken Pearson Correlation Sig. (2-tailed) N
* Correlation is significant at the 0.05 level (2-tailed). ** Correlation is significant at the 0.01 level (2-tailed).

150
Appendix 7: Seasonal calendar of sheep and goats feed resources and cropping.
Seasonal Calendars Particulars Sep Oct Nov Dec Jan Feb Mar Apr May Jun Jul Aug Feeding calendar
Communal grazing Road sides grazing Grazing crop stubble River side grazing Private grazing Cut-and-carry Crop residues Local browses Improved forages Enset8 and banana Roots and tubers Weeds Tillers and fillers
Cropping calendar
Maize* H H P P Sorghum* H H P P Tef H H P Wheat H H P Finger millet* H H P P Pepper* H H P P Haricot bean* P H Haricot bean H H P
: Months feedstuffs available; H: Harvesting time; P: Planting time; *Belg (short rain) season crops; Meher (main rain) season crops
8 Enset is a banana like plant cultivated as food crop in southern and southwestern Ethiopia.

151
Appendix 8: Major sheep and goat diseases. Local name
Veterinary equivalent
N
%
Species affected
Symptoms
Lugo Fasciolosis
(Liver Fluke)
51 33.7 *S,G,C Swelling at the sub mandibular area (bottle jaw), emaciation,
diarrhea, and depression
Bega Sheep pox 33 22.0 S,G High fever, eruption of papule and vesicles, development of pus,
scab formation
Tereje
(Arae Tizenat)
Anthrax 13 8.4 S,G,C,E High fever, widespread signs of oedema, , protrusion of rectum,
exudation of blood from natural orifices of cadaver and sudden
death
Tefiqa Blackleg 10 7.0 S,C Pronounced lameness with swelling of the upper part of the
affected leg, shivering, skin discoloration (farmers says it occurs
due to black spider venom)
Gunfan
(Sombe)
Pneumonia S,G,C,E Increased respiratory rate, coughing, and abnormal breathing sound
on auscultation
Gororisa Pasteurellosis S,G,C Drooling of saliva, swelling of tongue, symmetrical swelling of
throat
Hanti
Tizenat
Mastitis S,G,C Physical, chemical, and bacteriological changes in the milk and
pathological changes in the udder
Allatte Enzootic ataxia
(Sway back)
S,G Hind quarter paralysis, animals can not stand but have a bright
face, no treatment available
Ari CCPP
43 28.9
S,G Depression, blood discharge from nostrils, low appetite, coughing *S=Sheep; G=Goat, C=Cattle; E=Equines
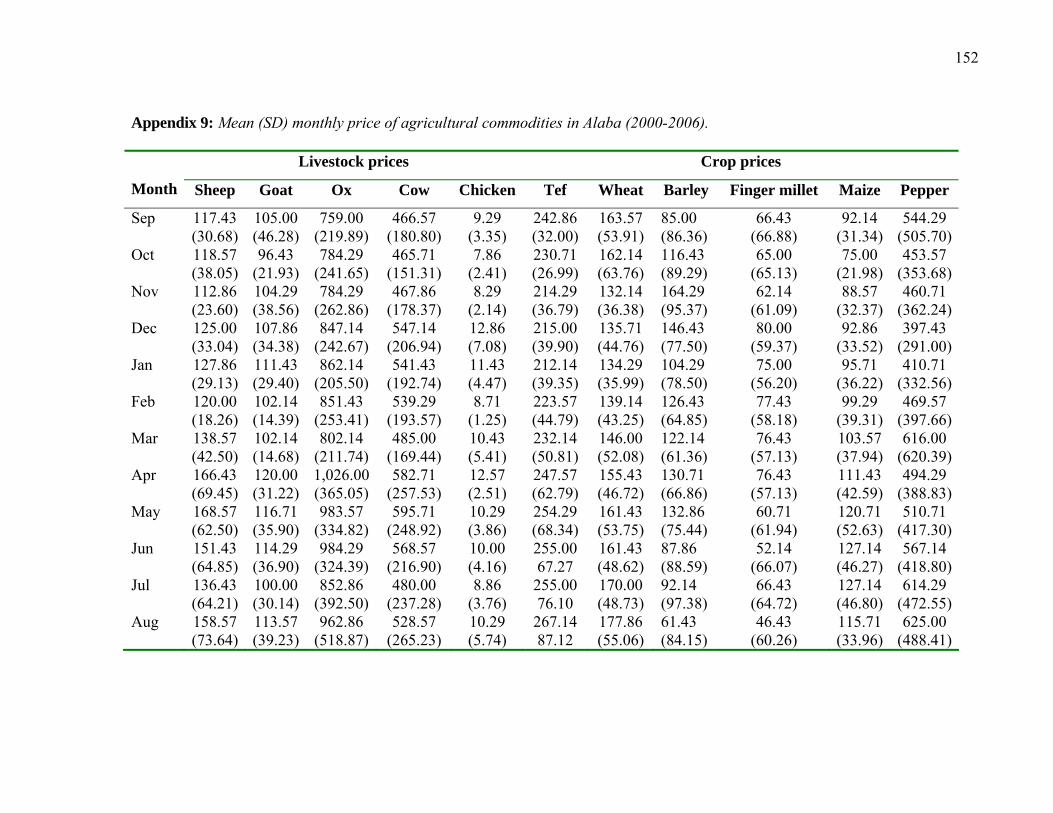
152
Appendix 9: Mean (SD) monthly price of agricultural commodities in Alaba (2000-2006).
Livestock prices Crop prices
Month Sheep Goat Ox Cow Chicken Tef Wheat Barley Finger millet Maize Pepper
Sep 117.43 (30.68)
105.00 (46.28)
759.00 (219.89)
466.57 (180.80)
9.29 (3.35)
242.86 (32.00)
163.57 (53.91)
85.00 (86.36)
66.43 (66.88)
92.14 (31.34)
544.29 (505.70)
Oct 118.57 (38.05)
96.43 (21.93)
784.29 (241.65)
465.71 (151.31)
7.86 (2.41)
230.71 (26.99)
162.14 (63.76)
116.43 (89.29)
65.00 (65.13)
75.00 (21.98)
453.57 (353.68)
Nov 112.86 (23.60)
104.29 (38.56)
784.29 (262.86)
467.86 (178.37)
8.29 (2.14)
214.29 (36.79)
132.14 (36.38)
164.29 (95.37)
62.14 (61.09)
88.57 (32.37)
460.71 (362.24)
Dec 125.00 (33.04)
107.86 (34.38)
847.14 (242.67)
547.14 (206.94)
12.86 (7.08)
215.00 (39.90)
135.71 (44.76)
146.43 (77.50)
80.00 (59.37)
92.86 (33.52)
397.43 (291.00)
Jan 127.86 (29.13)
111.43 (29.40)
862.14 (205.50)
541.43 (192.74)
11.43 (4.47)
212.14 (39.35)
134.29 (35.99)
104.29 (78.50)
75.00 (56.20)
95.71 (36.22)
410.71 (332.56)
Feb 120.00 (18.26)
102.14 (14.39)
851.43 (253.41)
539.29 (193.57)
8.71 (1.25)
223.57 (44.79)
139.14 (43.25)
126.43 (64.85)
77.43 (58.18)
99.29 (39.31)
469.57 (397.66)
Mar 138.57 (42.50)
102.14 (14.68)
802.14 (211.74)
485.00 (169.44)
10.43 (5.41)
232.14 (50.81)
146.00 (52.08)
122.14 (61.36)
76.43 (57.13)
103.57 (37.94)
616.00 (620.39)
Apr 166.43 (69.45)
120.00 (31.22)
1,026.00(365.05)
582.71 (257.53)
12.57 (2.51)
247.57 (62.79)
155.43 (46.72)
130.71 (66.86)
76.43 (57.13)
111.43 (42.59)
494.29 (388.83)
May 168.57 (62.50)
116.71 (35.90)
983.57 (334.82)
595.71 (248.92)
10.29 (3.86)
254.29 (68.34)
161.43 (53.75)
132.86 (75.44)
60.71 (61.94)
120.71 (52.63)
510.71 (417.30)
Jun 151.43 (64.85)
114.29 (36.90)
984.29 (324.39)
568.57 (216.90)
10.00 (4.16)
255.00 67.27
161.43 (48.62)
87.86 (88.59)
52.14 (66.07)
127.14 (46.27)
567.14 (418.80)
Jul 136.43 (64.21)
100.00 (30.14)
852.86 (392.50)
480.00 (237.28)
8.86 (3.76)
255.00 76.10
170.00 (48.73)
92.14 (97.38)
66.43 (64.72)
127.14 (46.80)
614.29 (472.55)
Aug 158.57 (73.64)
113.57 (39.23)
962.86 (518.87)
528.57 (265.23)
10.29 (5.74)
267.14 87.12
177.86 (55.06)
61.43 (84.15)
46.43 (60.26)
115.71 (33.96)
625.00 (488.41)

153
Appendix 10: Mean (SD) yearly price of agricultural commodities in Alaba (2000-2006).
Prices of livestock Prices of crops Year
Sheep Goat Ox Cow Chicken Tef Wheat Barley Finger
millet
Maize Pepper
2000
114.58
(27.75)
97.92
(23.40)
727.92
(116.02)
459.58
(51.10)
8.5833
(2.23)
238.33
(22.50)
162.08
(26.92)
170.83
(52.43)
129.58
(12.33)
114.17
(21.09)
-
2001
97.92
(14.05)
85.42
(13.56)
633.33
(73.40)
401.67
(58.90)
6.67
(2.31)
200.00
(22.16)
102.08
(26.58)
129.17
(37.04)
104.58
(15.29)
53.33
(11.74)
-
2002
119.58
(18.15)
99.58
(14.22)
625.00
(96.34)
360.00
(56.41)
6.92
(2.07)
173.75
(20.35)
99.08
(41.19)
68.75
(41.73)
48.08
(29.47)
59.17
(24.76)
425.00
(128.81)
2003
138.75
(36.19)
90.17
(11.09)
827.25
(232.36)
421.17
(140.80)
9.33
(2.64)
226.08
(18.91)
161.92
(23.01)
150.83
(73.08)
66.25
(69.42)
122.50
(25.89)
950.83
(373.36)
2004
127.50
(30.19)
102.08
(12.87)
861.25
(79.89)
524.17
(97.46)
11.33
(2.50)
239.58
(29.03)
158.75
(22.07)
145.00
(88.16)
47.50
(58.99)
98.75
(19.90)
827.58
(190.46)
2005
136.42
(36.23)
117.50
(33.27)
1,030.83
(179.52)
561.67
(103.47)
12.67
(4.25)
253.33
(18.99)
162.50
(21.79)
134.58
(83.60)
73.33
(65.20)
138.33
(26.49)
770.42
(250.14)
2006
222.92
(57.78)
162.08
(23.01)
1,419.42
(249.25)
928.42
(130.42)
15.00
(4.84)
331.25
(62.31)
226.42
(25.65)
-
-
142.50
(18.40)
621.67
(107.86)

154
Appendix 11: Geographical locations of sheep and goat markets (January 2007). Market attributes
Markets
Administrative location(woreda, zone, region)
Elevations
(m a.s.l)
Degree Readings
UTM
Readings Market Days
Physical Facilities
Tax/head animal(Birr)
Hadero Mazoria Kacha Bira, Kambata Tambaro, SNNP
1724 N07° 11.079' E037° 2.789'
37N0357908 0794289
Tuesday
Fenced
1.00
Areka Boloso Sore, Wolaita, SNNP
1750 N07° 04.433' E037° 2.363'
37N0357092 0781675
Tuesday
Fenced
1.00
Shinshicho Kacha Bira, Kambata Tambaro, SNNP
1852 N07° 12.423' E037°46.343'
37N0364456 0796747
Saturday
Fenced
1.00
Wolaita Sodo Sodo Zuria, Wolaita, SNNP
2058 N06° 51.720' E037°45.735'
37N0363236 0758601
Saturday
Fenced
1.00
Tebella Humbo, Wolaita, SNNP 1571 N06°42.062’ E037°46.431’
37N0364472 0740799
Thursday
Fenced
2.00
Durame Kedida Gemila, KambataTambaro,SNNP
2104 N07° 14.263' E037° 4.208'
37N0378940 0800100
Saturday
Fenced
1.50
Boditi Damote Gale, Wolaita, SNNP
2050 N06°57.171’ E037°51.334’
37N0373571 0768619
Saturday
Fenced
1.50
Shone Badawacho, Hadiya, SNNP
1956 N07° 08.249' E037° 6.837'
37N0383752 0789009
Friday
Fenced
1.00
Adilo Kedida Gemila, KambataTambaro,SNNP
1972 N07° 12.519' E037° 8.858'
37N0387489 0796867
Wednesday
Open
1.00
Damboya Kedida Gemila, KambataTambaro,SNNP
2240 N07° 20.604' E037° 7.098'
37N384285 0811772
Friday
Fenced
1.00
Besheno Alaba Special Woreda, SNNP
1980 N07° 28.174' E038°13.824'
37N0415080 0825656
Tuesday
Open
1.00
Guba Alaba Special Woreda, SNNP
1890 N07° 16.550' E038° 3.180'
37N0413855 804242
Friday
Open
1.00
Kobo Alaba Special Woreda, SNNP
1819 N07° 23.865' E038° 5.751'
37N0418613 0817712
Friday
Open
1.00
Mito Alaba Special Woreda, SNNP
- N07° 40.847' E038° 1.585'
-
Saturday
Open
1.00

155
Appendix 11: Continued.
Market attributes
Markets
Administrative location(woreda, zone, region)
Elevations
(m a.s.l)
Degree Readings
UTM
Readings Market Days
Physical Facilities
Tax/head animal(Birr)
Bonosha Shashego, Hadiya, SNNP
1935 N07°29.991’ E038°05.610’
37N0399981 0829034
Monday
Fenced
1.00
Alem Gebeya Sankura, Silti, SNNP 1865 N07°34.165’ E038°10.848’
37N0409627 0836705
Saturday
Fenced
1.00
Mazoria Sankura, Silti, SNNP 1852 N07°26.936’ E038°08.105’
37N0404557 0823396
Tuesday
Open
1.00
Ropi Siraro, West Arsi, Oromia
1758 N07°08.274’ E038°06.588’
37N0401700 0789016
Monday
Fenced
1.00
Alaba Kulito Alaba Special Woreda, SNNP
1770 N07° 18.433' E038° 4.960'
37N0398740 0807739
Thursday
Fenced
1.50
Aje
Siraro, West Arsi, Oromia
1839 N07°17.896’ E038°21.007
37N0428264 0806700
Friday
Fenced
1.00
Shashemene West Arsi, Oromia 1928 N07°11.285’ E038°35.081
37N0454142 0794488
Everyday
Open
-
Modjo export abattoir
Modjo, Oromia 1770 N08°34.548’ E039°06.970
37P 0512784 947870
All days
Open
-
Debre Zeit export abattoir
Bishoftu, Oromia 1910 N08°44.817’ E038°58.618’
37P0497468 0966788
All days
Open
-
Kolfe Atana Tera Addis Ababa Admin 2445 N09°02.162’ E038°42.976’
37P0468816 0998758
All days
Open
-
Shola Addis Ababa Admin 2405 N09°01.497’ E038°47.767’
37P0477591 0997528
All days
Open
-
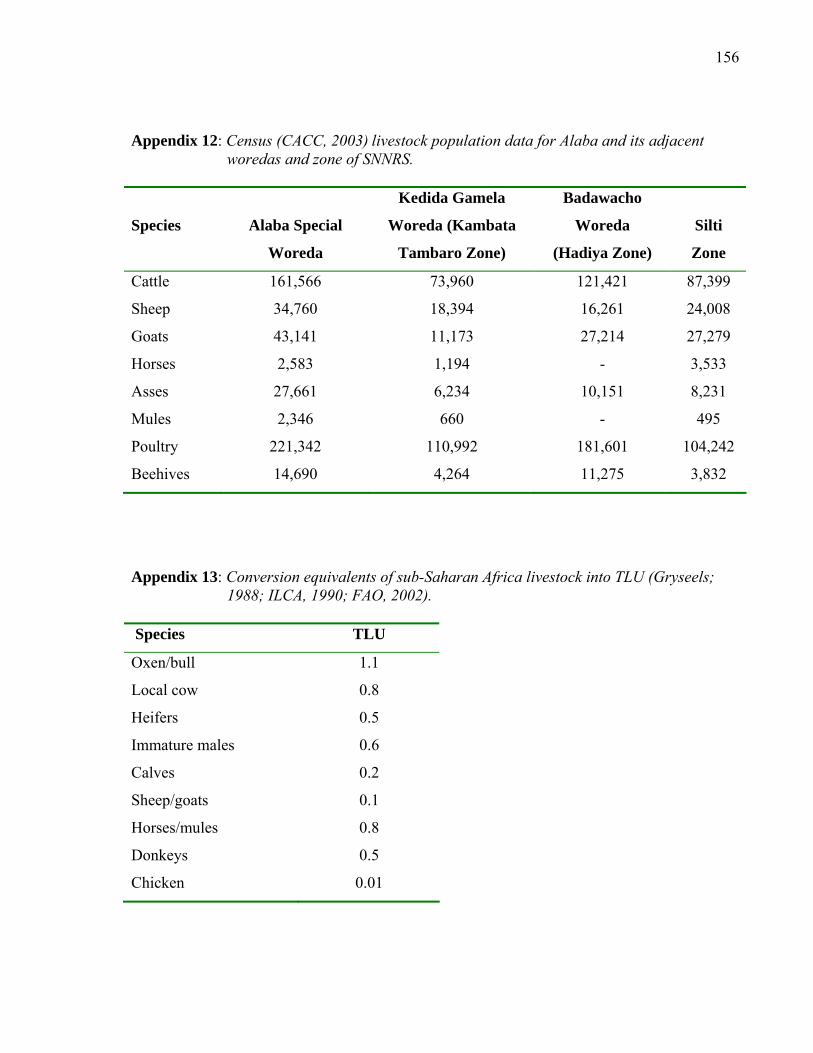
156
Appendix 12: Census (CACC, 2003) livestock population data for Alaba and its adjacent
woredas and zone of SNNRS.
Species
Alaba Special
Woreda
Kedida Gamela
Woreda (Kambata
Tambaro Zone)
Badawacho
Woreda
(Hadiya Zone)
Silti
Zone
Cattle 161,566 73,960 121,421 87,399
Sheep 34,760 18,394 16,261 24,008
Goats 43,141 11,173 27,214 27,279
Horses 2,583 1,194 - 3,533
Asses 27,661 6,234 10,151 8,231
Mules 2,346 660 - 495
Poultry 221,342 110,992 181,601 104,242
Beehives 14,690 4,264 11,275 3,832
Appendix 13: Conversion equivalents of sub-Saharan Africa livestock into TLU (Gryseels; 1988; ILCA, 1990; FAO, 2002).
Species TLU
Oxen/bull 1.1
Local cow 0.8
Heifers 0.5
Immature males 0.6
Calves 0.2
Sheep/goats 0.1
Horses/mules 0.8
Donkeys 0.5
Chicken 0.01

157
Appendix 14: Yearly sheep and goat skin production. Years Sheepskin Goatskin Total
1991 12561 8756 21317
1992 18967 12110 31077
1993 24370 19276 43646
1994 28359 21562 49921
1995 39276 31256 70532
1996 29352 20153 49505
1997 31588 25216 56804
1998 24310 10568 34878
1999 28781 12617 41398
2000 22629 18597 41226
2001 43889 26546 70435
2002 33826 24392 58218
2003 52008 48654 100662
2004 67154 52562 119716
2005 53169 48070 101239
2006 56434 47169 103603
Total 566673 427504 994177
Source: Desk of Livestock and Fisheries Development, Alaba Special Woreda OoARD

158
A d d i t i o n Subtraction
Appendix 15: Routes of flock entry and exit.
Kulito market
Farmers in same village
Farmers in near village
Besheno market
Mito market
Purchases
Kulito market
Farmers in same village
Farmers in near village
Besheno market
Mito market
Home born Gifts
Inventory
Stolen or lost
Home slaughtered
Sales Gifts Predators Deaths
Purchase
Share holding
Share holding

159
BIOGRAPHICAL SKETCH
The author of the present thesis was born in 1978 in Dawuro Zone of SNNPR, Ethiopia. He
attended elementary and junior secondary schools between 1985 and 1992 in Dawuro. He
attended the senior secondary schools in Agaro and Addis Ababa between 1993 and 1996.
He then joined the Alemaya University of Agriculture in 1996 where he studied Animal
Sciences. He graduated in July 2000 with the Bachelor of Sciences in Agriculture (Animal
Sciences).
Between 2001 and 2005 he was employed by the Areka Agricultural Research Center,
SNNPR. He worked as a livestock researcher in the Department of Animal Science Research.
He was admitted to the School of Graduate Studies of University of Hawassa in 2005 for his
graduate studies in the specialization of Animal Production.


