

Project DriftPredicting the possibility of issues and their impact on deadlines and budgets
Deena Chadwick, Manager—Technical Analysis
Main Points
• Understand Risk
• Quantifying or Calculating Risk
• Reduce the Fear of Communicating Risk
• Strategies for Mitigation & Management

Understanding Risk— You can’t steal second and keep your foot on first, Frederick B. Wilcox

1863
TRANSCONTINENTALRAILROAD

Risk is the Possibility that
Something will not Happen as Planned

1960-1969APOLLO 11
Everything has some Level of Risk


Quantifying and Calculating Risk— We deliver in proportion to our fears, Francois de La Rochefaucauld
PROJECT DRIFT
Project Drift causes a project to move off course

Start EndDesired Course
Drift Heading
Drift Curve
PROJECT DRIFT

PROJECT DRIFT
Common conditions that take a project off course
•Tasks take longer than expected
•Additional resources or material that exceed budget
•Client scope or expectations not met

DRIFT SCORE
In order to predict and avoid project drift each project should determine its DRIFT score.
Delivery Risk Indicator & FacTors
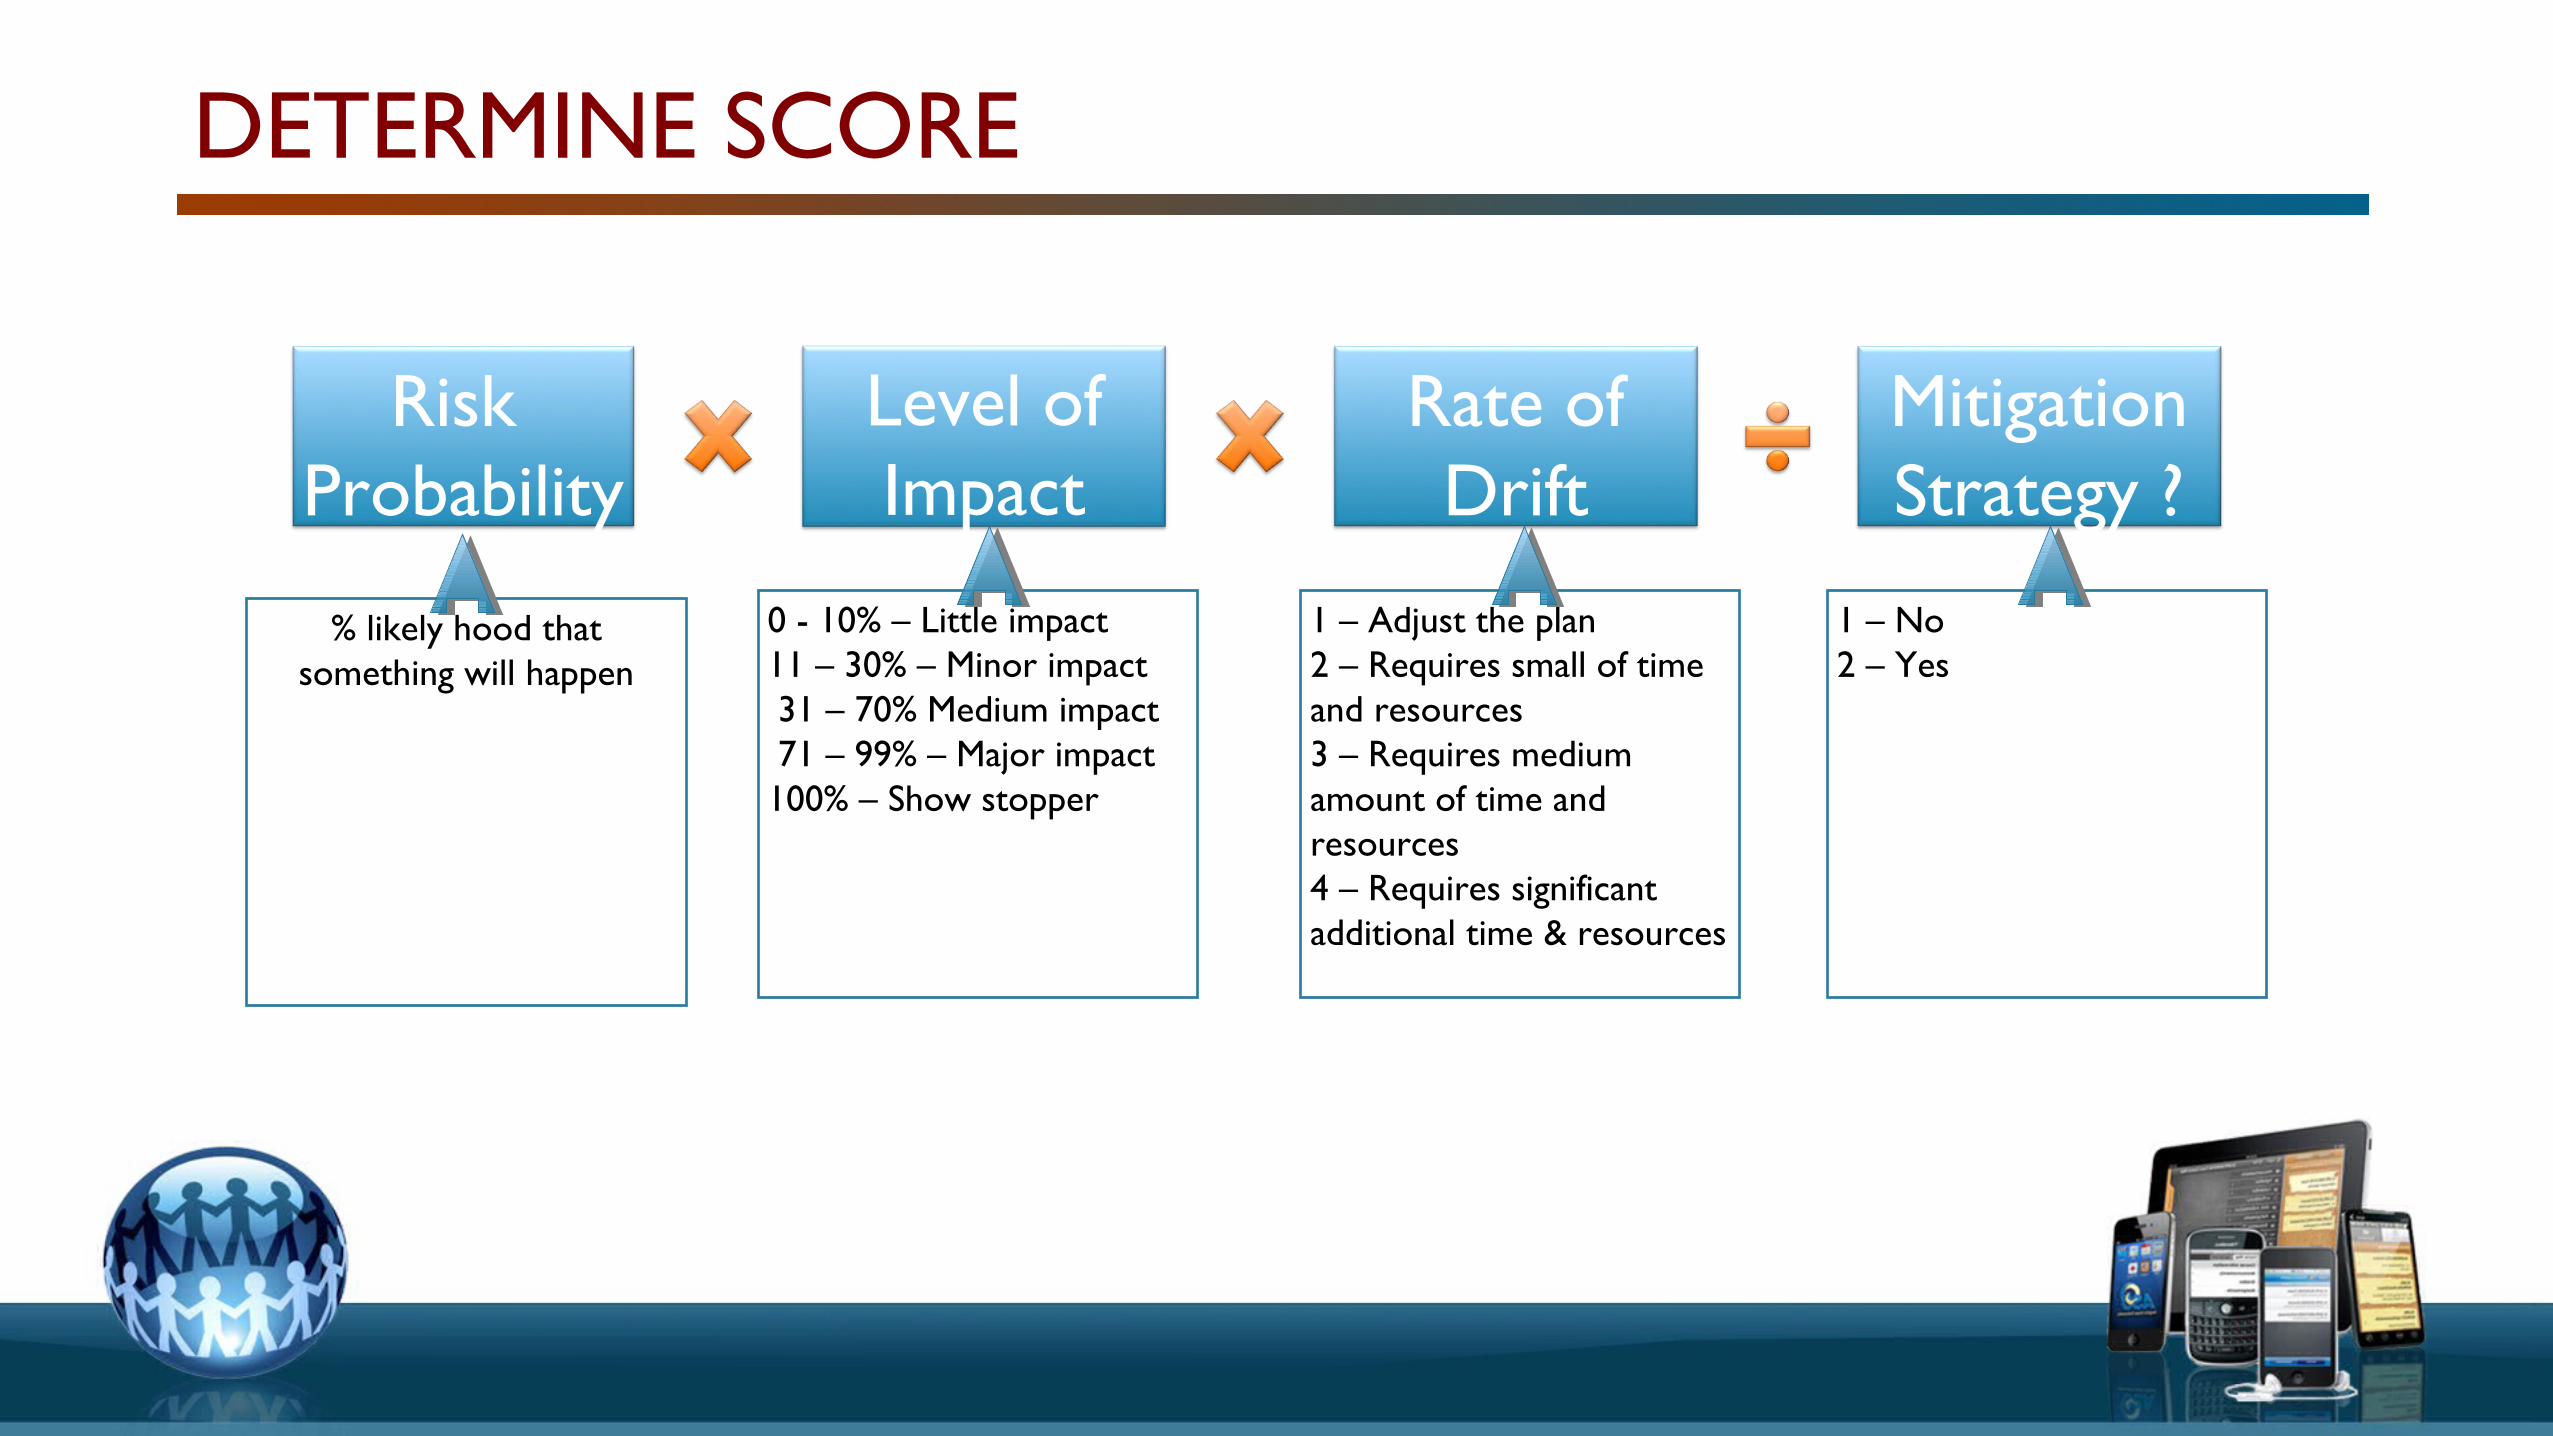
DETERMINE SCORE
Risk Probability
Level of Impact
Rate of Drift
MitigationStrategy ?
% likely hood that something will happen
0 - 10% – Little impact11 – 30% – Minor impact 31 – 70% Medium impact 71 – 99% – Major impact100% – Show stopper
1 – Adjust the plan2 – Requires small of time and resources3 – Requires medium amount of time and resources4 – Requires significant additional time & resources
1 – No 2 – Yes

DETERMINE SCORE
RiskRisk
ProbabilityLevel of Impact
Rate of Drift
Mitigation Strategy ?
Estimated DRIFT
Stakeholder not available for Design Review 5% 100% 3 Y 8%

Determining your DRIFT SCORE.
RiskRisk
ProbabilityLevel of Impact
Rate of Drift Mitigation?
Estimated DRIFT
Stakeholder not available for Design Review 5% 100% 3 Y 8%Environment not set up to start building 10% 20% 5 N 10%UAT Environment not available 5% 100% 5 N 25%UAT Build not complete 15% 80% 4 N 48%UAT Stakeholders not available 5% 60% 4 Y 6%Test Environment not available 5% 100% 5 N 25%Test Build not complete 20% 80% 3 N 48%Test Cases not complete 5% 60% 3 Y 5%Build Resources not available 10% 100% 4 Y 20%QA Resources not available 5% 100% 4 N 20%Design Direction not approved 10% 100% 2 Y 10%SOW not signed 5% 60% 3 Y 5%Design Resources not available 10% 100% 4 N 40%Design not ready for Review 30% 80% 5 Y 60%PROJECT DRIFT SCORE 23%

PROJECT STATUS w/ DRIFT SCORE
Critical Excellent
GoodFair
Milestones EGFC Drift Score
Strategic Vision Good 12%
Creative & Technical Design Excellent 38%
Execution Not Started 23%
Testing & Optimization Not Started 16%

Communicating Risk— Much unhappiness has come into the world because of things left unsaid, Fyodor Dostoyevsky

Differences between Risks & Isssues
Risk is the Possibility that
Something will not Happen as Planned
Issue is the Certainty that
Something will not Happen as Planned

OPPOSING FORCES


Risk Tolerance
Risk Averse
Risk Inclined
Risk Neutral

Get Over Your Fears

What to Communicate
• Planned – Expect Outcome
• Might Happen – Difference between expected & possible outcome
• Probability – How likely is the possible outcome
• Mitigation – What could be done about it

Risk is the Possibility that
Something will not Happen as Planned

What to Communicate
• Planned – Expect Outcome
• Might Happen – Difference between expected & possible outcome
• Probability – How likely is the possible outcome
• Mitigation – What could be done about it
Delivering the Bad News
• Be prepared
• Bad news should never come as a surprise
• Deliver the good with the bad when possible
• Treat people with respect and dignity

Persuasion or Influencing Techniques
• Framing: using emotionally charged words
• Scarcity: making something more appealing by limiting its availability
• Congruence: Using actions to match expected result
• Herd Behavior: Group think or making someone feel like they are following the crowd
• Reciprocation: Giving to Get

Risk Mitigation & Management— Denial is a tactic that substitutes deliberate ignorance for thoughtful planning,Charles Tremper

Risk Management
RISK
ACCEPT
AVOID
IGNORE
EXPLOITREDUCE
TRANSFER

Risk Acceptance

Avoid Drift and enjoy SMOOTH SAILING.
• Chart Your Course – Put together a plan.
• Set Sail – Make sure everyone knows the goal and their role
• Swab the Deck – Continuously keep the project in ship shape.
• Rough Seas – Batten Down the Hatches – Be ready for problems before they arise
• Patching up Leaks – Do not let the problem go unsolved

Questions?

Thank You!Deena Chadwick, Manager—Technical Analysis
Further question or discussions contact me: [email protected]


