

FP7 Project Nr: 265178Project start date: 01 Feb 2011 Acronym: GeoViQua Project title: QUAlity aware VIsualisation for the Global Earth Observation system of systems Theme: ENV.2010.4.1.2‐2 Theme title: Integrating new data visualisation approaches of earth Systems into GEOSS development
1
PROJECT FINAL REPORT
Grant Agreement number: 265178
Project acronym: GEOVIQUA
Project title: Quality aware Visualisation for the Global Earth Observation system of systems
Funding Scheme: FP7-ENVIRONMENT
Period covered: from 2/1/2011 to 1/31/2014
Name of the scientific representative of the project's co-ordinator1, Title and Organisation: Joan Masó, Dr., CREAF
Tel: +34 93 581 1771
Fax: +34 93 581 4151
E-mail: [email protected]
Project website¡Error! Marcador no definido. address: www.geoviqua.org
1 Usually the contact person of the coordinator as specified in Art. 8.1. of the Grant Agreement.
FP7 Project Nr: 265178Project start date: 01 Feb 2011 Acronym: GeoViQua Project title: QUAlity aware VIsualisation for the Global Earth Observation system of systems Theme: ENV.2010.4.1.2‐2 Theme title: Integrating new data visualisation approaches of earth Systems into GEOSS development
2
Document control page
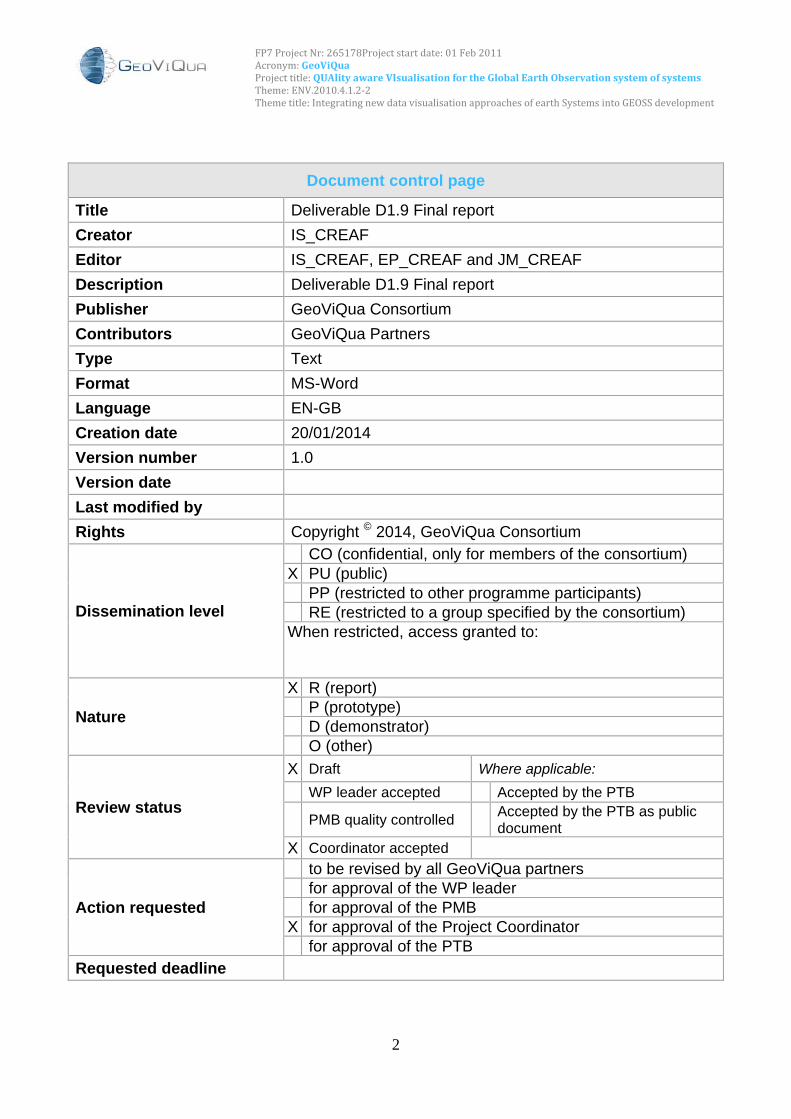
Title Deliverable D1.9 Final report
Creator IS_CREAF
Editor IS_CREAF, EP_CREAF and JM_CREAF
Description Deliverable D1.9 Final report
Publisher GeoViQua Consortium
Contributors GeoViQua Partners
Type Text
Format MS-Word
Language EN-GB
Creation date 20/01/2014
Version number 1.0
Version date
Last modified by
Rights Copyright © 2014, GeoViQua Consortium
Dissemination level
CO (confidential, only for members of the consortium) X PU (public) PP (restricted to other programme participants) RE (restricted to a group specified by the consortium) When restricted, access granted to:
Nature
X R (report) P (prototype) D (demonstrator) O (other)
Review status
X Draft Where applicable:
WP leader accepted Accepted by the PTB
PMB quality controlled Accepted by the PTB as public document
X Coordinator accepted
Action requested
to be revised by all GeoViQua partners for approval of the WP leader for approval of the PMB X for approval of the Project Coordinator for approval of the PTB
Requested deadline

FP7 Project Nr: 265178Project start date: 01 Feb 2011 Acronym: GeoViQua Project title: QUAlity aware VIsualisation for the Global Earth Observation system of systems Theme: ENV.2010.4.1.2‐2 Theme title: Integrating new data visualisation approaches of earth Systems into GEOSS development
3
Revision history
Ver. Date Modified by Comments
0.1 20-01-2014 JM_CREAF Creating the basic structure and incorporation of new content
0.2 27-07-2014 Many Contributions of many partners
0.3 20-03-2014 IS_CREAF Content review
1.0 31-03-2013 JM_CREAF Final review
Institution Contributors CREAF JM_CREAF: Joan Masó, IS_CREAF: Ivette Serral, EP_CREAF: Ester Prat
Copyright © 2014, GeoViQua Consortium
The GeoViQua Consortium grants third parties the right to use and distribute all or parts of this document, provided that the GeoViQua project and the document are properly referenced.
THIS DOCUMENT IS PROVIDED BY THE COPYRIGHT HOLDERS AND CONTRIBUTORS "AS IS" AND ANY EXPRESS OR IMPLIED WARRANTIES, INCLUDING, BUT NOT LIMITED TO, THE IMPLIED WARRANTIES OF MERCHANTABILITY AND FITNESS FOR A PARTICULAR PURPOSE ARE DISCLAIMED. IN NO EVENT SHALL THE COPYRIGHT OWNER OR CONTRIBUTORS BE LIABLE FOR ANY DIRECT, INDIRECT, INCIDENTAL, SPECIAL, EXEMPLARY, OR CONSEQUENTIAL DAMAGES (INCLUDING, BUT NOT LIMITED TO, PROCUREMENT OF SUBSTITUTE GOODS OR SERVICES; LOSS OF USE, DATA, OR PROFITS; OR BUSINESS INTERRUPTION) HOWEVER CAUSED AND ON ANY THEORY OF LIABILITY, WHETHER IN CONTRACT, STRICT LIABILITY, OR TORT (INCLUDING NEGLIGENCE OR OTHERWISE) ARISING IN ANY WAY OUT OF THE USE OF THIS CUMENT, EVEN IF ADVISED OF THE POSSIBILITY OF SUCH DAMAGE.
FP7 Project Nr: 265178Project start date: 01 Feb 2011 Acronym: GeoViQua Project title: QUAlity aware VIsualisation for the Global Earth Observation system of systems Theme: ENV.2010.4.1.2‐2 Theme title: Integrating new data visualisation approaches of earth Systems into GEOSS development
4
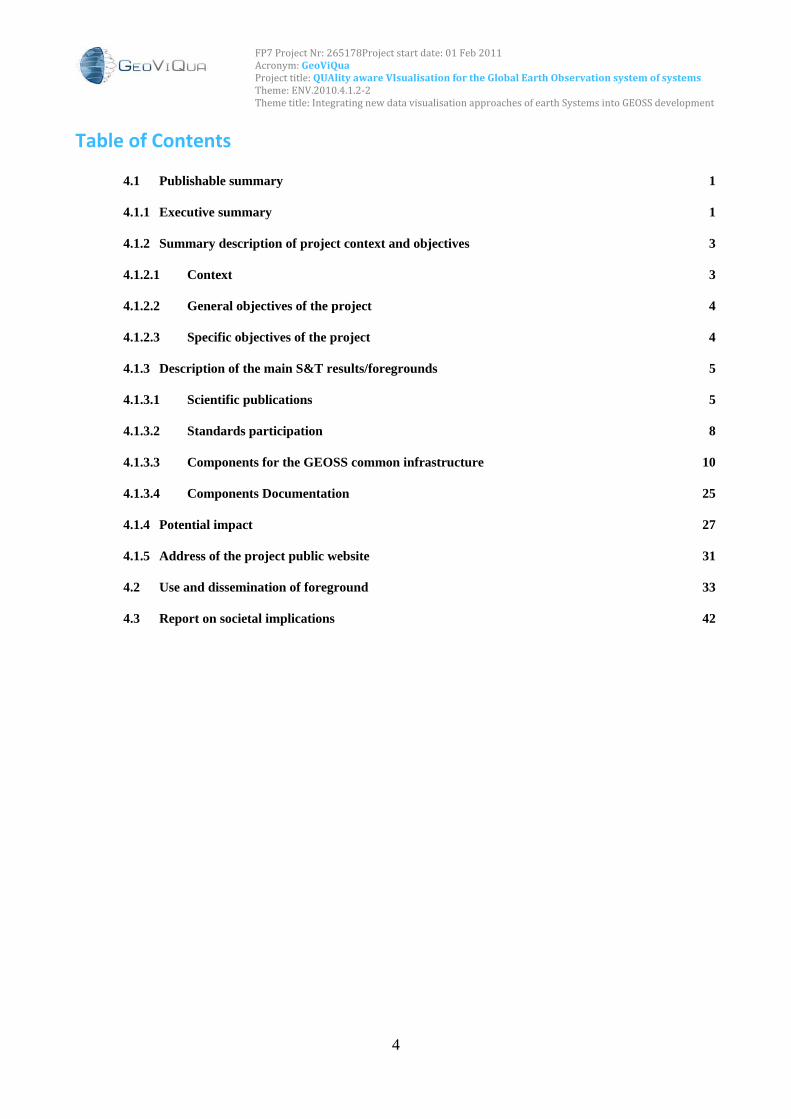
Table of Contents
4.1 Publishable summary 1
4.1.1 Executive summary 1
4.1.2 Summary description of project context and objectives 3
4.1.2.1 Context 3
4.1.2.2 General objectives of the project 4
4.1.2.3 Specific objectives of the project 4
4.1.3 Description of the main S&T results/foregrounds 5
4.1.3.1 Scientific publications 5
4.1.3.2 Standards participation 8
4.1.3.3 Components for the GEOSS common infrastructure 10
4.1.3.4 Components Documentation 25
4.1.4 Potential impact 27
4.1.5 Address of the project public website 31
4.2 Use and dissemination of foreground 33
4.3 Report on societal implications 42

FP7 Project Nr: 265178Project start date: 01 Feb 2011 Acronym: GeoViQua Project title: QUAlity aware VIsualisation for the Global Earth Observation system of systems Theme: ENV.2010.4.1.2‐2 Theme title: Integrating new data visualisation approaches of earth Systems into GEOSS development
5
Figures
Figure 1: The GeoViQua producer quality model ________________________________________________________ 11
Figure 2: The GeoViQua user quality model. ___________________________________________________________ 12
Figure 3: GI test portal ____________________________________________________________________________ 14
Figure 4: Example of feedback button in a database description page. ______________________________________ 15
Figure 5: User feedback interface ___________________________________________________________________ 15
Figure 6: GEO label showing all the facets filled in but the one about user feedback. ___________________________ 16
Figure 7: GEO label API documentation as shown in www.geolabel.net _____________________________________ 17
Figure 8: GECA as a service integrated in the GEOSS Portal _______________________________________________ 17
Figure 9: Quality emitter intermediate graphic. ________________________________________________________ 18
Figure 10: WMS‐Q used as small metadata catalogue that the DAB can discover. _____________________________ 19
Figure 11: CREAF WMS‐Q client _____________________________________________________________________ 20
Figure 12: Greendland WMS‐Q client ________________________________________________________________ 20
Figure 13: KML‐Q representation of the Ebro Delta data set ______________________________________________ 21
Figure 14: Implementation of the statistical plots in the metadata comparison interface _______________________ 22
Figure 15: Rubric tool quality extension ______________________________________________________________ 23
Figure 16: Provenance visualization integrated into the GEOSS Portal ______________________________________ 24
Figure 17: Multiple selection of entries and compare metadata launch button. _______________________________ 25
Figure 18: GeoViQua QualityML website ______________________________________________________________ 26
Figure 19: GeoViQua tutorials first page. _____________________________________________________________ 27

FP7 Project Nr: 265178Project start date: 01 Feb 2011 Acronym: GeoViQua Project title: QUAlity aware VIsualisation for the Global Earth Observation system of systems Theme: ENV.2010.4.1.2‐2 Theme title: Integrating new data visualisation approaches of earth Systems into GEOSS development
1
4.1 Publishable summary
4.1.1 Executive summary GeoViQua aimed to contribute significantly to integrating quality‐aware visualisation of Earth Observation systems into GEOSS developments at the European and international level, bringing together key partners from academia, industry and the broader scientific community. In particular, GeoViQua has provided consistent, high quality specifications, protocols and components allowing scientists and decision makers to access easily to a range of EO information including complete, flexible quality information. GeoViQua components and services are made available within the GCI, complemented by a GEO Portal with enhanced visualisation technologies, which also communicate data quality. This aim was been achieved by means of a range of tools and components that have been provided to allow users seeking data/imagery and associated quality indicators to access the information through modern visualisation environments via the GEO Portal:
GeoViQua analyzed the CGI catalogues being proved that enough quality indicators and provenance information are already present in those. Extraction of quality information from the main EO metadata formats was done. Effort has been put into data extraction and conversion into individual layers that can be combined in GIS tools or WMS services. Impact of these activities has been ensured by the release of the results as scientific publications.
Graphical representation of the metadata, GEO Label, was developed to allow increasing user trustworthiness over GEOSS data and services delivery. Efforts to maximize its impact continue in the form of a cluster service that can be operazionalized, contacts in the GEO and standardization activities.
Models for quality enhanced producer metadata, and for user feedback input are published at http://schemas.geoviqua.org/ in the form of XSD schema documents (accompanied by UML models and examples). The producer model builds on existing ISO standards (19115 and 19157) to permit the encoding of reference dataset information, citations, traceability of quality statements and discovered issues within metadata documents. The user model will inform the database structure for a feedback server from which comments, citations, discovered issues, ratings and reports of usage may be retrieved.
A user feedback system has been developed. An standardization process in OGC has been iniciated to maximize the impact.
A search broker filtering by quality parameters and sorting result by quality indicator values was performed. Query by location with metadata, quality statistical charts, and quality representations through symbology are some of the techniques developed. The components use existing standards to allow direct implementation in the GEO Portal as well as mass‐market geo‐browsers and mapping tools (such as Google Earth) and other 3D viewers. The catalogue is able to harvest quality aware WMS‐Q, SOS‐Q, KML‐Q, etc. Impact is guarantied by the integration in the DAB.
Quality metadata visualization techniques, quality metadata completeness rubric (punctuation) system, and metadata inter‐comparison templates are as well tools included in the GEOSS Portal Efforts to maximize its impact continue by contacts in the GEO and standardization activities and ESA funding to operazionalize this components in the official GEOSS portal.
A standard‐based visualization approach for the visualization of quality/uncertainty information in 2D developed using OGC Web Map Service (WMS). A similar approach was done for 3D visualization based on KML‐Q. Impact is maximised by the release of an OGC public engineering report.
Tools to help provide the formal uncertainty estimates have been developed, integrating the INTAMAP and GECA projects results as starting point. SMEs can maximize the impact of this approach in the future.
Agriculture, Air Quality and Carbon‐cycle selected scenarios have been present all along the different phases of the project, from the iterative collection and documentation of first user and technical requirements
FP7 Project Nr: 265178Project start date: 01 Feb 2011 Acronym: GeoViQua Project title: QUAlity aware VIsualisation for the Global Earth Observation system of systems Theme: ENV.2010.4.1.2‐2 Theme title: Integrating new data visualisation approaches of earth Systems into GEOSS development
2
through the stages of system design and development, and tutorial and instructions later up to the final system integration. GeoViQua team will continue the effort to maximize the impact of the project by several means including, smooth integration in the GCI, conducting careful collaboration with a number of CoPs and standards committees dialog and reuse of the components in other projects and activities.

FP7 Project Nr: 265178Project start date: 01 Feb 2011 Acronym: GeoViQua Project title: QUAlity aware VIsualisation for the Global Earth Observation system of systems Theme: ENV.2010.4.1.2‐2 Theme title: Integrating new data visualisation approaches of earth Systems into GEOSS development
3
4.1.2 Summary description of project context and objectives
4.1.2.1 Context The Global Earth Observation System of Systems GEOSS aims
to be a global and flexible network of content providers
allowing decision makers to access an extraordinary range of
information directly on their desk. It brings together existing
observing systems around the world while supporting the
development of new systems where gaps currently exist. The
network interoperability is ensured by a common set of
standards so that data from different instruments can be
combined into coherent datasets. This network is supported by
the GEOSS Common Infrastructure (GCI) that provides catalogue, search engines and a GEO Portal that offers
a single Internet access point for users search and discovery of data, imagery and analytical software
packages to all parts of the globe.
GeoViQua is in line with the two major directions given by GEO ministers in the GEO Cape Town Declaration
(GEO WP 2010), namely: (1) Continued research and development activities necessary for future observation
systems; (2) Upgrading and expanding of Earth Observations, and building the capacity of individuals,
institutions and systems, particularly in developing countries. GEO has established four Committees to guide
the implementation of the 10‐Year Plan: Architecture and Data, Capacity Building, Science and Technology
and User Interface.
The Architecture and Data committee coordinates the GEOSS Common Infrastructure (GCI) that provides
clearinghouses and portals to allow the integrated discovery and visualisation of data. These standardised
components facilitate interactive, informed evaluation and selection of information by the scientific
community when representing and modelling Earth Systems. GCI is composed of standardised components
tested in the Architecture Implementation Pilots (AIP) harmonizing interoperable systems. GeoViQua has
significantly contributed to this activity by adding rigorous data quality representations to existing search
and visualisation geo‐portal functionalities, prioritising interoperability at all times.
The GCI is subject to continuous development and improvement of its functionality, from infrastructure and
backend services to context‐driven applications and human‐computer interfaces. A major driver for this
development is the wide variety of Societal Benefit Areas (SBAs) that GEOSS addresses, and in particular the
deep interconnections of distributed systems. This broad user community has offered rich challenges and
opportunities for user‐driven development within GeoViQua.
GeoViQua has scientifically explored methodologies for extending this basic infrastructure adding rigorous
data quality in search and visualisation geo‐portal functionality. GeoViQua has provided innovative
components for augmenting the GEOSS and the adoption of GEOSS by the community; contributing to
catalyzing research and development (R&D) activities on GEO.

FP7 Project Nr: 265178Project start date: 01 Feb 2011 Acronym: GeoViQua Project title: QUAlity aware VIsualisation for the Global Earth Observation system of systems Theme: ENV.2010.4.1.2‐2 Theme title: Integrating new data visualisation approaches of earth Systems into GEOSS development
4
4.1.2.2 General objectives of the project GeoViQua has 3 major scientific and technical objectives:
a) Provision of innovative tools to enhance the current infrastructure capability. GeoViQua’s major technical innovation will be searching and visualising tools for the community which communicate and exploit data quality information from GEOSS catalogues. The activities required to deliver this major objective are as follows:
1. Derive, extract and collect information about data quality from data, metadata, CAL/VAL processes including in‐situ observations, provenance and end‐users’ feedback
2. Encode and embed information on data quality and link it to data themselves. This process will include interfacing with standards and protocols, quality metrics and storage catalogues
3. Develop context‐driven smart visualisation of information on data quality (e.g., reveal information and detail progressively) in 2D and 3D. A prototype has to be developed
4. Enable search and discovery over GEO Portal using information on data quality. 5. Enable the developed functionality over low bandwidth transmission and small screen
devices (smart phones and PDA components).
b) Contribution to the GEO Label development. With its technical and scientific achievements, GeoViQua will significantly contribute to the definition design, prototype development, and evaluation of a strong GEO Label, which will allow users to query, explore and contribute to data quality information within a flexible and interoperable framework. GEO Label requirements will be defined (Work Package WP2), the label will be integrated with the components (WP6) and validated and applied in pilot cases (WP7) and disseminated to the community will be done (WP8). It will be completed in collaboration with the GEO task ST‐09‐02. The GEO Label deliverable will mature during the project and will crystallize on a final report about this.
c) Harmonization, exploitation and dissemination of project outputs. GeoViQua will secure lasting impact for its deliverables through continuous and direct interaction with a number of relevant GEO tasks and user communities. A careful validation process will be conducted in collaboration with a number of communities of practice and standards committees to ensure that the project contributes effectively to the GEOSS GCI architecture. Collaboration with AIP will be on going. The solution will be transferred to the GCI.
4.1.2.3 Specific objectives of the project The GeoViQua’s primary goal is to augment the GEOSS Common Infrastructure with innovative quality‐aware
visualisation tools and geo‐search capabilities, providing the user community with enhanced and advanced
tools available through the GEO Portal and other end‐user tools. All work done is contributing to this
objective.
Here we present a list of the specific objectives, using the same sentences extracted from the first section of
the Annex I but arranged as enumerated bullets, sorted by topic and with redundancies removed. This gives
us a clearer list of the initial objectives of the project.
Derive, Encode and Catalogue
1.1 Derive, extract and collect information about data quality from data, metadata, CAL / VAL processes including in‐situ observations, provenance and end‐users’ feedback. A prototype will be ready at month 18 (milestone MS04) and the component will be ready for integration in month 24 (milestone M 3.2). WP3
FP7 Project Nr: 265178Project start date: 01 Feb 2011 Acronym: GeoViQua Project title: QUAlity aware VIsualisation for the Global Earth Observation system of systems Theme: ENV.2010.4.1.2‐2 Theme title: Integrating new data visualisation approaches of earth Systems into GEOSS development
5
1.2 Encode and embed information on data quality and link it to data themselves. This process will include interfacing with standards and protocols, quality metrics and storage catalogues. The solution will be provided at month 15 (milestone MS11). WP3
1.3 Provide a data quality encoding that can be parsed, interpreted and applied in a wide variety of scenarios considering ISO, QA4EO and UncertML (deliverable D6.1 month 18). WP6
1.4 Develop tools and procedures to allow users of datasets to provide feedback about the utility of datasets for their purpose. WP3
Search and discovery
2.1 Enable search and discovery best dataset for their purpose over GEO Portal using information on data quality. A prototype will be ready at month 18 (milestone MS06) and the component will be ready for integration in month 24 (milestone M 2.2). WP4
Visualize
3.1 Catalogue current methods for visualising quality information and uncertainty. WP5
3.2 Develop context‐driven smart visualisation of information on data quality (e.g., reveal information and detail progressively) in 2D and 3D. A prototype will be ready at month 18 (milestone MS08) A prototype will be ready on month 18 (milestone M 5.1) and the component will be ready for integration in month 24 (milestone M 5.2). WP5
3.3 Visualization tools which provide links to textual quality information. WP5 Validate and Integrate
4.1 Contribute to the definition of a strong GEO Label by allowing users to query, explore and contribute to data quality information within a flexible and interoperable framework. GEO Label requirements will be determined (WP2). WP6
4.2 Follow the evolving directives on standards as given by the Open Geospatial Consortium (OGC) and the IEEE’s Standards Interoperability Forum (SIF). WP8
4.3 A careful validation process will be conducted in collaboration with a number of communities of practice and standards committees to ensure that the project contributes effectively to the GEOSS GCI architecture. Collaboration with AIP will be continuous (reported in deliverables D 8.3 month 19, WP7, D 8.4 month 32)
4.4 The solution will be transferred to the GCI in month 35 (milestone M 6.2)
4.1.3 Description of the main S&T results/foregrounds The GeoViQua project has 3 main kinds of results: scientific publications, standards participation and
components (and its documentation) for the GEOSS common infrastructure.
4.1.3.1 Scientific publications In this report we highlight the main 3 scientific papers produced during the project:
X. Yang , J. D. Blower , L. Bastin , V. Lush , A. Zabala , J. Maso , D. Cornford , P. Diaz , J. Lumsden (2013) An
integrated view of data quality in Earth observation. Philosophical Transactions of the Royal Society A:
Mathematical, Physical and Engineering Sciences Vol. 371/Issue 1983 Royal Society of London, United
Kingdom , 28/01/2013.

FP7 Project Nr: 265178Project start date: 01 Feb 2011 Acronym: GeoViQua Project title: QUAlity aware VIsualisation for the Global Earth Observation system of systems Theme: ENV.2010.4.1.2‐2 Theme title: Integrating new data visualisation approaches of earth Systems into GEOSS development
6
In this paper GeoViQua the team exposes that data quality is a difficult notion to define precisely, and
different communities have different views and understandings of the subject. This causes confusion, a lack
of harmonization of data across communities and omission of vital quality information. For some existing
data infrastructures, data quality standards cannot address the problem adequately and cannot fulfil all user
needs or cover all concepts of data quality. In this study, we discuss some philosophical issues on data
quality. We identify actual user needs on data quality, review existing standards and specifications on data
quality, and propose an integrated model for data quality in the field of Earth observation. It also proposes a
practical mechanism for applying the integrated quality information model to a large number of datasets
through metadata inheritance. While our data quality management approach is in the domain of EO, we
believe that the ideas and methodologies for data quality management can be applied to wider domains and
disciplines to facilitate quality‐enabled scientific research.
The paper addresses the problem of EO data quality from a number of different angles, including (i) clarifying
concepts and terminology, (ii) reviewing existing relevant international standards, (iii) establishing unfulfilled
user needs, and (iv) surveying the current state of the GEOSS. The paper proposes the GeoViQua model as
an expanded model for representation of EO data quality and described how it can be applied to large data
holdings through a metadata inheritance mechanism. Although specifically aimed at the EO community, this
study is relevant to many other areas of e‐Science, particularly where data need to be provided to a diverse
user community. Many of the concepts (e.g. UncertML) are entirely general and can be much more widely
applied. Conversely, the EO informatics community will benefit from innovations occurring in other
communities, particularly concerning the linking of information from different sources. We note that, for
these linkages to be effective, GEOSS requires a robust mechanism for globally, uniquely and permanently
identifying datasets, something that is currently lacking. The paper concludes that a strong need was also
identified to help users to understand the provenance of datasets. The W3C provides a generic provenance
model for data on the Internet, and there is an almost one‐to‐one correspondence between this model and
the ISO 19115 Lineage model. There is therefore strong potential for interoperability with other
communities.
6 citations of this paper has been detected so far:
Mobasheri, A. (2013). Exploring the Possibility of Semi-Automated Quality Evaluation of Spatial Datasets in Spatial Data Infrastructure. Journal of ICT Research & Applications, 7(1).
Feng, C. C. (2013). Mapping Geospatial Metadata to Open Provenance Model.
Blower, J., Alegre, R., Bennett, V. L., Clifford, D., Kershaw, P. J., Lawrence, B., ... & Phipps, R. (2013). Understanding climate data through commentary metadata: the CHARMe project.
Zabala, A., Riverola, A., Serral, I., Díaz, P., Lush, V., Maso, J., ... & Habermann, T. (2013). Rubric-Q: Adding Quality-Related Elements to the GEOSS Clearinghouse Datasets.
Townend, P., Xu, J., & Austin, J. (2013). e-Science–towards the cloud: infrastructures, applications and research. Philosophical Transactions of the Royal Society A: Mathematical, Physical and Engineering Sciences, 371(1983), 20120082.
Leibovici, D. G., & Jackson, M. J. Copula metadata est. Agile conference 2013
Alaitz Zabala , Anna Riverola , Ivette Serral , Paula Diaz , Victoria Lush , Joan Maso , Xavier Pons , Ted
Habermann (2013) Rubric‐Q: Adding Quality‐Related Elements to the GEOSS Clearinghouse Datasets . IEEE
Journal of Selected Topics in Applied Earth Observations and Remote Sensing. Vol. 6/Issue 3, Institute of
Electrical and Electronics Engineers Inc., United States, 01/06/2013 pp1676‐1687.

FP7 Project Nr: 265178Project start date: 01 Feb 2011 Acronym: GeoViQua Project title: QUAlity aware VIsualisation for the Global Earth Observation system of systems Theme: ENV.2010.4.1.2‐2 Theme title: Integrating new data visualisation approaches of earth Systems into GEOSS development
7
In this paper GeoViQua the team that geospatial data have become a crucial input for the scientific
community for understanding the environment and developing environmental management policies.
Metadata in the GEOSS Clearinghouse are often not easily understood by users, especially when presented
in ISO XML encoding. Data quality included in the metadata is basic for users to select datasets suitable for
them. The work aims to help users to understand the quality information held in metadata records and to
provide the results to geospatial users in an understandable and comparable way. Thus, we have developed
an enhanced tool (Rubric‐Q) for visually assessing the metadata quality information and quantifying the
degree of metadata population. Rubric‐Q is an extension of a previous NOAA Rubric tool used as a metadata
training and improvement instrument. The paper also presents a thorough assessment of the quality
information by applying the Rubric‐Q to all dataset metadata records available in the GEOSS Clearinghouse.
The results reveal that just 8.7% of the datasets have some quality element described in the metadata,
63.4% have some lineage element documented, and merely 1.2% has some usage element described.
Paula Díaz Redondo, Joan Masó, Eva Sevillano, Miquel Ninyerola, Alaitz Zabala, Ivette Serral, Xavier Pons
(2012) Analysis of quality metadata in the GEOSS Clearinghouse, International Journal of Spatial Data
Infrastructures Research. Vol 7, pp 352‐377
In this paper GeoViQua the team explores the GEOSS Clearinghoure records where users often try to find the
fit‐for‐use data. Quality indicators and provenance are included in the metadata and are potentially useful
variables that allow users to make an informed decision avoiding to download and to assess the data
themselves. However, no previous studies have been made on the completeness and correctness of the
metadata records in the Clearinghouse. The objective of this paper is to analyze the data quality information
distributed by the GEOSS Clearinghouse. The aim is to quantify its completeness and to provide clues on how
the current status of the Clearinghouse could be improved and how useful quality aware tools could be. The
methodology used in the current analysis consists in first harvesting of the Clearinghouse and then quantify
the quality information found in 97203 metadata records, by using a semi‐automatic approach. The results
reveal that the inclusion of quality information on metadata records is not rare: 19.66% of the metadata
records contain some quality element. However, this is not general enough and several aspects could be
improved. For instance, 77.78% of quantitative measures lack measure units. When quality indicators are
not sufficient, the lineage metadata information could be used to mitigate this situation by analysing the
process steps and sources used to create a dataset. However, even though lineage is reported in 15.55% of
the records, only 1.27% of the cases return a complete list of process steps with sources.
In this paper, GeoViQua team also provides some indications on what is lacking in the current producer
metadata model and, detected a gap in usage or user feedback metadata in GEOSS. Moreover, information
extracted from GeoViQua interviews with users indicates that they value informal comments and user
feedback on datasets as a complement of the more formal producer‐oriented metadata description of the
data. Although, many efforts within the scientific community and the Quality Assurance Framework for Earth
Observation (QA4EO) group have been invested in describing how to parameterize data quality and
uncertainty, we conclude that still extra work can be done to provide complete quality information in the
metadata catalogues. In brief, since the GEOSS Clearinghouse references data from the most important
agencies and research organizations, the results presented in this paper provide a perspective on how well
quality is disseminated in the Earth observation community in general.
FP7 Project Nr: 265178Project start date: 01 Feb 2011 Acronym: GeoViQua Project title: QUAlity aware VIsualisation for the Global Earth Observation system of systems Theme: ENV.2010.4.1.2‐2 Theme title: Integrating new data visualisation approaches of earth Systems into GEOSS development
8
4.1.3.2 Standards participation In this report we highlight main contributions to the standard process: 3 public engineering reports and the
start of 2 new standard groups to develop standards.
Stefano Nativi, and Joan Masó, (2014) GCI Research and GeoViQua Integration Engineering Report. GEOSS
AIP‐6 Engineering Reports. http://www.ogcnetwork.net/pub/ogcnetwork/GEOSS/AIP6/documents/
Technical/GCIResearch/GEOAIP6_GCIResearch_GeoViQuaIntegration_ER.pdf
This document summarizes two main activities took place in AIP6. In the Agriculture group a methodology to
integrate both GEO label API and the User feedback system API was tested in the GMU drought portal. In the
GCI research, several GeoViQua quality improvements were incorporated into the DAB. The system is related
to GEO SBA Task AG‐01 Global Agricultural Monitoring and Early Warning. The system to be integrated into is
its Component C1 ‐ A Global Operational Monitoring System of Systems for Agricultural Production, Famine
Early‐warning, Food Security and Land‐use Change.
Jon Blower, Xiaoyu Yang, Joan Masó and Simon Thum (2013) OGC® OWS 9 Data Quality and Web Mapping
Engineering Report OGC 12‐160r1. https://portal.opengeospatial.org/files/?artifact_id=52884
This Engineering Report specifies conventions for conveying information about data quality through the OGC
Web Map Service Standard (known hereafter as the “WMS‐Q conventions”), OGC Web Map Tile Service
Standard (known hereafter as the “WMTS‐Q conventions”), OGC KML (known hereafter as the “KML‐Q
conventions”) and OGC Augmented Reality Markup Language. Some problems and details were found in the
implementation phase and a new version of this ER was released by GeoViQua. Details on the identification
of pixel level layers and how the description of these layers can be converted into ISO metadata descriptions
in the DAB can be seen in the document WMS‐Q version 2.0 that can be found in the documentation area of
the GeoViQua website.
Matthes Rieke, Benjamin Pross and Joan Masó (2013) OWS‐9 CCI Conflation with Provenance Engineering
Report OGC 12‐159. https://portal.opengeospatial.org/files/?artifact_id=51818
This OGC® Engineering Report describes the architecture of a WPS capable of conflating two datasets while
capturing provenance information about the process. The report also provides information about defining
and encoding conflation rules and about encoding provenance information. This Engineering Report was
created as a deliverable for the OGC Web Services, Phase 9 (OWS‐9) initiative of the OGC Interoperability
Program.
Creation of OGC Geospatial User Feedback Standards Working Group Charter (OGC 14‐020). February 21,
2014
The creation of a new OGC Geospatial User Feedback Standards Working Group has been approved in the
last OGC TC in Washington DC. The formation of the new group will soon start. The SWG proposal has
initially been written in an official charter. The Geospatial User Feedback SWG is established with the
following proposed activities:
1. Review the GeoViQua User Feedback Model (UFM; sometimes referred as Consumer Quality Model or User Quality Model) UML and XML schema that is currently included in the version 4 of the
FP7 Project Nr: 265178Project start date: 01 Feb 2011 Acronym: GeoViQua Project title: QUAlity aware VIsualisation for the Global Earth Observation system of systems Theme: ENV.2010.4.1.2‐2 Theme title: Integrating new data visualisation approaches of earth Systems into GEOSS development
9
GeoViQua General Quality model (http://schemas.geoviqua.org/GVQ/4.0/) and determine the best way to bring it into the OGC process.
2. Reach out to experts in online collaboration (e.g. on the topic of wikis) and scientific peer review processes to harvest existing research and experiences.
3. Refine which feedback items are more useful for users, producers and distributors, and discern what concepts can be easily understood by users and what others are less attractive as feedback items due to their descriptive and technical complexity.
4. Investigate how to best incorporate the UFM into the OGC standards framework (and the ISO 19115 Metadata model) including identifying places where there may be common elements in existing standards. Identify required best practices for data owner to allow users to comment on the metadata accessible through OGC data services such as WFS, WCS, and SOS.
5. Develop a UFM standard. 6. Assist the current implementations of the GeoViQua Quality model in the migration to the final
agreed UFM standard. 7. Investigate the need for a revision of the OGC abstract model to include the User Feedback concept
for Geospatial information. 8. Consider the standardization of a User Feedback query API or service interface and its relation to the
CSW standards and impact on the GEO label concept. 9. Interact with other DWGs about challenges of globally identifying datasets and multilingual
metadata. 10. Support upcoming research projects and implementers in taking up the GeoViQua UFM and the
existing software implementations. User feedback has been identified by GeoViQua interviewees as one of the quality components that GEOSS
users appreciate during the project’s requirements gathering phase. Quality information is often too abstract
and difficult to understand alone and users like to complement this information with how the dataset has to
learn from other people’s experiences, e.g. difficulties found. With the explosion of geospatial digital data
and particularly Earth observation data, there is a need for ranking and comparing mechanisms. This concurs
with a continuing move towards a social web, user reviews as a generally accepted component of online
shopping, and mainstream developments such as “social search”. Including user‐generated metadata into
geospatial data services has the potential to improve the available metadata, increase usability of datasets,
extend the appropriate usage/uptake/adoption of published datasets, give data producers a chance to alter
the data collection or publishing methods, and ultimately improve the quality of the data as well as the
quality of the analysis based on a dataset.
By OGC adopting a Geospatial User Feedback Model and Catalogue profile, the user community will be
assured of a formal process for maintaining, improving, documenting and in fact, formalizing the standard.
This will lead to a greater confidence in the use of the standard and new opportunities for integration with
other related OGC standards.
IEEE standardization of the GEO label
The GEO Label, developed by the GeoViQua project, is both a graphical representation of 8 facets of data
quality, as well as an application that assess metadata completeness. Mechanisms for capturing user
feedback on data sets, and reflecting this in the label are also part of the concept. More details on the GEO
Label are available here. The purpose of this process is to ask the SCC40 in IEEE to consider the GEO Label
concept suitable as potential standard to be developed by IEEE, and if we would be willing to sponsor a

FP7 Project Nr: 265178Project start date: 01 Feb 2011 Acronym: GeoViQua Project title: QUAlity aware VIsualisation for the Global Earth Observation system of systems Theme: ENV.2010.4.1.2‐2 Theme title: Integrating new data visualisation approaches of earth Systems into GEOSS development
10
project around it. Members of the GEOSS Standards and Interoperability Forum will be asked to prepare a
draft Project Authorization Request. The IEEE‐SA process is explained at http://standards.ieee.org/develop.
Once the group will start to work will decide how to proceed and which part of the work of the GEO label
can be adopted or adapted in the IEEE geospatial label standard can and which part will be changed to fulfill
the requirements of the IEEE membership needs. This is part of the outreach activities that GeoViQua has
started to continue the live of the outcomes after the end of the project.
4.1.3.3 Components for the GEOSS common infrastructure The most important outcomes of the GeoViQua project are its components. The following components have
been released to GEOSS for its integration in the GCI or for its use in other projects. The new components
are: The GeoViQua model, DAB‐Q, User Feedback system, GEO label API, Quality emitter, The GICA as a
Service, WMS‐Q instances and Greenland client, KML‐Q services, Metadata comparison, Rubric Q,
Provenance viewer
The GeoViQua Quality model
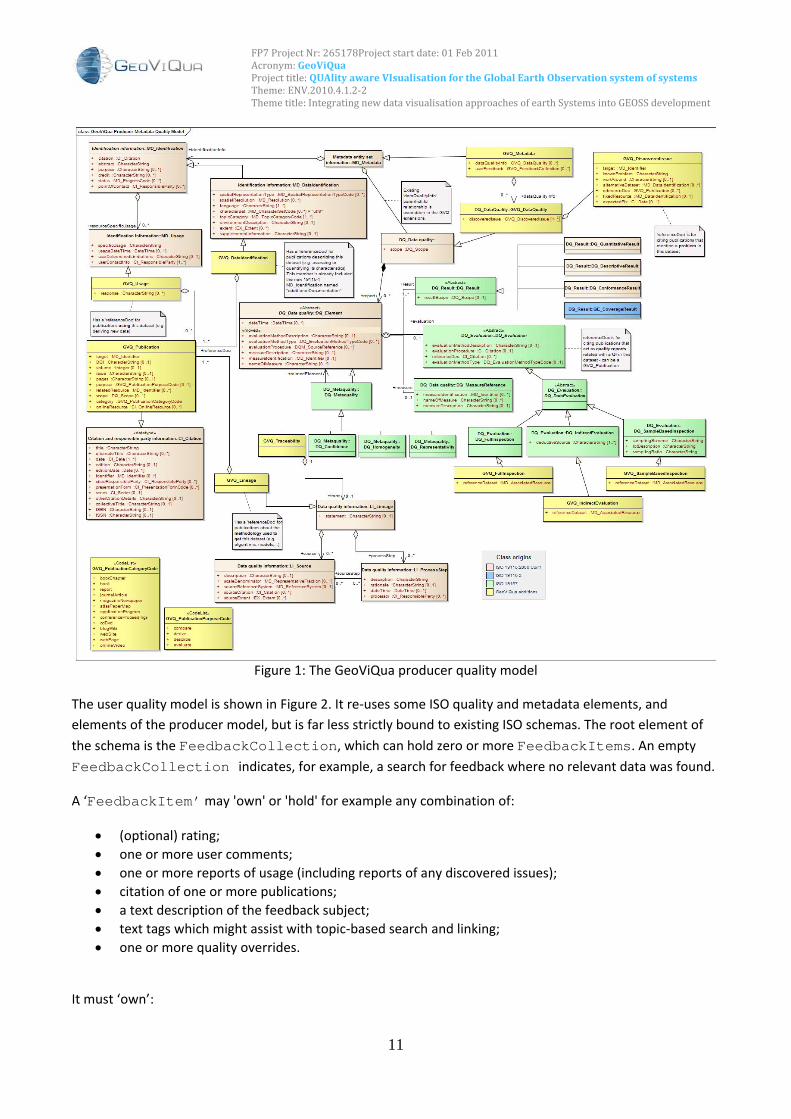
The producer quality model introduces elements to record qualitative and quantitative quality information,
and to identify resources (i.e., datasets) in order to relate metadata in hierarchical or other ways. The model
extends ISO 19115, 19115‐2 and 19157, adding means to report publications, discovered issues, reference
datasets used for quality evaluation, traceability, and statistical summaries of quantified uncertainty.
FP7 Project Nr: 265178Project start date: 01 Feb 2011 Acronym: GeoViQua Project title: QUAlity aware VIsualisation for the Global Earth Observation system of systems Theme: ENV.2010.4.1.2‐2 Theme title: Integrating new data visualisation approaches of earth Systems into GEOSS development
11
Figure 1: The GeoViQua producer quality model
The user quality model is shown in Figure 2. It re‐uses some ISO quality and metadata elements, and
elements of the producer model, but is far less strictly bound to existing ISO schemas. The root element of
the schema is the FeedbackCollection, which can hold zero or more FeedbackItems. An empty
FeedbackCollection indicates, for example, a search for feedback where no relevant data was found.
A ‘FeedbackItem’ may 'own' or 'hold' for example any combination of:
(optional) rating;
one or more user comments;
one or more reports of usage (including reports of any discovered issues);
citation of one or more publications;
a text description of the feedback subject;
text tags which might assist with topic‐based search and linking;
one or more quality overrides.
It must ‘own’:
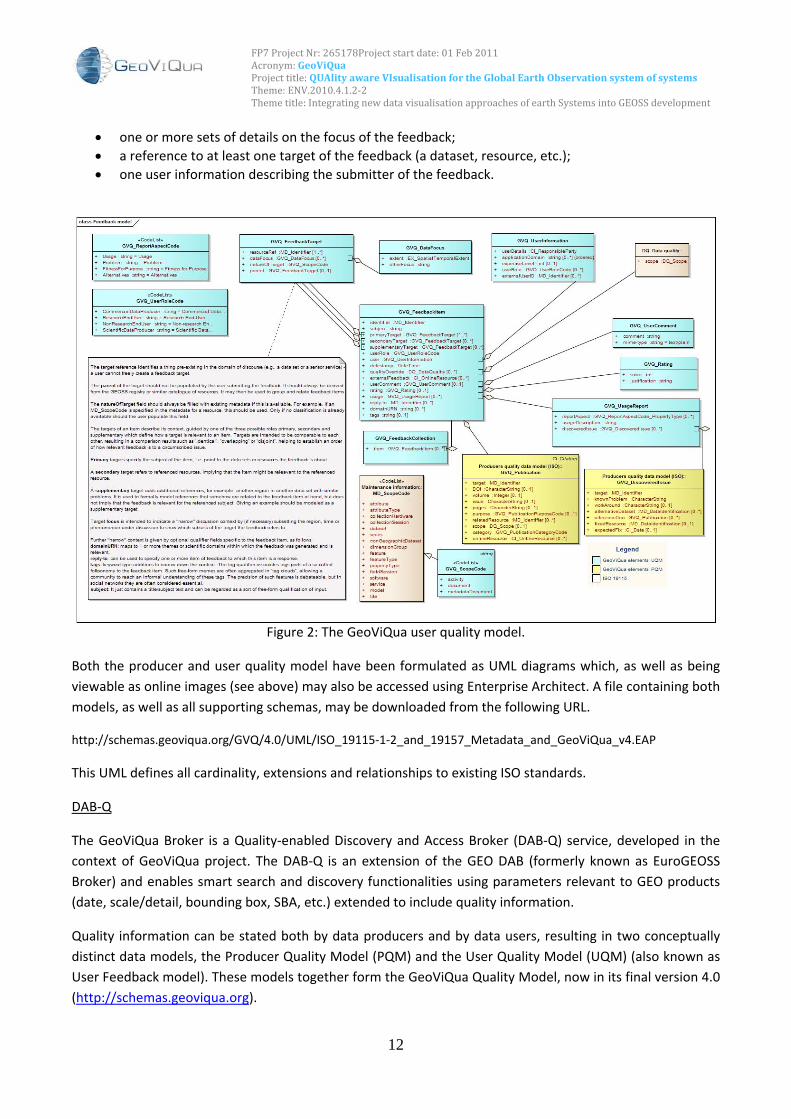
FP7 Project Nr: 265178Project start date: 01 Feb 2011 Acronym: GeoViQua Project title: QUAlity aware VIsualisation for the Global Earth Observation system of systems Theme: ENV.2010.4.1.2‐2 Theme title: Integrating new data visualisation approaches of earth Systems into GEOSS development
12
one or more sets of details on the focus of the feedback;
a reference to at least one target of the feedback (a dataset, resource, etc.);
one user information describing the submitter of the feedback.
Figure 2: The GeoViQua user quality model.
Both the producer and user quality model have been formulated as UML diagrams which, as well as being
viewable as online images (see above) may also be accessed using Enterprise Architect. A file containing both
models, as well as all supporting schemas, may be downloaded from the following URL.
http://schemas.geoviqua.org/GVQ/4.0/UML/ISO_19115‐1‐2_and_19157_Metadata_and_GeoViQua_v4.EAP
This UML defines all cardinality, extensions and relationships to existing ISO standards.
DAB‐Q
The GeoViQua Broker is a Quality‐enabled Discovery and Access Broker (DAB‐Q) service, developed in the
context of GeoViQua project. The DAB‐Q is an extension of the GEO DAB (formerly known as EuroGEOSS
Broker) and enables smart search and discovery functionalities using parameters relevant to GEO products
(date, scale/detail, bounding box, SBA, etc.) extended to include quality information.
Quality information can be stated both by data producers and by data users, resulting in two conceptually
distinct data models, the Producer Quality Model (PQM) and the User Quality Model (UQM) (also known as
User Feedback model). These models together form the GeoViQua Quality Model, now in its final version 4.0
(http://schemas.geoviqua.org).

FP7 Project Nr: 265178Project start date: 01 Feb 2011 Acronym: GeoViQua Project title: QUAlity aware VIsualisation for the Global Earth Observation system of systems Theme: ENV.2010.4.1.2‐2 Theme title: Integrating new data visualisation approaches of earth Systems into GEOSS development
13
The DAB uses the CSW/ISO‐Q that is an extension of the standard OGC Catalog Service for the Web 2.0.2 ISO
Application Profile (CSW ISO AP) to support quality‐constrained queries. Following the standard CSW
behavior, the CSW/ISO‐Q interface requires explicit quality statements in order to match query constraints.
In other words, datasets without quality statements will never be returned as a result of a quality‐
constrained query.
The Capabilities document of the CSW/ISO‐Q interface is available at the following endpoint:
http://geoviqua.essi‐lab.eu/dabq‐
demo/services/cswisoq?service=CSW&version=2.0.2&request=GetCapabilities
Quality‐constrained discovery is enabled by query constraints based on the above quality indicators. Such
quality constraints are expressed against queryable properties (also referred to as “queryables”), which are
selected concrete expressions of quality parameters/indicators both for the Producer Quality Model and
User Feedback model.
The DAB‐Q includes new several accessos. The WMS‐Q accessor maps the WMS‐Q Layers into ISO datasets
according to specific requirements described in the WMS‐Q version 2.0. The current WMS accessor of the
DAB maps all the Layers of the Capabilities document. The bottom‐level Layers are mapped into the ISO
concept of dataset and all the Layers above in the hierarchy are mapped to the concept of dataset collection.
The WAF accessor simply reads the XML files in the folder and tries to map them into the ISO 19115
standard. In the context of GeoViQua the WAF contains metadata based on the PQM, which will be mapped
into a uniform data model implementing ISO 19115, based on official ISO 19139 schemas (http://essi‐
lab.eu/gvq/waf).
This component can be tested using the GI client (see Figure 3): http://geoviqua.essi‐lab.eu/dabq‐demo/gi‐
portal/index.jsp.

FP7 Project Nr: 265178Project start date: 01 Feb 2011 Acronym: GeoViQua Project title: QUAlity aware VIsualisation for the Global Earth Observation system of systems Theme: ENV.2010.4.1.2‐2 Theme title: Integrating new data visualisation approaches of earth Systems into GEOSS development
14
Figure 3: GI test portal
User Feedback system,
The user feedback system is composed by several independent components: The user feedback database, the user feedback API and the user feedback interface. The user feedback database stores the feedback items in a relational database. An advantage of using a relational database is the support for complex search queries. Since the feedback data is highly relational it makes sense to use a relational database. A disadvantage is that it is more difficult to create the highly complex XML output. The feedback catalogue uses the Django framework with a PostgreSQL database as backend. The user feedback API is the query language to the catalogue allows the users to provide information about the different datasets present on the portal. The API framework Tastypie is used to construct a RESTful interface. Via this interface feedback items and collections can be requested and searched and feedback items can be posted. The feedback catalogue has an API that is used by the DAB to request all the feedback items that refers to a producer metadata document instance and it links both together in a single response.
In the GeoViQua Geoportal mirror, the link to the feedback of each dataset has been placed on the dataset description page, and easily allows checking if any feedback has been submitted providing a feedback count on the button Documentation and access to the about the API can be found here: http://geoviqua.stcorp.nl/devel/api/v1, http://geoviqua.stcorp.nl/api/v1
FP7 Project Nr: 265178Project start date: 01 Feb 2011 Acronym: GeoViQua Project title: QUAlity aware VIsualisation for the Global Earth Observation system of systems Theme: ENV.2010.4.1.2‐2 Theme title: Integrating new data visualisation approaches of earth Systems into GEOSS development
15
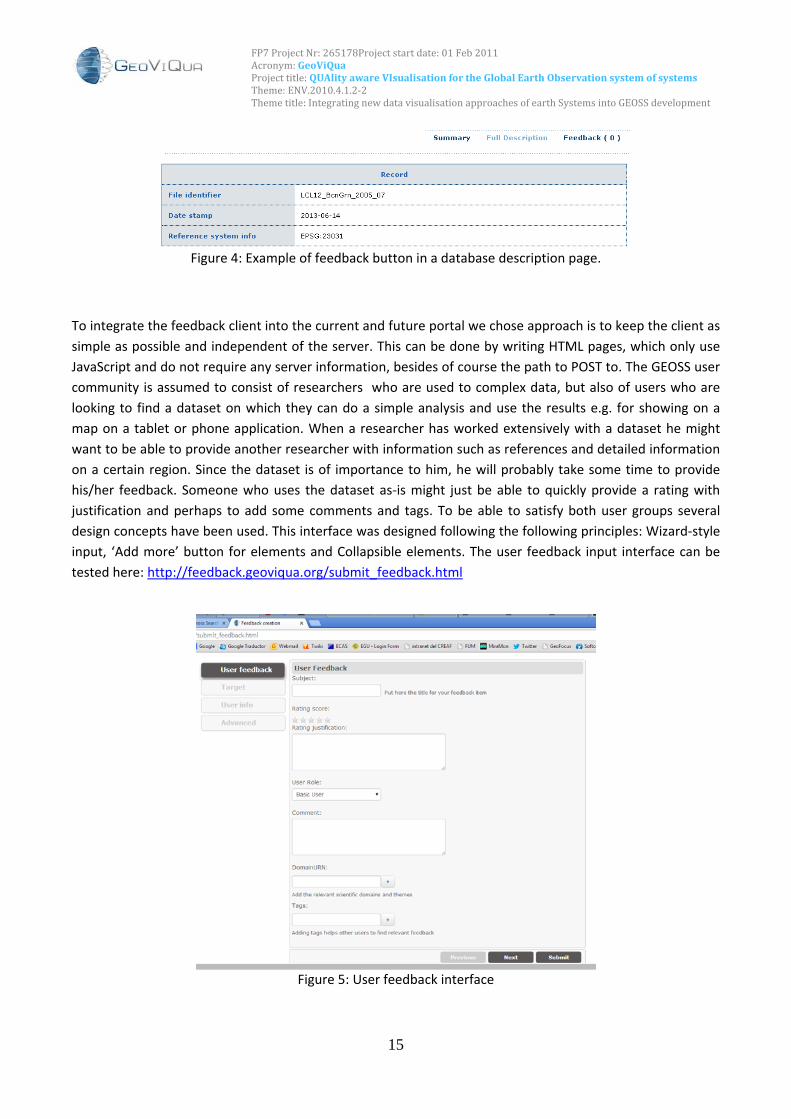
Figure 4: Example of feedback button in a database description page.
To integrate the feedback client into the current and future portal we chose approach is to keep the client as
simple as possible and independent of the server. This can be done by writing HTML pages, which only use
JavaScript and do not require any server information, besides of course the path to POST to. The GEOSS user
community is assumed to consist of researchers who are used to complex data, but also of users who are
looking to find a dataset on which they can do a simple analysis and use the results e.g. for showing on a
map on a tablet or phone application. When a researcher has worked extensively with a dataset he might
want to be able to provide another researcher with information such as references and detailed information
on a certain region. Since the dataset is of importance to him, he will probably take some time to provide
his/her feedback. Someone who uses the dataset as‐is might just be able to quickly provide a rating with
justification and perhaps to add some comments and tags. To be able to satisfy both user groups several
design concepts have been used. This interface was designed following the following principles: Wizard‐style
input, ‘Add more’ button for elements and Collapsible elements. The user feedback input interface can be
tested here: http://feedback.geoviqua.org/submit_feedback.html
Figure 5: User feedback interface

FP7 Project Nr: 265178Project start date: 01 Feb 2011 Acronym: GeoViQua Project title: QUAlity aware VIsualisation for the Global Earth Observation system of systems Theme: ENV.2010.4.1.2‐2 Theme title: Integrating new data visualisation approaches of earth Systems into GEOSS development
16
User Feedback system has been released as an open source development available here: https://github.com/GeoViQua/geo‐userfeedback. More information can also be found here: http://geoviqua.stcorp.nl/home.html. GEO label API,
The GEO label generator can be easily integrated through a script added to the webpage source code. To do it, the GEOSS portal only needs to know how to use the GEO label API that converts metadata and user feedback XML documents into an image mosaic that ends up composing the GEO label, see Figure 6. The GEO Label Service is a RESTful API that allows generating a SVG and JSON representation of the label from supplied metadata records. The documentation of the API can be found here: http:www.geolabel.net/api.html and http://twiki.geoviqua.org/twiki/bin/view/GEO_SIF/SifGeoLabel.
Figure 6: GEO label showing all the facets filled in but the one about user feedback.
This API can be summarized as the following URL template: http://www.geolabel.net/api/v1/geolabel?metadata={ProducerMetadataRecord}&feedback={UserFeedbackItems}&format={format}&size={size}
{ProducerMetadataRecord} is an URL pointing to the PQM in the form of an XML file
{UserFeedbackItems} is an URL to the corresponding XML feedback resource
{format} stands for SVG or JSON
{size} corresponds to the output size of the GEOLabel bounding box in pixels Based in this API there are two implementations developed during the project that can be used and can be found here: http://www.geolabel.net and http://geoviqua.dev.52north.org/glbservice/api/svg

FP7 Project Nr: 265178Project start date: 01 Feb 2011 Acronym: GeoViQua Project title: QUAlity aware VIsualisation for the Global Earth Observation system of systems Theme: ENV.2010.4.1.2‐2 Theme title: Integrating new data visualisation approaches of earth Systems into GEOSS development
17
Figure 7: GEO label API documentation as shown in www.geolabel.net
The Aston implementation has been released as open source and can be found here: https://github.com/lushv/geolabel‐service.
GECAaaS WPS (S&T) Several other functionalities have been integrated in the GEOSS portal. One of the most innovative
integrations is the capability to assess quality using reference data in the GEOSS portal. To illustrate the
methodology, a web form or “Data Intercomparison“ allow for selecting a satellite image and a collection of
in‐situ data that are send to the GECA Toolset (a toolkit for ingesting, processing and inter‐comparing
satellite data against correlative data) as a request to an online web processing service (a WPS). The
intercomparison result is shown either within the GEOSS Portal or in a pop‐up window. If accepted by the
user, the results can be transformed into a quality indicator as explained below.
Figure 8: GECA as a service integrated in the GEOSS Portal
Quality emitter
A challenge with many existing datasets is that they do not have reliable quantitative quality indicators
available to them. To address this, GeoViQua has developed a tool to combine reference data with
collocated measurements to compute dataset‐level quality indicators. These quality indicators, such as the
mean (bias), variance, or quantiles of the uncertainties can then be added to XML in the extended producer

FP7 Project Nr: 265178Project start date: 01 Feb 2011 Acronym: GeoViQua Project title: QUAlity aware VIsualisation for the Global Earth Observation system of systems Theme: ENV.2010.4.1.2‐2 Theme title: Integrating new data visualisation approaches of earth Systems into GEOSS development
18
quality model. The additional XML includes a description of the lineage of the quality indicators. The quality
emitter tool also provides a validation of the quality indicators (often referred as meta‐quality descriptors)
which allow the user to judge the reliability of the quality indicators, and to easily access information on how
these indicators were computed. More information can be found here:
https://github.com/GeoViQua/computeqi‐web and https://github.com/GeoViQua/emulatorization‐api
Figure 9: Quality emitter intermediate graphic.
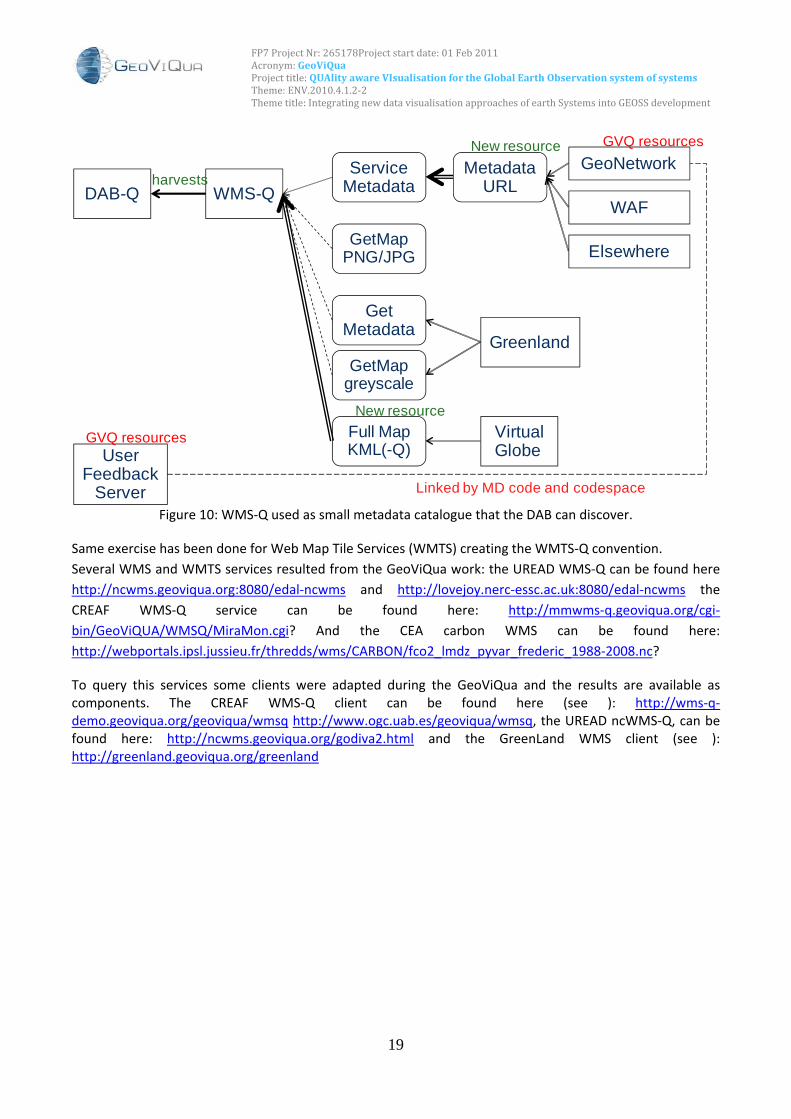
WMS‐Q instances,
The WMS‐Qs are Web Map Services following the standard defined by the OGC which are aware that some
of its layers describe quality parameters of certain variables. Thus, instead of each layer corresponding to
one variable like in regular WMS, in WMS‐Q some layers are just statistical descriptors that inform about the
quality and ensemble describe one variable. These instances are connected to the DAB‐Q from where the
portal is able to gather them. Each server is presented in the DAB as a metadata record for the services plus
a number of metadata records corresponding to each of its served datasets (each dataset is compound of
different variables which at same time are described by different quality components). The DAB‐Q does not
generate a record for each uncertainty component but just for the dataset level layers.
It is worth to note that WMS‐Q also recommends the use of MetadataURL as a way to expose the dataset
level metadata. This way a WMS service can act as a small metadata catalogue for providers that do not
want to expose their catalogue (see Figure 10).
FP7 Project Nr: 265178Project start date: 01 Feb 2011 Acronym: GeoViQua Project title: QUAlity aware VIsualisation for the Global Earth Observation system of systems Theme: ENV.2010.4.1.2‐2 Theme title: Integrating new data visualisation approaches of earth Systems into GEOSS development
19
DAB-Q WMS-Qharvests
ServiceMetadata
GetMapPNG/JPG
GetMapgreyscale
GetMetadata
Full MapKML(-Q)
Virtual Globe
Greenland
MetadataURL
GeoNetwork
WAF
Elsewhere
New resource
New resource
User Feedback
Server
GVQ resources
GVQ resources
Linked by MD code and codespace
Figure 10: WMS‐Q used as small metadata catalogue that the DAB can discover.
Same exercise has been done for Web Map Tile Services (WMTS) creating the WMTS‐Q convention.
Several WMS and WMTS services resulted from the GeoViQua work: the UREAD WMS‐Q can be found here
http://ncwms.geoviqua.org:8080/edal‐ncwms and http://lovejoy.nerc‐essc.ac.uk:8080/edal‐ncwms the
CREAF WMS‐Q service can be found here: http://mmwms‐q.geoviqua.org/cgi‐
bin/GeoViQUA/WMSQ/MiraMon.cgi? And the CEA carbon WMS can be found here:
http://webportals.ipsl.jussieu.fr/thredds/wms/CARBON/fco2_lmdz_pyvar_frederic_1988‐2008.nc?
To query this services some clients were adapted during the GeoViQua and the results are available as components. The CREAF WMS‐Q client can be found here (see ): http://wms‐q‐demo.geoviqua.org/geoviqua/wmsq http://www.ogc.uab.es/geoviqua/wmsq, the UREAD ncWMS‐Q, can be found here: http://ncwms.geoviqua.org/godiva2.html and the GreenLand WMS client (see ): http://greenland.geoviqua.org/greenland

FP7 Project Nr: 265178Project start date: 01 Feb 2011 Acronym: GeoViQua Project title: QUAlity aware VIsualisation for the Global Earth Observation system of systems Theme: ENV.2010.4.1.2‐2 Theme title: Integrating new data visualisation approaches of earth Systems into GEOSS development
20
Figure 11: CREAF WMS‐Q client
Figure 12: Greendland WMS‐Q client
KML‐Q services
This implementation of KML‐Q is a service that conforms to the OGC WMS‐Q standard. It is based on the
CityServer3D technology developed by Fraunhofer IGD (http://www.cityserver3d.de). The KML emitted
contains machine‐processible quality information as well as quality visualization. An extrusion and a shaded
colour palette indicating category and quality have been implemented. The KML‐Q features are exposed as
styles. This component can be found here: http://kml‐q.geoviqua.org:8081/cs3d/Controller?do=wsc.
FP7 Project Nr: 265178Project start date: 01 Feb 2011 Acronym: GeoViQua Project title: QUAlity aware VIsualisation for the Global Earth Observation system of systems Theme: ENV.2010.4.1.2‐2 Theme title: Integrating new data visualisation approaches of earth Systems into GEOSS development
21
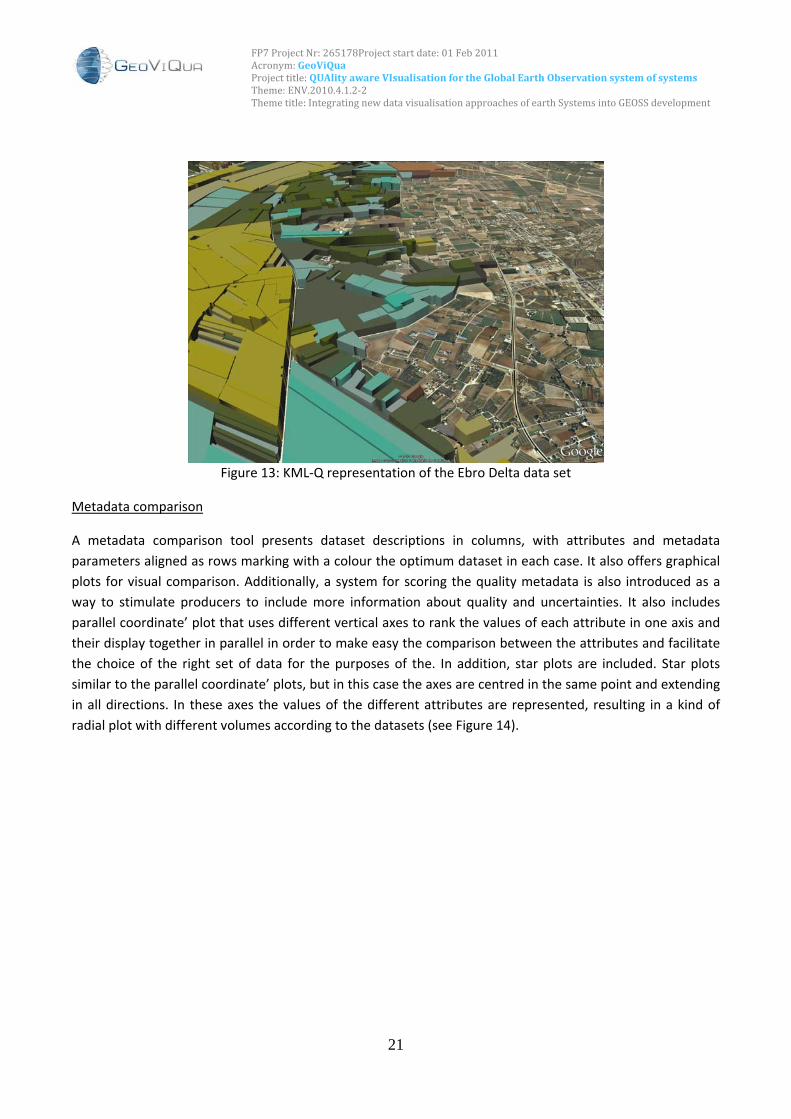
Figure 13: KML‐Q representation of the Ebro Delta data set
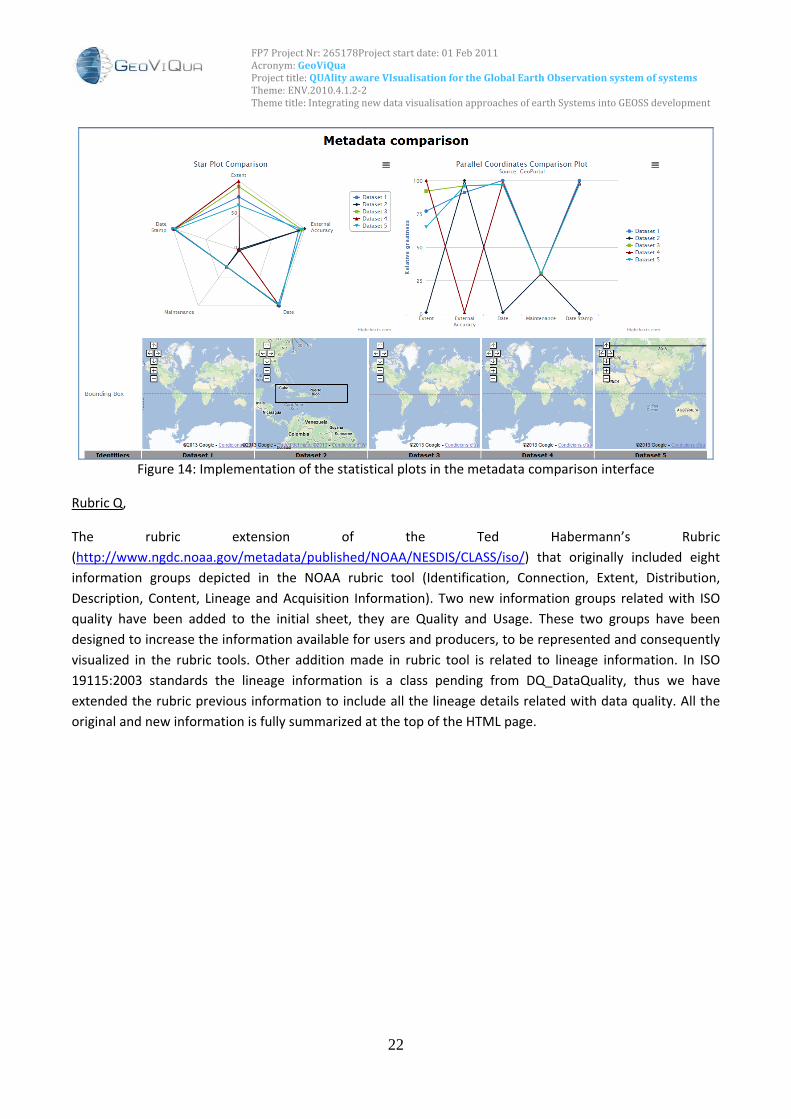
Metadata comparison
A metadata comparison tool presents dataset descriptions in columns, with attributes and metadata
parameters aligned as rows marking with a colour the optimum dataset in each case. It also offers graphical
plots for visual comparison. Additionally, a system for scoring the quality metadata is also introduced as a
way to stimulate producers to include more information about quality and uncertainties. It also includes
parallel coordinate’ plot that uses different vertical axes to rank the values of each attribute in one axis and
their display together in parallel in order to make easy the comparison between the attributes and facilitate
the choice of the right set of data for the purposes of the. In addition, star plots are included. Star plots
similar to the parallel coordinate’ plots, but in this case the axes are centred in the same point and extending
in all directions. In these axes the values of the different attributes are represented, resulting in a kind of
radial plot with different volumes according to the datasets (see Figure 14).
FP7 Project Nr: 265178Project start date: 01 Feb 2011 Acronym: GeoViQua Project title: QUAlity aware VIsualisation for the Global Earth Observation system of systems Theme: ENV.2010.4.1.2‐2 Theme title: Integrating new data visualisation approaches of earth Systems into GEOSS development
22
Figure 14: Implementation of the statistical plots in the metadata comparison interface
Rubric Q,
The rubric extension of the Ted Habermann’s Rubric
(http://www.ngdc.noaa.gov/metadata/published/NOAA/NESDIS/CLASS/iso/) that originally included eight
information groups depicted in the NOAA rubric tool (Identification, Connection, Extent, Distribution,
Description, Content, Lineage and Acquisition Information). Two new information groups related with ISO
quality have been added to the initial sheet, they are Quality and Usage. These two groups have been
designed to increase the information available for users and producers, to be represented and consequently
visualized in the rubric tools. Other addition made in rubric tool is related to lineage information. In ISO
19115:2003 standards the lineage information is a class pending from DQ_DataQuality, thus we have
extended the rubric previous information to include all the lineage details related with data quality. All the
original and new information is fully summarized at the top of the HTML page.

FP7 Project Nr: 265178Project start date: 01 Feb 2011 Acronym: GeoViQua Project title: QUAlity aware VIsualisation for the Global Earth Observation system of systems Theme: ENV.2010.4.1.2‐2 Theme title: Integrating new data visualisation approaches of earth Systems into GEOSS development
23
Figure 15: Rubric tool quality extension
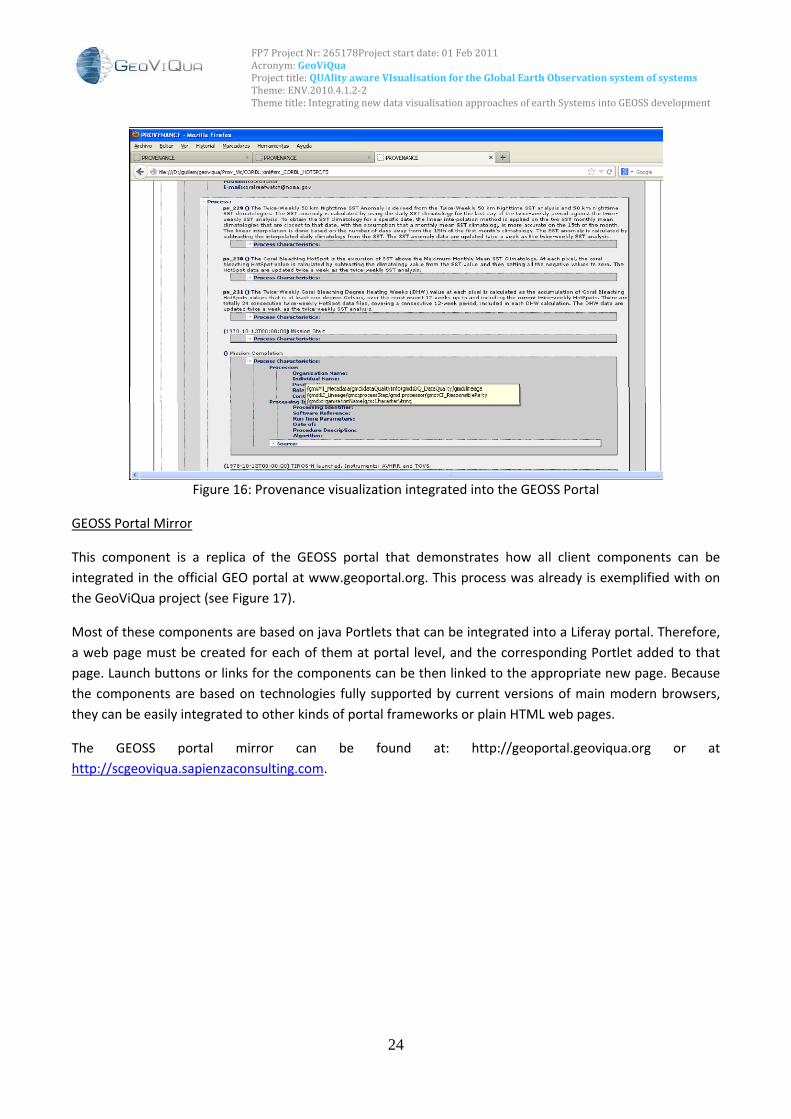
Provenance viewer:
The Provenance component provides a detailed visualization of the documented description of processes
used to obtain the data on its current state. The processes and source data used on each step are related
using hypertext links, and buttons to collapse the information presented.
In the GeoViQua Geoportal mirror the solution has been reusing the selection boxes required for the
metadata comparison component, adding a global button in the search page to launch the Provenance
component (see Figure 16). This component is also based on a XSL transformation of the XML metadata files
to HTML.
FP7 Project Nr: 265178Project start date: 01 Feb 2011 Acronym: GeoViQua Project title: QUAlity aware VIsualisation for the Global Earth Observation system of systems Theme: ENV.2010.4.1.2‐2 Theme title: Integrating new data visualisation approaches of earth Systems into GEOSS development
24
Figure 16: Provenance visualization integrated into the GEOSS Portal
GEOSS Portal Mirror
This component is a replica of the GEOSS portal that demonstrates how all client components can be
integrated in the official GEO portal at www.geoportal.org. This process was already is exemplified with on
the GeoViQua project (see Figure 17).
Most of these components are based on java Portlets that can be integrated into a Liferay portal. Therefore,
a web page must be created for each of them at portal level, and the corresponding Portlet added to that
page. Launch buttons or links for the components can be then linked to the appropriate new page. Because
the components are based on technologies fully supported by current versions of main modern browsers,
they can be easily integrated to other kinds of portal frameworks or plain HTML web pages.
The GEOSS portal mirror can be found at: http://geoportal.geoviqua.org or at
http://scgeoviqua.sapienzaconsulting.com.

FP7 Project Nr: 265178Project start date: 01 Feb 2011 Acronym: GeoViQua Project title: QUAlity aware VIsualisation for the Global Earth Observation system of systems Theme: ENV.2010.4.1.2‐2 Theme title: Integrating new data visualisation approaches of earth Systems into GEOSS development
25
Figure 17: Multiple selection of entries and compare metadata launch button.
4.1.3.4 Components Documentation The project compiled a lot of documentation about the components and standards used. Some of this
documentation was collected in the public deliverables that are available in the project website and in the
CEN projects results repository. Here we emphasise on some extra resources that will be able after the
project.
GEO label services demo
The url http://www.geolabel.net contains documentation an examples on how to use the GEO label API.
The url https://github.com/igd‐geo/pcolor contains information about how to use the colour schemas used
in the KML‐Q, implementation.
The url https://github.com/GeoViQua/geoviqua‐geonetwork‐plugin contains information and the
GeoNetwork plugin to store information using the GeoViQua producer quality model in GeoNetwork.
–

FP7 Project Nr: 265178Project start date: 01 Feb 2011 Acronym: GeoViQua Project title: QUAlity aware VIsualisation for the Global Earth Observation system of systems Theme: ENV.2010.4.1.2‐2 Theme title: Integrating new data visualisation approaches of earth Systems into GEOSS development
26
All the GeoViQua schemas for the producer and user quality model are available at
http://schemas.geoviqua.org
The extended QualityML vocabulary developed based on the UncertML and some clues on how to use
QualityML and UncertML for feature level and pixel level quality can be found here:
http://qualityml.geoviqua.org
Figure 18: GeoViQua QualityML website
Tutorials on how to use the Producer Quality model in the GeoNetwork implementation, how to input user feedback for a dataset, how to use the GEO label API and how to publish a WMS‐Q service can be found here: http://tutorial.geoviqua.org. The tutorial is not just a collection of documents to read but contains interactive exercises allowing readers e.g. to create metadata documents in a GeoNetwork catalogue, introduce new feedback items in the feedback database and create their own GEO labels based on their own metadata. This tutorial was shown by the first time in the INSPIRE Conference 2013 in Florence.

FP7 Project Nr: 265178Project start date: 01 Feb 2011 Acronym: GeoViQua Project title: QUAlity aware VIsualisation for the Global Earth Observation system of systems Theme: ENV.2010.4.1.2‐2 Theme title: Integrating new data visualisation approaches of earth Systems into GEOSS development
27
Figure 19: GeoViQua tutorials first page.
Data Quality Tutorial for GEOSS Providers
This tutorial is published as a documentation resource for the Global Earth Observation System of Systems
(GEOSS). The purpose of this tutorial is to assist the GEOSS providers and GEOSS users in understanding the
various ways in which GEOSS can be used to provide and use Earth observation data and services. The
contents of this tutorial are provided free of any intellectual property rights and offered into the public
domain for the common good.
This tutorial can be found directly at the GEOSS Best Practices Wiki (BPW) (http://wiki.ieee‐earth.org). It can
also be found indirectly via a search at the Geo Web Portal (GWP)(http://www.geoportal.org). If registered
at the BPW, and logged in, a reader of this tutorial can submit comments on each page of the tutorial. These
comments can serve to point out ways in which this tutorial can be improved upon.
More information:
http://wiki.ieee‐
earth.org/Documents/GEOSS_Tutorials/GEOSS_Provider_Tutorials/Data_Quality_Tutorial_for_GEOSS_Provi
ders
4.1.4 Potential impact GeoViQua main impact is the significantly contribution to integrate quality‐aware visualisation of Earth
Observation systems into GEOSS developments (in particular, make progress on the GEOSS Common
Infrastructure) at the European and international level, bringing together key partners from academia,
industry and the broader scientific community.
In particular, GeoViQua has provided consistent, high quality specifications, protocols and components
allowing scientists and decision makers to access easily to a range of EO information including complete,
flexible quality information. GeoViQua components and services have been made available for the GCI to
FP7 Project Nr: 265178Project start date: 01 Feb 2011 Acronym: GeoViQua Project title: QUAlity aware VIsualisation for the Global Earth Observation system of systems Theme: ENV.2010.4.1.2‐2 Theme title: Integrating new data visualisation approaches of earth Systems into GEOSS development
28
incorporate, complemented by GEOSS Portal enhanced visualisation technologies, which also communicate
data quality.
GeoViQua has provided a range of tools and components to allow users seeking data/imagery and
associated quality indicators to access the information through modern visualisation environments via the
GEO Portal. Particular emphasis has been done on intuitive and easy‐to‐use tools, providing components,
which enable data providers and users to derive, attach and mine quality indicators for existing datasets
using both classical CAL/VAL quality indicators and user opinions. GeoViQua has also provided components
integrated in the DAB to allow the discovery of data (using quality indicators in the search process) and
components to allow easy visualisation of the resulting data and its reliability in modern 2D and 3D
visualisation settings. All this components has been demonstrated and need to be moved into the IIB and the
IDB Boards to be included in the future GEOSS Common Infrastructure revision. GeoViQua will continue
working with this boards find ways to include these components. In the server side, CNR will continue
moving these aspects forward. In the client side, client side, ESA is looking on ways (and funding) to move
client components from the GEOSS portal mirror into the operation one.
GeoViQua in working to maximize the impact of its components with the following actions
Components list is published in the GeoViQua website
Components are published in the Components and Services Registry
Most of the components are available as open source and have a Github page. Examples of this are
the user feedback system, the GEO label API, the colour schemas used in KML‐Q, etc.
Tutorials of some of the components have been published in the internet.
Components has been integrated and demonstrated in the GEO‐X Plenary.
Some components that require services are hosted on services that will live after the end of the
project. This is particularly true for the
Some components were developed by SME’s. In particular, S&T Corp can support the deployment of
an operational user feedback system or the intercomparison module. In the same way, 52North can
support the deployment of client components and the GEO label in GEOSS and in other systems.
Some of the developed components will be included in the new versions of the MiraMon software.
Participation in GEO boards, components and in Communities of Practice (CoP) workshops has been
facilitated by CEA in the Global Carbon Project and ESA in the industry (such as CEOS Working Group on
Calibration and Validation, QA4EO and the European Association of Remote Sensing Companies [EARSC]) and
the European Commission representation in GEO. Thanks to this collaboration, GeoViQua has leaded a
strategy for the implementation of the GEO Label. This was based on adding richer structured quality
indicators to datasets, together with considerations about how to convey trust to users that will contribute
to the development and ‘brand identity’ of a GEO dataset. We are continuously pushing for the GEO label
idea in as many forums as possible including IEEE standardization process. GeoViQua has engaged with key
bodies (QA4EO, DDQ, CEOS, OGC) and user communities in the EO domain. Through the project outcomes

FP7 Project Nr: 265178Project start date: 01 Feb 2011 Acronym: GeoViQua Project title: QUAlity aware VIsualisation for the Global Earth Observation system of systems Theme: ENV.2010.4.1.2‐2 Theme title: Integrating new data visualisation approaches of earth Systems into GEOSS development
29
and the sustainable dissemination strategy GeoViQua has achieved a long lasting impact on both data
providers and consumers, providing tools and a framework for easily discovering, accessing and visualising
EO data and associated quality information.
ESA provided through the Sapienza Consulting subcontracting a Virtual Machine of the GeoPortal. This is a
replica of the GeoPortal and was used to test developments in the project and make sure that the
developments were done in the same web technology that the GeoPortal uses so it that can be immediately
incorporated on them one validated by ESA and GEO.
In terms of direct impact within GEO tasks, GeoViQua has had considerable impact, as follows:
GeoViQua outputs and recommendations has included QA4EO implementation to GEOSS, has
impacted the way QA4EO and DDQ addresses the requirements for data registration to GEO, has
contributed to the dissemination of QA4EO implementation.
GeoViQua quality model and concept has been included in the DDQ best practice document.
GeoViQua tutorial has been developed for the Best practice wiki and SIF is constantly helping in the
process of pushing GeoViQua components into the operation phase.
ID‐01 “Advancing GEOSS Data Sharing Principles”: GeoViQua has contributed to the development of
working data sharing policies and procedures for GEOSS by ensuring data access for capacity
building;
ID‐03 “Science and Technology in GEOSS”: involving the scientific community to collaborate within
GEO to address interactions between the components of the global integrated Earth system, and
connect natural and socioeconomic sciences, GeoViQua is highly relevant to this task’s target of
“engaging the research community in GEOSS to achieve breakthroughs in the understanding of the
Earth’s changing environment and global integrated Earth system”.
IN‐03 “GEOSS Common Infrastructure”: GeoViQua has contributed to the GEOSS Best Practices
Registry with best practices deliveries;
EC‐01 “Global Ecosystem Monitoring”: GeoViQua has helped to create a globally agreed global
classification scheme for ecosystems covering terrestrial, freshwater, and ocean ecosystems. In
particular project’s achievements have contributed to ease the integration of newly available global
ecosystems product with existing ecosystem maps and databases. Therefore support ecosystem
(GEO Trends Analysis Network) regarding conservation (habitat loss, degradation, increase of
invasive species…) which are some of the main objectives of the LandPC pilot case study. Finally
GeoViQua has also supported biodiversity GEOBON monitoring approaches;
CL‐01‐C1 “Extension and Improvement of the Climate Record”. Climate reanalysis efforts require
observations to be provided with quality and uncertainty parameters. The consortium (particularly
UREAD) had take advantage of existing close links with ECMWF to ensure that GeoViQua
developments were useful to this community;
FP7 Project Nr: 265178Project start date: 01 Feb 2011 Acronym: GeoViQua Project title: QUAlity aware VIsualisation for the Global Earth Observation system of systems Theme: ENV.2010.4.1.2‐2 Theme title: Integrating new data visualisation approaches of earth Systems into GEOSS development
30
To demonstrate the impact, and further motivate the usage of GeoViQua solutions a series of pilot case
studies which had been carefully selected have illustrated the usage of the standards, protocols and tools in
a real world setting. These pilot case studies were the key to bridge a powerful link between S&T and daily
needs of CoP, other activities from GEO and geodata users in general. Thanks to GeoViQua, science and
management related to agriculture, climate, fishery, land cover, carbon cycle and air quality have newest
resources and quality data. These pilot cases have demonstrated the usability of the GeoViQua solutions and
will help to promote their uptake.
GeoViQua team has made some efforts to get more funding to continue GeoViQua work. The more
successful of these attempts was the CHARMe project that aims to allow users to view or create annotations
that describe how climate data has been used and what has been learned. This information can include
Citations that reference a particular dataset, results of assessments ‐ reanalysis, quantitative error
assessments, provenance ‐ processing algorithms and chain data source, external events that may affect the
data ‐ volcanic eruptions, El Nino, sensor failure; supplementary dataset quality information ‐ maturity,
discontinuity, updates. Some of these items were already addressed by the GeoViQua model. The
coordinator of CharMe is the University of Reading that at the same time is partner in GeoViQua. The
intentions of the University of Reading and the coordinator, Jon Blower, are to take advantage and use of
the GeoViQua developments and continue in the same direction extending the GeoViQua model when
needed. Some partners in the GeoViQua team are also targeting other opportunities in the new Horizon
2020 call.
Meanwhile, GeoViQua results are expected to be used in other active projects such as GEOWOW, and
COBWeb. GEOWOW is a project, co‐funded under the European Community's Seventh Framework
Programme in response to call ENV.2011.4.1.3‐1 “Interoperable integration of Shared Earth Observations in
the Global Context”. It is implemented by a consortium of 15 partners from Europe, Brazil and Japan and is
coordinated by the Italian establishment of the European Space Agency (ESA‐ESRIN) in Frascati. GEOWOW
benefited by the advances and solutions that GeoViQua proposed on data quality search and visualization.
Quality‐aware search functionality, user‐rating capability following the web 2.0 trend, metadata standards
enhancements, low bandwidth and quality visualisation techniques are a few of GeoViQua’s objectives that
were considered for in the forthcoming architectural design of GEOWOW. The collaboration between the
two projects was possible by the participation in the AIP initiatives where GeoViQua regularly introduced
and share its components and results, especially regarding the Unique and Universal identifier for the GEOSS
tutorial; or by direct communication. On the other hand, COBWeb brings together expertise from 13
partners and 5 countries. The main context for the project is the Global Earth Observation System of Systems
(GEOSS) and the UNESCO World Network of Biosphere Reserves (WNBR). Concentrating on Biosphere
Reserves in Wales, Germany and Greece, the main aim is to create a testbed environment which will enable
citizens living within Biosphere Reserves to collect environmental data using mobile devices. Information of
use for policy formation and delivery will be generated by quality controlling the crowdsourced data and
aggregating with Spatial Data Infrastructure (SDI) type reference data from authoritative sources. In the
process the project aims to build up shared expertise in these new and developing technologies and
understand how crowdsourcing/citizen science techniques combined with SDI‐like initiatives can deliver
both societal and commercial benefits. Chris Higgins, the COBWeb coordinator, offered the possibility to
organize one of the project meetings in the in EDINA facilities in Edinburgh, September 9th and 10th. The
meeting was co‐located with a COBWEB project meeting in a way that project members of both projects

FP7 Project Nr: 265178Project start date: 01 Feb 2011 Acronym: GeoViQua Project title: QUAlity aware VIsualisation for the Global Earth Observation system of systems Theme: ENV.2010.4.1.2‐2 Theme title: Integrating new data visualisation approaches of earth Systems into GEOSS development
31
could talk during the coffee and lunch breaks. In the afternoon of both days, both project meet together and
exchange presentations. In the first afternoon, the presentations where focused on CobWeb activities and
needs. In second afternoon, GeoViQua partners presented what GeoViQua could offer to CobWeb. These are
the agendas of both meeting parts. In a more generic GeoViQua was present in the last previous editions of
the GEOSS European projects workshop, GEPW‐5 (London) and in GEPW‐6 (Rome), and The European
Commission and the GeoViQua coordinator team organized the last GEPW‐7 in Barcelona on 15‐16th April
2013. GeoViQua is well known in the GEOSS European community.
Another important impact is the efforts in the standardization process that has been described in the
previous section both with the OGC and the IEEE. The consortium as a whole has assumed the responsibility
to support these standardization activities in the near future. Some of these efforts will continue in the near
future. Additionally, GeoViQua has collaborated with the CEN (European Committee for Standardization) in a
formal way by signing a Memorandum of Understanding. GeoViQua applied for “project liaison” with
CEN/TC 287 "Geographic information". We strongly believed that by joining forces in this Pan‐European
forum, GeoViQua Project efforts to create practical and effective standards will benefit both the industry and
the user. As we have exposed, GeoViQua deliverables and outcomes will be registered in the CEN repository.
Also, GeoViQua has participated in the standardization groups for ISO 19115‐1 and 19157 in ISO/TC 211
meetings Toulouse and Delft. Some of this comment were considered and influenced the recently approved
19115‐1 and 19157.
The GeoViQua team members that are in the academic and research sector will continue working on the
release of new scientific publications as a continuation of the ones already published and exposed in the
previous section. The GeoViQua team estimated in its final meeting that the possible paper number that are
potentially publishable in highly indexed publications is around 8.
4.1.5 Address of the project public website For further information and access to all project documentation and reports, please see www.geoviqua.org.
For further information, contact Joan Masó, CREAF, [email protected].
Several other important URLs to get more information about this project has been provided all over the
document.
GeoViQua partner name Acronym
Centre de Recerca Ecologica i Aplicacions Forestals CREAF
Universitat Autònoma de Barcelona UAB
52°North Initiative for Geospatial Open Source Software Gmbh 52N
Fraunhofer‐Gesellschaft zur Foerderung der Angewandten Forschung E.V. Fraunhofer
Consiglio Nazionale delle Ricerche CNR
Aston University AST
The University of Reading UREAD

FP7 Project Nr: 265178Project start date: 01 Feb 2011 Acronym: GeoViQua Project title: QUAlity aware VIsualisation for the Global Earth Observation system of systems Theme: ENV.2010.4.1.2‐2 Theme title: Integrating new data visualisation approaches of earth Systems into GEOSS development
32
Commissariat A L Energie Atomique Et Aux Energies Alternatives CEA
European Space Agency ESA
Science and Technology B.V S&T
Open Geospatial Consortium (Europe) Limited OGCE


