
This document and other Information Services documents are held online on our
website: https://staff.brighton.ac.uk/is/training/Pages/Home.aspx
Project planning with
MindGenius
This workshop looks at using MindGenius for planning and
monitoring smaller projects.
This document uses MindGenius v6.
MindGenius is available free of charge on all University of Brighton
staff and student PCs, as well as being free to staff and students for
home use, making it a cost-effective tool for project planning where
Microsoft Project is not available.
(It is also a much better tool than Excel for producing Gantt charts).
This document
assumes you already
have a basic
understanding of
project management
Last updated
Faye Brockwell
June 2017

University of Brighton Information Services
Page | 2 last update June 2017
Contents
Workshop requirements ................................................................................... 4
Project management ................................................................................. 4
Gantt charts .............................................................................................. 4
Files required for this workshop ................................................................ 4
System and software ................................................................................ 4
1.4.1 MindGenius 6..................................................................................... 4
1.4.2 Microsoft Outlook (optional) ............................................................... 5
1.4.3 Microsoft Project (optional) ................................................................ 5
1.4.4 Microsoft Word (optional) ................................................................... 5
Introduction ...................................................................................................... 6
The Screen Layout ........................................................................................... 7
Create a New Map ........................................................................................... 8
Creating a New Mind Map ......................................................................... 8
Saving a Mind Map your computer ............................................................ 8
Saving a Mind Map to SharePoint ............................................................. 9
Editing a MindGenius file saved on SharePoint ......................................... 9
Adding and Editing Branches ..........................................................................10
Brainstorming ...........................................................................................10
Adding branches ......................................................................................10
Editing branches ......................................................................................11
Moving branches of a map .......................................................................12
Deleting branches of a map .....................................................................13
Building the project plan in Gantt view ............................................................14
Switching to Gantt view ............................................................................14
Switching back to map view .....................................................................14
Adding tasks in Gantt view .......................................................................15
6.3.1 Indenting and outdenting tasks .........................................................15
6.3.2 Changing the order of tasks ..............................................................16
6.3.3 Deleting tasks in Gantt view ..............................................................16
Setting the project options ........................................................................16

Printed Tuesday, 06 June 2017 Page | 3
Links and dependencies .......................................................................... 17
Task duration .......................................................................................... 18
Timeline scale ......................................................................................... 18
Start and finish dates ............................................................................... 19
Moving the dates for the entire project .................................................... 19
Milestones ............................................................................................... 20
Resources ...................................................................................................... 22
Setting up the resource pool .................................................................... 22
7.1.1 Setting the resource pool up for Outlook integration (staff only) ....... 22
Allocate resources to project tasks .......................................................... 23
7.2.1 Setting resource allocation ............................................................... 24
Checking resource allocation .................................................................. 26
Resource map ......................................................................................... 27
Tracking progress........................................................................................... 28
Marking progress .................................................................................... 28
Overdue tasks ......................................................................................... 29
Viewing the critical path ........................................................................... 30
Using map explorer to focus on one project stage ................................... 30
Adding detail .................................................................................................. 31
Adding notes ........................................................................................... 31
Adding hyperlinks .................................................................................... 32
Adding attachments................................................................................. 32
Printing ....................................................................................................... 33
Project reports ............................................................................................ 33
Create a project timeline in Excel ................................................................ 37
Export to MS Project ................................................................................... 38
Export to MS Excel ..................................................................................... 39
Outlook Tasks to assign and track progress ............................................... 40
Send the tasks to Outlook ....................................................................... 40
Updating tasks in Outlook ....................................................................... 41
Sync the Mind Genius map with Outlook ................................................. 42
University of Brighton Information Services
Page | 4 last update June 2017
Workshop requirements
Project management
This workshop assumes some prior knowledge of project management. This document
explains how the MindGenius software can be used as a project management tool but
does not teach you how to manage a project.
For more information about the project management framework in use at the University
of Brighton, visit the Strategic Planning and Projects Office’s website
https://staff.brighton.ac.uk/spo/projects/Pages/Home.aspx
Gantt charts
This workshop assumes an understanding of what Gantt charts are and how they are
used for project management.
For an overview of what Gantt charts are used for, see the Understanding Gantt
charts video as part of Chris Croft’s Learning Gantt Charts course on Lynda.com (see
https://staff.brighton.ac.uk/is/training/Pages/Mind%20Mapping/mindgenius.aspx for
links)
For more detailed information, you may find the rest of Chris Croft’s Learning Gantt
charts course on Lynda.com useful (note that not all techniques shown in this course
are available in MindGenius)
Files required for this workshop
No exercise files are required for this workshop.
System and software
1.4.1 MindGenius 6
This document uses MindGenius v6.
1.4.1.1 Within the university:
All Windows computers in student pool rooms and teaching rooms have
MindGenius 6 installed.
Any new university Windows computers have MindGenius 6 installed.
Most staff Windows computers have MindGenius installed, but some may have an
older version as the upgrade to MindGenius 6 was not pushed out to computers
automatically.
Project Planning with MindGenius
Page | 5
If you don’t have MindGenius installed on your computer, or you find you have an
old version, all staff can request free installation of this on their university Windows
computer by contacting the Service Desk on 4444.
1.4.1.2 Home installation:
All staff and students can also install Mind Genius 6 on their home windows computers
for free. For more information:
visit https://staff.brighton.ac.uk/is/computing and click on the Software link in the
left-hand menu
click on the Discounted software for staff or Discounted software for students link
on the page
MindGenius is not available for Apple Mac.
1.4.2 Microsoft Outlook (optional)
This is only needed for the section relating to allocating tasks and tracking progress
using Microsoft Outlook.
Microsoft Outlook is available on all university staff Windows computers.
Microsoft Outlook is not available on university student computers.
1.4.3 Microsoft Project (optional)
This is only needed for the section on exporting to Microsoft Project.
Microsoft Project is available for staff but is a chargeable product. Contact the
Computer Store for prices and availability.
1.4.4 Microsoft Word (optional)
This is needed for the creation of Project reports.
University of Brighton Information Services
Page | 6 last update June 2017
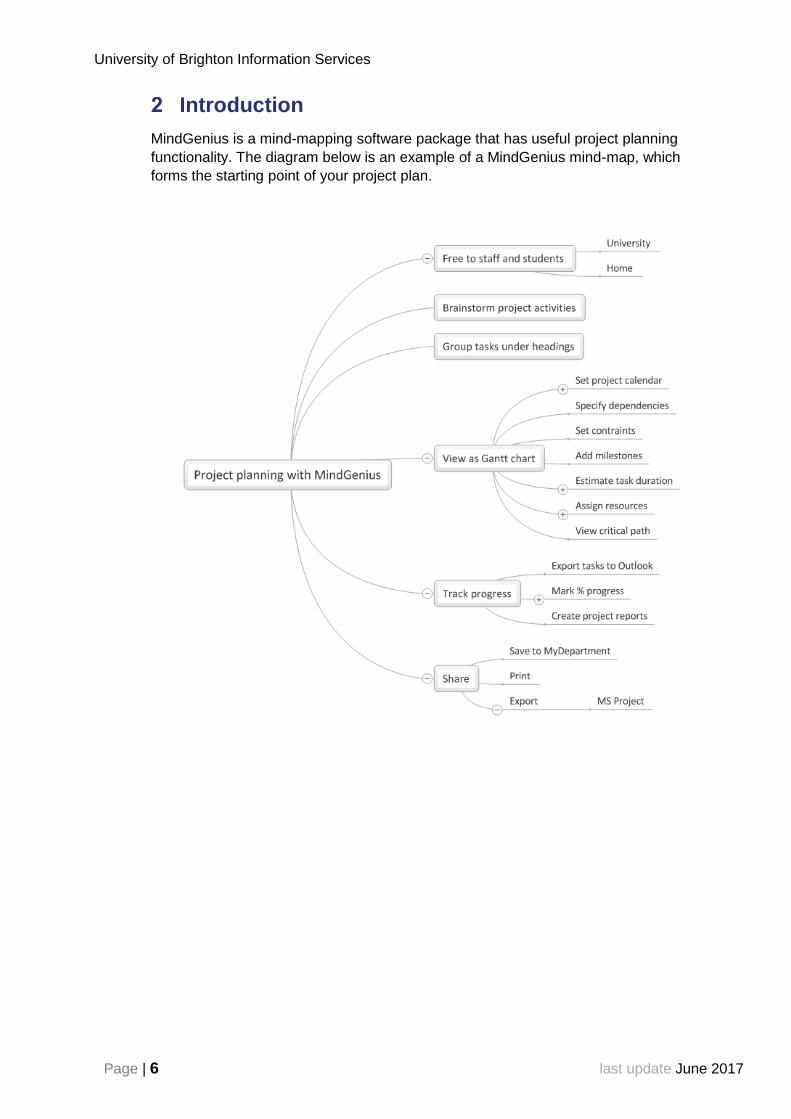
Introduction
MindGenius is a mind-mapping software package that has useful project planning
functionality. The diagram below is an example of a MindGenius mind-map, which
forms the starting point of your project plan.
Project Planning with MindGenius
Page | 7
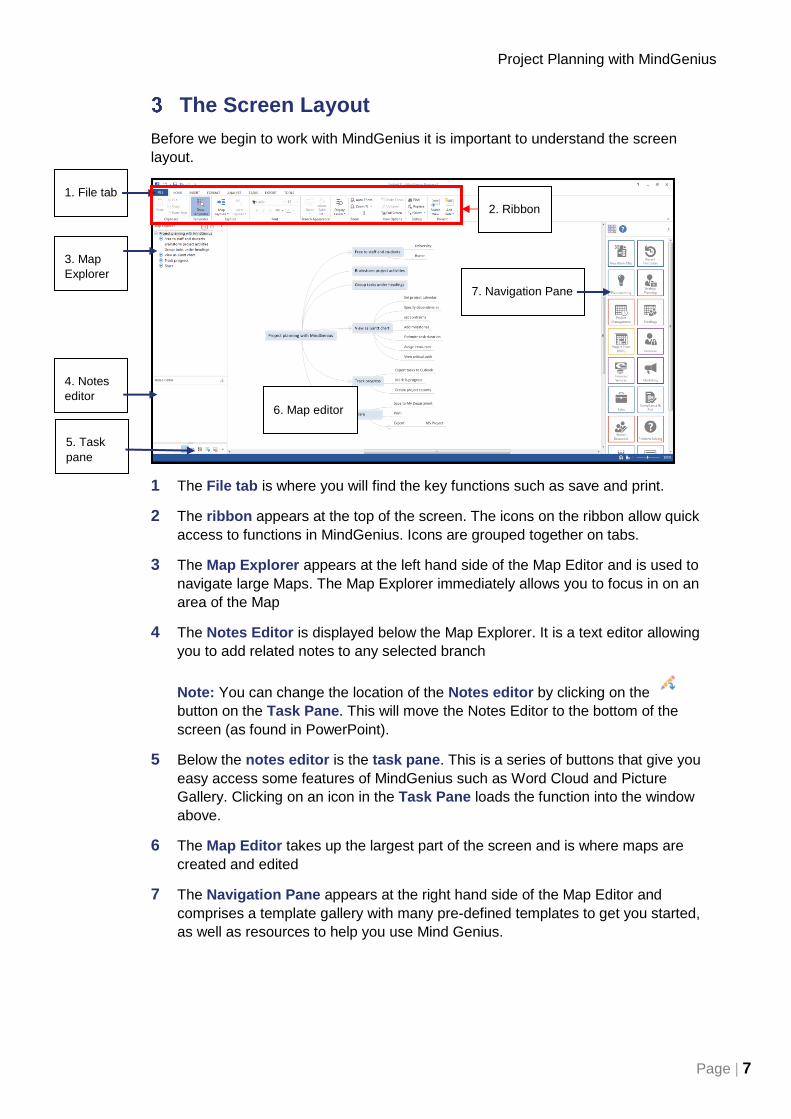
The Screen Layout
Before we begin to work with MindGenius it is important to understand the screen
layout.
1 The File tab is where you will find the key functions such as save and print.
2 The ribbon appears at the top of the screen. The icons on the ribbon allow quick
access to functions in MindGenius. Icons are grouped together on tabs.
3 The Map Explorer appears at the left hand side of the Map Editor and is used to
navigate large Maps. The Map Explorer immediately allows you to focus in on an
area of the Map
4 The Notes Editor is displayed below the Map Explorer. It is a text editor allowing
you to add related notes to any selected branch
Note: You can change the location of the Notes editor by clicking on the
button on the Task Pane. This will move the Notes Editor to the bottom of the
screen (as found in PowerPoint).
5 Below the notes editor is the task pane. This is a series of buttons that give you
easy access some features of MindGenius such as Word Cloud and Picture
Gallery. Clicking on an icon in the Task Pane loads the function into the window
above.
6 The Map Editor takes up the largest part of the screen and is where maps are
created and edited
7 The Navigation Pane appears at the right hand side of the Map Editor and
comprises a template gallery with many pre-defined templates to get you started,
as well as resources to help you use Mind Genius.
1. File tab
2. Ribbon
3. Map
Explorer
4. Notes
editor
5. Task
pane
7. Navigation Pane
6. Map editor
University of Brighton Information Services
Page | 8 last update June 2017
Create a New Map
Let’s start planning our project. We’re going to plan a conference.
Creating a New Mind Map
Open MindGenius from the desktop.
Click on the File tab and click to select New from the menu or click on
New Blank Map in the Navigation Pane.
In the dialogue box type the text for the root branch of your map and click OK.
The Root Branch is the first branch in a map; it describes what the map is about.
Exercise A Create a new mind map
1 Start a new mind map with a title of Staff conference.
Note: Mind Genius loads a welcome map when you launch it. To stop this happening
in future, click on the Show Welcome Map icon on the Tools tab
on the ribbon.
Saving a Mind Map your computer
Click on the File tab and click to select Save from the menu.
Specify a location to save the map.
Staff can save to MyFiles or MyDepartment so that the map can be worked on from
home or shared with colleagues.
Students working on university computers should save the map to a memory stick.
Specify a name for the map and Click on Save.
Exercise B Save your map
1 For this exercise, save your map to your desktop.
Project Planning with MindGenius
Page | 9
Saving a Mind Map to SharePoint
If you have mapped the SharePoint document library to one of your computer’s drives,
you can save your MindGenius file to that document library using the steps above in
section 4.2. It is best then to open the MindGenius file by opening that drive in
Windows Explorer.
If you have not mapped the Sharepoint document library to one of your computer’s
drives you will need to:
Save the MindGenius file to your computer (eg your desktop)
Navigate to the SharePoint document library using a web browser.
Click on Upload to upload the file from your computer to the SharePoint document
library.
See 4.4 below for instructions on how to open a MindGenius file from SharePoint (as
it’s not as easy as you would think).
Editing a MindGenius file saved on SharePoint
MindGenius works with SharePoint, you just need to know a few tricks. One challenge
is that if you are accessing a SharePoint document library using a web browser (as
opposed to a mapped drive) you will be able to edit the MindGenius file but will not be
able to save it back to SharePoint. To avoid this, you should follow the steps below
when opening MindGenius files from SharePoint:
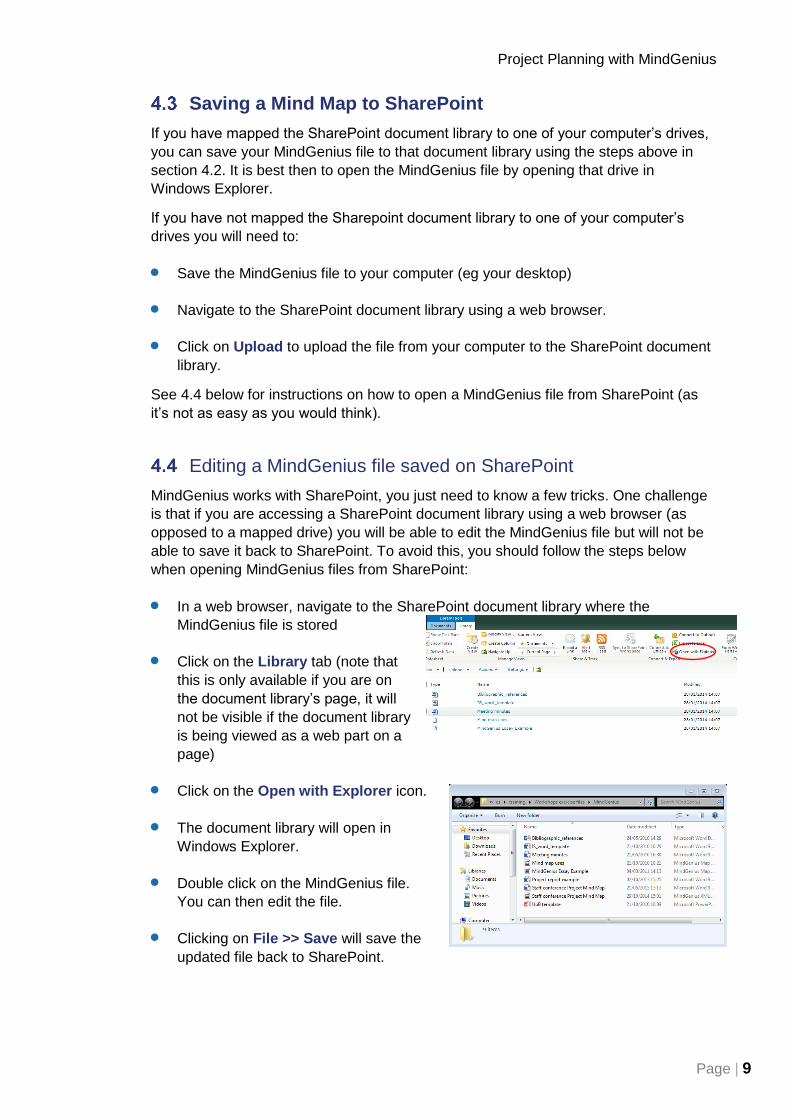
In a web browser, navigate to the SharePoint document library where the
MindGenius file is stored
Click on the Library tab (note that
this is only available if you are on
the document library’s page, it will
not be visible if the document library
is being viewed as a web part on a
page)
Click on the Open with Explorer icon.
The document library will open in
Windows Explorer.
Double click on the MindGenius file.
You can then edit the file.
Clicking on File >> Save will save the
updated file back to SharePoint.
University of Brighton Information Services
Page | 10 last update June 2017
Adding and Editing Branches
Brainstorming
Mind mapping works really well when you get all your ideas down in rapid succession
and then rearrange the map to have structure afterwards. To do this:
Click on the core/higher level branch.
Type an idea and press ENTER.
Type the next idea then press ENTER and so on until you’ve exhausted your
ideas.
When brainstorming, put everything down that comes into your head, without prejudice.
You can always delete ideas that are not relevant when you are finished, rather than
interrupt your flow.
Exercise C Brainstorming ideas
1 Have a go at brainstorming some ideas for the staff conference we’re organising.
Adding branches
You can also add branches in a more structured way when you’re not brainstorming.
To add a new branch:
o click once on the parent branch
o type the text for the new branch
o press the Enter key on your keyboard.
Exercise D Adding branches
Let’s practice that.
1 Single click on the branch Staff conference and then type Catering and then
press the Enter key on your keyboard.
The new branch has been added to the parent branch Staff conference
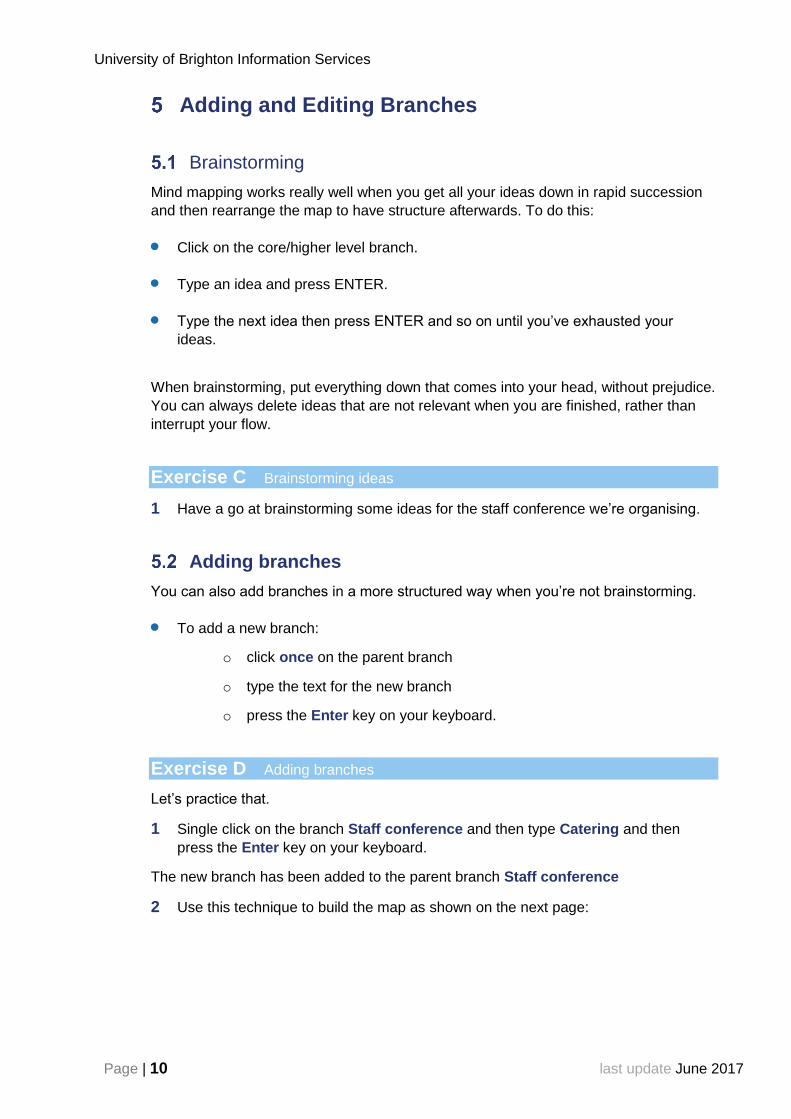
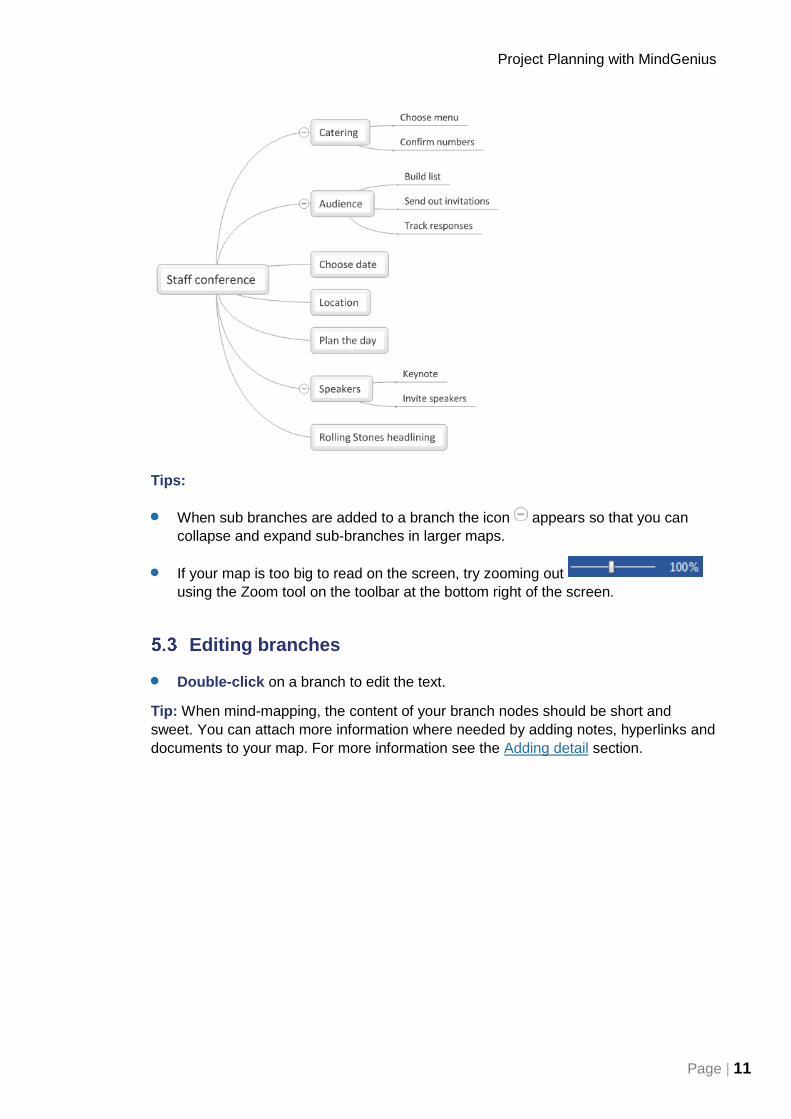
2 Use this technique to build the map as shown on the next page:
Project Planning with MindGenius
Page | 11
Tips:
When sub branches are added to a branch the icon appears so that you can
collapse and expand sub-branches in larger maps.
If your map is too big to read on the screen, try zooming out
using the Zoom tool on the toolbar at the bottom right of the screen.
Editing branches
Double-click on a branch to edit the text.
Tip: When mind-mapping, the content of your branch nodes should be short and
sweet. You can attach more information where needed by adding notes, hyperlinks and
documents to your map. For more information see the Adding detail section.

University of Brighton Information Services
Page | 12 last update June 2017
Moving branches of a map
Now that you’ve got your ideas down, you need to make bring some order to the map
before you create a Gantt chart, namely:
Group similar tasks together
Put groups of task into a rough chronological order
This will make your project plan easier to read in the Gantt chart.
To move a branch, drag and drop with your mouse. The arrows on the screen will
indicate which parent branch you are moving to:
These move a branch to become a sub-branch of the branch the pointer is
over, i.e.in the example on the right it would become a sub-branch of Pitfalls of a Team.
The arrow direction changes depending on the position of the branch.
In this case the branch will be inserted at the same level as of the branch the
pointer is over but above it.
In this case the branch will be inserted at the same level as same level as of the
branch the pointer is over but below it.
The no-entry sign is displayed dropping the branch will have no effect and no move
will take place.

Project Planning with MindGenius
Page | 13
Deleting branches of a map
To delete a branch,
click to select the branch and then press the Delete key on the keyboard.
If the selected branch has branches below it, a pop-up window will appear asking
you to confirm the deletion. Click on Yes.
Exercise E Editing your map
1 Using the techniques above, rearrange your map so that it looks like this:

University of Brighton Information Services
Page | 14 last update June 2017
Building the project plan in Gantt view
Once you have the basic structure of your project tasks, you can add detail to your
project plan in Gantt view (you can add a lot of this detail in the map view too, but for
this workshop we are going to work in Gantt view mostly)
Switching to Gantt view
Click on the Tasks tab on the ribbon and click on the Gantt Chart icon.
When you switch to Gantt view:
All branches in your map will be converted to tasks with a Start Date, End Date and
Duration.
Higher level branches will be made read-only and will show as summary tasks
You can expand the data grid area on the left of the Gantt chart by dragging and
dropping the vertical line between the data grid and the timeline to reveal more
columns.
Switching back to map view
Sometimes it’s good to switch back to the map view –to change the order of tasks, for
instance. To switch back to map view:
On the Gantt tab on the ribbon, click on Map View.
In Map View,
- all summary tasks will be marked with
- tasks will be marked with
- milestones will be marked with
Gantt Timeline Data Grid
Project Planning with MindGenius
Page | 15
To switch back to Gantt view, on the Gantt tab on the ribbon, click on Return to
Gantt
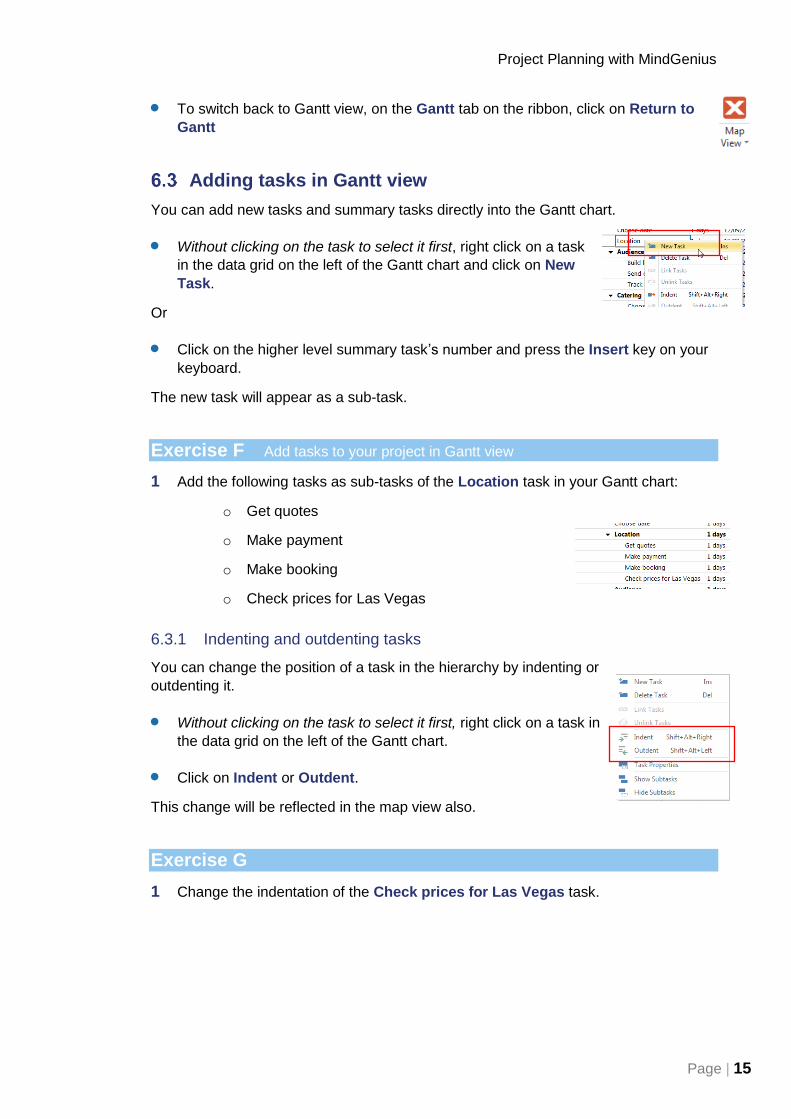
Adding tasks in Gantt view
You can add new tasks and summary tasks directly into the Gantt chart.
Without clicking on the task to select it first, right click on a task
in the data grid on the left of the Gantt chart and click on New
Task.
Or
Click on the higher level summary task’s number and press the Insert key on your
keyboard.
The new task will appear as a sub-task.
Exercise F Add tasks to your project in Gantt view
1 Add the following tasks as sub-tasks of the Location task in your Gantt chart:
o Get quotes
o Make payment
o Make booking
o Check prices for Las Vegas
6.3.1 Indenting and outdenting tasks
You can change the position of a task in the hierarchy by indenting or
outdenting it.
Without clicking on the task to select it first, right click on a task in
the data grid on the left of the Gantt chart.
Click on Indent or Outdent.
This change will be reflected in the map view also.
Exercise G
1 Change the indentation of the Check prices for Las Vegas task.

University of Brighton Information Services
Page | 16 last update June 2017
6.3.2 Changing the order of tasks
Switch to map view.
Drag and drop the branches to the desired location.
Switch back to Gantt view.
Exercise H Change the order of your project tasks
1 Move the Make Payment task so that it comes after the Make Booking task.
6.3.3 Deleting tasks in Gantt view
Without clicking on the task to select it first, right click on a task in the
data grid on the left of the Gantt chart.
Click on Delete Task.
Exercise I Delete a project task
1 Delete the Check prices for Las Vegas from your Gantt chart.
Setting the project options
Use the project options to:
specify the start date of the project – new tasks default to this start date
specify the working days for the project.
To set the project options:
Open the File menu and choose Prepare, and then Map Properties
On the Project Options tab set the project start date as required
Click to select the days to be included in the working week
Use the Add button to add any working exceptions e.g. bank holidays or closure
dates then click OK
Note that the calendar days are set to 09:00-17:00 and it is not possible to change this
in the current version of MindGenius.
Exercise J Set your project calendar
1 Set the project calendar to indicate that Saturday and Sunday are not working
days.

Project Planning with MindGenius
Page | 17
Links and dependencies
You can specify dependencies in your Gantt chart by linking tasks:
On the Gantt timeline, click on a task to select it.
Hold down your mouse pointer
and drag to the dependent task
on the timeline. Your cursor will
change to be
Release your mouse.
The dependency will show in the Predecessors column in the data grid on the left of
the Gantt chart, as shown below (you may need to expand the data grid to display the
Predecessors column).
You can also specify dependencies in the data grid itself by typing the number of the
preceding task directly into the Predecessors column.
The default for dependencies is Finish to Start, i.e. the first task must be completed
before the second task can begin. This is the most commonly used type of
dependency. Your dependent task will be moved on the timeline to begin after the
preceding task.
To change the type of dependency, add one of the following codes after the number in
the Predecessor column:
FS (Finish-to-start - this is the
default)
SS (Start-to-start)
FF (Finish-to-Finish)
SF (Start-to-finish)
Exercise K Set project dependencies
1 In the Gantt chart, let’s indicate that there is a finish to start dependency between
tracking responses to our invitations to the conference and confirming the numbers
to catering (as shown in the diagram at the top of this page).
University of Brighton Information Services
Page | 18 last update June 2017
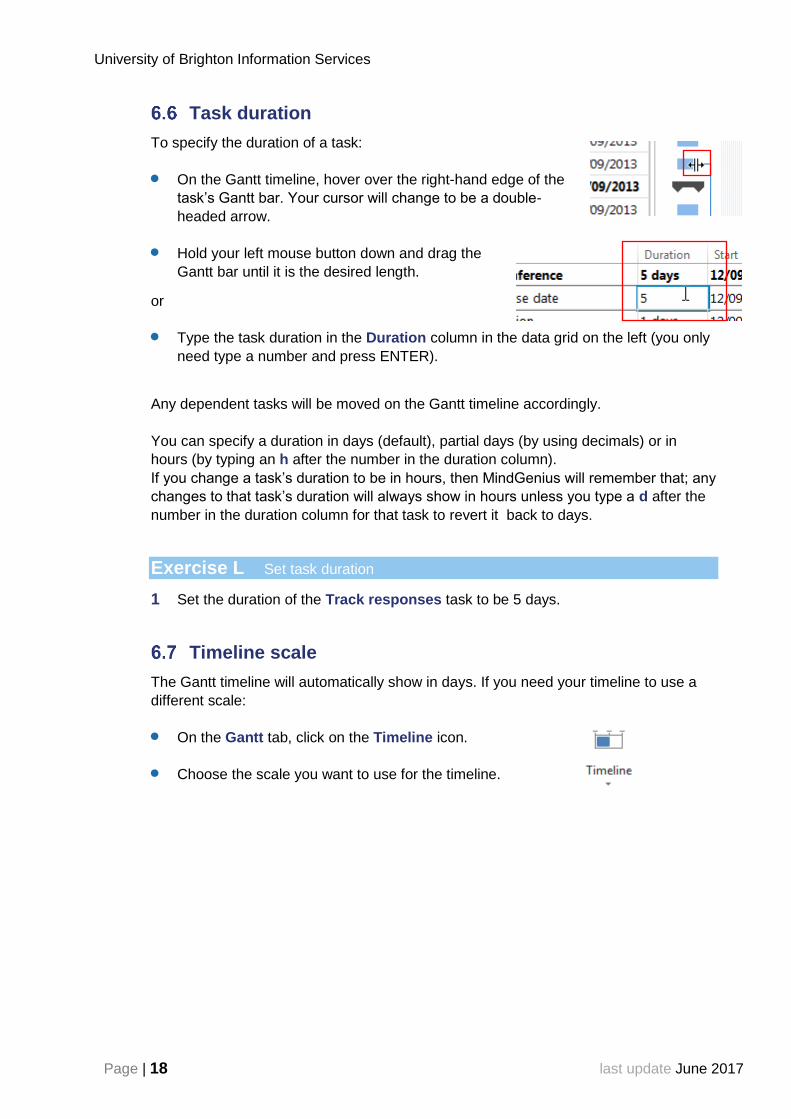
Task duration
To specify the duration of a task:
On the Gantt timeline, hover over the right-hand edge of the
task’s Gantt bar. Your cursor will change to be a double-
headed arrow.
Hold your left mouse button down and drag the
Gantt bar until it is the desired length.
or
Type the task duration in the Duration column in the data grid on the left (you only
need type a number and press ENTER).
Any dependent tasks will be moved on the Gantt timeline accordingly.
You can specify a duration in days (default), partial days (by using decimals) or in
hours (by typing an h after the number in the duration column).
If you change a task’s duration to be in hours, then MindGenius will remember that; any
changes to that task’s duration will always show in hours unless you type a d after the
number in the duration column for that task to revert it back to days.
Exercise L Set task duration
1 Set the duration of the Track responses task to be 5 days.
Timeline scale
The Gantt timeline will automatically show in days. If you need your timeline to use a
different scale:
On the Gantt tab, click on the Timeline icon.
Choose the scale you want to use for the timeline.

Project Planning with MindGenius
Page | 19
Start and finish dates
To specify start and/or finish dates for a task:
On the Gantt timeline, hover over the centre of the task’s Gantt bar.
Your cursor will change to be a rectangle.
Hold your left mouse and drag until the Gantt bar is in the desired
position.
or
Overtype the task Start or Finish dates* in the data grid on the
left (type a date in dd/mm/yy format and press ENTER).
Any dependent tasks will be moved on the Gantt timeline
accordingly.
*In MindGenius, the task duration drives the start and finish date and not vice-versa.
That is to say, you cannot update the task duration by changing the start and finish
dates. Rather, if you change the start or finish date, MindGenius will automatically
update the other date according to the specified task duration.
Exercise M Edit start and finish dates
1 Move the Track responses task so that it starts on the first Monday after the start
of your project.
2 Now move the Track responses task so that it starts on the first Wednesday after
the start of your project.
Note that the task’s bar on the Gantt timeline has grown. This is because our
Project Calendar specifies that weekends are not working days.
Moving the dates for the entire project
If you need to change the overall start date for the entire project,
On the Gantt timeline, drag and drop the black task bar for the highest level
summary task.
University of Brighton Information Services
Page | 20 last update June 2017
Exercise N Change the dates for your entire project
1 Shift your project to start in December.
2 Shift your project to start last week.
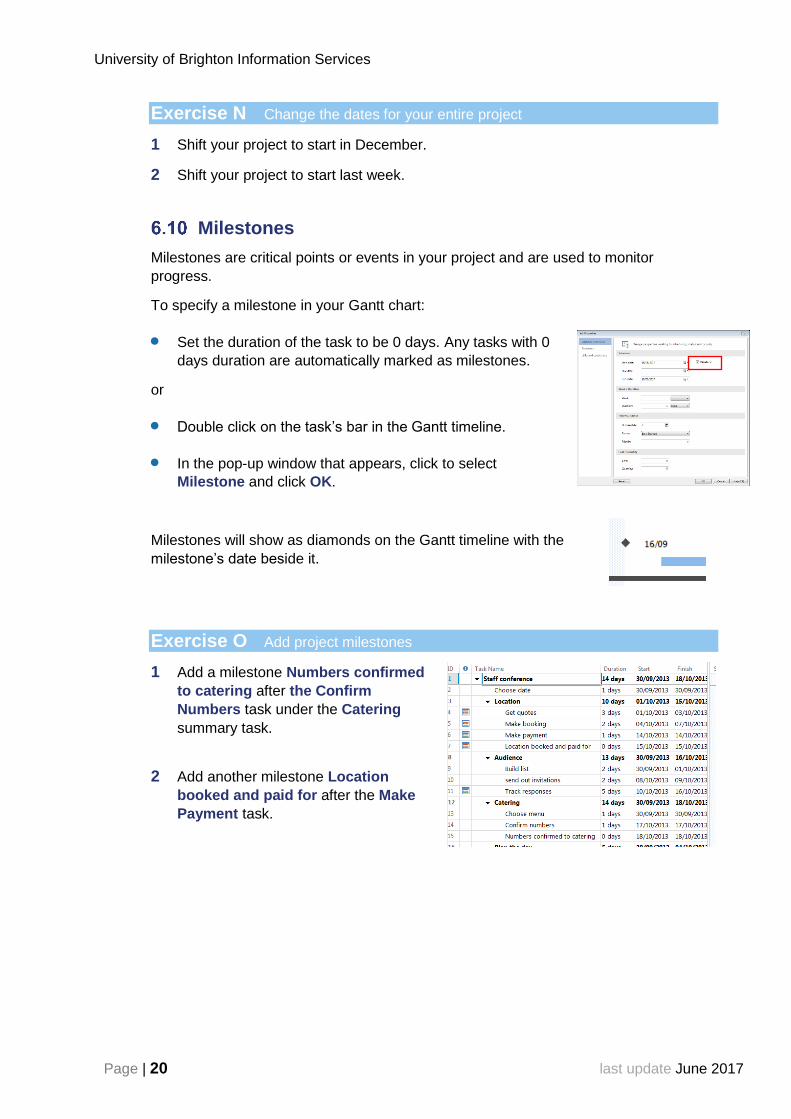
Milestones
Milestones are critical points or events in your project and are used to monitor
progress.
To specify a milestone in your Gantt chart:
Set the duration of the task to be 0 days. Any tasks with 0
days duration are automatically marked as milestones.
or
Double click on the task’s bar in the Gantt timeline.
In the pop-up window that appears, click to select
Milestone and click OK.
Milestones will show as diamonds on the Gantt timeline with the
milestone’s date beside it.
Exercise O Add project milestones
1 Add a milestone Numbers confirmed
to catering after the Confirm
Numbers task under the Catering
summary task.
2 Add another milestone Location
booked and paid for after the Make
Payment task.

Project Planning with MindGenius
Page | 21
Exercise P Practice
Using the diagram below as a guide, use the techniques we’ve used thus far to edit your Gantt chart (note that your dates will be different).

University of Brighton Information Services
Page | 22 last update June 2017
Resources
Resources are used to indicate who is assigned to each project task. This also allows
you to check resource allocation.
If you are using Microsoft Outlook, you can also assign tasks to people via Outlook
(university staff only).
Setting up the resource pool
The resource pool is the list of people working on your project. To set up the list:
On the Gantt tab on the ribbon, click on Resources.
Click on Manage Resources.
Type the names of your resources in the Quick add
box, separated by a comma as shown on the right.
Click on the Add button and your resources will be
added to the list.
Exercise Q Create your resources pool
1 Add Betsy Baker, Paul Young, Faye Dunaway and Jill Skill as resources for your
project.
Note: If you want to delete the pre-defined resources, click to select them and click on
Delete.
Note: the resources created will also be available for any new maps you create. If you
work with the same team you will not have to repeatedly create them.
7.1.1 Setting the resource pool up for Outlook integration (staff only)
If you want to use Microsoft Outlook for task assignment and tracking, you will need to
specify the email address for each resource (note that this only works for resources
within the university and is only available to university staff):
Double click on the resource in your resource list.
Type the email address in the E-mail field (and
complete any other fields you want to complete)
To move to the next resource in your list, click on the
arrow keys.
Click on OK and then OK again when you have
finished..
University
staff only!
Project planning with MindGenius
Page | 23
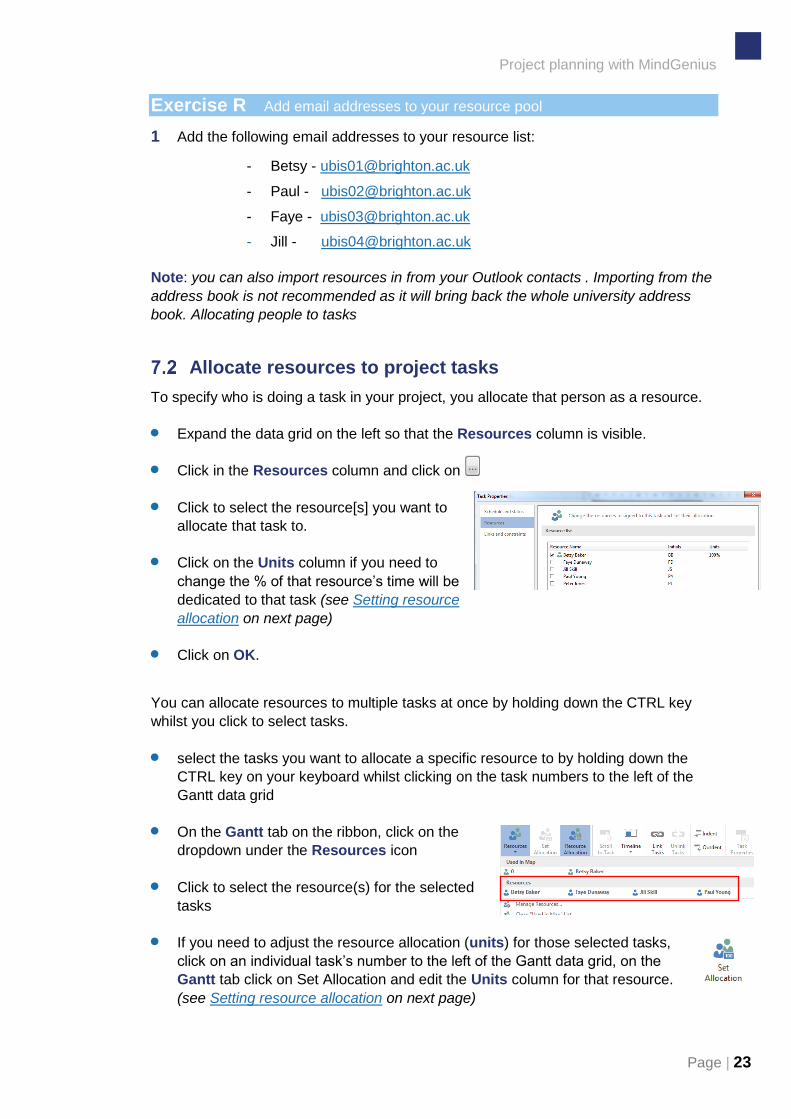
Exercise R Add email addresses to your resource pool
1 Add the following email addresses to your resource list:
- Betsy - [email protected]
- Paul - [email protected]
- Faye - [email protected]
- Jill - [email protected]
Note: you can also import resources in from your Outlook contacts . Importing from the
address book is not recommended as it will bring back the whole university address
book. Allocating people to tasks
Allocate resources to project tasks
To specify who is doing a task in your project, you allocate that person as a resource.
Expand the data grid on the left so that the Resources column is visible.
Click in the Resources column and click on
Click to select the resource[s] you want to
allocate that task to.
Click on the Units column if you need to
change the % of that resource’s time will be
dedicated to that task (see Setting resource
allocation on next page)
Click on OK.
You can allocate resources to multiple tasks at once by holding down the CTRL key
whilst you click to select tasks.
select the tasks you want to allocate a specific resource to by holding down the
CTRL key on your keyboard whilst clicking on the task numbers to the left of the
Gantt data grid
On the Gantt tab on the ribbon, click on the
dropdown under the Resources icon
Click to select the resource(s) for the selected
tasks
If you need to adjust the resource allocation (units) for those selected tasks,
click on an individual task’s number to the left of the Gantt data grid, on the
Gantt tab click on Set Allocation and edit the Units column for that resource.
(see Setting resource allocation on next page)

University of Brighton Information Services
Page | 24 last update June 2017
7.2.1 Setting resource allocation
This functionality is only available from version 6 of MindGenius.
By default, when you allocate a resource to a task MindGenius assumes that that
person will dedicate 100% of their time to that task.
If a resource can only dedicate part of their time to a task you can specify this by
setting the allocation. This in turn may affect the duration of a task.
For example:
One task is to write documentation for a new process. We estimate that this task will
take one day to complete. However, the person who will write the document can only
dedicate 50% of their time to the task. This means that the task duration will be 2 days.
Alternatively, you may know a task will take a while to complete but the allocated
resource will not need to dedicate 100% of their time. For example:
We need to track responses to invitations to a conference. Invitees are given 5 working
days from receiving the invites to respond. One of the project team will spend 10% of
their day adding confirmed attendees to a spreadsheet and sending confirmation
emails. So the task duration will be 5 days, with the resource allocation of 10%.
7.2.1.1 To set the allocation on tasks without resources:
Check that all tasks have a task duration set to indicate how long you estimate that
the task will take if the allocated resource dedicated 100% of their time to that task
When allocating a resource to a task, set the Units column to indicate what
percentage of that resource’s time will be allocated to that task (see Allocate
Resources to Project tasks above)
The task duration will be updated. If the new duration is not correct (as would
happen in the second example above) overtype the task duration in the Duration
column on the data grid to set the duration back to what you require.
7.2.1.2 To set the allocation on tasks that already have resources:
Check that all tasks have a task duration set to indicate how long you estimate that
the task will take if the allocated resource dedicated 100% of their time to that task
To change the allocation for a particular task, select that task from the data grid by
clicking on the task number on the left.
On the Gantt tab click on the Set Allocation
Set the Units column to indicate what percentage of that
resource’s time will be allocated to that task
The task duration will be updated. If the new duration is not correct (as would
happen in the second example above) overtype the task duration in the Duration
column on the data grid to set the duration back to what you require.
Project planning with MindGenius
Page | 25
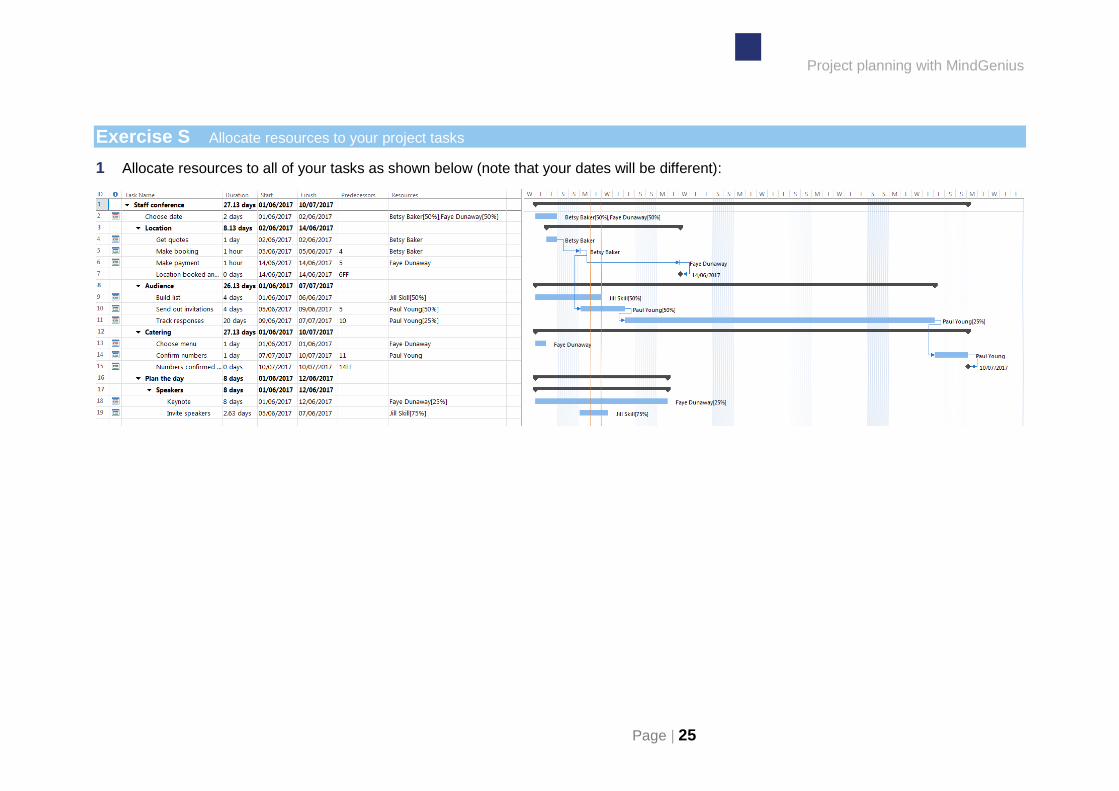
Exercise S Allocate resources to your project tasks
1 Allocate resources to all of your tasks as shown below (note that your dates will be different):
University of Brighton Information Services
Page | 26 last update June 2017
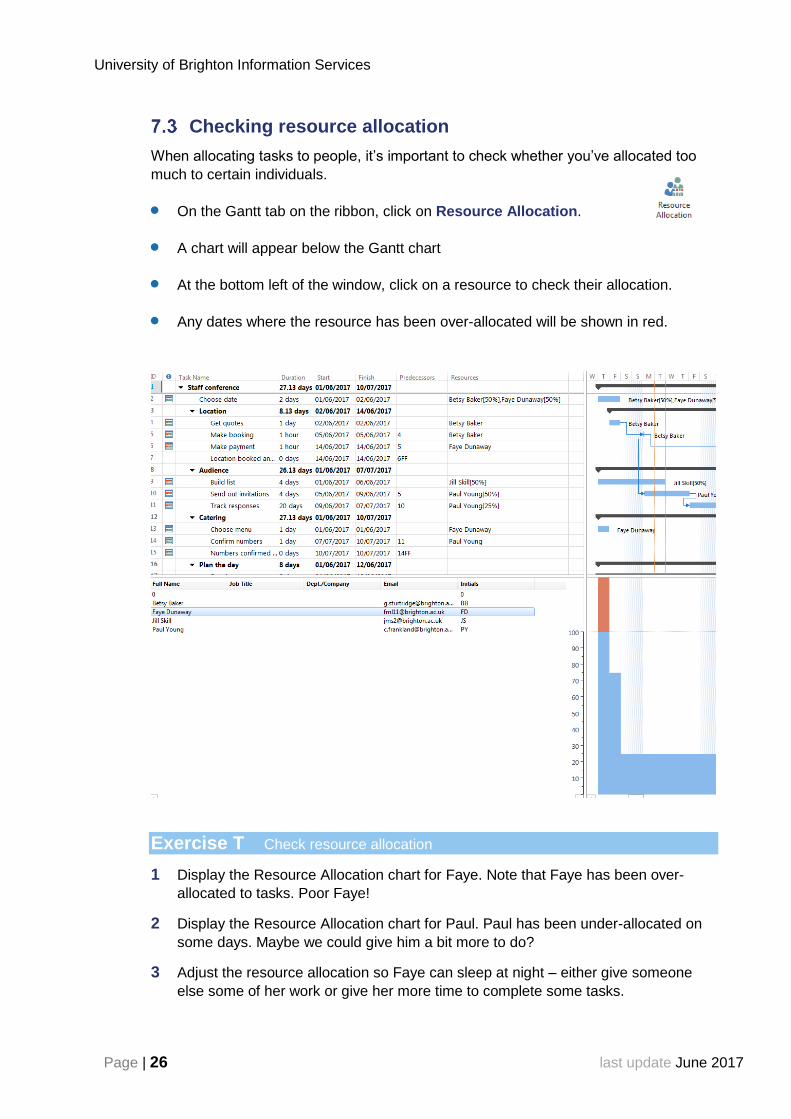
Checking resource allocation
When allocating tasks to people, it’s important to check whether you’ve allocated too
much to certain individuals.
On the Gantt tab on the ribbon, click on Resource Allocation.
A chart will appear below the Gantt chart
At the bottom left of the window, click on a resource to check their allocation.
Any dates where the resource has been over-allocated will be shown in red.
Exercise T Check resource allocation
1 Display the Resource Allocation chart for Faye. Note that Faye has been over-
allocated to tasks. Poor Faye!
2 Display the Resource Allocation chart for Paul. Paul has been under-allocated on
some days. Maybe we could give him a bit more to do?
3 Adjust the resource allocation so Faye can sleep at night – either give someone
else some of her work or give her more time to complete some tasks.

Project planning with MindGenius
Page | 27
Resource map
A Resource Map shows the project map by resource, which allows you to easily see all
of the tasks assigned to each person. Very useful when asking for updates.
Switch to map view (on the Gantt tab click on the Map View icon)
On the Tasks tab on the ribbon, click on the Resource Map icon.
Click on OK in the pop up window.
A new map is created, showing tasks by person.
Note: the resource map is a new file showing a snapshot of your project. It will not
update automatically if your project plan changes. You must create a new resource
map each time.
University of Brighton Information Services
Page | 28 last update June 2017
Tracking progress
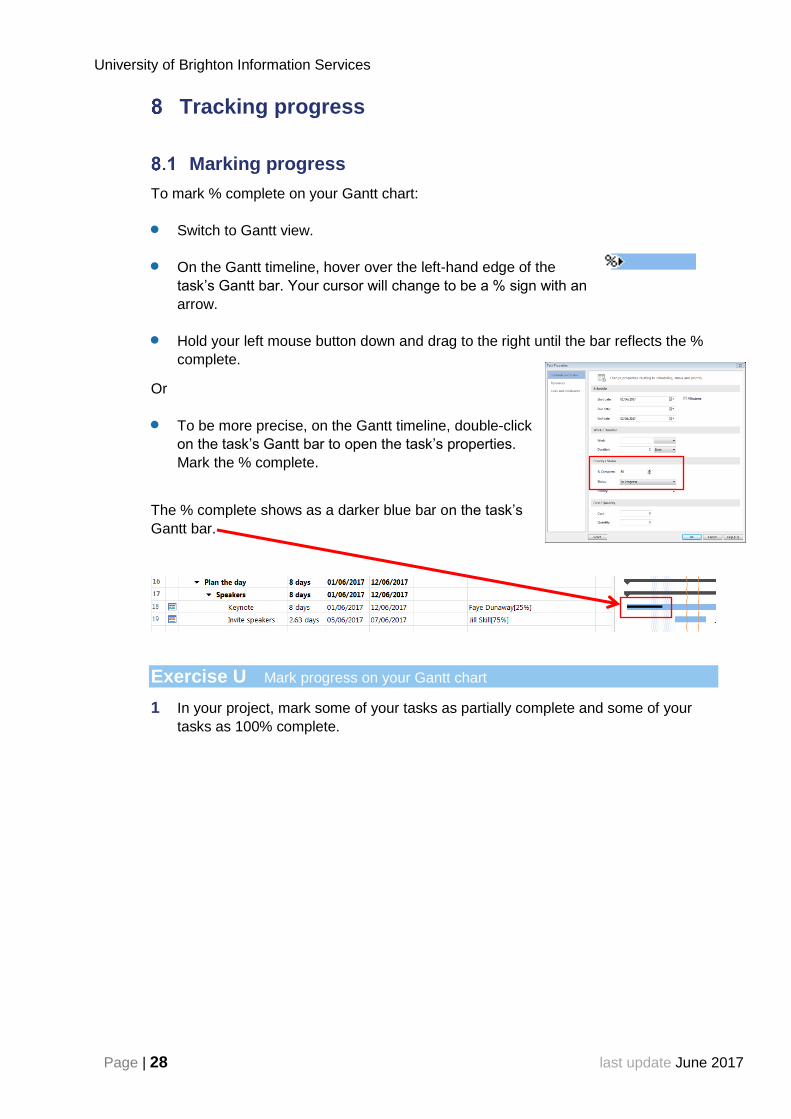
Marking progress
To mark % complete on your Gantt chart:
Switch to Gantt view.
On the Gantt timeline, hover over the left-hand edge of the
task’s Gantt bar. Your cursor will change to be a % sign with an
arrow.
Hold your left mouse button down and drag to the right until the bar reflects the %
complete.
Or
To be more precise, on the Gantt timeline, double-click
on the task’s Gantt bar to open the task’s properties.
Mark the % complete.
The % complete shows as a darker blue bar on the task’s
Gantt bar.
Exercise U Mark progress on your Gantt chart
1 In your project, mark some of your tasks as partially complete and some of your
tasks as 100% complete.
Project planning with MindGenius
Page | 29
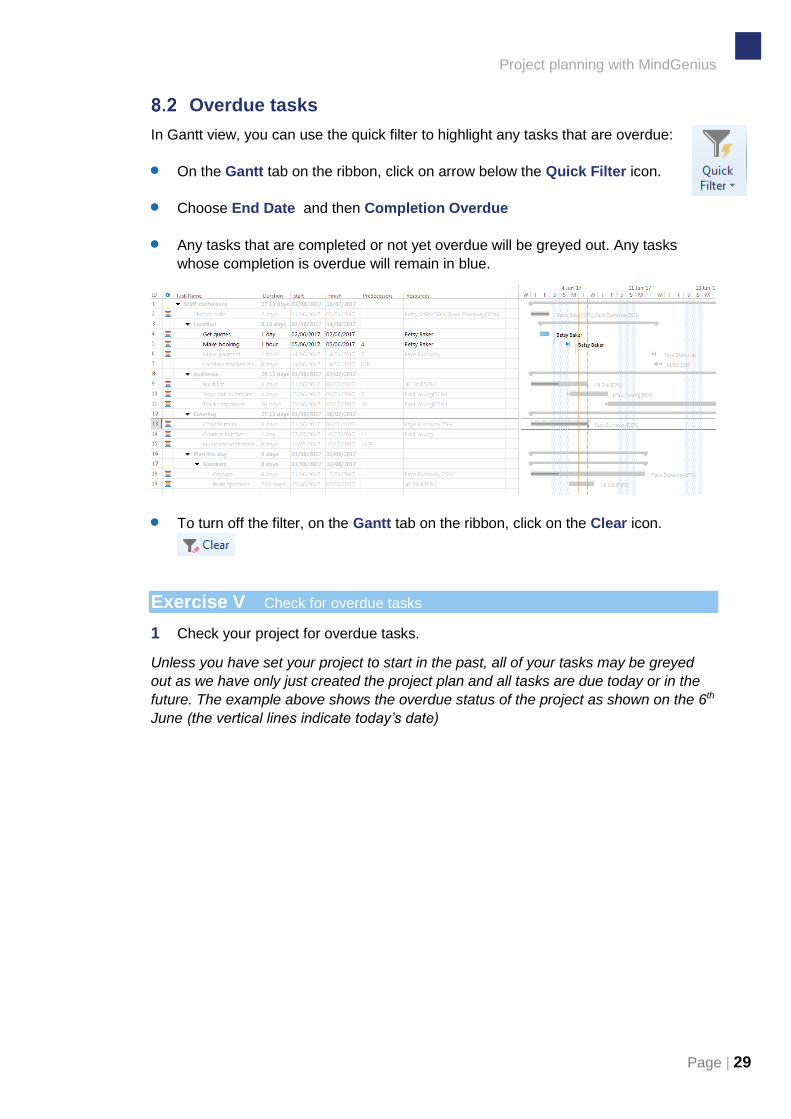
Overdue tasks
In Gantt view, you can use the quick filter to highlight any tasks that are overdue:
On the Gantt tab on the ribbon, click on arrow below the Quick Filter icon.
Choose End Date and then Completion Overdue
Any tasks that are completed or not yet overdue will be greyed out. Any tasks
whose completion is overdue will remain in blue.
To turn off the filter, on the Gantt tab on the ribbon, click on the Clear icon.
Exercise V Check for overdue tasks
1 Check your project for overdue tasks.
Unless you have set your project to start in the past, all of your tasks may be greyed
out as we have only just created the project plan and all tasks are due today or in the
future. The example above shows the overdue status of the project as shown on the 6th
June (the vertical lines indicate today’s date)

University of Brighton Information Services
Page | 30 last update June 2017
Viewing the critical path
The critical path highlights where you have no contingency for tasks to run over. Tasks
in your critical path must be completed on time for your project to finish on time.
To view the project’s critical path:
On the Gantt tab on the ribbon, click on arrow below the Show Critical Path icon.
The critical path will be marked in red on the Gantt timeline.
With our exercise project plan, the critical path may not look like much as we don’t
have many tasks. Try this on a real project plan!
Using map explorer to focus on one project stage
If you have a very large project, you can focus on a part of your Gantt chart using the
Map Explorer on the left.
If your map explorer is not visible, click on
the arrow to view it.
To focus on a specific area, click on the
task in the Map Explorer.
The Gantt will only show the task and any
sub-tasks.
To display the entire project again, click on the highest level in the Map Explorer (in
the example above this will be Staff conference at the top of the list)
Project planning with MindGenius
Page | 31
Exercise W Display the map explorer.
1 Click on Location in the Map Explorer to focus on the location section of the
project. You may need to click on the next to Staff Conference to expand the
list first.
2 Click on Staff Conference in the Map Explorer to display the entire project again.
Adding detail
You can add notes and links to the branches of your project map for more information.
Adding notes
Text on map branches and Gantt chart tasks should be kept short. You can use notes
to add detail.
Any notes on tasks exported to Outlook will appear on the recipient’s Outlook task (see
Outlook Tasks to assign and track progress for more information)
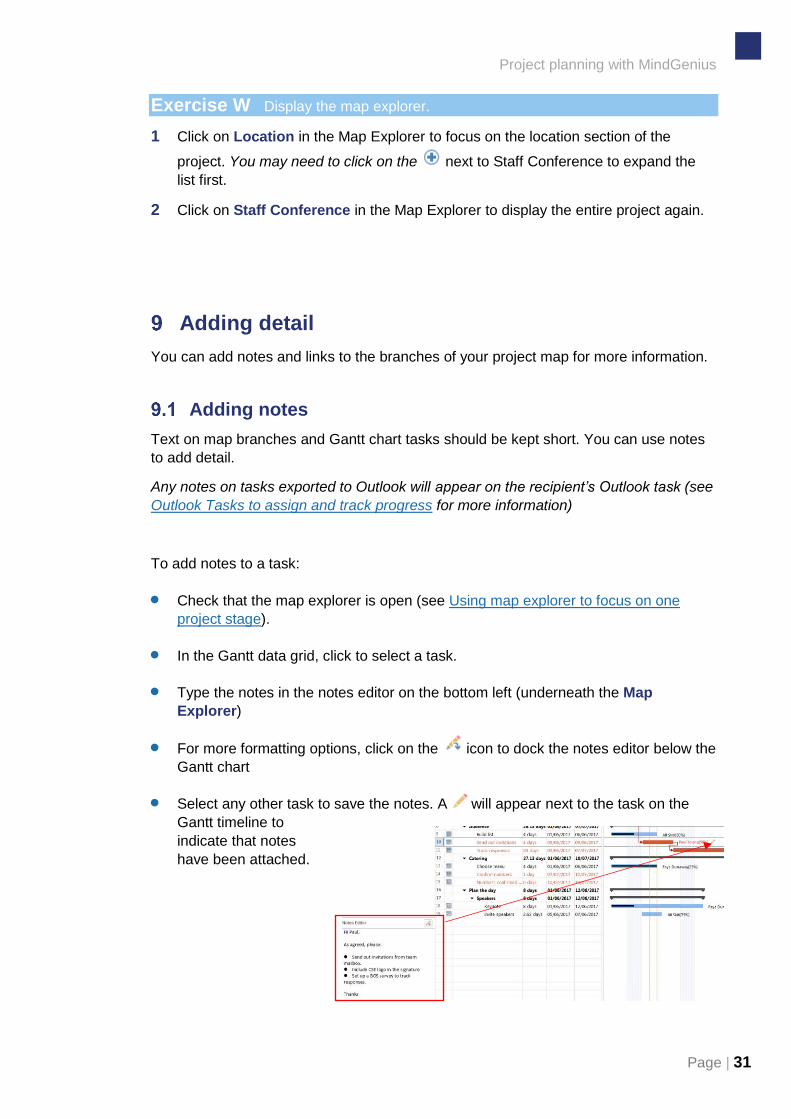
To add notes to a task:
Check that the map explorer is open (see Using map explorer to focus on one
project stage).
In the Gantt data grid, click to select a task.
Type the notes in the notes editor on the bottom left (underneath the Map
Explorer)
For more formatting options, click on the icon to dock the notes editor below the
Gantt chart
Select any other task to save the notes. A will appear next to the task on the
Gantt timeline to
indicate that notes
have been attached.
University of Brighton Information Services
Page | 32 last update June 2017
Adding hyperlinks
You can add hyperlinks to nodes in both Gantt view and map view. However, these are
only visible in map view.
Hyperlinks are not exported to Outlook.
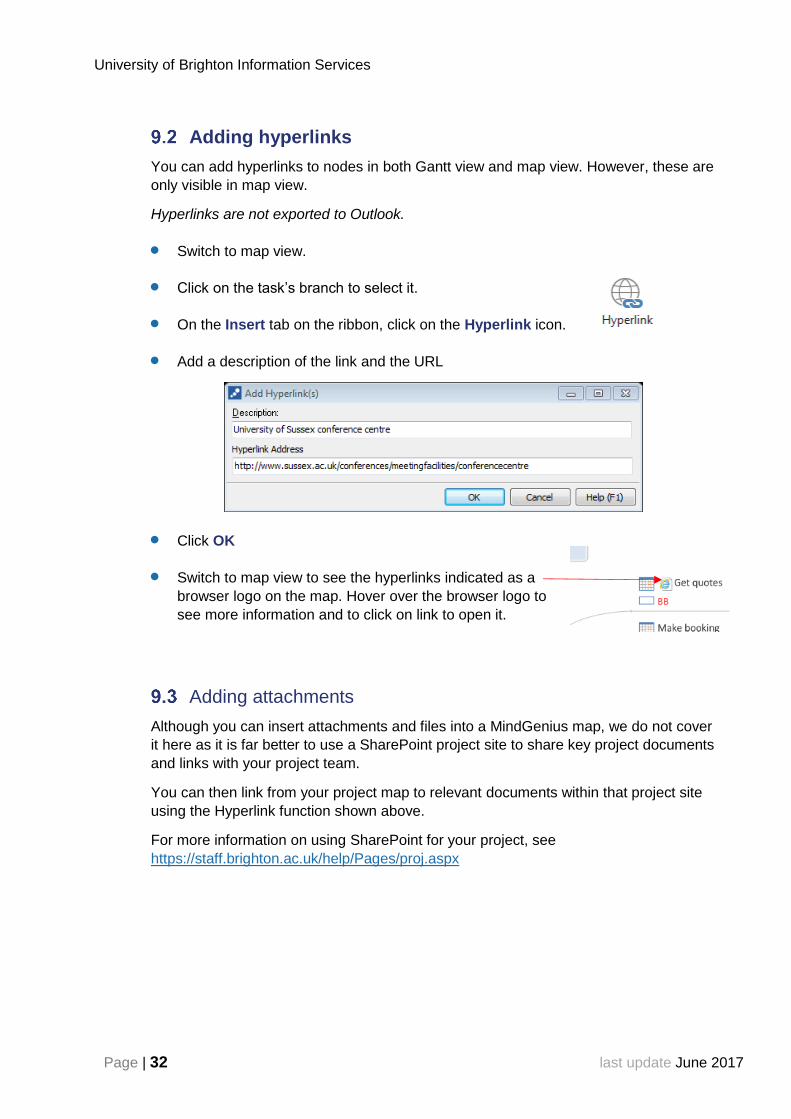
Switch to map view.
Click on the task’s branch to select it.
On the Insert tab on the ribbon, click on the Hyperlink icon.
Add a description of the link and the URL
Click OK
Switch to map view to see the hyperlinks indicated as a
browser logo on the map. Hover over the browser logo to
see more information and to click on link to open it.
Adding attachments
Although you can insert attachments and files into a MindGenius map, we do not cover
it here as it is far better to use a SharePoint project site to share key project documents
and links with your project team.
You can then link from your project map to relevant documents within that project site
using the Hyperlink function shown above.
For more information on using SharePoint for your project, see
https://staff.brighton.ac.uk/help/Pages/proj.aspx
Project planning with MindGenius
Page | 33
Printing
To print your Gantt chart:
On the Gantt tab and click on Print Preview
Check whether the print looks OK.
If not, then use the settings at the top of the screen to adjust the print. Useful setting
include:
In Page Setup, set Fit to 1 page wide and change the Paper Size to A3
When you’re happy, click on Print.
Project reports
Some predefined reports are available in Mind Genius.
Whilst these may not be everything you need for your reports – especially if your
department have predefined document templates for project reporting – as the
MindGenius reports are Word documents you can use them to extract project data
which you can then copy and paste into your proper project reports.
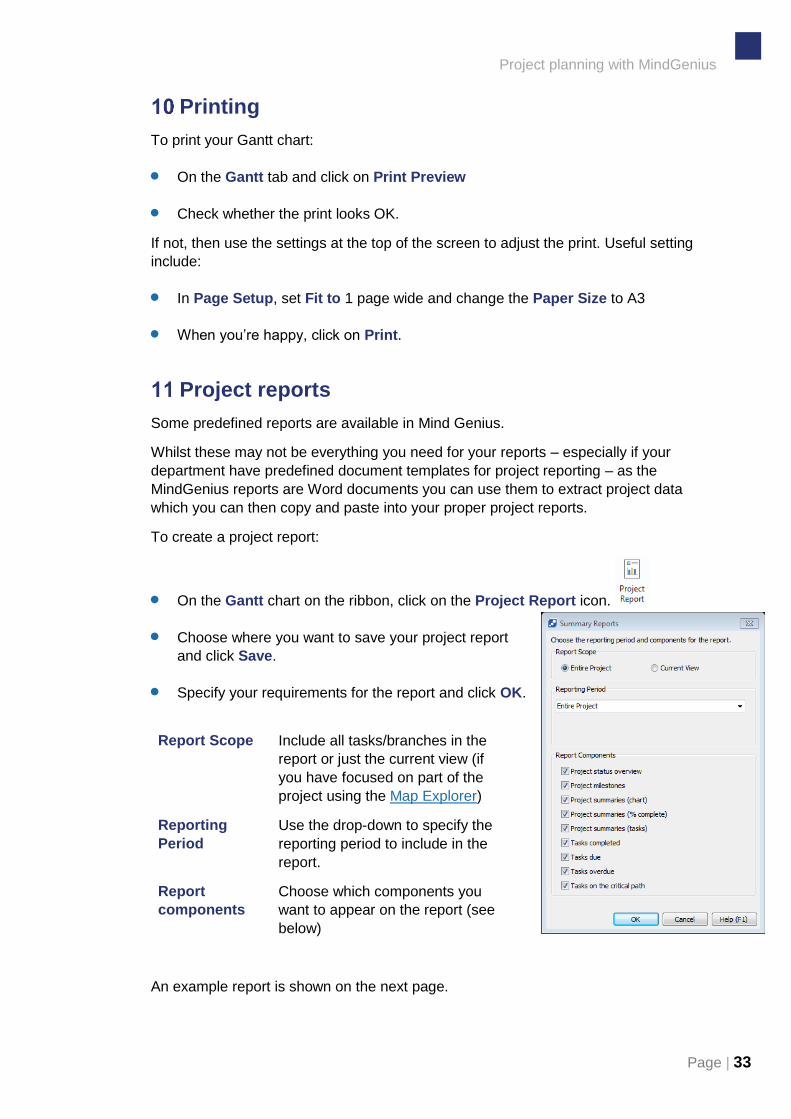
To create a project report:
On the Gantt chart on the ribbon, click on the Project Report icon.
Choose where you want to save your project report
and click Save.
Specify your requirements for the report and click OK.
Report Scope Include all tasks/branches in the
report or just the current view (if
you have focused on part of the
project using the Map Explorer)
Reporting
Period
Use the drop-down to specify the
reporting period to include in the
report.
Report
components
Choose which components you
want to appear on the report (see
below)
An example report is shown on the next page.

University of Brighton Information Services
Page | 34 last update June 2017
Exercise X Create a project report
1 Create a project report for your project.
PROJECT STATUS shows %
complete status of overall project.
Comment appears if notes have
been added to the core branch of
the map.
PROJECT MILESTONES
Displays all milestones for the
project
PROJECT SUMMARIES
(CHART)
Displays the % complete for each
level 1 summary task
PROJECT SUMMARIES (%
COMPLETE)
Displays important data for each
summary task.
Comments appear if notes have been
added to that branch of the map.
Project planning with MindGenius
Page | 35
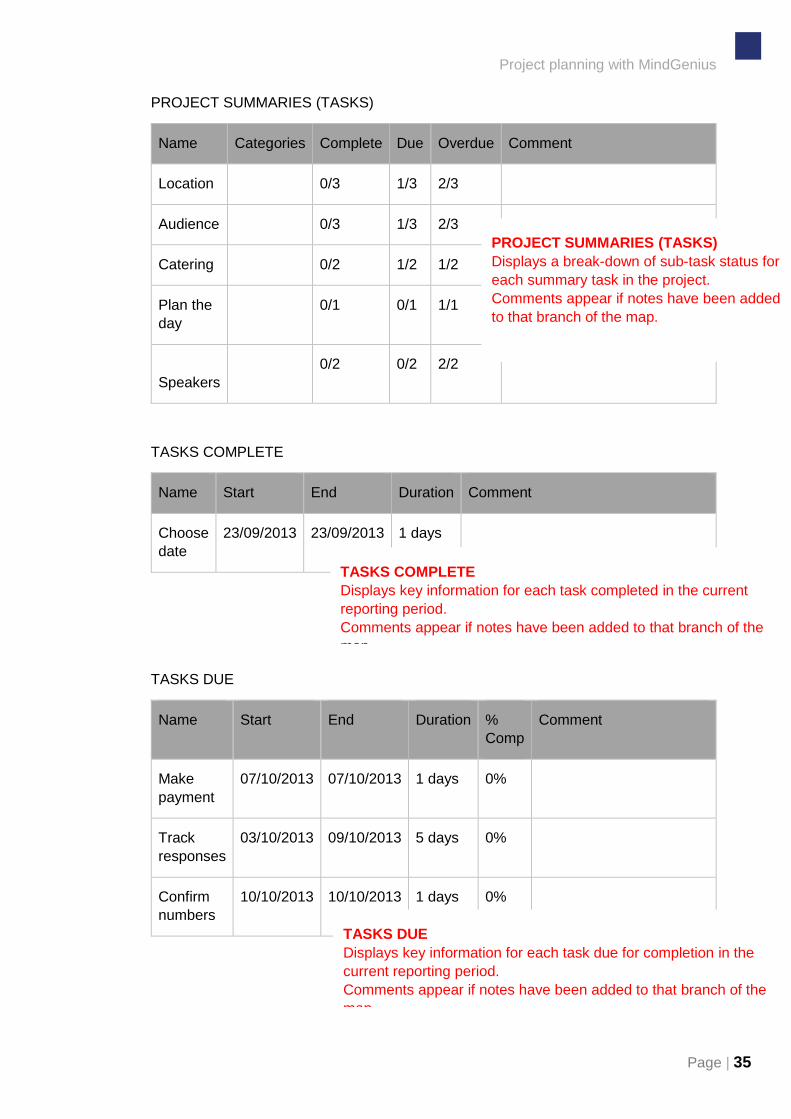
PROJECT SUMMARIES (TASKS)
Name Categories Complete Due Overdue Comment
Location 0/3 1/3 2/3
Audience 0/3 1/3 2/3
Catering 0/2 1/2 1/2
Plan the
day 0/1 0/1 1/1
Speakers 0/2 0/2 2/2
TASKS COMPLETE
Name Start End Duration Comment
Choose
date
23/09/2013 23/09/2013 1 days
TASKS DUE
Name Start End Duration %
Comp
Comment
Make
payment
07/10/2013 07/10/2013 1 days 0%
Track
responses
03/10/2013 09/10/2013 5 days 0%
Confirm
numbers
10/10/2013 10/10/2013 1 days 0%
PROJECT SUMMARIES (TASKS)
Displays a break-down of sub-task status for
each summary task in the project.
Comments appear if notes have been added
to that branch of the map.
TASKS COMPLETE
Displays key information for each task completed in the current
reporting period.
Comments appear if notes have been added to that branch of the
map.
TASKS DUE
Displays key information for each task due for completion in the
current reporting period.
Comments appear if notes have been added to that branch of the
map.

University of Brighton Information Services
Page | 36 last update June 2017
TASKS OVERDUE
Name Start End Duration %
Comp
Comment
Get
quotes
24/09/2013 26/09/2013 3 days 68%
Make
booking
27/09/2013 30/09/2013 2 days 40% Betsy and Faye are
waiting to hear about SMT
budget
Build list 23/09/2013 24/09/2013 2 days 0%
send out
invitations
01/10/2013 02/10/2013 2 days 0%
Choose
menu
23/09/2013 23/09/2013 1 days 57%
Key note 23/09/2013 24/09/2013 2 days 0%
Invite
speakers
24/09/2013 27/09/2013 4 days 0%
CRITICAL TASKS
Name Start End Duration %
Comp
Comment
Track
responses
03/10/2013 09/10/2013 5 days 0%
Confirm
numbers
10/10/2013 10/10/2013 1 days 0%
TASKS OVERDUE
Displays key information for each task that has exceeded its
scheduled end date but is not yet completed.
Comments appear if notes have been added to that branch of the
map.
CRITICAL TASKS
Displays key information for each task that lies on the critical
path.
Comments appear if notes have been added to that branch of the
map.

Project planning with MindGenius
Page | 37
Create a project timeline in Excel
Excel 2013 has a project timeleine template that you can use alongside your
MindGenius project plan data. To use it:
In MindGenius create a project report, just for milestones
In Excel, start a new document based on the Timeline with Milestones template
(File >> New >> Choose the Timeline with Milestones template)
Copy and paste the dates column from the MindGenius project report
Copy and paste the Milestone column from the MindGenius project report
Delete unused rows from the Excel template
For example:
University of Brighton Information Services
Page | 38 last update June 2017
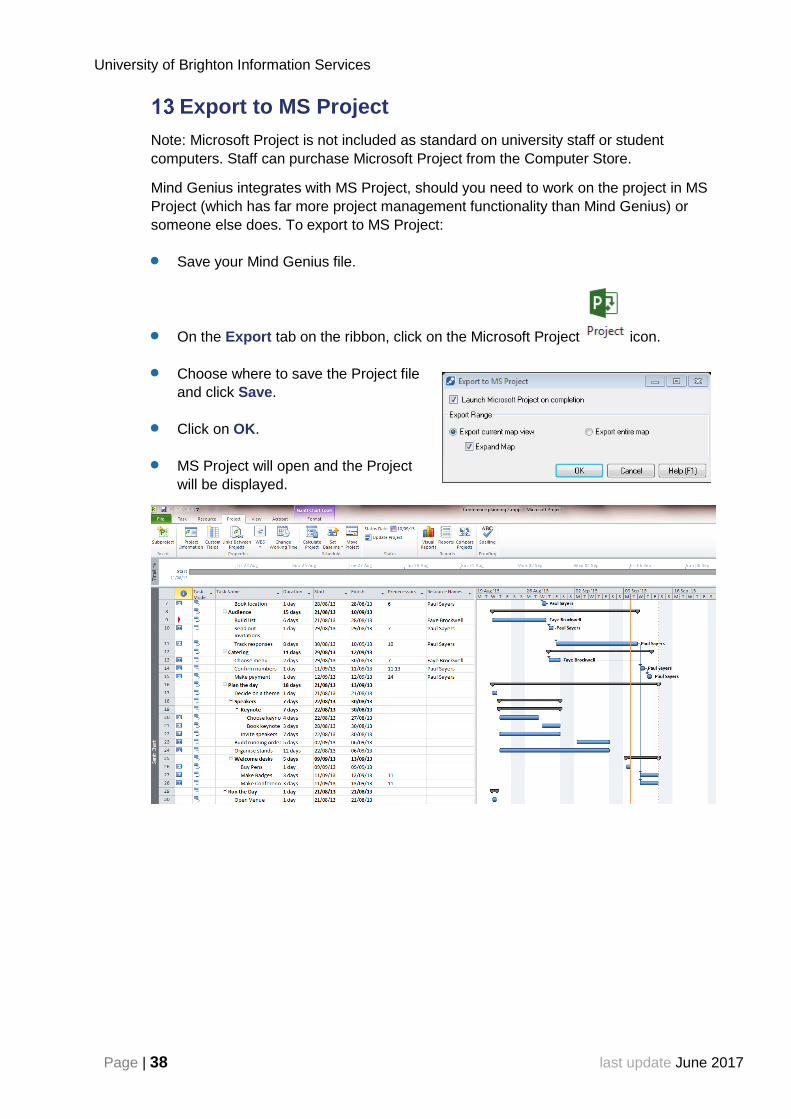
Export to MS Project
Note: Microsoft Project is not included as standard on university staff or student
computers. Staff can purchase Microsoft Project from the Computer Store.
Mind Genius integrates with MS Project, should you need to work on the project in MS
Project (which has far more project management functionality than Mind Genius) or
someone else does. To export to MS Project:
Save your Mind Genius file.
On the Export tab on the ribbon, click on the Microsoft Project icon.
Choose where to save the Project file
and click Save.
Click on OK.
MS Project will open and the Project
will be displayed.
Project planning with MindGenius
Page | 39
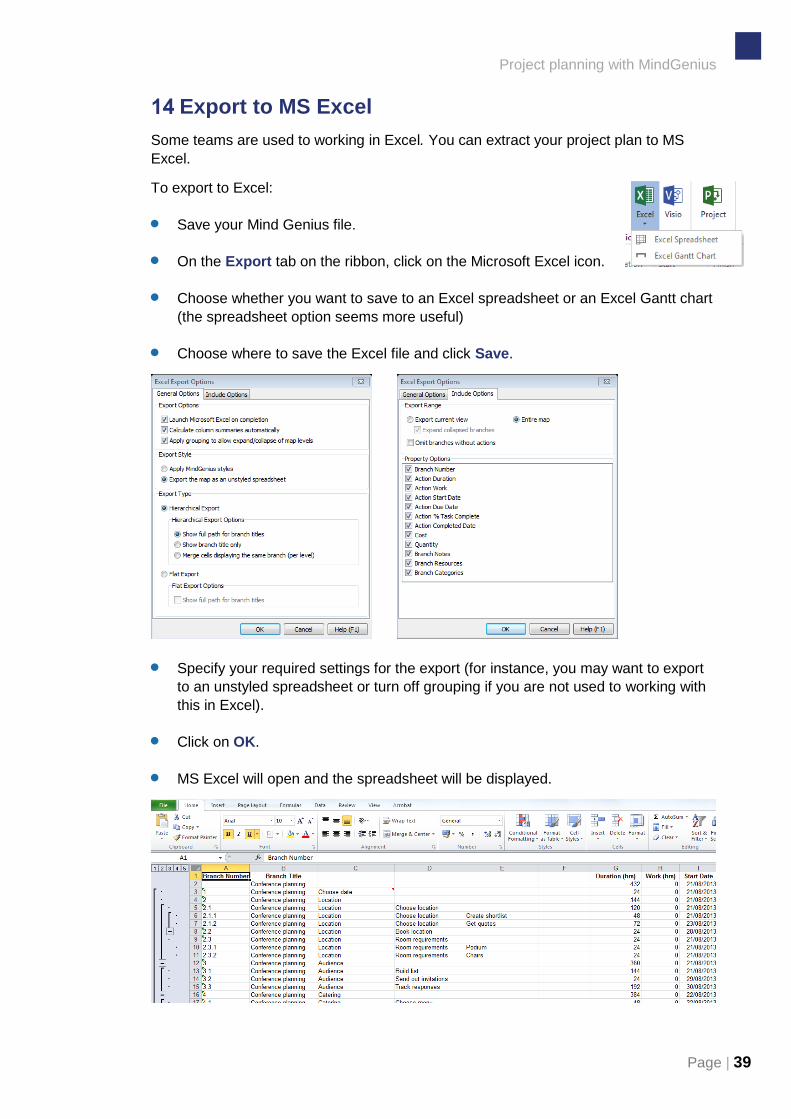
Export to MS Excel
Some teams are used to working in Excel. You can extract your project plan to MS
Excel.
To export to Excel:
Save your Mind Genius file.
On the Export tab on the ribbon, click on the Microsoft Excel icon.
Choose whether you want to save to an Excel spreadsheet or an Excel Gantt chart
(the spreadsheet option seems more useful)
Choose where to save the Excel file and click Save.
Specify your required settings for the export (for instance, you may want to export
to an unstyled spreadsheet or turn off grouping if you are not used to working with
this in Excel).
Click on OK.
MS Excel will open and the spreadsheet will be displayed.

University of Brighton Information Services
Page | 40 last update June 2017
Outlook Tasks to assign and track progress
Mind Genius interacts with Microsoft Outlook. Once you have assigned tasks to people
by allocating resources, you can export those tasks to Outlook. This will send Outlook
tasks to each individual. The individual can then mark progress within the Outlook task.
This in turn will update the progress of the task in your Gantt chart.
For this to work:
Each resource must have an email address specified BEFORE you assign the
resource to a task.
The email address must be on the same Exchange Server as you (i.e. university
staff can only allocate resources to other university staff with a Brighton email
address).
Your project team must understand how to use Outlook Tasks for progress
tracking.
This means that the Outlook Tasks functionality is not available for students or
resources that are external to the university.
Send the tasks to Outlook
This only works if you have specified email addresses for the resources assigned to
tasks.
In Gantt view, select the tasks that you want to send to
Outlook (or to select all tasks click on task one, hold down
the SHIFT key and then click on the last task)
On the Tasks tab, click on the Outlook icon and choose
Send selection to Outlook as tasks
Note: any branches not assigned a resource will appear in your own Outlook task list.
Assign resources in Mind Genius
Export to Outlook from Mind Genius
Resource accepts task request and updates progress in Outlook task
Synchornise the Mind Genius map
with Outlook
Progress is automatically
reflected in Gantt chart
University
staff only!

Project planning with MindGenius
Page | 41
Updating tasks in Outlook
When you send the tasks to Outlook:
A task request will appear in the recipient’s inbox to notify that a task has been
assigned to them.
They need to accept the request to add it to their Outlook Task list.
The task will also appear in your own Outlook task list. You may want to add the
Assigned To column to your Outlook Tasks view so that you can keep track of
which task belongs to whom.
When the recipient accepts the task request, you will receive an email into your
inbox to inform you.
The Outlook task appears in the recipient’s Outlook task list. The recipient can
double-click on the task in their Outlook task list to open it. Then they can check
start and end dates, check any notes that have been added to that task’s branch in
your map (and add their own), add a reminder if necessary, and indicate the %
completed.
When the recipient of the task updates the task (records their % progress, for
example) and saves it in Outlook, the Mind Genius map and Gantt chart will be
updated when you sync the Mind Genius map.
University of Brighton Information Services
Page | 42 last update June 2017
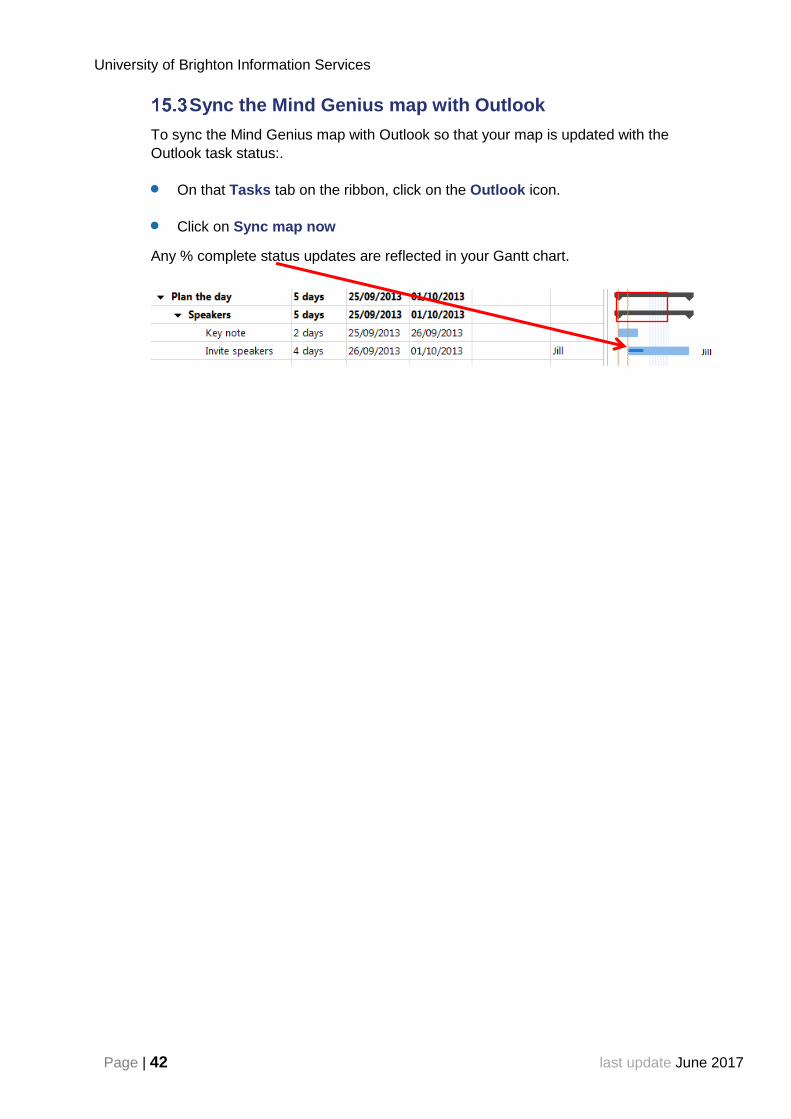
Sync the Mind Genius map with Outlook
To sync the Mind Genius map with Outlook so that your map is updated with the
Outlook task status:.
On that Tasks tab on the ribbon, click on the Outlook icon.
Click on Sync map now
Any % complete status updates are reflected in your Gantt chart.


