
NRA01N2WC/DEIR October 2008
DRAFT ENVIRONMENTAL IMPACT REPORT
PROPOSED N2 WILD COAST TOLL HIGHWAY
Volume 3: Specialist Reports
Prepared for: National Department of Environmental Affairs and Tourism,
Eastern Cape Department of Economic Development and Environmental Affairs, and KwaZulu-Natal Department of Agriculture and Environmental Affairs
Prepared by: CCA Environmental (Pty) Ltd
On behalf of: The South African National Roads Agency Limited
Contact: CCA Environmental (Pty) Ltd
Unit 35 Roeland Square 30 Drury Lane
Cape Town 8001
Tel: (021) 461 1118 Fax: (021) 461 1120
Email: [email protected]

Volume 3
This volume contains the following Specialist Reports:
Appendix 5: Social Appendix 6: Tourism Appendix 7: Cultural and Historical Heritage Appendix 8: Noise
Peer Review Reports are included in each Specialist Report.
APPENDIX 5
SOCIAL
Specialist
Dr Neville Bews Dr Neville Bews and Associates
Peer Reviewer
Tony Barbour Environmental Consultant and Researcher

SOCIAL IMPACT ASSESSMENT OF THE PROPOSED N2 WILD COAST TOLL HIGHWAY
Prepared by N Bews; G Huggins; M Andrews and J Zingel Dr Neville Bews & Associates
PO Box 145412 Bracken Gardens
Alberton 1452
Submitted to
CCA Environmental (Pty) Ltd On behalf of
The South African Road Agency Limited
Final Draft Report 15 June 2008
Social Impact Assessment of the Proposed N2 Wild Coast Toll Highway
Dr. Neville Bews & Associates June 2008 i
EXECUTIVE SUMMARY
Over the last few years various considerations have been given to upgrading existing sections of the N2
and R61 routes and to construct new sections of road linking East London in the Eastern Cape with
Durban in KwaZulu-Natal. In terms of regulations an Environmental Impact Assessment (EIA) is required
for such a development. Part of the overall EIA documentation is a Social impact Assessment (SIA). This
report makes up the SIA.
The study area extends, for a distance of approximately 559.5 km, along existing sections of the N2 and
R61 routes and in certain Greenfields sections between Gonubie Interchange near East London in the
Eastern Cape Province and Isipingo Interchange south of Durban in the Province of KwaZulu-Natal. The
route can be divided further into the following seven sections:
• Section 1: Gonubie Interchange to Ngobozi – approximately 80 km over the existing N2
• Section 2: Ngobozi to Mthatha (Ngqeleni) – approximately 145 km over the existing N2
• Section 3: Mthatha (Ngqeleni) to Ndwalane – approximately 72 km over the existing R61
• Section 4: Ndwalane to Ntafufu River – approximately 16.5 km new road section
• Section 5: Ntafufu River to Lusikisiki (Magwa Intersection) – approximately 24.5 km over the
existing R61 (approximately 18 km) over the existing concrete road (DR08024 approximately 5
km)
• Section 6: Lusikisiki (Magwa Intersection) to Mthamvuna River – approximately 73.5 km largely
Greenfields section
• Section 7: Mthamvuna River to Isipingo Interchange – approximately 148 km over the existing
R61 and N2. Due to the nature of this section of the route and for purpose of impact assessment
this section has been subdivided into two further sections. The first of these subsections
stretches between the Mthamvuna River and Port Shepstone, is more rural in nature, and is
labelled 7a. The second, between Port Shepstone and Isipingo Interchange, is more urban and
is labelled 7b.
The characteristics of the entire route are such that it was possible to divide it into three sections based
on the nature of each section. Progressing from East London to Durban these sections consist of a
relatively mixed section of the existing N2 between Gonubie Interchange and Mthatha (Ngqeleni)
comprised largely of rural areas and small development nodes clustered around a few small towns.
Secondly, a largely rural Greenfields section between Mthatha (Ngqeleni) and Mthamvuna River
consisting of sections of the R61 route and new road sections at times over extremely rugged territory.
The final section of road follows the R61 and N2 route from Mthamvuna River to Isipingo Interchange and
initially progresses through rural and then farming terrain linking a number of small and medium size
resort towns and becomes increasingly urbanised towards the Isipingo Interchange. The seven sub-
sections of road described above are all catered for within the three divisions made largely on
methodological grounds. Research into the Social Impacts for the section of road between the Gonubie
Interchange and Mthatha (Ngqeleni) and then from the Mthamvuna River to Isipingo employed the
following data sources and methods:
Social Impact Assessment of the Proposed N2 Wild Coast Toll Highway
Dr. Neville Bews & Associates June 2008 ii
• An examination of the Scoping Report, Minutes of all the Public Participation Meetings and the
Issues/Response trail for the Wild Coast Toll Highway, as well as the previous SIA and DEAT’s
comments on this report.
• A review of the existing literature for relevant District Municipalities, and other secondary sources
on the land uses and livelihoods of residents of the Eastern Cape.
• Stats SA 2001 Census data for the Eastern Cape and KwaZulu-Natal Province and the relevant
district and local municipalities.
• An examination of the 1:50 000 topographic maps for this section of road.
• Recorded observations of the number of pedestrians and road access onto the N2 along this
section, as well as the number of residential/business sites with direct access onto the N2.
• A structured closed ended questionnaire survey of 140 commuters using taxis in Butterworth,
Idutywa and Mthatha.
• Interviews with the following stakeholders and affected parties in the Eastern Cape:
o Taxi operators in Butterworth, Idutywa and Mthatha.
o Municipal officials in Butterworth, Idutywa and Mthatha.
o Local residents of Ndabakazi rural area west of Butterworth.
• Interviews with stakeholders in the KwaZulu-Natal area. In all, over 50 stakeholders participated
in meetings. Notes of all meetings are appended as Appendix 1. Interest groups that were
contacted included provincial departments, district municipality representatives, local municipality
representatives, key sectoral stakeholders, local interest, representatives of marginal
communities, large business, small scale traders, etc.
The Mthatha - Mthamvuna section of the route comprises largely of Greenfields areas and, as a result, a
number of hitherto unreported social impacts could occur within this sector. Consequently, the
methodological approach adopted was designed to both complement and expand on the original Terms
of Reference and included a Sustainable Livelihoods Framework approach which emphasises the
linkages between policy and planning priorities and the potential responses of households and
communities. It also provides a focus on both sustainability and vulnerability issues. This methodology
was used to investigate local perspectives on the impacts of the proposed road on the livelihood
resources such as:
• Natural capital – including land, water and forests.
• Human capital – including skills, knowledge, health and the potential impacts on the amount and
quality of local labour.
• Social capital – community and family networks and formal and informal membership of various
types of groups and organisations.
• Physical capital – including local basic infrastructure, shelter and roads and the stock of services
needed to sustain livelihoods. This also includes schooling, health and energy services.
• Financial capital – including annual income, potential savings and expenditure, the available
stocks of cash and bank assets and the accumulation of livestock and other convertible incomes
or savings.
Social Impact Assessment of the Proposed N2 Wild Coast Toll Highway
Dr. Neville Bews & Associates June 2008 iii
A diverse sample consisting of seven communities, representing the characteristics of the twenty-one
communities along the Mthatha to Mthamvuna River section of the proposed route was selected.
Research into the social impacts revealed the following major issues of concern for the residents and
stakeholder between the Gonubie and Mthatha sections.
Resettlement: Widening of the road reserve from 30 to 80m will result in a large (as yet
unknown) number of households needing to be moved. There were also concerns about the
graves of family members who have been buried in the homestead gardens. There was also
concern amongst some municipal officials about the need to ensure that the widened road
reserve is not encroached on again. This is particularly pertinent as only half of the reserve will be
used for the highway at this stage.
Access issues: Residents of neighbouring rural communities were concerned about SANRAL’s
proposal to restrict access to and across the highway. This would affect their access to transport
services and to a wide variety of resources that may be located on the other side of the road (i.e.
schools, clinics, shops, family and friends, arable lands, grazing lands and other natural
resources).
Health and safety: There was general support for the development of the highway as a means
of improving the safety of the road and making the former Transki a more attractive and
accessible destination for tourists and through traffic. There was considerable concern about
safety issues and the high number of accidents along this section of road. At the same time
residents in rural settlements expressed some concerns about increased safety risks for their
children and livestock as a result of the high speed traffic that would be using the highway.
Road maintenance and infrastructure Issues: There was concern about the poor condition of
the N2, particularly in the towns of Mthatha, Butterworth and Idutywa. The need for the upgrading
of these sections is urgent, and local officials were concerned that SANRAL’s maintenance work
on this road would be delayed until the issues around the toll highway are resolved.
Labour: There was some support for the highway due to expected employment benefits for local
residents. There was a general feeling that the jobs that do become available need to be
reserved for local residents. At the same time there were concerns raised by some stakeholders
that the number of local people employed on such projects tends to be low and will only be
temporary (during the construction phase).
Economic impact of tolls: While most people supported the development of a highway, all the
key stakeholders were very concerned about the imposition of tolls on the N2. The main concern
is that the local population was too poor and would not be able to afford these fees. There was
also concern about the high cost of the road due to the need for many bridges, interchanges and
Social Impact Assessment of the Proposed N2 Wild Coast Toll Highway
Dr. Neville Bews & Associates June 2008 iv
under- or overpasses, and the consequent high toll fees. They argued that toll fees would not be
able to pay for all these costs and that the government would need to subsidise the construction
costs.
One-way systems for towns: Local municipalities are concerned about the delays in the
development of the highway and the associated development of one-way streets through the
towns that would help to alleviate the traffic problems in these towns. They are also concerned
that SANRAL appears to not be prepared to invest the financial resources needed for new
bridges to develop effective one-way systems for these towns.
Bypasses for towns: There are some concerns amongst local residents and business people
about the negative impact the bypasses will have on the local economies due to the loss of
business from bypassing traffic. At the same time there is recognition of the traffic congestion
problems in the city centres and the contribution that the bypasses could make to the alleviation
of these problems.
Off ramps and interchanges for towns: There was some concern amongst the Mthatha
municipal officials about SANRAL’s proposal to have only two interchanges for Mthatha on either
end of the bypass. This was considered inadequate and a strong plea was made for a third
interchange to access the centre of the city.
Ribbon development along the N2: A concern has been raised in the Tshani report with
respect to ribbon development along the N2. The concern is that the highway might encourage
such development.
For the Mthatha – Mthamvua section the following major issues emerged.
Resettlement: Potential resettlement of homesteads to make way for the road was identified as
a crucial impact.
Access: Some possible restrictions on access to natural capital resources and assets in the form
of water, forests, plantations and grazing and arable land were raised. Given the area’s profile,
potential losses of the social capital inherent in community interaction and in family engagements
and support networks were held to be very high.
Health and safety: Health benefits were expressed generally in terms of those potential
increases accruing from the perception, or aspiration, that an improved road would lead to a
better quality and way of life, and particularly, in terms of better access to a wider range of major
health services covered above. Negative expressions covered the general problems associated
with more noise due to increased and faster traffic after construction. Younger people expressed
concern regarding an increase in fumes and the possibility of chemical spills from the heavy

Social Impact Assessment of the Proposed N2 Wild Coast Toll Highway
Dr. Neville Bews & Associates June 2008 v
traffic. The possible increase in the spread of HIV/AIDS and STDs due to more truckers, despite
perceptions about a high local prevalence in the area, was frequently noted as a negative issue.
Safety issues raised most frequently were that a better road made for safer travelling and would
also result in an improved condition of the local taxi fleet. Improved fencing and the management
of a toll road were invariably held to have the potential of reducing accident rates with specific
emphasis on pedestrians and in particular children crossing the road. As was to be expected,
issues around livestock and other animal safety were raised most frequently. However, fears
were also frequently expressed that ‘local destructive youth’ would cut the fencing to sell, given
local unemployment levels.
Enterprise, income, employment and labour: Potential improvements in the local stock of
financial capital and assets arising from the introduction of the toll road were anticipated by most.
More employment and improved incomes were almost unanimously viewed as likely to arise from
both an increase in employment possibilities directly associated with the road, as well as in an
expansion in existing enterprises.
For the section between Mthamvuna and Isipingo the following major issues were identified.
Social effects of increased cost of doing business and concomitant/associated loss of income: The greatest concern of many of the interest groups affected by the creation of a toll
road was that of the anticipated increase in the cost of doing business. Businesses, industry and
agriculture are all reliant on the N2 highway for transporting products, whatever they may be.
Social effects of increased cost of accessing services and employment: Of some concern to
the marginal communities along the N2, is access to employment. These communities rely
largely on public transport (taxis and buses) to access places of employment. As such the
increase in tariffs will potentially weigh heavily on the earning capacity of the low-income earners
on the South Coast.
Social effects of increased congestion on non toll roads and critical access points: A
serious concern of most of the interest groups that were consulted was the perceived lack of a
viable alternative route to the N2 if it is tolled. The R102, which is aligned roughly parallel to the
N2 from Ramsgate to Port Shepstone, is already seen as being congested with an increased
volume of traffic potentially creating a safety hazard, pollution and excessive noise. If the N2 is
tolled interest groups predict that these problems will intensify. With the R61 upgraded to become
the N2 there will be no other route between Port Edward and Southbroom.
Social effects of increased loss of access points: Some stakeholders, noticeably those along
the R61 between Port Shepstone and Port Edward, indicated that by converting the R61 to the
N2 it would remove certain access points and as such some people would have to travel further

Social Impact Assessment of the Proposed N2 Wild Coast Toll Highway
Dr. Neville Bews & Associates June 2008 vi
distances to either access the road or to cross it. This would increase travelling time and
expense.
Increase in noise levels: Representatives of the South Coast Chamber of Commerce (SCCC)
have expressed their concern that the upgrading of the R61 will increase the noise pollution in the
area. They state that there is already a problem along the current R61 and that the upgrading to a
larger capacity, high speed highway will exacerbate this. Concern over increased noise levels
was also raised for the toll plazas themselves.
Social effects linked to a potential increased HIV and STD risk associated with truck traffic: The Department of Economic Development (DED) pointed out that there would be an
influx of migrant construction workers and a sudden increase in available cash among some local
manual labourers contracted by SANRAL. This could become a vector for increased infections in
the province. Farm labourers that are drawn to construction may contract the illness, and then
return to farm labour once the road has been completed, thereby potentially infecting further farm
labourer communities.
Secondary effects such as potential increased crime: This was expressed in much the same
terms as concerns around the link between construction and HIV/AIDS and STDs. As the number
of construction workers increases, the opportunities to destabilise community structures also
increases. Some stakeholders felt that this was likely to increase crime rates. Crime is already
seen as a major issue in some parts of the South Coast and an increase will negatively impact on
its viability as a tourist destination.
Social effects of regional economic development: Some stakeholders have come out in
support of the toll road, providing that mitigatory concessions are in place. They argue this by
saying that the economy of the region will benefit from improved access along the coast
southwards towards the Eastern Cape. Many of the stakeholders in the area south of Port
Shepstone are equally positive and argue that this will have a very positive impact on the
economic prospects of the sub-region as they will no longer be in a cul-de-sac.
Social effects of potential improved local employment: There is the potential, as indicated by
DED, for some employment in the maintenance and operations of the toll road and plazas during
the operational phase. There will also be employment opportunities during construction of the
upgrades. Although DED pointed out that there would be construction related employment, they
showed concern as to the sustainability of such employment, indicating that employment during
operations is likely to be minimal and that construction related employment is temporary.
All of these issues are investigated in more detail and the impacts associated with the issues are spelled
out and assessed. Impacts are considered by route section. Impacts are assessed with and without
mitigation.

Social Impact Assessment of the Proposed N2 Wild Coast Toll Highway
Dr. Neville Bews & Associates June 2008 vii
The various alternative routes, toll plaza locations and site specific route alignments proposed were also
all systematically investigated. These include the Coastal Mzamba and SANRAL’S preferred route as
well as the positioning of the toll plazas and various site-specific alternate route alignments in sections 3
and 6 of the route. An analysis of data gathered by means of this investigation indicated that no
significant social preference in respect of any of the alternative route alignments and toll plaza sites
emerged. Consequently, it is our considered opinion that any decision on the choice of alternative route
and toll plaza site needs to be taken on grounds other than social.
However, with regard to the site specific route alignments the following social preferences did emerge. In
the vicinity of Ntafufu Village and River there is a social preference for alignment 2f over 2a based on the
threat that alternative 2a poses to the Ntafufu Junior and Secondary Schools. These two schools were
built entirely out of community contributions and stand out as exceptional facilities that need to be
preserved. For the approach to the Msikaba River Bridge, alternative 5g4 is preferred as it represents the
lowest possible loss to arable and grazing lands as well as to access to such land in the area. Regarding
the approach to, and crossing of the Mtentu River, alternative 9e is preferred as it provides the community
with a clear advantage in terms of easier access to this crossing, which could also be facilitated by the
careful planning of community access and the location of desired walk on ramps and over– or
underpasses.
On an overall basis and from a social perspective it can be concluded that although there are a number of
negative social impacts that are typically associated with development, these impacts are specific to
various sections of the route and, to a greater extent, can be mitigated as suggested. The severity of
each of these negative impacts for those who face relocation, a disruption in livelihood or the loss of a job
cannot, however, be overestimated and this is important for the Developers to note. Nevertheless, the
project needs to be considered in its entirety across the whole route.
On this basis, the upgrading of the route between Gonubie Interchange and Mthatha is likely to vastly
improve the safety of this section of road and could lead to a reduction in serious road accidents. It must
be remembered that death and severe injury are amongst the most severe of negative social impacts and
that any significant progress in reducing injury and death will have a high and positive social impact.
Along the section between Mthatha and the Mthamvuna River, although there are negative impacts
associated with new developments in Greenfields areas, which are discussed in greater detail in the body
of the report, the overwhelming opinions of the people consulted was a need for greater access into the
area. Reasons given for this were a need to ease the burden of travel into and out of the area providing
better access to health and other services and the creation of jobs.
One of the significant obstacles across the route appears to be that which has been articulated by the
stakeholders regarding the negative impacts of tolling the section between Port Shepstone and the
Isipingo Interchange. This obstacle is associated with the availability of alternative routes, travel options,

Social Impact Assessment of the Proposed N2 Wild Coast Toll Highway
Dr. Neville Bews & Associates June 2008 viii
the economics and the political reasons for tolling. Although these issues have certain social implications
they lie more firmly within the specialist areas of traffic flow and economics where they would best be
addressed.
Although not entirely within the control of the Project Developers, the matter of capacity amongst the
various role players across the route is also of concern. Consequently, if the project were to proceed,
then it would be important for all authorities to consider the need to coordinate their efforts towards
making the project a success.
All things considered then, it is our considered opinion that the social benefits of the project as assessed
across the entire route, and if mitigated as suggested, outweigh the negative impacts, and that the N2
Wild Coast Project would be of social benefit on a National basis as well as being beneficial for both the
provinces of the Eastern Cape and KwaZulu-Natal.
Social Impact Assessment of the Proposed N2 Wild Coast Toll Highway
Dr. Neville Bews & Associates June 2008 ix
ACRONYMS ACDP African Christian Democratic Party ANC African National Congress CCA CCA Environmental (Pty) Ltd DA Democratic Alliance (South Africa)
DEAT Department of Environmental Affairs and Tourism
DED Department of Economic Development
ECSECC Eastern Cape Socio-Economic Consultative Council
EDP eThekwini Development and Planning EIA Environmental Impact Assessment EM eThekwini Municipality EMA eThekwini Municipal Area ETA eThekwini Transport Authority GDPR Gross Domestic Product per Region HDI Human Development Index IDP Integrated Development Plan IFP Inkatha Freedom Party MF Minority Front MPCC Multi Purpose Community Centre NBA Dr Neville Bews & Associates NGO Non-Governmental Organisation PGDP Provincial Growth and Development Plan RPF Resettlement Policy Framework SAB South African Breweries SANRAL South African National Road Agency Limited SCCC South Coast Chamber of Commerce SIA Social Impact Assessment STDs Sexually Transmitted Diseases SMME Small, Medium and Micro-Enterprise UDM United Democratic Movement (South Africa) USCATA Upper South Coast Anti Toll Alliance VCT Voluntary Counselling and Testing
Social Impact Assessment of the Proposed N2 Wild Coast Toll Highway
Dr. Neville Bews & Associates June 2008 x
DETAILS AND EXPERIENCE OF INDEPENDENT SOCIAL IMPACT ASSESSMENT CONSULTANT
Consultant: Dr Neville Bews & Associates
Contact person: Neville Bews
Physical address: 84 Hennie Alberts Street, Brackenhurst Alberton
Postal address: P O Box 145412, Bracken Gardens, Alberton, 1452
Telephone: +27 11 867-0462
Mobile: +27 82 557-3489
Fax: +27 11 867-1915
Email: [email protected]
Neville Bews has consulted extensively and lectured in the field of Social Impact Assessments. Some of the
projects completed by Neville include the Gautrain Rapid Rail Link SIA, Australian – South African sports
development programme impact, Kumba Resources Sishen South Project SIA, The United Nations Office on
Drugs and Crime evaluation of a Centre for Violence Against Women, SIAs at Leeuwpan Coal Mine Delmas,
Glen Douglas Dolomite Mine Henely-on-Klip, Grootegeluk Open Cast Coal Mine, SANRAL – Impact of tolling
the Gauteng Highway System, University of Johannesburg – Research into research outputs of the
University, the social impact for Waterfall Wedge housing and business development in Midrand Gauteng,
the social impact for the Environmental Management Plan for Sedibeng District Municipality.
Neville regularly lectures as a guest lecturer in the department of sociology at both the Universities of
Johannesburg and Pretoria. At the University of Johannesburg he collaborated with Prof. Henk Becker of
Utrecht University, the Netherlands in a joint lecture to present the Social Impact Assessment masters course
via video link between the Netherlands and South Africa. Neville has also presented papers on Social Impact
Assessments at both national and international seminars and has published widely at both a national and
international level.
1980: BA (Psychology & Sociology) Unisa
1984: BA (Hons) (Sociology) Unisa
1994: Post-Graduate Certificate in Management. Henley Management College, United Kingdom
1999: MA (cum laude), Rand Afrikaans University
2000: D. Litt. et Phil., Rand Afrikaans University
DECLARATION OF CONSULTANT’S INDEPENDENCE
Dr. N. F. Bews is an independent consultant to CCA Environmental (Pty) Ltd and has no business, financial,
personal or other interest in the activity, application or appeal in respect of which he was appointed other than
fair remuneration for work performed in connection with the activity, application or appeal. There are no
circumstances whatsoever that compromise the objectivity of this specialist performing such work.
Social Impact Assessment of the Proposed N2 Wild Coast Toll Highway
Dr. Neville Bews & Associates June 2008 xi
Consultant: Dr. Neville Bews and Associates
Contact person: Jeffrey Zingel
Physical address: 239 Celliers Street Muckleneuk Pretoria 0002
Telephone: 012 3624684
Email: [email protected]
Jeff Zingel is an independent applied social scientist with extensive research, policy development and
implementation experience across all the key development sectors. He was engaged on the St Lucia Mining
SIA, and has designed and undertaken evaluations in Pondoland and the Eastern Cape for the European
Union and the National Treasury. He has worked extensively with donors including the World Bank (Country
paper on services delivery), EU (S.A social sector strategy planning; 2007-2013), the ILO (Local economic
and enterprise development, rural accessibility planning), the FAO (farm labour in South Africa and Ghana),
DFID/IIED (developmental forestry), DANIDA (water services), the Commission for Africa and Nepad (social
services) and Dutch donors (HIV/AIDS in local government). Work for national departments has included the
DPLG (Led policy), DWAF (sanitation), Land Affairs/Agriculture (Land Reform). He has also engaged with
metropolitan authorities on comparative city water pricing and with provincial and local government on issues
in best practice in local government.
Jeff’s work has been published on web pages (IIED, FAO,) and in books (CSIR:St Lucia, IIED).
1977: B Soc. Science (Anthropology and African Government). Natal
1984: Hons. Applied Social Sciences. Natal
1987: M Sc. (Econ). Development Planning Unit. University of London.
DECLARATION OF CONSULTANT’S INDEPENDENCE
Mr. J. G. Zingel is an independent consultant to CCA Environmental (Pty) Ltd and has no business, financial,
personal or other interest in the activity, application or appeal in respect of which he was appointed other than
fair remuneration for work performed in connection with the activity, application or appeal. There are no
circumstances that compromise the objectivity of this specialist performing such work.
Social Impact Assessment of the Proposed N2 Wild Coast Toll Highway
Dr. Neville Bews & Associates June 2008 xii
Consultant: Greg Huggins – Water for Africa
Contact person: Greg Huggins
Physical address: Harvest Moon Farm, Nottingham Road
Postal address: P O Box 147, Nottingham Road, 3280
Telephone: 0824604247
Fax: 033 2666944
Email: [email protected]
Greg Huggins is a Director of WFA and has 18 years of consultancy experience. Greg trained as a Social
Anthropologist but specialises in Social Impact Assessments, Socio-economic Survey Research,
Resettlement and Sustainable Development planning, Socio-economic Analysis and Applied Research. He is
registered with the IMF (World Bank and IFC), the United Nations and the African Development Bank and
has undertaken consultancies reporting to these bodies. He has consulted in South Africa, Lesotho,
Botswana, Kenya, Tanzania, Mozambique, Zambia, Zimbabwe, Malawi, Cameroon and the Philippines.
Greg’s recent experience has largely been in the water and mining sectors but he has managed multi-
disciplinary teams on a variety of contracts. Greg has lectured at both the University of Cape Town (UCT) (in
a full time capacity) and at the University of Natal (UNP) (as a guest lecturer). Greg has taught courses in
Social Impact Assessment to masters level students in Anthropology (at UCT) and to Environmental
Management students (at UCT and UNP). Greg is well know in sailing circles as something of a poseur who
insists on putting in a reef even in gentle breezes.
1983: B.Soc. Sc: University of Natal (Durban). Majors in Social Anthropology and Psychology.
1984: Soc.Sc (Hons): University of Natal (Durban). Honours degree in Social Anthropology
1993: M. Soc. Sc.: University of Cape Town: Masters degree in Social Anthropology
Member of International Association of Impact Assessors (SA).
DECLARATION OF CONSULTANT’S INDEPENDENCE
Mr. G. B. Huggins is an independent consultant to CCA Environmental (Pty) Ltd and has no business,
financial, personal or other interest in the activity, application or appeal in respect of which he was appointed
other than fair remuneration for work performed in connection with the activity, application or appeal. There
are no circumstances that compromise the objectivity of this specialist performing such work.

Social Impact Assessment of the Proposed N2 Wild Coast Toll Highway
Dr. Neville Bews & Associates June 2008 xiii
Consultant: Ms Maura Andrew
Physical address: Coastal & Environmental Services,
67 African Street, Grahamstown, 6139
Postal address: P O Box 934, Grahamstown, 6140
Telephone: +27 46 622 2364
Mobile: +27 72 386 0537
Fax: +27 46 622 6564
Email: [email protected]
Maura Andrew is a skilled and experienced public facilitator and socio-economic scientist with over ten years
of experience in the Eastern Cape and other African Countries. She has BA Honours degrees in Human
Geography and in Economics and a Masters Degree in Geography with distinction. Her Masters Thesis
focused on land use and agricultural change in the former Transkei between 1920 and the 1980s. She is a
former lecturer in Environmental Science at Rhodes University and has conducted numerous social,
economic, rural livelihood and resource utilisation studies in South Africa and other countries such as Malawi,
Mozambique and Madagascar. She has been employed as a full time CES senior consultant for three years
and has had a long association with the firm through numerous sub-consultant assignments prior to joining
the staff. While in CES’s employ she has worked on a number of projects, including Strategic Environmental
Assessments (SEAs) for the Wavecrest Mining Option (on the former Transki Wild Coast), the Greater Addo
Elephant National Park, Water Management Area 12 in the Eastern Cape (investigating Afforestation
potential), and the Ngqushwa and Amahlati Local Municipalities. Maura has also headed up the CES
Stakeholder Engagement Team for the Knysna N2 Toll Highway EIA which has registered over 1000
Interested and Affected Parties in the Scoping Process. Her duties have also included qualitative and
quantitative socio-economic surveys and monitoring, Social Impact Assessments for a variety of development
projects, and the development of Resettlement Action Plans (as per IFC guidelines) for projects in South
Africa and Mozambique. She has also recently gained skills and experience in conducting Economic Impact
Assessments and has undertaken studies of large sand mining projects in Madagascar, Mozambique, and
Egypt.
1986: BA Degree (Sociology and Economics) (Rhodes University)
1989: BA Honours Degree with distinction in Geography. (Rhodes University)
1992: Master of Arts Degree in Geography with distinction (Rhodes University).
2006: BA Honours Degree in Economics.
DECLARATION OF CONSULTANT’S INDEPENDENCE
Ms Maura Andrew is an independent consultant to CCA Environmental (Pty) Ltd and has no business,
financial, personal or other interest in the activity, application or appeal in respect of which he was appointed
other than fair remuneration for work performed in connection with the activity, application or appeal. There
are no circumstances that compromise the objectivity of this specialist performing such work.

Social Impact Assessment of the Proposed N2 Wild Coast Toll Highway
Dr. Neville Bews & Associates June 2008 xiv
TABLE OF CONTENTS
1. INTRODUCTION............................................................................................................................. 1 1.1. Project description........................................................................................................................... 1 1.2. Terms of reference........................................................................................................................ 13 2. METHODOLOGY .......................................................................................................................... 14 2.1. Research techniques .................................................................................................................... 16 2.1.1. Gonubie Interchange to Mthatha (Ngqeleni)................................................................................. 16 2.1.2. Mthatha (Ngqeleni) to Mthamvuna River ...................................................................................... 17 2.1.3. Mthamvuna River to Isipingo Interchange .................................................................................... 20 2.2. Assessment of social impacts ....................................................................................................... 20 2.2.1. Social impact assessment technique............................................................................................ 20 2.3. Assumptions and Limitations ........................................................................................................ 23 3. SOCIAL DESCRIPTION OF THE AREA....................................................................................... 25 3.1. Provincial description .................................................................................................................... 25 3.1.1. Eastern Cape Province ................................................................................................................. 27 3.1.1.1. District and municipal description.................................................................................................. 33 3.1.2. KwaZulu-Natal............................................................................................................................... 36 3.1.2.1. District and municipal description.................................................................................................. 41 3.2. Route specific description ............................................................................................................. 45 3.2.1. Section 1 – 2 Gonubie to Mthatha section .................................................................................... 46 3.2.2. Section 3 – Mthatha to Ndwalane ................................................................................................. 68 3.2.3. Section 4 – Ndwalane to Ntafufu River ......................................................................................... 77 3.2.4. Section 5 – Ntafufu River to Lusikisiki........................................................................................... 81 3.2.5. Section 6 – Lusikisiki (Magwa Intersection) to the Mthamvuna River........................................... 91 3.2.6. Section 7 – Mthamvuna River to Isipingo Interchange ............................................................... 104 4. SOCIAL IMPACTS ...................................................................................................................... 123 4.1. Major issues raised ..................................................................................................................... 123 4.1.1. Resettlement ............................................................................................................................... 123 4.1.2. Access issues.............................................................................................................................. 125 4.1.3. Health and safety ........................................................................................................................ 128 4.1.4. Job creation and income potential .............................................................................................. 130 4.1.5. Economic impact of toll ............................................................................................................... 131 4.1.6. Ribbon development along the N2.............................................................................................. 133 4.1.7. Increase in noise levels............................................................................................................... 133 4.1.8. Secondary effects such as potential increased crime................................................................. 134 4.1.9. Residual section specific issues.................................................................................................. 134 4.2. Impacts identified and assessed................................................................................................. 136 4.2.1. Increased regional economic development. ............................................................................... 137 4.2.2. Increased employment opportunities .......................................................................................... 141 4.2.3. Increased SMME opportunities ................................................................................................... 146 4.2.4. Improved safety for vehicle road users ....................................................................................... 150 4.2.5. Increased cost of doing business and concomitant loss of income............................................ 153 4.2.6. Increased cost of accessing services and employment for marginal communities .................... 156 4.2.7. Increased cost of accessing services and employment for advantaged communities ............... 159 4.2.8. The reduction of access points onto the highway....................................................................... 160 4.2.9. Increase in noise levels............................................................................................................... 162 4.2.10. Increase in health risks and traffic generated pollutants............................................................. 166 4.2.11. Increased safety hazards for pedestrians and traffic .................................................................. 170 4.2.12. Increased HIV/AIDS and STD risks associated with construction gangs and increased truck traffic
........................................................................................................................................ 174 4.2.13. Secondary effects such as potential increased crime................................................................. 178 4.2.14. Construction related traffic delays and traffic accommodation ................................................... 181 4.2.15. Potential increase in tensions in the taxi industry ....................................................................... 184 4.2.16. Improvement in local traffic congestion within the towns through which the highway passes ... 186 4.2.17. Improved livestock safety............................................................................................................ 188 4.2.18. Loss of use of the existing road reserve to local communities ................................................... 190 4.2.19. Resettlement of affected households.......................................................................................... 193 4.2.20. Loss of land for ‘host communities’ due to resettlement............................................................. 199 4.2.21. The allocation of arable land to displaced households (residential) ........................................... 202 4.2.22. Rural severance effects .............................................................................................................. 203

Social Impact Assessment of the Proposed N2 Wild Coast Toll Highway
Dr. Neville Bews & Associates June 2008 xv
4.2.23. Urban severance effects ............................................................................................................. 206 4.2.24. Loss and disturbance of sites of cultural, spiritual or religious significance................................ 207 4.2.25. Uncontrolled ribbon development ............................................................................................... 210 4.2.26. Improvement in transport within the area.................................................................................... 212 4.2.27. Visual impact and disruption of sense of place........................................................................... 215 4.2.28. Increased congestion on non toll roads and at critical access points ......................................... 217 4.2.29. Effect of construction workers and job seekers on existing family networks and social structures..
........................................................................................................................................ 218 4.2.30. Impacts on towns on the current N2 that will be bypassed......................................................... 220 4.2.31. Assessment of alternatives ......................................................................................................... 222 4.2.31.1. Coastal Mzamba and SANRAL’S preferred route..................................................................... 222 4.2.31.2. Alternative toll plazas ................................................................................................................ 225 4.2.31.3. Site –specific alternate route alignments .................................................................................. 226 4.2.31.4. “Do nothing” alternative ............................................................................................................. 230 5. DISCUSSION .............................................................................................................................. 232 5.1. Resettlement and compensation ................................................................................................ 233 5.2. Labour issues.............................................................................................................................. 234 5.2.1 Contract labour force ................................................................................................................... 236 5.2.2. Involvement of the Department of Labour................................................................................... 236 5.2.3. Design of contractor tender requirements................................................................................... 237 5.2.4. Operational labour force.............................................................................................................. 238 5.3. Sustainability and community empowerment.............................................................................. 239 5.3.1. Specific empowerment projects .................................................................................................. 241 5.3.1.1. Access roads and infrastructure.................................................................................................. 241 5.3.1.2. Women’s empowerment projects ................................................................................................ 242 5.3.1.3. Community development projects ............................................................................................... 242 5.3.1.4. Health projects............................................................................................................................. 242 5.4. Road safety education ................................................................................................................ 243 5.5. Issues concerning the tolling of roads......................................................................................... 244 5.6. Local government capacity limitations ........................................................................................ 246 5.6.1. Illegal grazing .............................................................................................................................. 247 5.6.2. Development ............................................................................................................................... 247 5.6.3. Enforcing legislation and traffic safety ........................................................................................ 248 5.7. ‘Do nothing option’ ...................................................................................................................... 248 6. CONCLUSION............................................................................................................................. 249 7. REFERENCES............................................................................................................................ 252

Social Impact Assessment of the Proposed N2 Wild Coast Toll Highway
Dr. Neville Bews & Associates June 2008 xvi
LIST OF TABLES Table 3.1: Unemployment rate (expanded definition) by gender and race in 2001 for South Africa,
Eastern Cape Province and the two districts affected by the proposed development..... 30 Table 3.2: Income distribution in South Africa and its nine provinces in 2001.................................. 31 Table 3.3: Comparison of poverty indicators, 1996 and 2001 in the Eastern Cape and its six districts
................................................................................................................................. 31 Table 3.4: Number and percentage of households in the wards dissected by the proposed highway
or adjacent to it between Gonubie and Mthatha having access to various water sources .. ................................................................................................................................. 34
Table 3.5: Changes in access to various types of water resources in the Eastern Cape Province, the O.R. Tambo District and its local municipalities ............................................................... 35
Table 3.6: Percentage of households using various sources of power for lighting in the Eastern Cape Province and O.R. Tambo District in 2001 and 2006 ............................................. 35
Table 3.7: Number and percentage of persons in each education category in the wards dissected by the proposed highway or adjacent to it............................................................................. 36
Table 3.8: Census 2001 by KwaZulu-Natal District Council, sex and population group................... 37 Table 3.9.: Unemployment rate (expanded definition) by gender and race in 2001 for South Africa,
Province of KwaZulu-Natal and the two districts affected by the proposed development 40 Table 3.10: Number of rural communal settlements between Gonubie and Mthatha......................... 47 Table 3.11: Annual household Income in 2001 for the population living in the wards along the
proposed Wild Coast Toll Highway between Gonubie and Mthatha................................ 56 Table 3.12: Summary of the number of different types of accesses observed along the section of the
N2 from the Kei River to Mthatha in August 2007............................................................ 64 Table 3.13: Average daily number of vehicles in 2006 ....................................................................... 67 Table 3.14: Annual household income in 2001 for the population living in the wards along the
proposed Wild Coast Toll Highway between Port Edward and Isipingo ........................ 108 Table 3.15: Number and percentage of households in the wards dissected by the proposed highway
or adjacent to it between Port Edward and Isipingo that have access to various water sources ........................................................................................................................... 114
Table 4.1: Increased regional economic development.................................................................... 141 Table 4.2: Increased employment opportunities ............................................................................. 146 Table 4.3: Increased SMME opportunities ...................................................................................... 150 Table 4.4: Improved safety for vehicle road users .......................................................................... 153 Table 4.5: Increased cost of doing business and concomitant loss of income ............................... 156 Table 4.6: Increased cost of accessing services and employment for marginal communities ....... 158 Table 4.7: Increased cost of accessing services and employment for advantaged communities .. 160 Table 4.8: The reduction of access points onto the highway .......................................................... 162 Table 4.9: Increase in noise levels .................................................................................................. 166 Table 4.10: Increase in health risks and traffic generated pollutants ................................................ 169 Table 4.11: Increased safety hazards for pedestrians and traffic ..................................................... 173 Table 4.12: Increased HIV/AIDS and STD risks associated with construction gangs and increased
truck traffic ...................................................................................................................... 177 Table 4.13: Secondary effects such as potential increased crime.................................................... 181 Table 4.14: Construction related traffic delays and traffic accommodation ...................................... 184 Table 4.15: Potential increase in tensions in the taxi industry .......................................................... 186 Table 4.16: Improvement in local traffic congestion within the towns through which the highway
passes ............................................................................................................................ 188 Table 4.17: Improved livestock safety ............................................................................................... 190 Table 4.18: Loss of use of the existing road reserve to local communities....................................... 193 Table 4.19: Resettlement of affected households............................................................................. 198 Table 4.20: Loss of land for ‘host communities’ due to resettlement ................................................ 201 Table 4.21: The allocation of arable land to displaced households (residential) .............................. 203 Table 4.22: Rural severance effects.................................................................................................. 206 Table 4.23: Urban severance effects ................................................................................................ 207 Table 4.24: Loss and disturbance of sites of cultural, spiritual or religious significance................... 210 Table 4.25: Uncontrolled ribbon development................................................................................... 212 Table 4.26: Improvement in transport provision to the area.............................................................. 214 Table 4.27: Visual impact and disruption of sense of place .............................................................. 216 Table 4.28: Increased congestion on non toll roads and at critical access points ............................ 218 Table 4.29: Effect of construction workers and job seekers on existing family networks and social
structures........................................................................................................................ 220

Social Impact Assessment of the Proposed N2 Wild Coast Toll Highway
Dr. Neville Bews & Associates June 2008 xvii
Table 4.30: Impact on bypassed town............................................................................................... 222 Table 4.31: Social impacts of do nothing alternative......................................................................... 231
LIST OF FIGURES
Figure 1.1: Proposed N2 Wild Coast Toll Highway route between Gonubie Interchange (Eastern Cape) and Isipingo Interchange (KwaZulu-Natal) ............................................................................. 2
Figure 1.2: Section 1 – Gonubie Interchange to Ngobozi ........................................................................... 4 Figure 1.3: Section 2 – Ngobozi to Mthatha (Ngqeleni) .............................................................................. 5 Figure 1.4: Section 3 – Mthatha (Ngqeleni) to Ndwalane ........................................................................... 6 Figure 1.5: Section 4 – Ndwalane to Ntafufu River ..................................................................................... 7 Figure 1.6: Section 5 – Ntafufu River to Lusikisiki (Magwa Intersection).................................................... 8 Figure 1.7: Section 6 – (Magwa Intersection) to Mthamvuna River ............................................................ 9 Figure 1.8: Section 7 – Mthamvuna River to Isipingo Interchange ........................................................... 10 Figure 1.9: Detailed Section – Pennington to Durban............................................................................... 11 Figure 1.10: Alternative Greenfields alignments – Lusikisiki and Mthamvuna River ................................ 12 Figure 3.1: District and local municipal boundaries across the route........................................................ 26 Figure 3.2: Population density across the route........................................................................................ 27 Figure 3.3: Percentage unemployment across the proposed route .......................................................... 45 Figure 3.4: Annual household income across the proposed route............................................................ 46 Figure 3.5: Schools and clinics along section 1 ........................................................................................ 48 Figure 3.6: Schools and clinics along section 2 ........................................................................................ 49 Figure 3.7: Population density per km2 local wards section 1 .................................................................. 52 Figure 3.8: Population density per km2 local wards section 2 .................................................................. 53 Figure 3.9: Annual household income wards section 2............................................................................. 57 Figure 3.10: Household income local wards section 2.............................................................................. 58 Figure 3.11: Percentage unemployment local wards section 1................................................................. 59 Figure 3.12: Percentage unemployment local wards section 2................................................................. 60 Figure 3.13: Percentage of population >20 with no schooling wards section 1 ........................................ 61 Figure 3.14: Percentage of population >20 with no schooling wards section 2 ......................................... 62 Figure 3.15: Schools and clinics along section 3 ...................................................................................... 69 Figure 3.16: Population density per km2 local wards section 3 ................................................................ 71 Figure 3.17: Female to male ratio local wards section 3........................................................................... 72 Figure 3.18: Percentage population >20 with no schooling local wards section 3.................................... 73 Figure 3.19: Household with piped water onsite local wards section 3..................................................... 74 Figure 3.20: Percentage unemployment local wards section 3................................................................. 75 Figure 3.21: Annual household income local wards section 3 .................................................................. 76 Figure 3.22: Schools and clinics local wards along sections 4 & 5........................................................... 82 Figure 3.23: Female to male ratio local wards sections 4 & 5................................................................... 84 Figure 3.24: Population density per km2 local wards sections 4 & 5........................................................ 85 Figure 3.25: Annual household income wards section sections 4 & 5...................................................... 86 Figure 3.26: Annual household income local wards sections 4 & 5.......................................................... 87 Figure 3.27: Percentage unemployment local wards sections 4 & 5 ........................................................ 88 Figure 3.28: Households with piped water onsite local wards sections 4 & 5........................................... 89 Figure 3.29: Schools and clinics local wards along section 6 ................................................................... 92 Figure 3.30: Population density local wards along section 6 .................................................................... 98 Figure 3.31: female to male ratio local wards along section 6 .................................................................. 99 Figure 3.32: Percentage population >20 with no schooling local wards along section 6........................ 100 Figure 3.33: Percentage unemployed local wards along section 6......................................................... 101 Figure 3.34: Households with piped water local wards along section 6.................................................. 102 Figure 3.35: Annual household income local wards along section 6 ...................................................... 103 Figure 3.36: Segment of section 7 of route from the Mthamvuna River to north of Port Shepstone ...... 106 Figure 3.37: Segment of section 7 of route from north of Port Shepstone to Isipingo Interchange........ 107 Figure 3.38: female to male ratio local wards along section 6 ................................................................ 109 Figure 3.39: Schools and clinics local wards along section 7 ................................................................. 110 Figure 3.40: Annual household income local wards along section 7 ...................................................... 111 Figure 3.41: Percentage population >20 with no schooling local wards along section 7........................ 112 Figure 3.42: Percentage unemployed local wards along section 7......................................................... 113 Figure 3.43: Percentage unemployed local wards along section 7......................................................... 115 Figure 3.44: Annual household income local wards along section 7 ...................................................... 116

Social Impact Assessment of the Proposed N2 Wild Coast Toll Highway
Dr. Neville Bews & Associates June 2008 xviii
LIST OF HISTOGRAMS
Histogram 3.1: 2001 and 1998 Population data for the Eastern Cape Province and its six districts ....... 29 Histogram 3.2: Kwazulu-Natal’s broad sectoral profile 2000 .................................................................... 38 Histogram 3.3: The National Sectoral profile 2001 ................................................................................... 39
LIST OF PLATES
Plate 3 1: Rural settlements and dwellings adjacent to the existing N2 between Mthata and the Kei River, that may be affected by the widening of the road reserve associated with the proposed toll highway development ............................................................................................................... 50
Plate 3.2: Pedestrians and taxis along the route....................................................................................... 64 Plate 3.3: Butterworth where major safety and traffic flow upgrades are proposed ................................. 66 Plate 3.4: iDutywa where major safety and traffic flow upgrades are proposed, including the construction
of a second carriageway. .......................................................................................................... 66 Plate 3.5: Ntafufu Village, Ntafufu River and local access road................................................................ 80 Plate 3.6: Section of the existing N2 close near Park Rynie................................................................... 104 Plate 3.7: The proposed location of ramp toll plazas at the Pennington Interchange............................. 121 Plate 4.1: Children observed along the route.......................................................................................... 129 Plate 4.2: Free roaming animals observed along the route .................................................................... 129

Social Impact Assessment of the Proposed N2 Wild Coast Toll Highway
Dr. Neville Bews & Associates June 2008 1
1. INTRODUCTION
Over the last few years various considerations have been given to upgrading existing sections of the N2
and R61 routes and to construct new sections of road linking East London in the Eastern Cape with
Durban in KwaZulu-Natal. A more detailed background to recent developments in this regard, as well as a
description of the intended route over which these developments will take place is provided below.
In 2000 the N2 Wild Coast Consortium was awarded ‘Scheme Developer Status’ for the design, financing,
operation and maintenance of a section of the N2 route between East London and Durban. This status
was awarded after The Consortium had submitted an Unsolicited Bid for the project to the South African
National Road Agency Limited (SANRAL). In February 2003, Bohlweki Environmental (Pty) Ltd, on behalf
of SANRAL and The Consortium, and after undertaking an Environmental Impact Assessment (EIA),
lodged the final EIA report with the Department of Environmental Affairs and Tourism (DEAT). On 03
December 2003 DEAT issued a positive Record of Decision for what was by then referred to as the N2
Wild Coast Toll Highway Project. However, on 09 December 2004, following numerous appeals from the
public and various Non-Governmental Organisations (NGOs), the Minister of Environmental Affairs and
Tourism set aside his Department’s earlier decision authorising the development of the N2 Wild Coast
Toll Highway. In setting aside this decision The Minister did not preclude any new application being
lodged with his Department. Accordingly, SANRAL has embarked on a new process of reapplying for
environmental authorisation as stipulated under the EIA Regulations, promulgated under section 21, 22
and 26 of the Environment Conservation Act 73 of 1989. Towards this end SANRAL has appointed CCA
Environmental (Pty) Ltd (CCA) as the lead environmental consultant, responsible for the EIA, and Dr
Neville Bews & Associates (NBA) as the consultant responsible for the Social Impact Assessment (SIA).
The Social Impact Assessment prepared by NBA addresses the social aspects of the project in a report
consisting of 4 sub-sections. The first of these sub-sections serves as an introduction to the study
covering such issues as the project description, methodology as well as the assumptions and limitations
of the study. Section 2 addresses existing baseline social conditions, firstly at a more general provincial
level (Eastern Cape and KwaZulu-Natal) then moving on to a more specific level along the 7 sections of
the route. In section 3 the key social issues identified during the study are listed and assessed while in
section 4 a summary of the significant findings and recommendations is presented. Attention will now be
turned towards a brief description of the project. 1.1. Project description
The study area extends, for a distance of approximately 559.5 km, along existing sections of the N2 and
R61 routes and in certain Greenfields sections between Gonubie Interchange near East London in the
Eastern Cape Province and Isipingo Interchange south of Durban in the Province of KwaZulu-Natal. An
overview of this route, illustrating existing roads, sections of proposed toll highway, Greenfields sections,
existing and proposed toll plaza locations as well as the various towns along the route is provided below
in Figure 1.1.
Social Impact Assessment of the Proposed N2 Wild Coast Toll Highway
Dr. Neville Bews & Associates June 2008 2
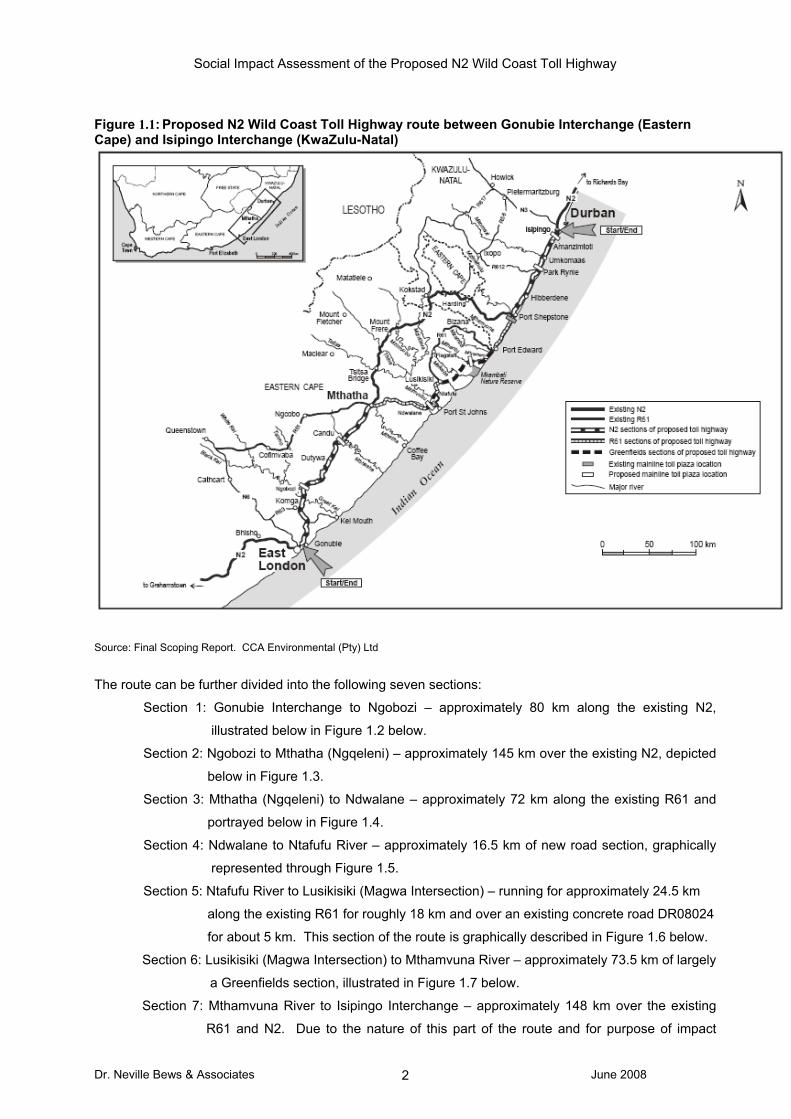
Figure 1.1: Proposed N2 Wild Coast Toll Highway route between Gonubie Interchange (Eastern Cape) and Isipingo Interchange (KwaZulu-Natal)
Source: Final Scoping Report. CCA Environmental (Pty) Ltd
The route can be further divided into the following seven sections:
Section 1: Gonubie Interchange to Ngobozi – approximately 80 km along the existing N2,
illustrated below in Figure 1.2 below.
Section 2: Ngobozi to Mthatha (Ngqeleni) – approximately 145 km over the existing N2, depicted
below in Figure 1.3.
Section 3: Mthatha (Ngqeleni) to Ndwalane – approximately 72 km along the existing R61 and
portrayed below in Figure 1.4.
Section 4: Ndwalane to Ntafufu River – approximately 16.5 km of new road section, graphically
represented through Figure 1.5.
Section 5: Ntafufu River to Lusikisiki (Magwa Intersection) – running for approximately 24.5 km
along the existing R61 for roughly 18 km and over an existing concrete road DR08024
for about 5 km. This section of the route is graphically described in Figure 1.6 below.
Section 6: Lusikisiki (Magwa Intersection) to Mthamvuna River – approximately 73.5 km of largely
a Greenfields section, illustrated in Figure 1.7 below.
Section 7: Mthamvuna River to Isipingo Interchange – approximately 148 km over the existing
R61 and N2. Due to the nature of this part of the route and for purpose of impact

Social Impact Assessment of the Proposed N2 Wild Coast Toll Highway
Dr. Neville Bews & Associates June 2008 3
assessment this section has been subdivided into two further segments. The first of
these subsections stretches between the Mthamvuna River and Port Shepstone, is
more rural in nature, and is labelled 7a. The second, between Port Shepstone and
Isipingo Interchange, is more urban and is labelled 7b for purposes of impact
assessment. While Figure 1.8 provides an indication of the whole of this section of the
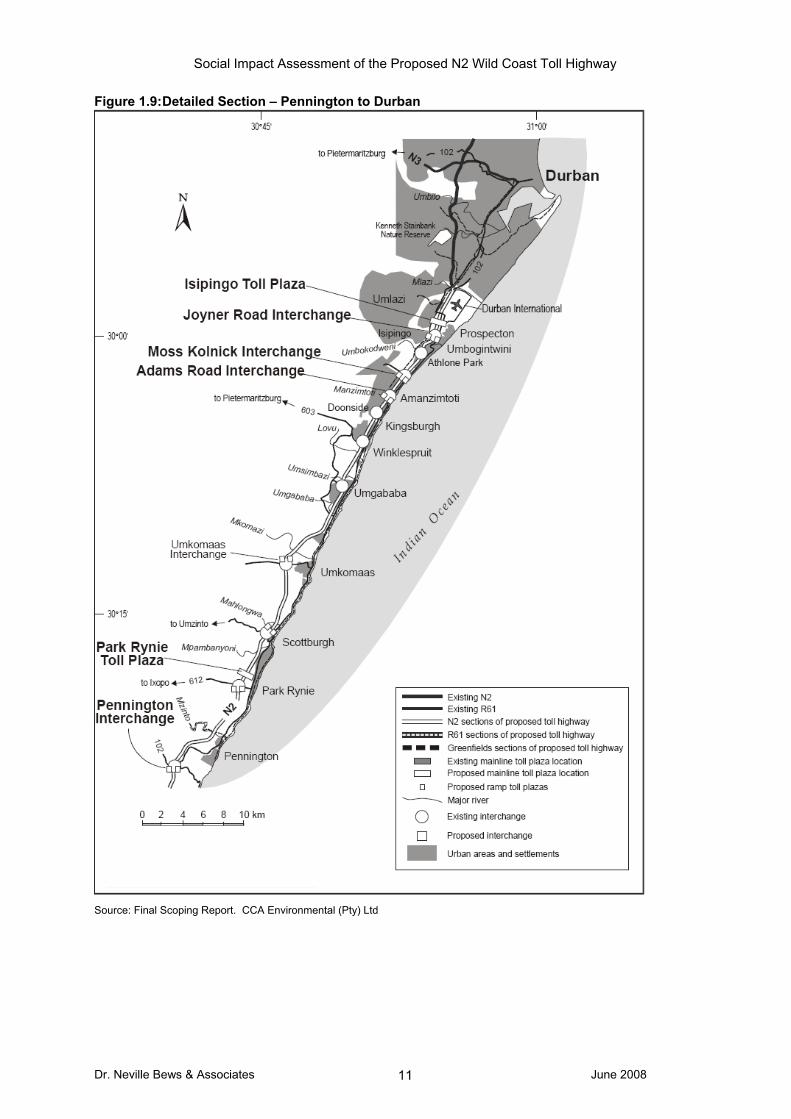
route, Figure 1.9 gives a more detailed illustration of the more urban section stretching
between Pennington and Durban.
Various alternative Greenfields routes between Lusikisiki and the Mthamvuna River were also proposed.
These include the Coastal Mzamba and SANRAL’s preferred route illustrated below in Figure 1.10. The
Coastal Mzamba route follows SANRAL’s preferred alignment from Lusikisiki to north-east of the Mthentu
River crossing. From there it continues at a distance of between 11 and 16 km inland to a point east of
Makwanteni. Thereafter it is aligned between the Mpahlane and Mzamba rivers with the coast. It then
joins SANRAL’s preferred route south of the proposed crossing of the Mzamba River by enlarge following
SANRAL’s preferred alignment to the Mthamvuna River crossing.
Two alternative toll plaza siting and various site-specific route alignments were also proposed in sections
3 and 6 of the route. These include the alternative toll plazas in the vicinity of the Ntlaza Mission, near
the Tutor Ndamase Pass close to Thaleni, as illustrated in Figure 1.4, as opposed to the current proposed
location at Ndwalane and indicated in Figure 1.5. There is also the proposed location of an alternative toll
plaza is in the vicinity of the proposed intersection with the Holy Cross/Mkambati road, as opposed to the
current proposal for the Mthentu Toll Plaza in the Amadiba area illustrated in Figure 1.7.
The alternative site-specific alignments include:
• 1b and 1e between Ndwalane (R61) and the Mzimvubu River.
• 2a and 2f in the vicinity of the Ntafufu village and Ntafufu River.
• 5g, 5e and 5g4 at the diversion from the gravel road, approximately 12,5 km east of Lusikisiki and
the Msikaba River for the approach to the Msikaba bridge crossing site.
• 9e and 9d5 for the proposed alignment across the Mthentu River.
• 10a, 10c, and 10 e for the proposed alignment across the Mnyameni River.
• 5g for the approach to the Msikaba River Bridge
• 5e following the existing gravel road and deviating ahead of alternative 5g above, prior to reaching
Ntlamvukasi village.
• 5g4 follows the existing gravel road and deviating ahead of Alternatives 5g and 5e prior to reaching
Ntlamvukasi village.
• 9e and 9d5 for the approach to and crossing points across the Mtentu River.
• 10a crosses the Mnyameni River directly above the Mnyameni Waterfall.
• 10b crosses the Mnyameni and its tributary approximately 500 m above the Mnyameni Waterfall,
close to a number of sandstone caves with rock paintings.
• 10c crosses the Mnyameni River and its tributary further upstream than the preceding alternatives.
Social Impact Assessment of the Proposed N2 Wild Coast Toll Highway
Dr. Neville Bews & Associates June 2008 4
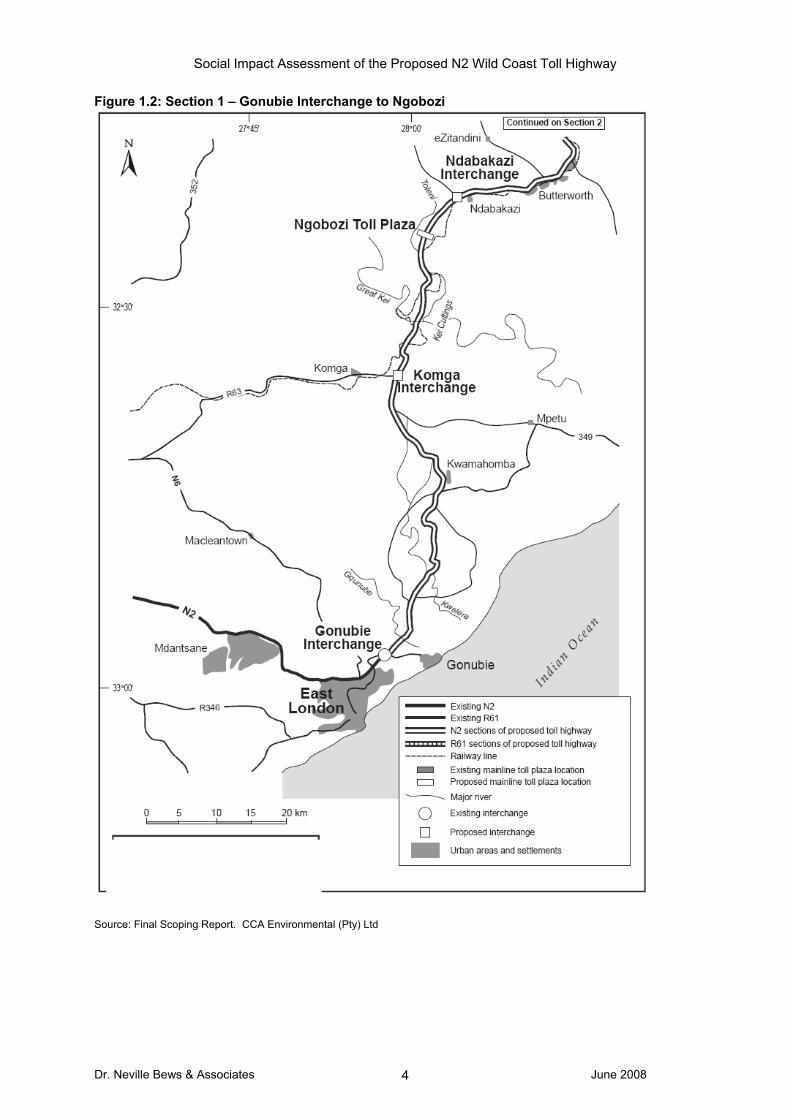
Figure 1.2: Section 1 – Gonubie Interchange to Ngobozi
Source: Final Scoping Report. CCA Environmental (Pty) Ltd

Social Impact Assessment of the Proposed N2 Wild Coast Toll Highway
Dr. Neville Bews & Associates June 2008 5
Figure 1.3: Section 2 – Ngobozi to Mthatha (Ngqeleni)
Source: Final Scoping Report. CCA Environmental (Pty) Ltd
Social Impact Assessment of the Proposed N2 Wild Coast Toll Highway
Dr. Neville Bews & Associates June 2008 6
Figure 1.4: Section 3 – Mthatha (Ngqeleni) to Ndwalane
Source: Final Scoping Report. CCA Environmental (Pty) Ltd

Social Impact Assessment of the Proposed N2 Wild Coast Toll Highway
Dr. Neville Bews & Associates June 2008 7
Figure 1.5: Section 4 – Ndwalane to Ntafufu River
Source: Final Scoping Report. CCA Environmental (Pty) Ltd
Social Impact Assessment of the Proposed N2 Wild Coast Toll Highway
Dr. Neville Bews & Associates June 2008 8
Figure 1.6: Section 5 – Ntafufu River to Lusikisiki (Magwa Intersection)
Source: Final Scoping Report. CCA Environmental (Pty) Ltd
•
Social Impact Assessment of the Proposed N2 Wild Coast Toll Highway
Dr. Neville Bews & Associates June 2008 9
Figure 1.7: Section 6 – (Magwa Intersection) to Mthamvuna River
Source: Final Scoping Report. CCA Environmental (Pty) Ltd
Social Impact Assessment of the Proposed N2 Wild Coast Toll Highway
Dr. Neville Bews & Associates June 2008 10
Figure 1.8: Section 7 – Mthamvuna River to Isipingo Interchange
Source: Final Scoping Report. CCA Environmental (Pty) Ltd
Social Impact Assessment of the Proposed N2 Wild Coast Toll Highway
Dr. Neville Bews & Associates June 2008 11
Figure 1.9: Detailed Section – Pennington to Durban
Source: Final Scoping Report. CCA Environmental (Pty) Ltd

Social Impact Assessment of the Proposed N2 Wild Coast Toll Highway
Dr. Neville Bews & Associates June 2008 12
Figure 1.10: Alternative Greenfields alignments – Lusikisiki and Mthamvuna River
Source: Final Scoping Report. CCA Environmental (Pty) Ltd

Social Impact Assessment of the Proposed N2 Wild Coast Toll Highway
Dr. Neville Bews & Associates June 2008 13
1.2. Terms of reference
Although the SIA, which was compiled as part of the previous EIA process, is considered to contain
certain information suitable for use in the current EIA, this previous SIA was undertaken in 2003 and
requires updating. Apart from this various gaps were identified in terms of the 2003 study which needs to
be bridged through this study. To achieve this, the social impact team was required to:
• Review the previous independent specialist report to determine the relevance of that report.
• Undertake a new study in order to update existing information, where applicable, in light of any
relevant new information and current project details.
• Ensure that all relevant issues/potential impacts and key shortcomings and/or gaps are adequately
addressed.
• Assess and rate all potential impacts in terms of a rigorous assessment methodology described in
Section 3 methodology below.
• Recommend mitigation measures and consider them in light of their likely effectiveness and practicability.
More specifically the terms of reference of the SIA were, in respect of both the construction and
operational phases of the project, to:
• Describe and assess the potential social effects of the proposed project and, where appropriate,
identify feasible alternatives in respect of the:
o Way of life of the affected communities along the route.
o Possible improved local employment.
o Potential improvements in transport provision within and through the study area. o Sense of health and well-being of affected communities.
o Fears and aspirations of affected communities.
o Potential impacts of the proposed project on infrastructure and services such as water,
health, and education.
o In association with the economic study, identify and assess the potential social impacts in
respect of:
Property values along the proposed route.
Bypassed towns on the existing N2 and R61.
o In association with the soils, land use and agriculture study describe and assess
conditions pertaining to:
Subsistence agriculture along the proposed routes with reference to rural
livelihoods and the use of natural ‘veld’ products.
Feasible alternatives in terms of subsistence agriculture.
Feasible alternatives in terms of loss of affected crop and grazing land and the
potential resettlement of affected households.
o In association with other relevant studies:
Evaluate the social sustainability of the proposed project identifying feasible
alternatives to ensure social equity and justice.

Social Impact Assessment of the Proposed N2 Wild Coast Toll Highway
Dr. Neville Bews & Associates June 2008 14
In order to address these issues the following methodology was employed.
2. METHODOLOGY
The characteristics of the entire route are such that it was possible to divide it into three sections based
on the characteristics of each section. Progressing from East London to Durban these sections consist of
a relatively mixed section of the existing N2 between Gonubie Interchange and Mthatha (Ngqeleni)
comprised largely of rural areas and small development nodes clustered around a few small towns.
Secondly, a largely rural Greenfields section between Mthatha (Ngqeleni) and Mthamvuna River
consisting of sections of the R61 route and new road sections at times over extremely rugged territory.
The final section of road follows the R61 and N2 route from Mthamvuna River to Isipingo Interchange and
initially progresses through rural and then farming terrain linking a number of small and medium size
resort towns and becomes increasingly urbanised towards the Isipingo Interchange. The seven sub-
sections of road described under 1.2 Study area above are all catered for within the three divisions which
are largely made on methodological grounds in an attempt to capture the diverse social issues and
concerns in order to undertake an holistic assessment of the entire route. The rationale used to select
the sections and sites were based on the following criteria.
Gonubie to Mthatha (Ndabakazi community) – impact of tolling, reduced access and provision of feeder roads to designated access points The proposed toll road makes use of the existing N2 between Gonubie and Mthatha and the volume of
traffic on this section of the route will not increase significantly from the current traffic volume. There will
be upgrades to this section of the road including new interchanges and other safety improvement
features, a reduction in access points and the provision of parallel feeder roads to approved access
points where existing access points are closed. The key impact on this section will be the impact of tolling
as road users will be subject to tolling at the Ngobozi and Candu toll plazas.
Mthatha to Ndwalane (Tombo community) - impact of increased traffic, reduced access and provision of feeder roads to designated access points, tolling on trips to Port St Johns The proposed toll road makes use of the existing R61 between Mthatha and Ndwalane. This section of
road will therefore be subject to a considerable increase in traffic compared to the present traffic flow due
to the traffic that will be attracted to the new, shorter route between Port Shepstone and Mthatha. There
will be upgrades to this section of the road including new interchanges and other safety improvement
features, a reduction in access points and the provision of parallel feeder roads to approved access
points where existing access points are closed. People travelling to Port St Johns will also be subject to
tolling at the ramp plaza at Ndwalane on the R61 leading to Port St Johns. This will impact on people
living to the east of the Tutor Ndamase Pass for whom Port St Johns is the main business and social
services node as well as people undertaking trips between Mthatha and Port St Johns.

Social Impact Assessment of the Proposed N2 Wild Coast Toll Highway
Dr. Neville Bews & Associates June 2008 15
Greenfields section between Ndwalane and Ntafufu – impact of construction of new road in Greenfields location Ndwalane to Mzimvubu River (Commercial farmers)
Between the existing R61 at Ndwalane and the crossing of the Mzimvubu River there are a number of
commercial farms and businesses / residential dwellings that will be impacted by the proposed toll road.
These include the farmers in the Umzivubu farmlands close to the Umzimvubu River. Queen Regent
Ndamase took over one of the larger farms in this area during the current EIA study.
Mzimvubu River to Ntafufu (Ntafufu Village)
Between the crossing of the Mzimvubu River and where the proposed toll road rejoins the existing R61 at
Ntafufu the road passes through Ntafufu Village and impacts on the playing fields of one school and
requires the demolition of another school. The road cuts the community in half and the Ntafufu
interchange also involves the acquisition of considerable land at the entrance to the village.
Ntafufu to Lusikisiki (Mzintlava community) – impact of increased traffic, reduced access and provision of
feeder roads to designated access points
The proposed toll road makes use of the existing R61 between Ntafufu and Lusikisiki and the existing
concrete road from Lusikisiki to the Magwa intersection. This section of road will therefore receive a
considerable increase in traffic compared to the present traffic flow due to the traffic that will be attracted
to the new, shorter route between Port Shepstone and Mthatha. There will be upgrades to this section of
road including new interchanges at Ntafufu and Lusikisiki and other safety improvement features, a
reduction in access points and the provision of parallel feeder roads to approved access points where
existing access points are closed.
Greenfields Section between Lusikisiki and Mthamvuna – impact of construction of new road in
Greenfields location
This section of the route will involve the construction of a new road in a Greenfields location. As a result
of the deeply incised gorges traversing the area this section can be divided into three distinct sections
based on current accessibility. Both the Msikaba and Mthentu river gorges that traverse this area of
Pondoland can only be crossed by travelling long distances inland on poor, unsurfaced roads. There is
thus very little interaction between people from these areas due to arduous journeys of at least 100 km
and two to three hours required to get from one area to another. This section can therefore be divided into
the section from Lusikisiki to the Msikaba River, the section from the Msikaba River to the Mthentu River,
and the section from the Mthentu River to the Mthamvuna River.
There are also different settlement types and land use patterns in this area including Betterment Planning
settlements and dispersed settlements, and those that fall in between. Communities were therefore
chosen to cover the three distinct areas and also the different settlement types.

Social Impact Assessment of the Proposed N2 Wild Coast Toll Highway
Dr. Neville Bews & Associates June 2008 16
Lusikisiki to Msikaba River (Matheko)
Matheko is a betterment planning settlement close to the route alignment not far from the Msikaba Gorge
on the section between Lusikisiki and the Msikaba River.
Msikaba River to Mthentu River (Mkamela)
Mkamela is a fairly dispersed settlement close to the TRACOR land and the Msikaba Gorge on the
section between the Msikaba River and Mthentu River.
Mthentu River to Mthamvuna River (Mahaha)
The Coastal Mzamba Alternative goes through Mahaha which is a dispersed settlement on the section
between the Mthentu and Mthamvuna Rivers.
On the basis of this description the following research techniques were applied.
2.1. Research techniques
As the research techniques applied across the project differed somewhat, depending on the
characteristics of specific sectors of the route, these techniques will be addressed below under each of
these sectors.
2.1.1. Gonubie Interchange to Mthatha (Ngqeleni) Research into the social impacts for the section of road between the Gonubie Interchange and Mthatha
(Ngqeleni) employed the following data sources and methods:
• An examination of the Scoping Report, Minutes of all the Public Participation Meetings and the
Issues/Response trail for the Wild Coast Toll Highway, as well as the previous SIA and DEAT’s
comments on this report.
• A review of the existing literature for the Eastern Cape Province and the Amatole and O.R.
Tambo District Municipalities such as the IDPs and other secondary sources on the land uses
and livelihoods of residents of the former Transkei.
• Stats SA 2001 Census data for the Eastern Cape Province and the relevant district and local
municipalities.
• An examination of the 1:50 000 topographic maps for this section of road.
• Recorded observations of the number of pedestrians and road access onto the N2 along this
section, as well as the number of residential/business sites with direct access onto the N2.
• A structured closed ended questionnaire survey of 140 commuters using taxis in Butterworth,
Idutywa and Mthatha.
• A review of the latest available accident statistics.
• Interviews with the following stakeholders and affected parties:
o Taxi operators in Butterworth, Idutywa and Mthatha.
Social Impact Assessment of the Proposed N2 Wild Coast Toll Highway
Dr. Neville Bews & Associates June 2008 17
o Municipal officials in Butterworth, Idutywa and Mthatha.
o Local residents of Ndabakazi rural area west of Butterworth.
The methodology utilised along the section of the route that extends between Mthatha and Mthamvuna
River will now be addressed.
2.1.2. Mthatha (Ngqeleni) to Mthamvuna River This section of the route comprises largely of Greenfields areas and, as a result, a number of hitherto
unreported social impacts could occur within this sector. Consequently, the methodological approach
adopted was designed to both complement and expand on the original Terms of Reference 2 above and
included a Sustainable Livelihoods Framework approach which emphasises the linkages between policy
and planning priorities and the potential responses of households and communities. It also provides a
focus on both sustainability and vulnerability issues. This methodology was used to investigate local
perspectives on the impacts of the proposed road on the livelihood resources such as:
• Natural capital – including land, water and forests.
• Human capital – including skills, knowledge, health and the potential impacts on the amount and
quality of local labour.
• Social capital – community and family networks and formal and informal membership of various
types of groups and organisations.
• Physical capital – including local basic infrastructure, shelter and roads and the stock of services
needed to sustain livelihoods. This also includes schooling, health and energy services.
• Financial capital – including annual income, potential savings and expenditure, the available
stocks of cash and bank assets and the accumulation of livestock and other convertible incomes
or savings.
A diverse sample consisting of seven communities, representing the characteristics of the twenty-one
communities along the Mthatha to Mthamvuna River section of the proposed route was selected and is
listed below as follows:
• The existing rural node of Thombo – along section 3 on the R61 between Mthatha and the
proposed toll at Ndwalane.
• The private and ‘Royal House’ farmers at the Umzimvubu River bend, in the Greenfields
developments proposed for section 4 between Ndwalane and the Ntafufu River.
• The Ntafufu community, bisected by the same Greenfields developments proposed for section 4.
• The Mzintlava community at two sites along the R61 on the Ntafufu River to Lusikisiki part of
section 5.
• The Mateko community, some 15 km north of the Magwa Intersection of section 6 alongside
DR08024 between Lusikisiki and the Mthamvuna River.
• The Mkamelo community some 20 km inland of the Mkambati Nature Reserve and situated
between the Msikaba and KwaDlambu River Gorges on section 6.
Social Impact Assessment of the Proposed N2 Wild Coast Toll Highway
Dr. Neville Bews & Associates June 2008 18
• The ‘inland’ Mahaha community potentially traversed by the Coastal Mzamba Alternative as
opposed to the SANRAL preferred route of section 6; located approximately 3 km from the
Mzamba River and some 7 km inland.
It was considered that these communities are sufficiently representative in respect of:
• A suitable combination of settlement types and land use patterns, both traditionally dispersed
households, ‘betterment planned’ settlements and a combination thereof, that are potentially
affected by either upgrading or Greenfields development.
• Private and ‘Royal House’ interests in land potentially impacted by Greenfields development.
• Traditionally dispersed households and facilities along both proposed alternative routes.
• A growing rural node and major bus and taxi intersection earmarked for upgrading as an
interchange in the proposed development. This represents an effective agglomeration of existing
provincial and locally defined facilities and services, inclusive of schools, clinics, shopping
centres, a Multi Purpose Community Centre (MPCC), market stalls and small enterprise
developments.
Each identified community, with the exception of the ‘Umzimvubu farmers’, was stratified into five social
categories which is considered predominant and sufficiently representative of local community interests
lives. These social categories consisted of:
• Professional people, including teachers, nurses, and councillors;
• Commercial people, with interests largely in micro to medium sized local enterprises;
• Women, selected from various socioeconomic sectors, which included the poor;
• Groups of youths;
• Subsistence and semi-subsistence farmers. This group, by and large, consisted of returned
migrants and those ‘traditionalists’ who have chosen to remain at home throughout their lives.
A further distinction was made between those residents who claimed to live within 200m of the proposed
route, and those living between 200m and 2 km away. This was done in order to ascertain whether the
difference in location of households elicited substantially different impacts and a diversity of preferences.
The research instruments adopted comprised of a combination of focus group discussions in the format of
social group meetings and more formally structured one-on-one interviews. At each community meeting
held the purpose of the SIA was introduced and explained. Attendance ranged from over 150 participants,
at Mkamelo, to averages of 80 at Makheto, Mzintlava, Thombo and Ntafufu, with 50 at Mahaha.
The lower attendance at Mahaha was due to a widely dispersed traditional settlement pattern and long
walking distances to the venue. Some respondents walked up to 5 km to attend, while others hired taxis
at their own expense in order to have their say and make a contribution. Although this was not an ideal
situation, due to the limitations inherent in such research, it was unavoidable in this situation and is noted
here as such.
Social Impact Assessment of the Proposed N2 Wild Coast Toll Highway
Dr. Neville Bews & Associates June 2008 19
At these meetings it was emphasised that these current consultations were aimed at strengthening the
initial round of public participation consultations and were designed to capture the prior omission of
insufficient expression of ‘the voices of the people from the villages’. During each session it was also
made clear to participants that, at that point, no decisions regarding the building of the proposed toll road
had been taken and that in the event of such a decision being taken and being positive, this would result
in a further round of more detailed consultations. These consultations, it was further explained, would
consider the location, type and purpose of facilities required in respect of any mitigation, as well as the
extent and degree of the participation of communities in respect of the construction and maintenance
phases of the project.
A number of structured focus group discussions were held with the five categories of social groups
referred to above. The structure of these focus groups was based on a prepared list of questions aimed at
eliciting information concerning community perspective in respect of:
• Past and present social and economic conditions in the area.
• Future social and economic opportunities.
• Effect on the ‘general way of life’ of communities.
• Effects on the ‘sense of health and well being’ of communities.
• Fears and aspirations in relation to the project.
In order to broadly assess any local distributional and equity effects arising, perceptions regarding the
potential for any differentiation of potential benefits and costs to a broad categorisation of ‘higher
level/better off’, ‘middle income’ and ‘more vulnerable/poorer groups’ at the local level were elicited.
Various one-on-one structured interviews were held with volunteers selected from affected communities
during the focus group sessions. These interviews were specifically designed to collect information
relating to:
• Biographical data.
• Current livelihood strategies and their perceived reliability.
• Perceived impacts of the proposed road on the livelihoods of respondents.
• Present travel patterns i.e. modes of transport, furthest and most frequent destinations visited
and the purpose of this travel.
• Perceptions concerning the project’s activities and investments in the area.
• Types and extent of local skill levels within the communities.
• Perceptions concerning in-migration.
• Issues relating to fencing, access roads, under- and overpasses, intersections, bridges, toll
booths.
• Impact of the road on the issue of HIV/AIDS and STDs in the area.
Attention is now turned towards the methodology employed in respect of that section of the road, running
through KwaZulu-Natal, and stretching between Mthamvuna River and the Isipingo Interchange.
Social Impact Assessment of the Proposed N2 Wild Coast Toll Highway
Dr. Neville Bews & Associates June 2008 20
2.1.3. Mthamvuna River to Isipingo Interchange
Research into the social Impacts for the section of road between the Mthamvuna River and Isipingo
Interchange involved use of the following data sources and methods:
• An examination of the Scoping Report, Minutes of all the Public Participation Meetings and the
Issues/Response trail for the Wild Coast Toll Highway, as well as the previous SIA and DEAT’s
comments on this report.
• A review of the existing literature for the KwaZulu-Natal Province and the eThekwini Metropole,
Ugu and Sisonke District Municipalities, and other secondary sources on the land uses and
livelihoods of residents of the area.
• Stats SA 2001 Census data for the KwaZulu-Natal Province and the relevant district and local
municipalities.
• An examination of the 1:50 000 topographic maps for this section of road.
• Interviews with stakeholders. In all, over 50 stakeholders participated in meetings. Notes of all
meetings are appended as Appendix 1. Interest groups that were contacted included provincial
departments, district municipality representatives, local municipality representatives, key sectoral
stakeholders, local interest, representatives of marginal communities, large business, small scale
traders, etc.
2.2. Assessment of social impacts
The social impacts of a linear project such as the development of road infrastructure will, to varying
degrees, have consequences across the entire project. It has been found in the United States that
‘[i]nterstate highways have broad social effects…’ (Deakin, 2006:16) extending across the nation. It is
unlikely that this will be any different in South Africa and consequently the impacts across the entire route
will be addressed here. What will, however, be different is the nature of these impacts and the
communities who will bear the brunt of these effects. This has been kept in mind throughout the entire
assessment process as presented below.
2.2.1. Social impact assessment technique
The SIA aims to ascertain the nature, extent, duration, probability, significance and status of the identified
impacts that may result, during both the construction and operational phases, of the proposed N2 Wild
Coast Highway project. Each impact is described, mitigation measures are suggested and an
assessment, initially without mitigation and subsequently with mitigation is provided, in tabulated format
for each of the sections of the route.

Social Impact Assessment of the Proposed N2 Wild Coast Toll Highway
Dr. Neville Bews & Associates June 2008 21
The criteria employed in undertaking the assessment are as follows:
Extent: of an impact is described in terms of the following possibilities:
• Site specific – contained at a particular site;
• Local – restricted to the immediate surrounding areas;
• Regional – extends to the provincial level (Eastern Cape or KwaZulu-Natal);
• National – impact is nationwide.
Duration: The lifespan or anticipated length of time during which the impact will be felt. This is indicated
in terms of whether the impact will be:
• Short-term – 0 to 5 years;
• Medium-term – 6 to 15 years;
• Long-term – 16 to 30 years (where the impact will cease only after the operational life of the
activity either because of natural processes or through human intervention);
• Permanent – where mitigation either by natural process or by human intervention will not occur in
such a way or in such a time span that the impact can be considered transient.
Intensity: Refers to the degree to which the social environment will be altered:
• Low – Will have little or no effect on the social environment;
• Medium – Will have some effect on the social environment but it is likely to continue with limited
alteration;
• High – The social environment is significantly altered to the extent that cultural or social
functions/processes may temporarily or permanently cease to function as before.
Probability: The likelihood of the impact actually occurring is indicated as:
• Unlikely or improbable – where the possibility of the impact occurring is very low;
• Probable – where there is a good possibility (<50% chance) that the impact will occur;
• Highly probable – where it is most likely (50%-90% chance) that the impact will occur; or
• Definite – where the impact will occur regardless of any preventative measures taken (>90%
chance of occurring).
The status: An appraisal of the type of effect the activity would have on the affected environment, which
is described as positive, negative or neutral.
Significance of the impacts: The significance of the potential impacts is determined according to the
core criteria for determining significance ratings, namely the extent, duration and intensity of the impacts
to an affected party or the affected environment. Significance ratings are assigned to potential impacts
before and after mitigation as per the convention for assigning significance ratings provided below.

Social Impact Assessment of the Proposed N2 Wild Coast Toll Highway
Dr. Neville Bews & Associates June 2008 22
Significance rating Description (in terms of intensity, extent and duration)
Very high significance Impacts could be: Either of high intensity at a regional level and
endure in the long term; Or of high intensity at a national level in
the medium term; Or of medium intensity at a national level in
the long term.
High significance Impacts could be: Either of high intensity at a regional level and
endure in the medium term; Or of high intensity at a national
level in the short term; Or of medium intensity at a national level
in the medium term; Or of low intensity at a national level in the
long term; Or of high intensity at a local level in the long term; Or
of medium intensity at a regional level in the long term.
Medium significance Impacts could be: Either of high intensity at a local level and
endure in the medium term; Or of medium intensity at a regional
level in the medium term; Or of high intensity at a regional level
in the short term; Or of medium intensity at a national level in the
short term; Or of medium intensity at a local level in the long
term; Or of low intensity at a national level in the medium term;
Or of low intensity at a regional level in the long term.
Low significance Impacts could be: Either of low intensity at a regional level and
endure in the medium term; Or of low intensity at a national level
in the short term; Or of high intensity at a local level and endure
in the short term;
The following procedure is followed for assigning significance ratings to residual, after mitigation, impacts:
• Firstly, probable changes in intensity, extent and duration of the impact after mitigation will be
considered, assuming effective implementation of mitigation measures, leading to a revised
significance rating;
• Secondly, the significance rating will be moderated after taking into account the likelihood of
proposed mitigation measures being effectively implemented. The following is considered in
this regard:
- Any potentially significant risks or uncertainties associated with the effectiveness of
mitigation measures;
- The technical and financial ability of the proponent to implement the measure; and
- The commitment of the proponent to implementing the measure, or guarantee over time
that the measures would be implemented.
The significance ratings are based on largely objective criteria and inform decision-making at a project
level as opposed to a community level. In some instances, therefore, whilst the significance rating of
potential negative impacts might be “low” or “very low”, the importance of these impacts to local
communities or individuals might be extremely high. The importance which I&APs attach to impacts must
also be taken into consideration, and recommendations should be made as to ways of avoiding or

Social Impact Assessment of the Proposed N2 Wild Coast Toll Highway
Dr. Neville Bews & Associates June 2008 23
minimising these negative impacts through appropriate project design, selection of appropriate
alternatives and/or management.
Confidence: given all available data, the probability to which predictions relating to the impact can be
made. This is rated as:
• High – where it most likely that impact will occur in accordance with the assessment.
• Medium – where there is a distinct possibility of the impact occurring in accordance with the
assessment.
• Low – where it is most difficult to make any prediction in terms of the assessed impact.
Based on these criteria the various social impacts across all sections of the route are identified and
assessed on two levels. The first of these levels refers to the construction phase, while the second
concerns the operational phase of the project.
Impact and mitigation assessment
The major process through which the impacts were identified includes the following:
• Impacts as identified during the scoping phase.
• Impacts identified during interviews and research among the stakeholders.
• Impacts identified by submissions made by interested and affected parties.
• Impacts identified by the authors, as part of their professional judgement.
In particular the scoping report sets out a number of impacts that were to be considered during the impact
assessment phase. Amongst these are impacts that have been deemed to be ‘headline issues’ and that
have been disaggregated and considered under, what has been termed as, additionally identified
impacts. These impacts are the:
• Potential effects on the way of life of affected communities.
• Potential effects on the sense of health and well-being of affected communities.
• Potential effects on the fears and aspirations of affected communities.
• Social sustainability (including social equity/justice) of the proposed project.
• Capacity to manage the project at local level.
2.3. Assumptions and Limitations A study of the nature and size of the N2 Wild Coast SIA will inherently contain various assumptions and
limitations. Although the ideal situation may have been to engage with all stakeholders on a broad basis
along the entire length of the route, and to utilizing both a quantitative and qualitative methodological
approach, this was not feasible for a number of reasons. Firstly, although significant funding and
resources were allocated to the SIA there were limitations within these allocated funds and resources that
had to be considered. Secondly, the characteristics of the route were such, with both developed and
Greenfields regions being targeted, that it necessitated the application of a mixed methodological

Social Impact Assessment of the Proposed N2 Wild Coast Toll Highway
Dr. Neville Bews & Associates June 2008 24
approach. In addition the option of using self-administered questionnaires could not be considered due to
high levels of illiteracy amongst members of many communities consulted, time constraints and
budgetary considerations.
In the Eastern Cape, it proved to be quite difficult to arrange meetings with the Butterworth, Idutywa and
Mthatha local municipalities. In the case of Idutywa it was not possible to meet with them while in the
field, but some subsequent discussions were held over the phone. It was also clear that the Municipal
officials who met with the researchers (except for those in Mthatha) were not well informed about the
proposed development and were not in a position to inform us about the concerns of local residents and
authorities. The meeting arranged with the taxi associations in Mthatha also failed to take place but a
lengthy discussion was possible with one of the taxi operators in that area. The researchers also
encountered problems during the meeting with the Ndabakazi rural community in the vicinity of the
proposed Ngobozi Toll Plaza. As a result of some misunderstandings and frustration on the part of local
residents about the delays and lack of progress with implementing the proposed highway, as well as
‘consultation fatigue’, they were unwilling to enter into lengthier focus group discussions about the
potential impacts on various stakeholder groups.
In the course of preparing for and undertaking the field work in the Greenfields sections of the Eastern
Cape researchers made the assumption that the process of organising communities to be consulted
would be a relatively seamless process. This assumption was based on the fact that team members had
an in-depth knowledge of the area, and well planned phased dates were allocated and venues
prearranged with good communication between the team and local leadership at each site visited.
However, despite this a number of minor limitations did occur. For instance at Port St Johns, 2 private
individual farmers failed to attend an agreed upon Sunday morning meeting due to other last minute
commitments arising, while in Mahaha, attendance was low due to the very dispersed settlement pattern
and long distances to the venue. These minor matters were to be expected in a study of this nature and
every effort was made to limit any affect they could have on the study.
Likewise In the course of preparing for and undertaking the field work in the KwaZulu-Natal section
researchers made the assumption that the communities, stakeholders and interest groups that could
contribute to the generation of the impact assessment were relatively well informed about the project and
had generally made themselves known via the public participation process. Although this assumption
was largely true the interaction with stakeholders was hampered by “stakeholder fatigue” and the dynamic
nature of some of the organisations involved. The individual makeup of many organisations had changed
considerably since contact was first made by the public participation team and the fact that some
stakeholders claimed to have none or very limited knowledge of the project. This was largely managed
by the research team having an inclusive approach and being receptive to people who may not have
been initially identified or listed as stakeholders and by undertaking many and varied meetings across the
project locale.
Social Impact Assessment of the Proposed N2 Wild Coast Toll Highway
Dr. Neville Bews & Associates June 2008 25
On a general basis, although every attempt was made to provide an opportunity for all affected and
interested parties to participate in this study, what is usually the case with such research is that only those
people with fairly strong views about the proposed project are prepared to take the time and make the
effort to participate. Consequently, the results of the study cannot be generalised to the entire research
population and in analysing the results we therefore draw conclusions with regard to the characteristics
and views of the concerned residents in those communities.
Finally it must be stated that this report was informed by peer review undertaken by Tony Barbour, Environmental Consultant and Researcher (Appendix 4). The peer review comments are also
appended to this report together with a comments and response table on the review (Appendix 5).
Attention is now turned towards section 2 of the report which, as indicated under the introduction above,
will address the existing baseline social conditions relative to the proposed route.
3. SOCIAL DESCRIPTION OF THE AREA
This section of the report provides a broad description of the provincial, district and local socioeconomic
environment in which the proposed toll road development may take place. It emphasises selected
institutional, socioeconomic characteristics and related policies/plans within which the proposed highway
development would take place. This description is complemented with a number of maps illustrating some
of the key socioeconomic features of this region.
3.1. Provincial description Starting at Gonubie Interchange just outside East London, the route is aligned within the boundaries of
the Eastern Cape Province for approximately 411.5 km before crossing into the Province of KwaZulu-
Natal. It continues for a further 148 km through KwaZulu-Natal until it reaches Isipingo Interchange, just
south of Durban. Consequently a description of the Eastern Cape Province and the Province of KwaZulu-
Natal is given below and an illustration of the district and local municipalities affected by the route is
provided in Figure 3.1 while a breakdown of the population density across the route is provided in Figure
3.2.
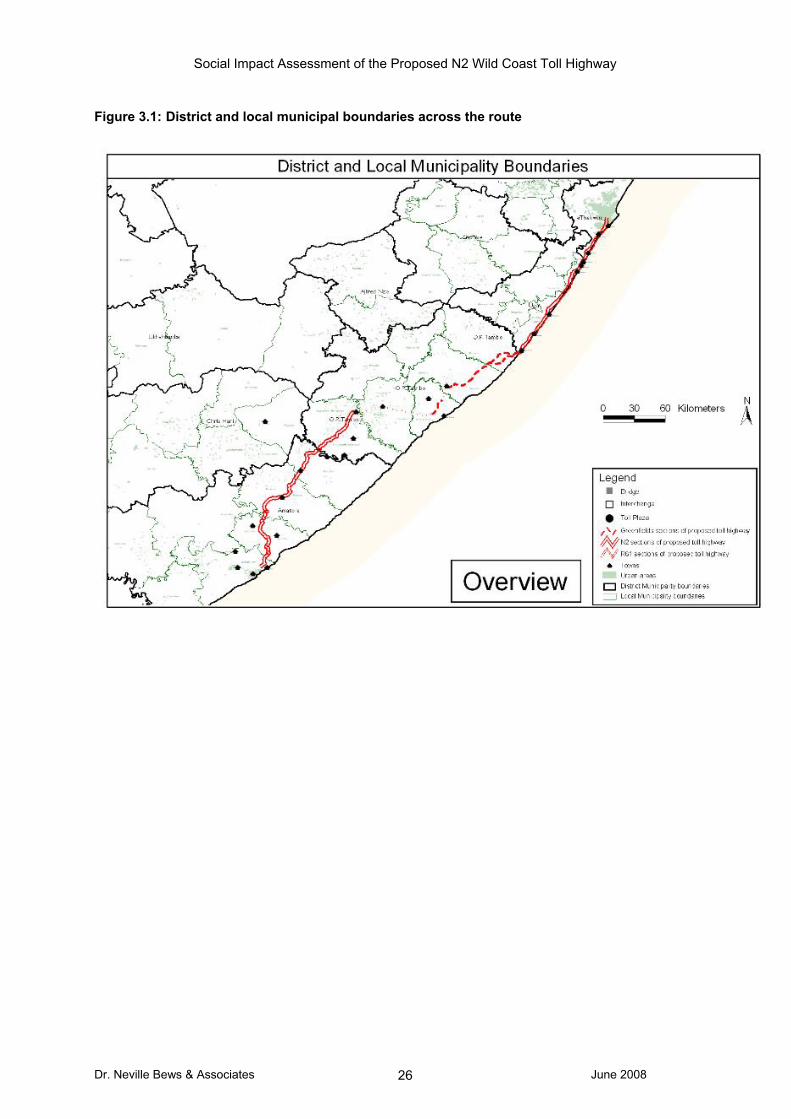
Social Impact Assessment of the Proposed N2 Wild Coast Toll Highway
Dr. Neville Bews & Associates June 2008 26
Figure 3.1: District and local municipal boundaries across the route

Social Impact Assessment of the Proposed N2 Wild Coast Toll Highway
Dr. Neville Bews & Associates June 2008 27
Figure 3.2: Population density across the route
3.1.1. Eastern Cape Province
The Eastern Cape economy has been characterised in the Province’s 2004–2014 Provincial Growth and
Development Plan (PGDP) as having extreme levels of uneven development. This is manifest in the
dualism inherited from its urban industrial manufacturing centres in Buffalo City (East London) and in the
Nelson Mandela Metropolitan Municipality (Port Elizabeth), a well developed commercial farming sector,
and high concentrations of developed socioeconomic infrastructure in the western parts. This is
contrasted against the undeveloped rural hinterland in the former Transkei and Ciskei homelands, a very
weak subsistence agriculture and very limited socioeconomic infrastructure, particularly in the northeast.
The objective of the PGDP is to elevate the province out of poverty and transform it into a ‘compelling
place in which to live, work and invest’ (Stofile, Mokgola, 2003). The PGDP aim is to eliminate poverty
and halve unemployment by 2014 through five major Programmes Areas and constituent subprogrammes
which are listed below:
1. The Agricultural Transformation and Food Security Programme, made up of the Massive Food
Programme, the Siyondla Homestead Food Production Plan, the Comprehensive Nutrition
Programme and the Integrated Agriculture Infrastructure Plan.

Social Impact Assessment of the Proposed N2 Wild Coast Toll Highway
Dr. Neville Bews & Associates June 2008 28
2. Fighting Poverty, with subprogrammes in the Expanded Public Works Programme, the Water and
Sanitation Programme, a Housing Programme, a Comprehensive HIV/AIDS and TB Programme
and a Victim Empowerment Programme.
3. Public Sector Transformation, to be realised via the Improved Service Delivery in Health,
Education, Social Development and Public Works Programme, the Local Government Capacity
Building Programme and a programme to ‘Strengthen the Centre of Government to Drive the
PGDP Implementation’.
4. A Strategic Infrastructure Programme.
5. A Manufacturing Diversification and Tourism Development Programme with six main
subprogrammes namely: the Automotive Industry Development Programme, an Industrial
Support Programme, the Enterprise Development Finance Programme, an Agro Processing
Support Programme, a Tourism Programme and a Timber Industries Development Programme.
6. All of these programmes are underpinned by a Human Resource Development Programme
comprising the Provision of Scarce Skills for the Public Sector programme, a Future Education
and Training Transformation Programme, an Adult Basic Education and Training Programme, a
Comprehensive Human Resources Development Strategy and a Provincial Learnership
Programme.
Average annual economic growth for the provincial economy over the last decade was 2.2% against the
national average of 2.8%. In 2003, its real annual growth rate was 0.8% against South Africa’s 3.6%
(ECSECC, 2007). The provinces’ 2002 contribution to national GDP, at about 7%, ranked fifth of all nine
provinces and was the second lowest after Limpopo in terms of per capita Gross Value Added. However
the province experienced 4.8% growth at the end of 2005, an achievement which had not been seen for
over a decade. The primary sector had the highest growth rate at 5% with agriculture, forestry and fishing
all being the largest contributors. The secondary sector contributed 4.8% with the construction sector
adding 10.1% and the manufacturing sector adding only 4.2% (ECSECC, 2007). By 2007, the Eastern
Cape contribution had risen to 8.1% of South Africa’s total GDP. Manufacturing contributed 16.6% toward
the province’s GDP (Gross Domestic Product per Region [GDPR]) with the finance, real estate and
business services contributing 19.4% and the wholesale, retail, trade, hotels and restaurants adding
13.1% of the GDPR.
The agricultural sector within the province is highly diverse with several different crop types being
produced, from chicory to pineapples to olives. Sheep, dairy, cattle and ostrich farming are the dominant
forms of livestock farming, with angora wool also being produced. Exotic forestry plantations cover large
tracts of land in the Keiskammahoek region, whilst the primary fishing industry is squid. Game meat is
also attracting international demand due to it being a leaner meat and thus healthier for the consumer
(South Africa Government Information, 2007). Unfortunately, most of this commercial agricultural activity
takes place in the wealthier western regions of the province and not in the former Transkei where the
proposed highway is to be developed. Farming is an important contributor to household livelihoods in the
former Transkei but is largely a subsistence activity.
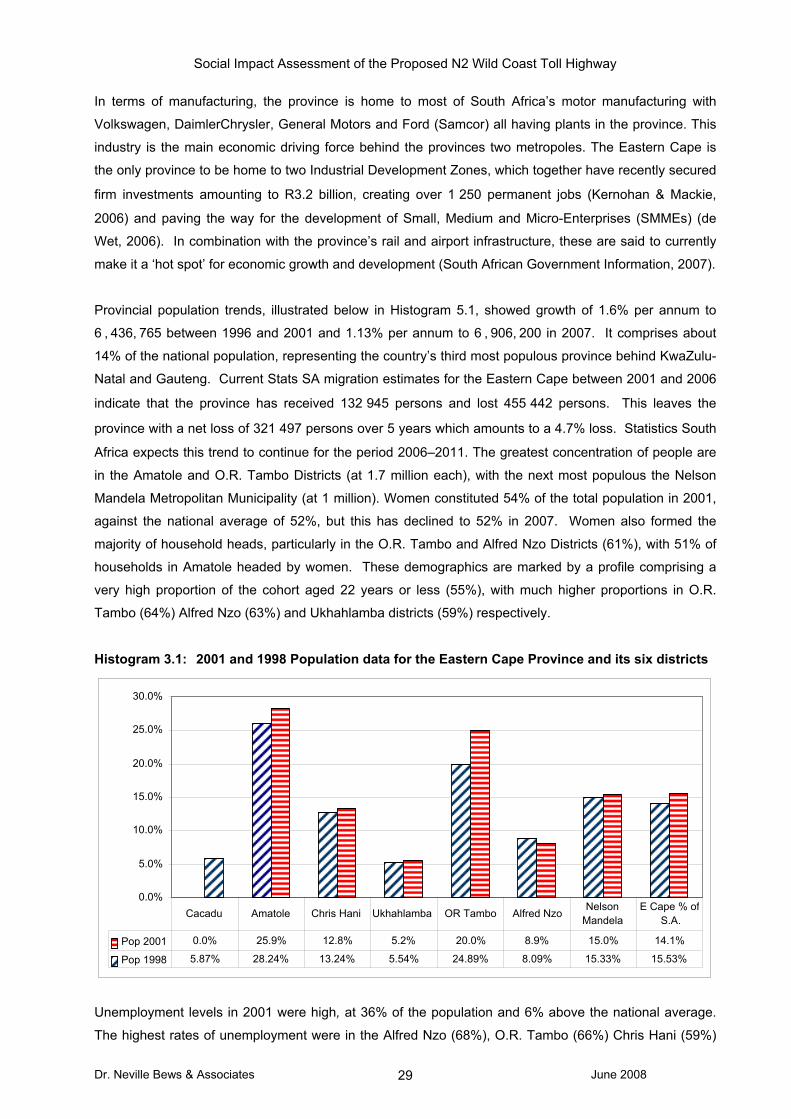
Social Impact Assessment of the Proposed N2 Wild Coast Toll Highway
Dr. Neville Bews & Associates June 2008 29
In terms of manufacturing, the province is home to most of South Africa’s motor manufacturing with
Volkswagen, DaimlerChrysler, General Motors and Ford (Samcor) all having plants in the province. This
industry is the main economic driving force behind the provinces two metropoles. The Eastern Cape is
the only province to be home to two Industrial Development Zones, which together have recently secured
firm investments amounting to R3.2 billion, creating over 1 250 permanent jobs (Kernohan & Mackie,
2006) and paving the way for the development of Small, Medium and Micro-Enterprises (SMMEs) (de
Wet, 2006). In combination with the province’s rail and airport infrastructure, these are said to currently
make it a ‘hot spot’ for economic growth and development (South African Government Information, 2007).
Provincial population trends, illustrated below in Histogram 5.1, showed growth of 1.6% per annum to
6 , 436, 765 between 1996 and 2001 and 1.13% per annum to 6 , 906, 200 in 2007. It comprises about
14% of the national population, representing the country’s third most populous province behind KwaZulu-
Natal and Gauteng. Current Stats SA migration estimates for the Eastern Cape between 2001 and 2006
indicate that the province has received 132 945 persons and lost 455 442 persons. This leaves the
province with a net loss of 321 497 persons over 5 years which amounts to a 4.7% loss. Statistics South
Africa expects this trend to continue for the period 2006–2011. The greatest concentration of people are
in the Amatole and O.R. Tambo Districts (at 1.7 million each), with the next most populous the Nelson
Mandela Metropolitan Municipality (at 1 million). Women constituted 54% of the total population in 2001,
against the national average of 52%, but this has declined to 52% in 2007. Women also formed the
majority of household heads, particularly in the O.R. Tambo and Alfred Nzo Districts (61%), with 51% of
households in Amatole headed by women. These demographics are marked by a profile comprising a
very high proportion of the cohort aged 22 years or less (55%), with much higher proportions in O.R.
Tambo (64%) Alfred Nzo (63%) and Ukhahlamba districts (59%) respectively.
Histogram 3.1: 2001 and 1998 Population data for the Eastern Cape Province and its six districts
Unemployment levels in 2001 were high, at 36% of the population and 6% above the national average.
The highest rates of unemployment were in the Alfred Nzo (68%), O.R. Tambo (66%) Chris Hani (59%)
0.0%
5.0%
10.0%
15.0%
20.0%
25.0%
30.0%
Pop 2001 0.0% 25.9% 12.8% 5.2% 20.0% 8.9% 15.0% 14.1%
Pop 1998 5.87% 28.24% 13.24% 5.54% 24.89% 8.09% 15.33% 15.53%
Cacadu Amatole Chris Hani Ukhahlamba OR Tambo Alfred Nzo Nelson Mandela
E Cape % of S.A.
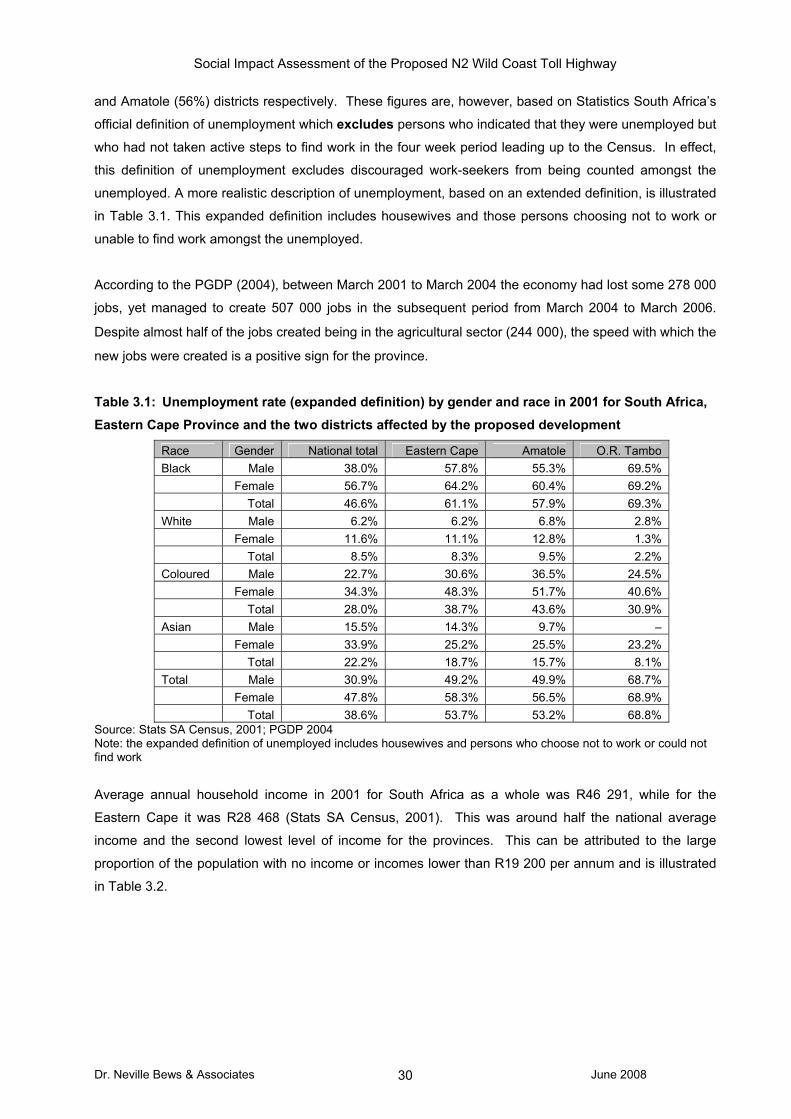
Social Impact Assessment of the Proposed N2 Wild Coast Toll Highway
Dr. Neville Bews & Associates June 2008 30
and Amatole (56%) districts respectively. These figures are, however, based on Statistics South Africa’s
official definition of unemployment which excludes persons who indicated that they were unemployed but
who had not taken active steps to find work in the four week period leading up to the Census. In effect,
this definition of unemployment excludes discouraged work-seekers from being counted amongst the
unemployed. A more realistic description of unemployment, based on an extended definition, is illustrated
in Table 3.1. This expanded definition includes housewives and those persons choosing not to work or
unable to find work amongst the unemployed.
According to the PGDP (2004), between March 2001 to March 2004 the economy had lost some 278 000
jobs, yet managed to create 507 000 jobs in the subsequent period from March 2004 to March 2006.
Despite almost half of the jobs created being in the agricultural sector (244 000), the speed with which the
new jobs were created is a positive sign for the province.
Table 3.1: Unemployment rate (expanded definition) by gender and race in 2001 for South Africa, Eastern Cape Province and the two districts affected by the proposed development
Race Gender National total Eastern Cape Amatole O.R. Tambo Black Male 38.0% 57.8% 55.3% 69.5% Female 56.7% 64.2% 60.4% 69.2% Total 46.6% 61.1% 57.9% 69.3% White Male 6.2% 6.2% 6.8% 2.8% Female 11.6% 11.1% 12.8% 1.3% Total 8.5% 8.3% 9.5% 2.2% Coloured Male 22.7% 30.6% 36.5% 24.5% Female 34.3% 48.3% 51.7% 40.6% Total 28.0% 38.7% 43.6% 30.9% Asian Male 15.5% 14.3% 9.7% – Female 33.9% 25.2% 25.5% 23.2% Total 22.2% 18.7% 15.7% 8.1% Total Male 30.9% 49.2% 49.9% 68.7% Female 47.8% 58.3% 56.5% 68.9% Total 38.6% 53.7% 53.2% 68.8%
Source: Stats SA Census, 2001; PGDP 2004 Note: the expanded definition of unemployed includes housewives and persons who choose not to work or could not find work
Average annual household income in 2001 for South Africa as a whole was R46 291, while for the
Eastern Cape it was R28 468 (Stats SA Census, 2001). This was around half the national average
income and the second lowest level of income for the provinces. This can be attributed to the large
proportion of the population with no income or incomes lower than R19 200 per annum and is illustrated
in Table 3.2.
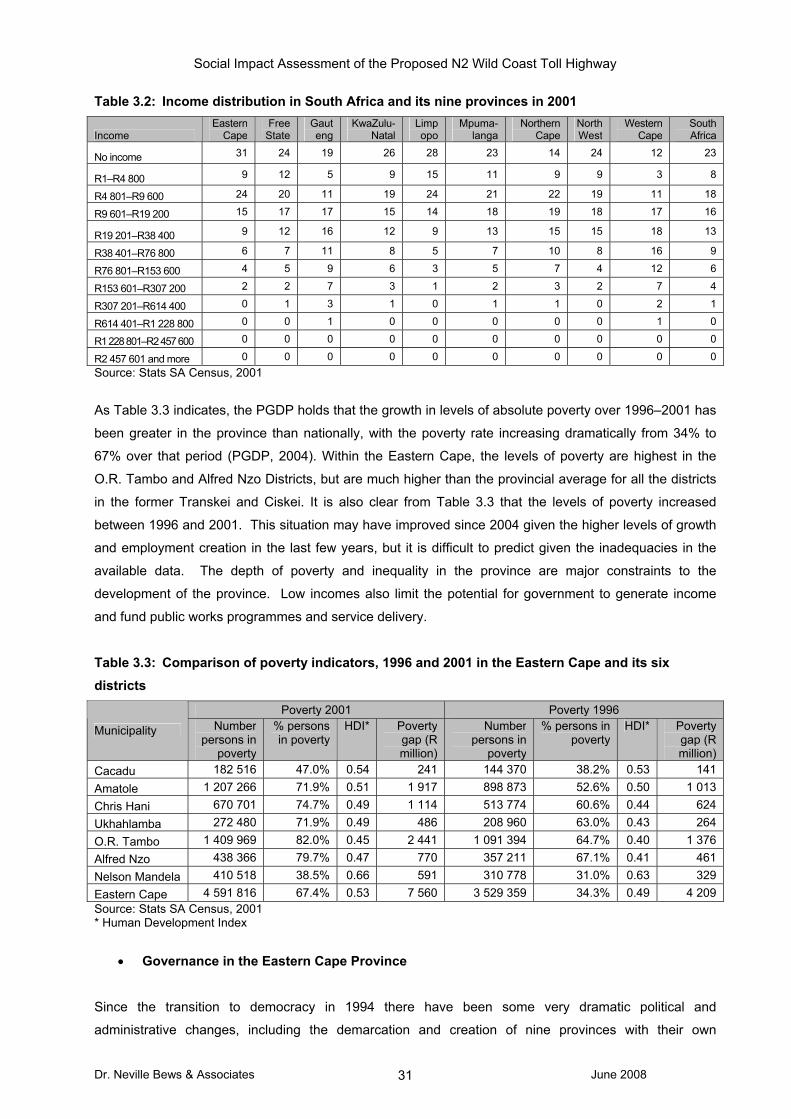
Social Impact Assessment of the Proposed N2 Wild Coast Toll Highway
Dr. Neville Bews & Associates June 2008 31
Table 3.2: Income distribution in South Africa and its nine provinces in 2001
Income Eastern
Cape Free
State Gauteng
KwaZulu-Natal
Limpopo
Mpuma-langa
Northern Cape
North West
Western Cape
South Africa
No income 31 24 19 26 28 23 14 24 12 23
R1–R4 800 9 12 5 9 15 11 9 9 3 8
R4 801–R9 600 24 20 11 19 24 21 22 19 11 18
R9 601–R19 200 15 17 17 15 14 18 19 18 17 16
R19 201–R38 400 9 12 16 12 9 13 15 15 18 13
R38 401–R76 800 6 7 11 8 5 7 10 8 16 9
R76 801–R153 600 4 5 9 6 3 5 7 4 12 6
R153 601–R307 200 2 2 7 3 1 2 3 2 7 4
R307 201–R614 400 0 1 3 1 0 1 1 0 2 1
R614 401–R1 228 800 0 0 1 0 0 0 0 0 1 0
R1 228 801–R2 457 600 0 0 0 0 0 0 0 0 0 0
R2 457 601 and more 0 0 0 0 0 0 0 0 0 0 Source: Stats SA Census, 2001
As Table 3.3 indicates, the PGDP holds that the growth in levels of absolute poverty over 1996–2001 has
been greater in the province than nationally, with the poverty rate increasing dramatically from 34% to
67% over that period (PGDP, 2004). Within the Eastern Cape, the levels of poverty are highest in the
O.R. Tambo and Alfred Nzo Districts, but are much higher than the provincial average for all the districts
in the former Transkei and Ciskei. It is also clear from Table 3.3 that the levels of poverty increased
between 1996 and 2001. This situation may have improved since 2004 given the higher levels of growth
and employment creation in the last few years, but it is difficult to predict given the inadequacies in the
available data. The depth of poverty and inequality in the province are major constraints to the
development of the province. Low incomes also limit the potential for government to generate income
and fund public works programmes and service delivery.
Table 3.3: Comparison of poverty indicators, 1996 and 2001 in the Eastern Cape and its six districts
Poverty 2001 Poverty 1996
Municipality Number persons in
poverty
% persons in poverty
HDI* Poverty gap (R million)
Number persons in
poverty
% persons in poverty
HDI* Poverty gap (R million)
Cacadu 182 516 47.0% 0.54 241 144 370 38.2% 0.53 141 Amatole 1 207 266 71.9% 0.51 1 917 898 873 52.6% 0.50 1 013 Chris Hani 670 701 74.7% 0.49 1 114 513 774 60.6% 0.44 624 Ukhahlamba 272 480 71.9% 0.49 486 208 960 63.0% 0.43 264 O.R. Tambo 1 409 969 82.0% 0.45 2 441 1 091 394 64.7% 0.40 1 376 Alfred Nzo 438 366 79.7% 0.47 770 357 211 67.1% 0.41 461 Nelson Mandela 410 518 38.5% 0.66 591 310 778 31.0% 0.63 329 Eastern Cape 4 591 816 67.4% 0.53 7 560 3 529 359 34.3% 0.49 4 209 Source: Stats SA Census, 2001 * Human Development Index
• Governance in the Eastern Cape Province
Since the transition to democracy in 1994 there have been some very dramatic political and
administrative changes, including the demarcation and creation of nine provinces with their own

Social Impact Assessment of the Proposed N2 Wild Coast Toll Highway
Dr. Neville Bews & Associates June 2008 32
governments, and the demarcation of new district municipalities with elected councils responsible for
service provision that are much larger and fewer than the former districts. Within the Eastern Cape
Province there are six new district municipalities with 38 local municipalities with their own elected local
representatives. These changes introduced elected municipal and local councils in rural areas and in
‘black’ areas such as the former Transkei for the first time. In addition to these new political and
administrative structures, there are some old structures such as the Tribal Authorities that have been
allowed to continue and have been given ex-officio positions on the local municipal councils. There has
also been considerable restructuring of civil servant posts in national, provincial and district government
departments and organisations, with considerable downsizing, many resignations, and new appointments
and transfers.
The process of restructuring elected government structures and the civil service, at the same time as
trying to promote development and adopt many radically new government policies, created considerable
tensions, capacity problems and uncertainties. This process has also been slow. In the former Transkei
where there had previously been no elected municipal or local government structures, these councils
have been very weak and inexperienced. The newly elected councillors often had no previous
experience in government, and many of them have very low levels of education and difficulties with
communicating in English. The capacity of local municipalities has been further limited by the absence of
financial resources and difficulties in securing the services of sufficient suitably qualified staff (Ntsebeza,
1999). District planning data for the O.R. Tambo District reveals that average per capita expenditure is
R412, slightly lower than the provincial average, with 70% budgeted by the district alone and 93% funded
by grants and subsidies. The combined municipalities have an operating budget of R718m, representing
a per capita allocation of R428, and described as very low by provincial standards. Despite these
difficulties, considerable progress appears to have been made. While there is still much to be done, most
local municipalities have offices, staff, telephones, etc., have developed plans and are delivering services.
However, the difficulties that this SIA research team encountered in trying to contact and engage with
local municipalities around the highway indicates that many local municipalities appear to be struggling to
cope with the day to day issues, and find it difficult to have to deal with nonessential or long-term planning
issues.
The coexistence in the former Transkei of newly elected councils and the old tribal authority structures
with ill-defined roles and powers, has contributed further to the general tensions and uncertainties.
Initially, many traditional authorities have felt threatened and become defensive and at times disruptive of
efforts made by local municipalities (and other government structures) to advance development in what
they believe to be ‘their’ areas of authority (Ntsebeza, 1999). There are also some local councillors who
continued to fight against what they saw as undemocratic and discredited traditional structures
(Ntsebeza, 1999). The lack of clarity on roles and responsibilities, conflicts and the lack of capacity in
local government have stifled development initiatives at the local level. However, the situation is slowly
improving as policy has become clearer and local governance capacity has increased.

Social Impact Assessment of the Proposed N2 Wild Coast Toll Highway
Dr. Neville Bews & Associates June 2008 33
In an attempt to enhance the interdepartmental coordination of policies and programmes and ensure
more effective integration of service delivery, the Eastern Cape Provincial Government has developed
three ‘Clusters’ of Cabinet Committees – (1) a Governance and Administration cluster, (2) an Economic
Development and Infrastructure cluster, and (3) a Social Needs cluster. These clusters work through an
intergovernmental forum in the Department of Housing, Local Government and Traditional Affairs and
engage with the six district municipalities at the next tier of government and with 38 local municipalities at
the ‘lowest’ tier, who are currently mandated with the most devolved powers and responsibilities for
‘delivery’.
In addition there is currently an investigation being undertaken by the Department of Provincial and Local
Government nationally to assess what the optimum assignment, delegation and funding between the
respective tiers of government, and their relative powers and functions would be. Depending on the
outcome of these investigations, there are likely to be further changes to the institutional environment in
this region which will have implications for all developments including the proposed highway project.
Effective management of relations with all these authorities and their respective specific mandates will be
required in any new toll road development.
3.1.1.1. District and municipal description The two major districts bisected by the proposed toll road development in the section between Gonubie
and Port Edward are the Amatole District in the west, and O.R. Tambo District in the east bordering
KwaZulu-Natal. The local municipalities in the Amatole District illustrated in Figure 4.1 below, that would
be traversed by the highway are Buffalo City (with its seat in East London), Great Kei (Komga) Mnquma
(Butterworth). Those local municipalities from the O.R. Tambo District Municipality, are the Mbashe
(Idutywa), King Sabata Dalindyebo (Mthatha), Nyandeni (Libode), Port St Johns, Inquza Hill, formerly
Quakeni (Lusikisiki) and Mbizana (Bizana). There is a very ‘uneven’ economic and spatial development
profile across both these districts. Some of this uneven development has already been profiled in the
section above. The discussion which follows will focus more on issues around infrastructure and services.
Recent surveys done for O.R. Tambo’s 2007 Growth and Development Summit have attempted to
capture and compare some selected district and municipal planning data and socioeconomic indicators.
These were prepared by the Eastern Cape Social and Economic Consultative Council. Much of the
following synopsis is drawn from this report, and is complemented spatially by selected disaggregated
data. Unfortunately, no similar assessment has been developed for the Amatole District, but observations
in the field suggest that they are very similar for those local municipalities that are located in the former
Transkei.
As noted, O.R. Tambo District Municipality is the most populated district (along with Amatole), with over
100 persons per km2 living in a largely scattered settlement pattern that makes service provision difficult
and expensive. Access to basic services is relatively low with sewage from Mthatha flowing into the
Mthatha River and outbreaks of cholera and typhoid occurring. The GDP per capital is only 30% of the

Social Impact Assessment of the Proposed N2 Wild Coast Toll Highway
Dr. Neville Bews & Associates June 2008 34
provincial average and rates of unemployment and poverty (covered elsewhere) are amongst the highest
for the province and country.
Economic growth in this district is also low with private sector commercial economic activity limited to the
trade sector and timber industry. Commercial economic growth is hindered by the communal tenure
system and a physical planning system that is still in its infancy. Due to the backlogs in economic
development of this area, national government has prioritised development in this region, and initiated a
number of major development programmes (ECSECC, 2007). For example, priority is now being given to
three mega projects presently being rolled out nationally and provincially in the form of the Forestry and
Timber Industries Programme, a Bio-fuels Programme and the Umzimvubu Basin Development. Many of
these initiatives are not necessarily included in those programmes which have been prioritised in the
PGDP.
The proportion of households still reliant on natural water sources is more than twice the provincial
average. Table 3.4 indicates that 50% of households living in Mthatha and along the road between
Mthatha and Gonubie were still reliant on natural water sources in 2001. As indicated in Table 3.4 below,
the percentage of households reliant on natural water sources are even higher in the more rural
municipalities. The Mbizana, Inquza Hill/Quakeni and Port St Johns municipal areas exhibit the highest
proportions internally.
Table 3.4: Number and percentage of households in the wards dissected by the proposed highway or adjacent to it between Gonubie and Mthatha having access to various water sources
Water source Number of households %
Piped water inside dwelling 69 552 12%
Piped water inside yard 59 729 10%
Piped water on community stand: distance less than 200m from dwelling 62 298 11%
Piped water on community stand: distance greater than 200m from dwelling 84 214 15%
Borehole 11 178 2%
Spring 26 564 5%
Rainwater tank 38 386 7%
Dam/pool/stagnant water 14 420 3%
River/stream 195 640 34%
Water vendor 2 334 0
Other 8 907 2%
Not applicable (homeless) 118 0
Total 573 340 100%
Source: Stats SA Census, 2001
Table 3.5 also indicates that there have been some limited changes, and sometimes declines, in water
service levels monitored over the period between 2001 and 2006.

Social Impact Assessment of the Proposed N2 Wild Coast Toll Highway
Dr. Neville Bews & Associates June 2008 35
Table 3.5: Changes in access to various types of water resources in the Eastern Cape Province, the O.R. Tambo District and its local municipalities
Water on site Borehole/Tank Community stand Natural water/dam Water vendor/other Area
2001 2006 2001 2006 2001 2006 2001 2006 2001 2006 Eastern Cape 37.4 41.8 4.0 3.8 25.3 25.1 31.4 28.0 1.9 1.4 O.R. Tambo 10.0 10.2 5.9 4.1 17.9 21.1 64.1 62.4 2.1 2.2 Mbizana 2.9 0.7 2.9 0.0 14.9 3.8 77.6 94.2 1.8 1.2 Ntabankulu 3.4 2.3 3.7 9.7 16.1 44.5 75.0 43.5 1.8 0.0 Quakeni 8.0 4.1 3.8 1.0 13.8 12.6 72.4 81.9 2.0 0.4 Port St Johns 5.7 6.5 5.1 2.7 13.7 39.2 73.8 50.8 1.7 0.8 Nyandeni 3.9 9.3 7.4 5.8 18.7 18.0 67.2 66.0 2.8 0.9 Mhlontlo 6.4 5.3 5.7 7.1 27.5 27.9 58.7 46.8 1.7 12.9 King Sabata Dalindyebo 24.1 27.8 8.5 5.3 18.6 21.8 46.4 44.1 2.4 0.9 Source: Stats SA Census 2001; RSS, 2006
Electricity Changes in access to electricity and the relative changes in the reliance on gas, paraffin, candles, solar
and any other sources are captured in Table 3.6. With one obvious exception of King Sabata Dalindyebo
(which includes Mthatha), the local municipalities fall well below the provincial average of those with
access to electricity for a minimum of lighting.
Table 3.6: Percentage of households using various sources of power for lighting in the Eastern Cape Province and O.R. Tambo District in 2001 and 2006
Electricity Gas Paraffin Candles Solar and other Areas Census
2001 RSS 2006
Census 2001
RSS 2006
Census 2001
RSS 2006
Census 2001
RSS 2006
Census 2001
RSS 2006
% % % % % % % % % % Eastern Cape 49.7 67.1 0.3 0.4 23.3 14.0 25.9 18.3 0.8 0.2 O.R. Tambo 28.1 49.6 0.3 0.2 12.1 8.0 58.4 41.6 1.2 0.5 Mbizana 25.0 37.0 0.3 0.0 2.9 4.1 69.7 57.7 2.1 1.2 Ntabankulu 14.5 18.4 0.1 0.0 3.4 1.8 80.1 79.4 1.9 0.5 Quakeni 13.6 42.7 0.2 0.4 8.0 5.8 76.3 50.0 1.8 1.0 Port St Johns 17.2 45.6 0.3 0.4 10.5 1.9 70.8 52.1 1.1 0.0 Nyandeni 32.2 58.4 0.2 0.2 11.5 19.7 55.0 21.7 1.0 0.0 Mhlontlo 30.1 47.1 0.2 0.6 8.8 2.4 60.0 49.1 0.9 0.9 King Sabata Dalindyebo 41.7 70.1 0.4 0.2 24.3 11.5 33.1 18.1 0.6 0.2
Education
Education levels in the districts within the former Transkei are very low, with 23% of the population having
no schooling and only 25% having obtained Matric and/or tertiary educational qualifications. According to
the O.R. Tambo District profile, an estimated 95% of learners walk to school, with 36% of these walking
longer than 30 minutes. Table 3.7 provides an indication of the percentage of people in various
educational categories within the wards intersected by the proposed route.

Social Impact Assessment of the Proposed N2 Wild Coast Toll Highway
Dr. Neville Bews & Associates June 2008 36
Table 3.7: Number and percentage of persons in each education category in the wards dissected by the proposed highway or adjacent to it
Educational levels Total % No schooling 65 066 23.12% Some primary 47 213 16.77% Complete primary 18 141 6.45% Some secondary 80 817 28.71% Grade 12 43 967 15.62% Higher 26 252 9.33% Total 281 456 100.00%
Source: Stats SA Census, 2001
Transport The O.R. Tambo profile also describes how, despite some investments in new roads and road
maintenance in the district and other local municipalities, many rural communities remain trapped in
isolated and disconnected localities with very poor road infrastructure. It describes this disconnection as
having significant negative consequences in terms of local economic development as well as service
delivery. The transport of goods and services in this area is hampered by the poor condition of the roads
in rural and urban areas, animals on the road, inadequate signage and road markings (low visibility),
insufficient drop off areas and infrastructure for taxis in some areas, limited traffic calming measures,
inadequate traffic lights, poor quality intersections, a lack of capacity to manage transport planning and
implementation and weak law enforcement (ECSECC, 2007). The process of maintaining and upgrading
roads has been hampered by the lack of clarity with regard to roles and responsibilities between various
road role players which is, apparently, being addressed slowly.
Attention will now turned towards a description of the province of KwaZulu-Natal with emphasis on the
district municipalities affected by the N2 Wild Coast Highway project.
3.1.2. KwaZulu-Natal The section of the proposed road between the Mthamvuna River (Port Edward) and the Isipingo
Interchange falls within the Province of KwaZulu-Natal as is illustrated in the maps provided at the end of
this discussion. In terms of the most recent official statistical data available i.e. the 2007 Mid Year
Population Estimates: South Africa, released by Statistics South Africa in July 20071 the population of
KwaZulu-Natal is 10 014 500. Of these, 51.5% are female, representing a slight gender imbalance
relative to the national average.2 At the time of the 2001 National Census KwaZulu-Natal held 21.1% of
the total population of South Africa. The Mid Year Estimates indicate that by 2007 this had fallen to
20.9%. This relatively marginal decrease may reflect a migration towards the primary metropolis.3 It may
also reflect the effect on KwaZulu-Natal of the HIV/AIDS pandemic. The argument is that provincial
1 Hereafter refer to as Mid Year Estimates. 2 South Africa has something of a gender imbalance with 50.7% of the population female. This is, however, well within international norms. 3 For the same period Gauteng (the central metropolis) recorded an increase of a 19.2% share of the national population in 2002 to 20.2% in 2007. This is very significant.
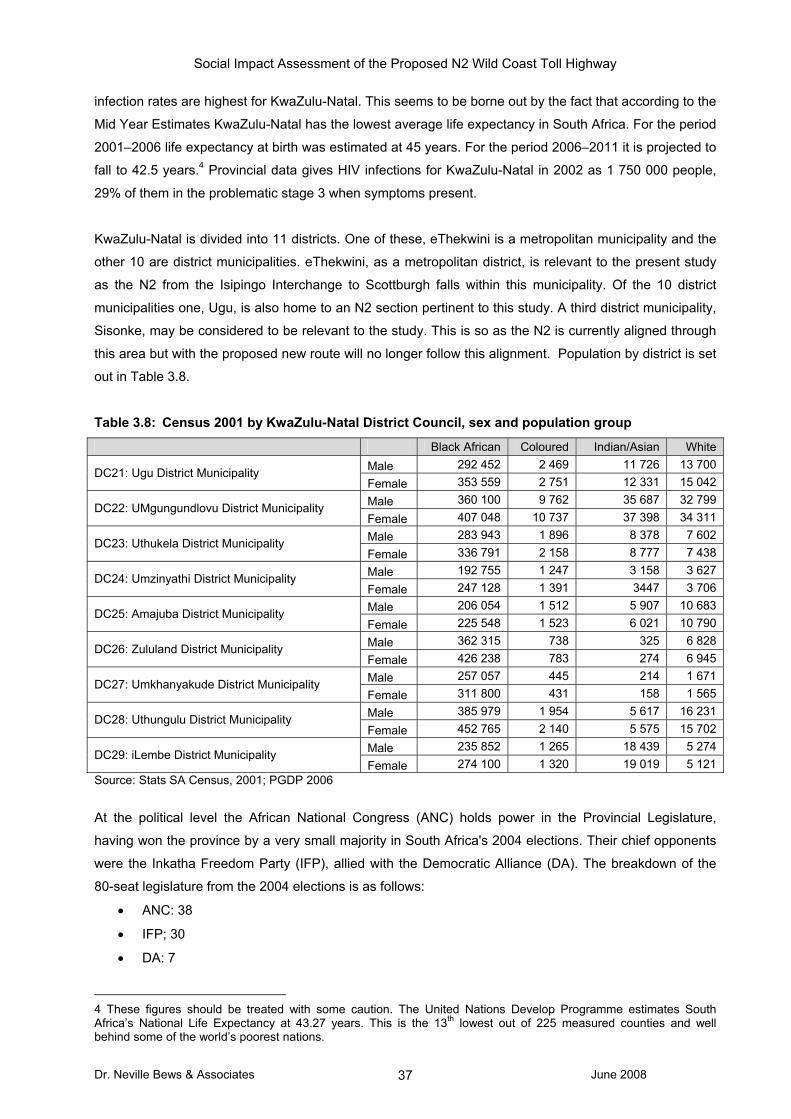
Social Impact Assessment of the Proposed N2 Wild Coast Toll Highway
Dr. Neville Bews & Associates June 2008 37
infection rates are highest for KwaZulu-Natal. This seems to be borne out by the fact that according to the
Mid Year Estimates KwaZulu-Natal has the lowest average life expectancy in South Africa. For the period
2001–2006 life expectancy at birth was estimated at 45 years. For the period 2006–2011 it is projected to
fall to 42.5 years.4 Provincial data gives HIV infections for KwaZulu-Natal in 2002 as 1 750 000 people,
29% of them in the problematic stage 3 when symptoms present.
KwaZulu-Natal is divided into 11 districts. One of these, eThekwini is a metropolitan municipality and the
other 10 are district municipalities. eThekwini, as a metropolitan district, is relevant to the present study
as the N2 from the Isipingo Interchange to Scottburgh falls within this municipality. Of the 10 district
municipalities one, Ugu, is also home to an N2 section pertinent to this study. A third district municipality,
Sisonke, may be considered to be relevant to the study. This is so as the N2 is currently aligned through
this area but with the proposed new route will no longer follow this alignment. Population by district is set
out in Table 3.8.
Table 3.8: Census 2001 by KwaZulu-Natal District Council, sex and population group
Black African Coloured Indian/Asian White Male 292 452 2 469 11 726 13 700
DC21: Ugu District Municipality Female 353 559 2 751 12 331 15 042 Male 360 100 9 762 35 687 32 799
DC22: UMgungundlovu District Municipality Female 407 048 10 737 37 398 34 311 Male 283 943 1 896 8 378 7 602
DC23: Uthukela District Municipality Female 336 791 2 158 8 777 7 438 Male 192 755 1 247 3 158 3 627
DC24: Umzinyathi District Municipality Female 247 128 1 391 3447 3 706 Male 206 054 1 512 5 907 10 683
DC25: Amajuba District Municipality Female 225 548 1 523 6 021 10 790 Male 362 315 738 325 6 828
DC26: Zululand District Municipality Female 426 238 783 274 6 945 Male 257 057 445 214 1 671
DC27: Umkhanyakude District Municipality Female 311 800 431 158 1 565 Male 385 979 1 954 5 617 16 231
DC28: Uthungulu District Municipality Female 452 765 2 140 5 575 15 702 Male 235 852 1 265 18 439 5 274
DC29: iLembe District Municipality Female 274 100 1 320 19 019 5 121
Source: Stats SA Census, 2001; PGDP 2006
At the political level the African National Congress (ANC) holds power in the Provincial Legislature,
having won the province by a very small majority in South Africa's 2004 elections. Their chief opponents
were the Inkatha Freedom Party (IFP), allied with the Democratic Alliance (DA). The breakdown of the
80-seat legislature from the 2004 elections is as follows:
• ANC: 38
• IFP; 30
• DA: 7
4 These figures should be treated with some caution. The United Nations Develop Programme estimates South Africa’s National Life Expectancy at 43.27 years. This is the 13th lowest out of 225 measured counties and well behind some of the world’s poorest nations.

Social Impact Assessment of the Proposed N2 Wild Coast Toll Highway
Dr. Neville Bews & Associates June 2008 38
• African Christian Democratic Party (ACDP): 2
• Minority Front (MF): 2
• United Democratic Movement (UDM): 1.
The Kingdom of KwaZulu-Natal, as the name may suggest, is also the home to the Zulu monarch, King
Goodwill Zwelithini kaBhekuzulu. Although not holding any direct political power, the Zulu king is provided
a stipend by the government, and holds considerable sway over more traditionalist Zulu people in the
province.
Within the economy of the province, Durban is a rapidly growing urban area and is one of the busiest
ports in Africa with a good rail network reaching into Southern Africa. Sugar refining is the main industry.
Industries, located mainly in and around Durban, include, besides sugar refineries, textile, clothing,
rubber, fertiliser, paper, vehicle assembly and food-processing plants, tanneries, and oil refineries. Within
the rural areas surrounding Durban sheep, cattle, dairy, citrus fruits, corn, sorghum, cotton, bananas, and
pineapples are also farmed. There are large aluminium-smelting plants at Richards Bay, on the central
coast. The province produces a considerable amount of coal, especially coke, and timber. About 82% of
the population is black. During apartheid, a large percentage of the population was forced to live in Bantu
homelands (Bantustans), which had a subsistence economy based on the raising of cattle and
subsistence crop farming.
Histograms 3.2 and 3.3 give an overview of the economic makeup of the province by sector. As can be
determined by a comparison of these graphs, KwaZulu-Natal is a disproportionately industrial province,
and much of the relative fortune and misfortune of the province in national context tends to hinge around
this.
Histogram 3.2: KwaZulu-Natal’s broad sectoral profile 2000
Gross Geographic Product Sector KZN - 2000
0
5
10
15
20
25
30
35
2000
Sector
Perc
enta
ges
Manufacturing
Finance, Insurance, Real Estate and BusinessServ icesGovernment and Community Serv ices
Trade: Wholesale, Retail and Accommodation
Transport, Storage and Communication
Mining and Quarry ing
Agriculture and Fisheries
Electircity and Water
Construction

Social Impact Assessment of the Proposed N2 Wild Coast Toll Highway
Dr. Neville Bews & Associates June 2008 39
Histogram 3.3: The national sectoral profile 2001
Partly because of the initially negative effects upon local manufacturing of the rapid integration of South
Africa into the world economy during the 1990s, KwaZulu-Natal was languishing in economic terms
during much of the 1990s. Consequently, the relative socioeconomic state of the province in the early
1990s was actually more positive than in 2004. Most apparently there was relatively more unemployed
within KwaZulu-Natal in the early part of the first decade of the 21st century. Looking at the KwaZulu-Natal
labour market in 2005, it was estimated, by the KwaZulu-Natal treasury that:
• 9.8 million people lived in KwaZulu-Natal, of which:
• 6.0 million were potential workers (labour force). Of these potential workers, only
• 2.1 million were employed,
• 2.9 million were not economically active, and
• 0.9 million were unemployed (31.7% unemployment rate).
The Labour Force Survey (September 2007) indicates that the unemployment situation in KwaZulu-Natal
is, however, relatively fluid. From a peak of 36.3% unemployed in March 2002 the rate had fallen to
29.2% in March 2005. As is indicated in the section on the Eastern Cape, these figures are not always a
true reflection of the actual unemployment position as definitions of ‘unemployed’ generally exclude the
‘discouraged work seekers’ as well as ‘underemployed’. Data relating to the expanded definition of
unemployment is given in Table 3.9.
NATIONAL ACCOUNTS: The Contribution of the Various Industries to the
GDP at Basic Prices - 2001
0
5
10
15
20
25
Manufa
cturin
g
Financ
e
Govern
mentTra
de
Trans
port
Mining
Agri
Electric
ity
Constr
uctio
nOthe
r
Various Industries
Perc
enta
ges
Percentage

Social Impact Assessment of the Proposed N2 Wild Coast Toll Highway
Dr. Neville Bews & Associates June 2008 40
Table 3.9.: Unemployment rate (expanded definition) by gender and race in 2001 for South Africa,
Province of KwaZulu-Natal and the two districts affected by the proposed development
Race Gender National total KwaZulu-Natal Male 38.0% 55.2% Female 56.7% 60.2% Black Total 46.6% 67.7% Male 6.2% 6.1% Female 11.6% 10.9% White Total 8.5% 8.1% Male 22.7% 25.6% Female 34.3% 38.3% Coloured Total 28.0% 31.7% Male 15.5% 12.3% Female 33.9% 25.2% Asian Total 22.2% 18.7%
Source: Stats SA Census, 2001; PGDP, 2006 Note: the expanded definition of unemployed includes housewives and persons who choose not to work or could not find work
Average household income in 2001 for South Africa as a whole was R46 291, while for KwaZulu-Natal it
was R37 814 (Stats SA, 2001). This was about 80% of the national average income but the fourth highest
level of income for the provinces. The provincial average is however skewed by the Durban metropolis
that has a higher household average income than the South African average as a whole.
Also according to Provincial Treasury, social grant beneficiaries in the province went up from 685 000 in
April 2000 to 1 314 000 in April 2003 and 1 617 000 in 2006 indicating growing dependency on state
assistance for household survival.
These poverty indicators can be reflected in the HDI, the preferred indicator used by the United Nations to
measure a country or region’s development. This composite index is an average of three indexes
reflecting a country’s achievements in health (as measured by life expectancy at birth), education
(measured by adult literacy), and living standard (measured by GDPR per capita). The HDI translates the
benefits of economic growth into a quality of life for the people. In 2003 the HDI for KwaZulu-Natal was
0.56. This was below the national average of 1.6 for the country as a whole.
According to ABSA’s research department, nett economic growth for the entire 1990s in KwaZulu-Natal
was actually negative; and between 1996 and 2000 alone 135 000 jobs were lost in the province but with
some gains since. These problems have been expressed unevenly – there are vast differences between,
for example, the Durban metro and selected growth nodes and the rest of the province.
The November 2004 draft of the KwaZulu-Natal Government’s Provincial Growth and Development
Strategy corroborates the abovementioned scenario and offers, amongst other considerations, three
provincial indicators which it intends to enhance over the next five years which are listed below as:
• Economic growth rate of 2.1%.
• 28.2% of households earned less than R800 per month (2001).


