

1
Prospective analysis of parametric MRI biomarkers: Identification of early and
distinct glioma response patterns not predicted by standard radiographic
assessment
Craig J. Galbán1, Thomas L. Chenevert1, Charles R. Meyer1, Christina Tsien2, Theodore S. Lawrence2,
Daniel A. Hamstra2, Larry Junck3, Pia C. Sundgren1, Timothy D. Johnson4, Stefanie Galbán2, Judith S. Sebolt-Leopold1,
Alnawaz Rehemtulla1,2, and Brian D. Ross1
Departments of 1Radiology, 2Radiation Oncology, 3Neurology and 4Biostatistics, University of Michigan, Center for
Molecular Imaging, Ann Arbor, Michigan 48109 USA
Correspondence: Brian D. Ross, Ph.D., The University of Michigan, Center for Molecular Imaging, Department of Radiology, Biomedical Sciences Research Building, 109 Zina Pitcher Place, Ann Arbor, MI 48109-0220, Phone: 734-763-2099, Fax: 734-763-5447
E-mail: [email protected]
Running title: MRI biomarker for therapy-induced response in gliomas.
Key words: DW-MRI, DSC-MRI, glioma, prospective trial, treatment response
Research. on December 24, 2018. © 2011 American Association for Cancerclincancerres.aacrjournals.org Downloaded from
Author manuscripts have been peer reviewed and accepted for publication but have not yet been edited. Author Manuscript Published OnlineFirst on April 28, 2011; DOI: 10.1158/1078-0432.CCR-10-2098

2
Translational Relevance (150 words) Imaging biomarkers capable of providing early cancer treatment response assessment would allow the opportunity to
individualize patient care. For this purpose, images can be obtained which detect treatment-associated alterations in
tissue properties including cellular viability, vascular function and volume, biochemical, and molecular responses. In this
study, multi-parametric quantification of perfusion and diffusion-weighted MRI brain tumor maps was accomplished using
a novel voxel-by-voxel analysis approach know as the parametric response map (PRM). The PRM composite imaging
biomarker was found to provide early identification of patients resistant to standard chemoradiation. Validation of the
PRM imaging biomarker would allow for routine clinical application as an early identifier of patients who may benefit from
alternative treatment strategies.
Research. on December 24, 2018. © 2011 American Association for Cancerclincancerres.aacrjournals.org Downloaded from
Author manuscripts have been peer reviewed and accepted for publication but have not yet been edited. Author Manuscript Published OnlineFirst on April 28, 2011; DOI: 10.1158/1078-0432.CCR-10-2098
3
Abstract
Purpose: Currently, radiologic response of brain tumors is assessed according to the Macdonald criteria 10 weeks from
the start of therapy. There exists a critical need to identify non-responding patients early in the course of their therapy for
consideration of alternative treatment strategies. Our study assessed the effectiveness of the Parametric Response Map
(PRM) imaging biomarker to provide for an earlier measure of patient survival prediction.
Experimental Design: Forty-five high grade glioma patients received concurrent chemoradiation. Quantitative MRI
including apparent diffusion coefficient (ADC) and relative cerebral blood volume (rCBV) maps were acquired pre-
treatment and 3 weeks mid-treatment on a prospective institutional-approved study. PRM, a voxel-by-voxel image
analysis method, was evaluated as an early prognostic biomarker of overall survival. Clinical and conventional MR
parameters were also evaluated.
Results: Multivariate analysis showed that PRMADC+ in combination with PRMrCBV- obtained at week 3 had a stronger
correlation to one-year and overall survival rates than any baseline clinical or treatment response imaging metric. The
composite biomarker identified three distinct patient groups, non-responders (median survival (MS) of 5.5 months CI:
4.4-6.6) months, partial responders (MS of 16 months CI: 8.6-23.4) and responders (MS has not yet been reached.)
Conclusions: Inclusion of PRMADC+ and PRMrCBV- into a single imaging biomarker metric provided early identification of
patients resistant to standard chemoradiation. In comparison to the current standard of assessment of response at 10
weeks (MacDonald Criteria) the composite PRM biomarker potentially provides a useful opportunity for clinicians to
identify patients who may benefit from alternative treatment strategies.
Funding: This work was supported by the US National Institutes of Health research grants P01CA085878, P01CA087634
and P50CA093990.
Research. on December 24, 2018. © 2011 American Association for Cancerclincancerres.aacrjournals.org Downloaded from
Author manuscripts have been peer reviewed and accepted for publication but have not yet been edited. Author Manuscript Published OnlineFirst on April 28, 2011; DOI: 10.1158/1078-0432.CCR-10-2098
4
Introduction
The standard of care for patients with high grade gliomas is concomitant and adjuvant temozolomide and
radiotherapy based on recent clinical results showing improved median and 5-year survival for patients treated with this
chemoradiation regimen (1). Current clinical assessment of treatment response is determined 10 weeks post-treatment
initiation based on Macdonald criteria(2-3). Limitations in accurate assessment of response has led to the development
of a new standardized response criteria that accounts for transient changes in tumor volume post-therapy by the
Response Assessment in Neuro-Oncology Working Group (RANO)(4) . There exists a critical need for the development
of individualized approaches to the treatment of this disease, which has a one year survival rate of roughly 50%. In this
regard, MGMT-promoter methylation status is a potential predictive biomarker for selection of brain tumor patients who
may derive the most benefit from treatment with temozolomide and radiotherapy (5). This initial success provides
motivation for the development of non-invasive imaging biomarkers of response capable of predicting sensitivity to novel
therapeutic interventions since not all patients are able to undergo surgical resection and provide sufficient tissue for
MGMT analysis. The potential for using quantitative imaging modalities as early surrogate markers of response is
compelling due to the ability to noninvasively detect treatment-associated functional and metabolic changes (6).
In this study, we investigated a multi-modality image-based response biomarker for high grade gliomas in order to
more accurately predict treatment outcome early. Identification and validation of an image biomarker could provide the
opportunity to select patients that may benefit from alternative treatment strategies. Quantitative magnetic resonance
imaging (MRI) can provide structural and functional information regarding tumor cellularity and perfusion characteristics
that compliment anatomical MRI. The value of this approach is that the microenvironment and physiology of the tumor
can be monitored noninvasively, allowing for early assessment of tumor therapy response prior to treatment completion.
Two techniques investigated for their diagnostic and prognostic value in brain tumor patients are diffusion weighted
(DW)-MRI and dynamic susceptibility contrast (DSC)-MRI (7-8). DW-MRI, capable of measuring the random thermal
(Brownian) motion of water, samples the tumor microenvironment on a subcellular level. A drop in tumor cellularity as a
result of significant cell-kill following effective therapy has been associated with an increase in water diffusivity as
expressed as the apparent diffusion coefficient (ADC) (9). This trend has been observed in preclinical and clinical studies
supporting the notion of DW-MRI as a surrogate imaging biomarker for treatment response assessment in oncology (10-
12). DSC-MRI, capable of quantifying changes in tumor hemodynamics, provides information on neovascularity and
angiogenesis (13-17). At present, the relative cerebral blood volume (rCBV), as measured by DSC-MRI, has shown
promise in determining tumor grade as well as prediction and early assessment of patient clinical response (18-21).
Imaging biomarkers (i.e. ADC or rCBV) of tumor response have historically been evaluated using the mean
Research. on December 24, 2018. © 2011 American Association for Cancerclincancerres.aacrjournals.org Downloaded from
Author manuscripts have been peer reviewed and accepted for publication but have not yet been edited. Author Manuscript Published OnlineFirst on April 28, 2011; DOI: 10.1158/1078-0432.CCR-10-2098

5
change in the whole tumor volume as the quantitative metric for detection of therapeutic efficacy. However, tumor
heterogeneity is an inherent property of glioblastoma multiforme (GBM) and therefore standard methods of analysis using
average values throughout an entire tumor can significantly under-estimate regional changes following therapy. In 2005
Moffat and colleagues proposed a new approach for evaluating tumor response using serial ADC maps termed the
“functional diffusion map” (fDM) (22). For the first time changes in ADC were evaluated on a voxel-wise basis by spatially
aligning (via image registration) serial ADC maps acquired pre- and mid-therapy. The tumor volume fraction that exhibited
a significant increase in mid-treatment ADC from baseline values was found to be predictive of 10 week radiological
response in a cohort of 20 glioma patients as early as three weeks into therapy. This technique has now been
established in multiple clinical sites, including breast cancer, prostate cancer, metastatic cancer to the bone and head and
neck cancer (23-29). For the most part, this technique has only been applied to ADC maps. In 2009, the voxel-based
approach was extended to rCBV maps acquired from DSC-MRI of 44 glioma patients. Now referred to more generally as
the “parametric response map” (PRM), this post-processing approach when applied to rCBV (PRMrCBV) was predictive of
survival as early as one week post-treatment initiation as well as distinguishing progression from pseudo-progression (30-
31).
We report here the outcome of a prospective single-center trial of WHO Gr 3 and 4 glioma patients that was
designed to evaluate the predictive accuracy of PRMADC and PRMrCBV imaging biomarkers as single and composite
metrics of early treatment response as assessed 3 week post-treatment initiation. We compared parametric models
using PRM imaging metrics from all patients (n=45) to assess correlation with one year and overall survival.
Research. on December 24, 2018. © 2011 American Association for Cancerclincancerres.aacrjournals.org Downloaded from
Author manuscripts have been peer reviewed and accepted for publication but have not yet been edited. Author Manuscript Published OnlineFirst on April 28, 2011; DOI: 10.1158/1078-0432.CCR-10-2098

6
Results
Patient Population
A total of 45 subjects with high-grade glioma were included in this prospective study (Table 1). The median
survival for the population, as determined by Kaplan-Meier analysis was 14.9 months (95% confidence interval: 8.6-21.2
months) with 56% of the patient population realizing one-year survival. Patients expiring prior to one year had a median
survival of 6.6 months (95% confidence interval: 4.4-8.8 months) whereas those whose survival was beyond one year had
a median survival of 35.1 months (95% confidence interval: 13.7-56.5 months). Patient age, Radiation Therapy Oncology
Group Recursive Partitioning Analysis (RTOG RPA) (32) and Radiological Response (RR) at 10 weeks, were found to be
significant predictors of one-year survival (p=0.003, p=0.025 and p=0.001, respectively) (Table 1).
Individually PRMADC and PRMrCBV have been reported to be predictive biomarkers of clinical outcome (30, 33).
The underlying mechanisms driving therapeutic-induced alterations in ADC and rCBV differ and therefore the predictive
value of the outcome measures of PRM (PRMX+ and PRMX-) vary on the quantitative parameter used for analysis. A large
volume fraction of the tumor with significantly increasing ADC (PRMADC+) correlated with overall survival, unlike PRMADC-
which had no predictive value. In stark contrast, a small volume fraction of tumor with decreasing rCBV (PRMrCBV-)
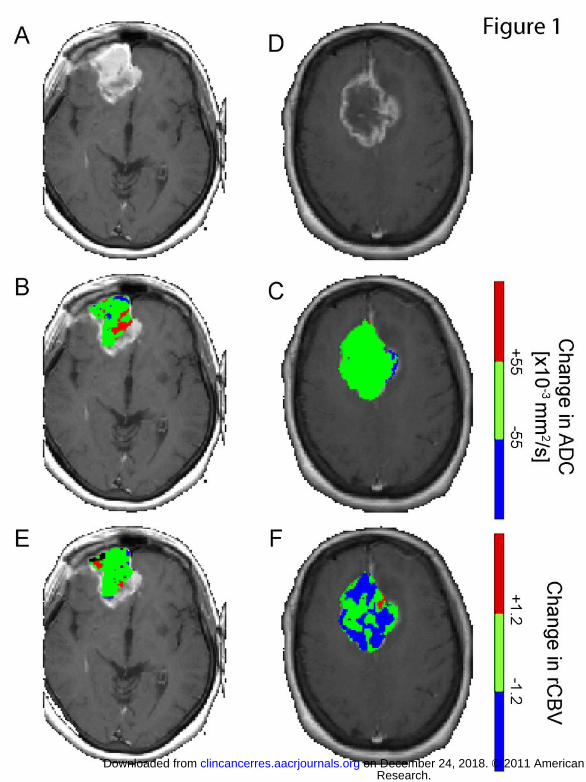
correlated with a positive outcome, where no predictive value was observed for PRMrCBV+. Color-overlays of PRMADC and
PRMrCBV at week 3 post-treatment initiation of a representative responder (overall survival=17months; PRMADC+=12%;
PRMrCBV-=4%) and non-responder (overall survival=2months; PRMADC+=1%; PRMrCBV-=40%) show spatial variation in the
response of these tumors with respect to water diffusivity and blood volume (Figure 1). Both lesions had high vascular
irregularities as can be presumed from the immense contrast-enhancement on the T1-weighted images (Figure 1A,D).
The complex changes in tumor cellularity and vasculature following a therapeutic intervention appear from the PRM
overlays to be somewhat dissociated from each other. For example, the responding tumor clearly showed regions of
increased ADC, denoted in red, (Fig. 1B), which is associated with a loss in tumor cellularity. These same regions had
statistically no change in rCBV (green area in Fig. 1E). In contrast, a significant volume of the non-responding tumor
showed no change in ADC, Figure 1C, suggesting no real loss of tumor cellularity. Unlike ADC, Figure 1F shows that a
substantial fraction of tumor underwent a significant drop in rCBV post-treatment initiation, perhaps suggesting increased
hypoxia in the tumor conferring radioresistance. Therefore, the combination of diffusion and perfusion imaging may
provide complementary information that serves to improve sensitivity and specificity in predicting patient outcome. To
evaluate a combined metric related to these physiological changes to treatment, we analyzed these parameters as a
unified predictive metric of survival.
We first assessed the sensitivity of the individual parameter models (PRMADC+ and PRMrCBV-) and composite
Research. on December 24, 2018. © 2011 American Association for Cancerclincancerres.aacrjournals.org Downloaded from
Author manuscripts have been peer reviewed and accepted for publication but have not yet been edited. Author Manuscript Published OnlineFirst on April 28, 2011; DOI: 10.1158/1078-0432.CCR-10-2098
7
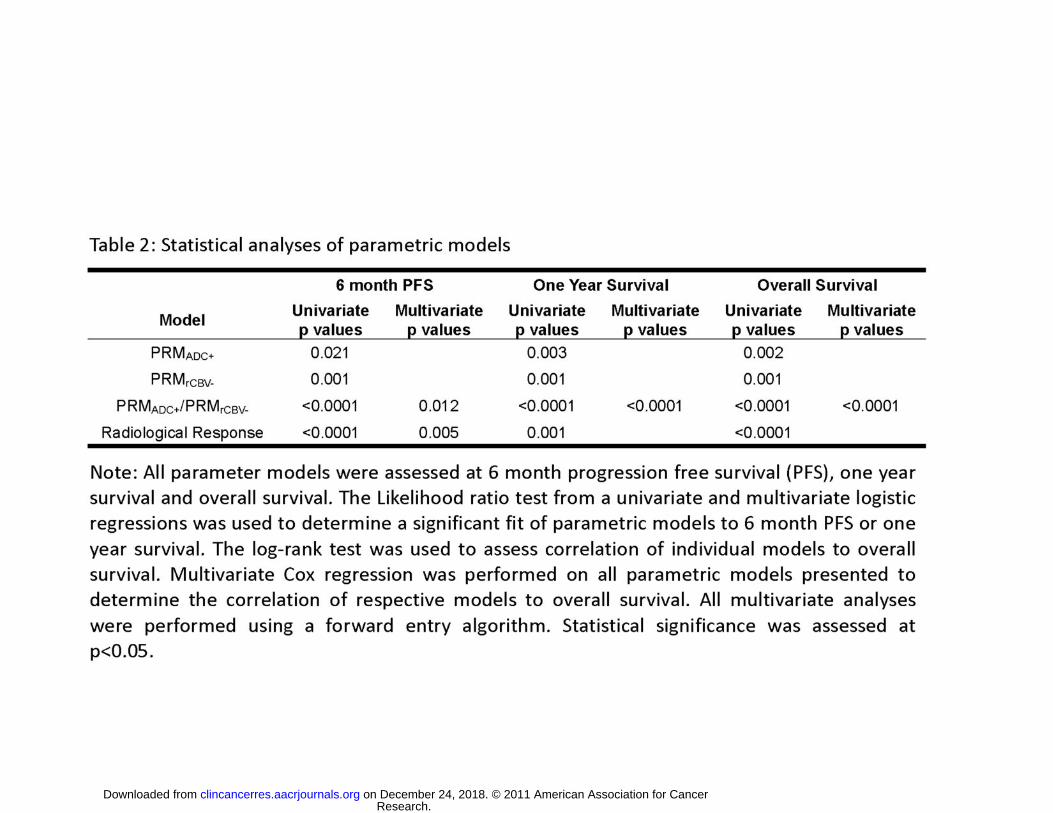
model (PRMADC+/PRMrCBV-), as well as RR for comparison, to predict 6 month progression free survival (PFS) and one
year survival in our cohort of patients using a logistic regression. Univariate analysis found a strong correlation of
parametric models with both 6 month PFS and one year survival (Table 2). Inclusion of all four imaging metrics (PRMADC+,
PRMrCBV-, PRMADC+/PRMrCBV- and RR) into a single multivariate logistic regression showed that PRMADC+/PRMrCBV- and RR
provided the strongest statistical power for assessing 6 month PFS (p=0.012 and p=0.005, respectively) but only
PRMADC+/PRMrCBV- for assessing one year survival (p<0.0001). To determine the statistical power of age, dichotomized
based on responders ≥50 years and non-responders <50 years, and RPA RTOG against the imaging models, a
multivariate analysis was performed with age, RTOG RPA, PRMADC+ and PRMrCBV- for assessing one-year survival. Both
age and RTOG RPA classification were not found to contribute to the statistical model.
Stratification of the patient population by each of the four models used, which includes RR, are presented as
Kaplan-Meier plots in Figure 2. The median survivals for non-responders and responders as determined by PRMADC+ were
8.3 months (95% confidence interval (CI): 6.2-10.4; n=25) and not reached (n=20), respectively. Using PRMrCBV- to
categorize non-responders and responders, there median survival was found to be 7.1 months (95% CI: 5.1-9.1; n=22)
and 20.4 months (95% CI: 1.7-39.1; n=23), respectively. Median survivals for non-responders and responders as
determined by RR were 8.1 months (95% CI: 6.0-10.2; n=19) and not reached (n=26), respectively. For the composite
PRM model with the three discrete response groups median survivals for non-responders, intermediate and responders
were 5.5 months (95% CI: 4.4-6.6 months n=14), 16 months (8.6-23.4 months n=19) and not reached (n=12),
respectively. Using a log-rank test to assess significance, all four models were highly predictive of overall survival (Table
2). Performing this same statistical test pair-wise between response groups defined by the composite model found that
non-responders had a significantly shorter survival than the intermediate and responder subpopulations (p<0.0001).
Although not found to be significant based on our statistical criteria (p<0.05), the survival of responders when compared to
intermediate generated a p value of 0.06. This is partly attributed to the small numbers analyzed in this study. Assessment
of overall survival of all models in a unified multivariate test found PRMADC+/PRMrCBV- assessed at week 3 mid-treatment to
have the strongest statistical power even over RR.
In the cohort of patients studied, eight were diagnosed with grade 3 gliomas. Additional analysis was performed
to determine if inclusion of these patients adversely affected the results presented above. As observed in Table 1, 7 of
these patients had survived longer than one year with only a single patient surviving less than a year (OS was 5.1
months). This lone patient had a tumor that exhibited PRM values of ADC and rCBV indicative of a tumor non-responsive
to therapy. Based on these results, the composite PRM categorized this patient as a non-responder. In fact, out of the 8
patients with grade 3 glioma , the composite model of PRM only identified the referenced patient as a non-responder, 3
Research. on December 24, 2018. © 2011 American Association for Cancerclincancerres.aacrjournals.org Downloaded from
Author manuscripts have been peer reviewed and accepted for publication but have not yet been edited. Author Manuscript Published OnlineFirst on April 28, 2011; DOI: 10.1158/1078-0432.CCR-10-2098
8
were intermediate (mean OS (SD) was 22 (6.7) months) and 4 were responders (mean OS (SD) was 35 (19) months).
Finally, assessment of the composite PRM model when limited to grade 4 gliomas found the composite PRM to be
significant for OS (p<0.0001) with median survivals of 6 months (n=13) for non-responders, 12.8 months (n=16) for
intermediate response, and median survival not reached at greater than 30 months in the 8 patients scored as responsive.
Multivariate analyses, analogous to those performed in Table 2, of patients with grade 4 gliomas (n=37) identified a strong
correlation of PRMADC+/PRMrCBV- and RR to 6 month PFS (p=0.016 and p=0.02, respectively) and only PRMADC+/PRMrCBV-
to both one year survival (p=0.002) and overall survival (p<0.0001).
Research. on December 24, 2018. © 2011 American Association for Cancerclincancerres.aacrjournals.org Downloaded from
Author manuscripts have been peer reviewed and accepted for publication but have not yet been edited. Author Manuscript Published OnlineFirst on April 28, 2011; DOI: 10.1158/1078-0432.CCR-10-2098

9
Discussion
Personalized medicine in cancer care is slowly becoming a reality from the “one-size fits all” approach. Advances
in molecular and histological biomarkers are now providing detailed information on tumor biology that is being used to
individualize therapy (34). Pretreatment assessment using molecular and histological biomarkers is increasingly being
used to dictate initial choice of therapy. There is also a critical need for the deployment of surrogate biomarkers of
response to provide real-time information on the state of the tumor mid-treatment. With respect to assessment of
treatment in GBM patients, modern advancements in neuroimaging techniques, such as MRI, positron emission
tomography (PET), single photon emission computed tomography (SPECT) and computed tomography (CT), are
providing detailed functional and quantitative information on tumor heterogeneity. More specifically, techniques utilizing
MRI, with its high tissue contrast and resolution, are capable of imaging with high sensitivity changes in tumor
microenvironment and hemodynamics at the cellular level allowing for early serial assessment of a tumor during
treatment.
Standard management of malignant high grade gliomas continues to be concurrent temozolomide and radiation
60 Gy followed by adjuvant TMZ. Currently, randomized phase III studies are being conducted to determine the additional
benefit of novel targeted therapies, including various signal transduction inhibitors encompassing monoclonal antibodies,
e.g. Avastin (bevacizumab), as well as small molecules. However, these therapies are unlikely to benefit all patients and
are extremely costly and associated with a significant increase in the risk of toxicity. Reliable predictive imaging
biomarkers of response are important in selecting those patients most likely to benefit from alternative treatment
strategies and selecting those patients as early as possible.
We and others have found quantitative neuroimaging methods are highly sensitive to analyzing treatment-
induced cellularity and hemodynamic alterations within the tumor. Difficulties in analyzing these parametric maps ensue
from the high spatial heterogeneity typical of gliomas. By focusing on regions of increasing or decreasing parameter
value, the functional behavior of the tumor can be spatially dissected and interpreted for its prognostic value. Our group
has demonstrated the improved prognostic capabilities of quantitative imaging techniques (DW- and DSC-MRI) when
analyzed by PRM, which has been compared to standard histogram-based methods and radiological response (30, 33).
Expanding further, we have demonstrated in the present study that a composite of ADC and rCBV as analyzed by PRM
enhances the sensitivity of the biomarker for predicting those patients resistant to chemoradiation at 3 weeks post-
treatment initiation.
It is important to note that administration of steroid would have no confounding effect on the results reported in
this study. As indicated in the manuscript steroid doses were closely followed prior to treatment, weekly during radiation
Research. on December 24, 2018. © 2011 American Association for Cancerclincancerres.aacrjournals.org Downloaded from
Author manuscripts have been peer reviewed and accepted for publication but have not yet been edited. Author Manuscript Published OnlineFirst on April 28, 2011; DOI: 10.1158/1078-0432.CCR-10-2098

10
therapy, and at the time of each MRI (pre-treatment and 3 weeks during treatment). Given the close timing between the
pre-treatment scan (within 5 days prior to the start of treatment) and the 3 week scan (on average <21 days from the start
of treatment) there were minimal to no changes in steroid dosing over this short time period. It has been our standard
clinical practice not to taper steroids during the first several weeks of radiation therapy due to concerns for possible
increased edema during the early course of therapy. Therefore, steroid doses were typically not adjusted until weeks 3-6
of radiation therapy. Further, the benefit seen by composite PRM was not simply a measure of generalized steroid effect
since previous results have shown that the percentage change in either ADC and rCBV would also have been impacted
by steroid dosing and were not prognostic (30, 33).
Varying MRI field strengths as well as Gd-DTPA doses used in DSC-MRI for calculating CBV were also not
suspected of affecting the current results. It is important to note that ADC is independent of field strength. Nevertheless,
from the total population studied (n=45), 31 were imaged at 1.5T and the remaining 14 were imaged at 3T. To avoid
variability between scanners, the same scanner was used for a given patient throughout the study. An additional analysis
was performed to determine if there were any systematic differences in mean ADC and rCBV values pre-therapy and at
week 3 mid-treatment as well as differences in PRMADC+ and PRMrCBV- as a result of field strength using an unpaired
Student’s t-test. No significant differences in imaging parameters were observed as a result of field strength. As for
varying dosing of contrast agent, our algorithm for calculating CBV mitigates the effects of variable Gd-DTPA dose by use
of the arterial input function measured on each patient individually, which implicitly scales with the same dose factor. All
our CBV analyses use values normalized by white matter CBV which further reduces dose dependency. To mitigate
leakage bias as a result of T1 effects, we employed a pre-injection of contrast agent prior to a second bolus given during
dynamic T2* imaging. In addition, we used a relatively long TR of 1.5-2 seconds to further reduce T1-weighting.
This is the first study that describes a composite model of PRMADC+ and PRMrCBV- obtained at week 3 in assessing
tumor response. Our data shows that the composite model is a much stronger predictive factor of overall survival
compared to either metric alone. This composite metric provides a novel imaging biomarker that has significant
implications for early stratification in clinical trials in high grade glioma as well as potentially other clinical sites. When
included in a single multivariate statistical analysis, the composite of PRMADC+ and PRMrCBV- obtained at week 3 was
found to be a much stronger predictor of overall survival than either metric alone, as well as 10 week radiological
response. Use of the composite imaging biomarker not only provides a more early and sensitive method for identifying
populations of responders and nonresponders but also allowed for the identification of a third patient subgroup that
exhibited an intermediate response pattern not previously shown by conventional response criteria. Ongoing studies are
elucidating the molecular determinants of response that differentiate tumors from each of these three response groups.
Research. on December 24, 2018. © 2011 American Association for Cancerclincancerres.aacrjournals.org Downloaded from
Author manuscripts have been peer reviewed and accepted for publication but have not yet been edited. Author Manuscript Published OnlineFirst on April 28, 2011; DOI: 10.1158/1078-0432.CCR-10-2098
11
Such information could ultimately facilitate the design of improved therapies for GBM patients identified in this manner.
A biomarker that allows for early identification of patients resistant to standard of care also provides an
opportunity to reassess treatment options in a timelier manner compared to current clinical practice (35-37). For example,
determination of responsiveness at week 3 into temozolomide with concomitant radiotherapy could allow patients resistant
to standard of care to be given adjuvant treatment or be moved more quickly to an aggressive salvage regimen. To obtain
further support for this approach, we recently initiated a clinical trial utilizing the composite imaging biomarker at week 3
following treatment initiation to select non-responding patients for further treatment intensification with bevacizumab and
dose painting IMRT. While a multicenter trial to validate these findings is warranted, the results presented herein currently
support a future paradigm shift in the current clinical management of GBM to a more individualized approach. In GBM,
this would also provide an opportunity to develop new trials designed to improve patient outcome by selecting patients
likely to benefit from more aggressive or experimental treatment regimens.
Research. on December 24, 2018. © 2011 American Association for Cancerclincancerres.aacrjournals.org Downloaded from
Author manuscripts have been peer reviewed and accepted for publication but have not yet been edited. Author Manuscript Published OnlineFirst on April 28, 2011; DOI: 10.1158/1078-0432.CCR-10-2098

12
Materials and Methods
Patient Population
Patients newly diagnosed with histological confirmed grade III and IV gliomas were enrolled on a protocol of intra-
treatment MRI. This cohort of patients has been used previously in published work investigating the prognostic value of
PRM applied to the individual parameters ADC and rCBV (30, 33). Surgical resection was performed on all patients and
the extent was evaluated by post-operative MRI obtained within 72 hours of resection. Radiotherapy was delivered using
3D-conformal therapy or intensity modulated radiation therapy. Standard techniques were utilized with a 2.0-2.5 cm
margin on either the enhancing region on gadolinium-enhanced scans or the abnormal signal on T2-weighted scans to
46-50 Gy with the central gross tumor treated to a final median dose of 70 Gy in 6-7 weeks (38). Twenty-three of these
individuals were treated on a phase 2 protocol of high-dose (>60 Gy) radiation therapy concurrent with temozolomide 75
mg/m2 daily followed by adjuvant temozolomide 150-200 mg/m2 daily for 5 days of a 28 day cycle. Remaining patients
received radiation alone (n=22). Chemotherapy was commonly administered in both groups depending upon clinical
circumstances (Table 1). None of these patients, accrued from 2000-2006, received any anti-angiogenic therapy during
their primary treatment although some patients did receive Avastin at time of progression. Informed consent was obtained,
and images and medical record use was approved by the University of Michigan Institutional Review Board.
MRI Examination
Patients were evaluated pre-therapy, three and 10 weeks after the start of radiation with follow-up scans every 2
to 3 months. DW- and DSC-MRI as well as standard MRI (fluid attenuation inversion recovery, T2-weighted and
gadolinium-enhanced T1-weighted MRI) were performed on either a 1.5T Signa (General Electric Medical Systems) (n=31
subjects) or 3T Achieva (Philips Medical Systems) (n=14 subjects) system. Radiological response at 10 weeks was based
on changes in tumor volume on T1-weighted contrast-enhanced MRI and steroid doses and was classified as complete
response (CR), partial response (PR), stable disease (SD) and progressive disease (PD)(2). Steroid doses were recorded
before each scan, weekly during radiotherapy, and at each follow-up (39).
Quantitative MRI
DW-MRI utilized a single-shot, spin-echo, diffusion-sensitized, echo-planar imaging (EPI) acquisition sequence.
On the 1.5T system, 24 6-mm axial-oblique sections were acquired using a 22 cm-field of view (FOV) and 128 matrix with
“b-factor” = 0 and 1000 s/mm2 along three orthogonal directions (repetition time (TR) = 1000ms; echo time (TE) = 71 to
100 ms, and number of averages (NS) = 1). On the 3T system, at least 28 4-mm axial-oblique sections were acquired
Research. on December 24, 2018. © 2011 American Association for Cancerclincancerres.aacrjournals.org Downloaded from
Author manuscripts have been peer reviewed and accepted for publication but have not yet been edited. Author Manuscript Published OnlineFirst on April 28, 2011; DOI: 10.1158/1078-0432.CCR-10-2098

13
through the brain using a 24-cm FOV and 128 matrix (TR = 2636 ms; TE = 46ms; NS=1 for b=0, and NS=2 for b=1000
s/mm2). Parallel imaging (sensitivity encoding factor = 3) was used on 3T to reduce spatial distortion. The diffusion
weighted images for the three orthogonal directions were used to calculate an apparent diffusion coefficient (ADC) map
(33).
For DSC-MRI, 14 to 20 slices were acquired by a gradient-echo echo-planar imaging pulse sequence (TR=1.5 to
2s, TE=50 to 60ms, field of view 220x220 mm2, matrix 128x128, flip angle 60o, and 4 to 6mm thickness and 0mm gap).
Gadolinium-diethylenetriamine pentaacetic acid (Gd-DTPA; Bayer HealthCare Pharmaceuticals) was injected
intravenously with a dose of 0.05 to 0.1ml kg-1 as a bolus using a power injector at a rate of 2 mL s-1, followed immediately
by 15 cc of saline flush at the same rate. Subsequently a Gd-enhanced T1-weighted imaging was acquired. Cerebral
blood volume (CBV) map was generated from DSC images as described previously (40). To assess differences in tumor
blood volume during chemoradiation therapy (cRT) and between subjects, CBV maps were normalized to values within
white matter regions contralateral to the tumor to generate relative CBV maps (rCBV). For simplicity in notation, relative
blood volumes for both brain and tumor have been denoted by “rCBV” throughout this article. The following guidelines
were used to define the white matter regions of interest for normalization: (1) contralateral to tumor, (2) received <30 Gy
accumulated dose, and (3) as large as possible but avoiding regions with susceptibility artifacts and partial volume
averaging.
Image Analysis
Pre- and 3 week mid-treatment ADC and rCBV maps were co-registered to Gd-enhanced T1-weighted images
acquired before cRT using mutual information as an objective function and simplex as an optimizer (41). The co-
registration of different and similar weighted MRI scans for the same subject is totally automatic and assumes a rigid-body
geometry relationship, i.e. rotation and translation, between head scans. Following co-registration, brain tumors, manually
contoured by a neuroradiologist, were defined within the enhancing regions of the tumor on the Gd-enhanced T1-
weighted images. Only patients with contrast-enhancing tumors ≥ 4cc were included in this study. For simplicity, tumor will
refer to only the contrast-enhancing volume on a T1-weighted post-contrast image. Shrinkage or growth of the tumor
during the time between scans may have occurred; therefore, only voxels that are contrast enhancing on both the pre-RT
and mid-RT tumor volumes were included. Subsequent to co-registration, the resultant maps consist of spatially aligned
voxels with ADC and rCBV values prior and 3 weeks following treatment initiation.
The Parametric Response Map of any parameter (PRMX, where X denotes any parametric map such as ADC and
rCBV) was determined by first calculating the difference between X (ΔX = mid X – baseline X) for each voxel within the
Research. on December 24, 2018. © 2011 American Association for Cancerclincancerres.aacrjournals.org Downloaded from
Author manuscripts have been peer reviewed and accepted for publication but have not yet been edited. Author Manuscript Published OnlineFirst on April 28, 2011; DOI: 10.1158/1078-0432.CCR-10-2098

14
tumor pre-therapy and at week 3 post-treatment initiation. Voxels yielding ΔX greater than a predetermined threshold (set
to 1.2 and 55 for rCBV and ADC, respectively; details described previously (22, 30, 33)), were designated red (i.e.
ΔrCBV > 1.2; ΔADC > 55). Blue voxels represent volumes whose parameter value decreased by more than the threshold
(i.e. ΔrCBV < -1.2; ΔADC < -55) and the green voxels represent voxels within the tumor that were unchanged (i.e. |ΔrCBV|
≤ 1.2; |ΔADC| ≤ 5.5). The volume fractions within the tumor determined from PRMX were PRMX+ for increasing X, PRMX-
for decreasing X, and PRMX0 for unchanged X.
Data and Statistical Analyses
The patient population was stratified based on previously reported cutoff values of 4.7% and 6.8% for PRMADC and
PRMrCBV, respectively (30, 33). The composite model of these two dichotomized metrics was determined by categorizing
patients as responders, non-responders or intermediate. Patients were designated non-responding if both single metrics
predict non-responding (PRMADC+<4.7% and PRMrCBV->6.8%), whereas patients were designated responders when both
single metrics predict responder (PRMADC+≥4.7% and PRMrCBV-≤6.8%). For the cases where single metrics were in
disagreement patients were designated intermediate (PRMADC+≥4.7% and PRMrCBV->6.8% or PRMADC+<4.7% and
PRMrCBV-≤6.8%). A univariate and multivariate logistic regression with forward entry was used to assess the predictive
value of each metric for 6 month progression free survival (PFS) and one-year survival. Assessment of overall survival for
the metrics was determined using a Kaplan-Meier analysis with log-rank test and a multivariate Cox regression with
forward entry. Secondary analysis was performed to assess the predictive value of patient characteristics to one year
survival using either an unpaired Student’s t-test or likelihood ratio test. All statistical computations were performed with a
statistical software package (SPSS Software Products), and results were declared statistically significant at the two-sided
5% comparison-wise significance level (p < 0.05).
Research. on December 24, 2018. © 2011 American Association for Cancerclincancerres.aacrjournals.org Downloaded from
Author manuscripts have been peer reviewed and accepted for publication but have not yet been edited. Author Manuscript Published OnlineFirst on April 28, 2011; DOI: 10.1158/1078-0432.CCR-10-2098
15
Grant Support NIH grants P01CA85878, P50CA93990 and P01CA087634. The costs of publication of this article were defrayed in part
by the payment of page charges. This article must therefore be hereby marked advertisement in accordance with 18
U.S.C. Section 1734 solely to indicate this fact.
Research. on December 24, 2018. © 2011 American Association for Cancerclincancerres.aacrjournals.org Downloaded from
Author manuscripts have been peer reviewed and accepted for publication but have not yet been edited. Author Manuscript Published OnlineFirst on April 28, 2011; DOI: 10.1158/1078-0432.CCR-10-2098

16
Figure Legends
Figure 1: Representative (A,D) contrast-enhanced images and PRM overlays applied to (B,E) ADC and (C,F) rCBV from
a (A-C) responding and (D-E) non-responding patients. The responding patient, diagnosed with a glioblastoma, had an
overall survival of 17 months, PRMADC+ of 12% and PRMrCBV- of 4%. In contrast, the non-responding subject, also
diagnosed with a glioblastoma, had an overall survival of 2 months, PRMADC+ of 1% and PRMrCBV- of 40%. PRM was
acquired using pretreatment and 3 week post-treatment initiation imaging data.
Figure 2: Kaplan-Meier survival plots for overall survival, presented as a function of (a) PRMADC+, (b) PRMrCBV- and (c)
PRMADC+/PRMrCBV- stratification at week 3 post-treatment initiation and (d) Radiological Response stratification at week 10
post-treatment initiation. The three discrete groups, as categorized by the composite PRM model, had median survivals
for non-responders, intermediate and responders of 5.5 months (95% CI: 4.4-6.6 months n=14), 16 months (8.6-23.4
months n=19) and not reached (n=12), respectively.
Research. on December 24, 2018. © 2011 American Association for Cancerclincancerres.aacrjournals.org Downloaded from
Author manuscripts have been peer reviewed and accepted for publication but have not yet been edited. Author Manuscript Published OnlineFirst on April 28, 2011; DOI: 10.1158/1078-0432.CCR-10-2098

17
References 1. Stupp R, Hegi ME, Mason WP, van den Bent MJ, Taphoorn MJ, Janzer RC, et al. Effects of radiotherapy with concomitant and adjuvant temozolomide versus radiotherapy alone on survival in glioblastoma in a randomised phase III study: 5-year analysis of the EORTC-NCIC trial. Lancet Oncol. 2009;10:459-66. 2. Macdonald DR, Cascino TL, Schold SC, Jr., Cairncross JG. Response criteria for phase II studies of supratentorial malignant glioma. J Clin Oncol. 1990;8:1277-80. 3. Stupp R, Mason WP, van den Bent MJ, Weller M, Fisher B, Taphoorn MJ, et al. Radiotherapy plus concomitant and adjuvant temozolomide for glioblastoma. N Engl J Med. 2005;352:987-96. 4. Wen PY, Macdonald DR, Reardon DA, Cloughesy TF, Sorensen AG, Galanis E, et al. Updated response assessment criteria for high-grade gliomas: response assessment in neuro-oncology working group. J Clin Oncol. 2010;28:1963-72. 5. Stupp R, Hegi ME, Neyns B, Goldbrunner R, Schlegel U, Clement PM, et al. Phase I/IIa study of cilengitide and temozolomide with concomitant radiotherapy followed by cilengitide and temozolomide maintenance therapy in patients with newly diagnosed glioblastoma. J Clin Oncol. 2010;28:2712-8. 6. Harry VN, Semple SI, Parkin DE, Gilbert FJ. Use of new imaging techniques to predict tumour response to therapy. Lancet Oncol. 2010;11:92-102. 7. Chenevert TL, Ross BD. Diffusion imaging for therapy response assessment of brain tumor. Neuroimaging Clin N Am. 2009;19:559-71. 8. Lacerda S, Law M. Magnetic resonance perfusion and permeability imaging in brain tumors. Neuroimaging Clin N Am. 2009;19:527-57. 9. Chenevert TL, Stegman LD, Taylor JM, Robertson PL, Greenberg HS, Rehemtulla A, et al. Diffusion magnetic resonance imaging: an early surrogate marker of therapeutic efficacy in brain tumors. J Natl Cancer Inst. 2000;92:2029-36. 10. Hamstra DA, Lee KC, Moffat BA, Chenevert TL, Rehemtulla A, Ross BD. Diffusion magnetic resonance imaging: an imaging treatment response biomarker to chemoradiotherapy in a mouse model of squamous cell cancer of the head and neck. Transl Oncol. 2008;1:187-94. 11. Liimatainen T, Hakumaki JM, Kauppinen RA, Ala-Korpela M. Monitoring of gliomas in vivo by diffusion MRI and (1)H MRS during gene therapy-induced apoptosis: interrelationships between water diffusion and mobile lipids. NMR Biomed. 2009;22:272-9. 12. Liu Y, Bai R, Sun H, Liu H, Zhao X, Li Y. Diffusion-weighted imaging in predicting and monitoring the response of uterine cervical cancer to combined chemoradiation. Clin Radiol. 2009;64:1067-74. 13. Brix G, Kiessling F, Lucht R, Darai S, Wasser K, Delorme S, et al. Microcirculation and microvasculature in breast tumors: pharmacokinetic analysis of dynamic MR image series. Magn Reson Med. 2004;52:420-9. 14. Ostergaard L, Sorensen AG, Kwong KK, Weisskoff RM, Gyldensted C, Rosen BR. High resolution measurement of cerebral blood flow using intravascular tracer bolus passages. Part II: Experimental comparison and preliminary results. Magn Reson Med. 1996;36:726-36. 15. Ostergaard L, Weisskoff RM, Chesler DA, Gyldensted C, Rosen BR. High resolution measurement of cerebral blood flow using intravascular tracer bolus passages. Part I: Mathematical approach and statistical analysis. Magn Reson Med. 1996;36:715-25. 16. Rosen BR, Belliveau JW, Vevea JM, Brady TJ. Perfusion imaging with NMR contrast agents. Magn Reson Med. 1990;14:249-65. 17. Tofts PS. Modeling tracer kinetics in dynamic Gd-DTPA MR imaging. J Magn Reson Imaging. 1997;7:91-101. 18. Degani H, Gusis V, Weinstein D, Fields S, Strano S. Mapping pathophysiological features of breast tumors by MRI at high spatial resolution. Nat Med. 1997;3:780-2. 19. Hu LS, Baxter LC, Smith KA, Feuerstein BG, Karis JP, Eschbacher JM, et al. Relative cerebral blood volume values to differentiate high-grade glioma recurrence from posttreatment radiation effect: direct correlation between image-guided tissue histopathology and localized dynamic susceptibility-weighted contrast-enhanced perfusion MR imaging measurements. AJNR Am J Neuroradiol. 2009;30:552-8. 20. Law M, Oh S, Johnson G, Babb JS, Zagzag D, Golfinos J, et al. Perfusion magnetic resonance imaging predicts patient outcome as an adjunct to histopathology: a second reference standard in the surgical and nonsurgical treatment of low-grade gliomas. Neurosurgery. 2006;58:1099-107; discussion -107. 21. Law M, Yang S, Wang H, Babb JS, Johnson G, Cha S, et al. Glioma grading: sensitivity, specificity, and predictive values of perfusion MR imaging and proton MR spectroscopic imaging compared with conventional MR imaging. AJNR Am J Neuroradiol. 2003;24:1989-98. 22. Moffat BA, Chenevert TL, Lawrence TS, Meyer CR, Johnson TD, Dong Q, et al. Functional diffusion map: a noninvasive MRI biomarker for early stratification of clinical brain tumor response. Proc Natl Acad Sci U S A. 2005;102:5524-9. 23. Ellingson BM, Malkin MG, Rand SD, Connelly JM, Quinsey C, LaViolette PS, et al. Validation of functional diffusion maps (fDMs) as a biomarker for human glioma cellularity. J Magn Reson Imaging. 2010;31:538-48.
Research. on December 24, 2018. © 2011 American Association for Cancerclincancerres.aacrjournals.org Downloaded from
Author manuscripts have been peer reviewed and accepted for publication but have not yet been edited. Author Manuscript Published OnlineFirst on April 28, 2011; DOI: 10.1158/1078-0432.CCR-10-2098
18
24. Hiramatsu R, Kawabata S, Miyatake SI, Yamada Y, Kuroiwa T. An Imaging Assessment of Malignant Glioma Patients Treated by Boron Neutron Capture Therapy Using Functional Diffusion Map. Neuro-Oncology. 2009;11:669-. 25. Lin YC, Wang CC, Wai YY, Wan YL, Ng SH, Chen YL, et al. Significant temporal evolution of diffusion anisotropy for evaluating early response to radiosurgery in patients with vestibular schwannoma: findings from functional diffusion maps. AJNR Am J Neuroradiol. 2010;31:269-74. 26. Ellingson BM, Rand SD, Malkin MG, Schmainda KM. Utility of functional diffusion maps to monitor a patient diagnosed with gliomatosis cerebri. J Neurooncol. 2009. 27. Galban CJ, Mukherji SK, Chenevert TL, Meyer CR, Hamstra DA, Bland PH, et al. A feasibility study of parametric response map analysis of diffusion-weighted magnetic resonance imaging scans of head and neck cancer patients for providing early detection of therapeutic efficacy. Transl Oncol. 2009;2:184-90. 28. Lee KC, Bradley DA, Hussain M, Meyer CR, Chenevert TL, Jacobson JA, et al. A feasibility study evaluating the functional diffusion map as a predictive imaging biomarker for detection of treatment response in a patient with metastatic prostate cancer to the bone. Neoplasia. 2007;9:1003-11. 29. Ma B, Meyer CR, Pickles MD, Chenevert TL, Bland PH, Galban CJ, et al. Voxel-by-voxel functional diffusion mapping for early evaluation of breast cancer treatment. Inf Process Med Imaging. 2009;21:276-87. 30. Galban CJ, Chenevert TL, Meyer CR, Tsien C, Lawrence TS, Hamstra DA, et al. The parametric response map is an imaging biomarker for early cancer treatment outcome. Nat Med. 2009;15:572-6. 31. Tsien C, Galban CJ, Chenevert TL, Johnson TD, Hamstra DA, Sundgren PC, et al. Parametric response map as an imaging biomarker to distinguish progression from pseudoprogression in high-grade glioma. J Clin Oncol. 2010;28:2293-9. 32. Curran WJ, Jr., Scott CB, Horton J, Nelson JS, Weinstein AS, Fischbach AJ, et al. Recursive partitioning analysis of prognostic factors in three Radiation Therapy Oncology Group malignant glioma trials. J Natl Cancer Inst. 1993;85:704-10. 33. Hamstra DA, Galban CJ, Meyer CR, Johnson TD, Sundgren PC, Tsien C, et al. Functional diffusion map as an early imaging biomarker for high-grade glioma: correlation with conventional radiologic response and overall survival. J Clin Oncol. 2008;26:3387-94. 34. Sulman EP, Guerrero M, Aldape K. Beyond grade: molecular pathology of malignant gliomas. Semin Radiat Oncol. 2009;19:142-9. 35. Potti A, Schilsky RL, Nevins JR. Refocusing the war on cancer: the critical role of personalized treatment. Sci Transl Med. 2010;2:28cm13. 36. Schilsky RL. How not to treat cancer. Lancet Oncol. 2008;9:504-5. 37. Schilsky RL. Personalized medicine in oncology: the future is now. Nat Rev Drug Discov. 2010;9:363-6. 38. Chan JL, Lee SW, Fraass BA, Normolle DP, Greenberg HS, Junck LR, et al. Survival and failure patterns of high-grade gliomas after three-dimensional conformal radiotherapy. J Clin Oncol. 2002;20:1635-42. 39. Levin VA, Crafts DC, Norman DM, Hoffer PB, Spire JP, Wilson CB. Criteria for evaluating patients undergoing chemotherapy for malignant brain tumors. J Neurosurg. 1977;47:329-35. 40. Cao Y, Tsien CI, Nagesh V, Junck L, Ten Haken R, Ross BD, et al. Survival prediction in high-grade gliomas by MRI perfusion before and during early stage of RT [corrected]. Int J Radiat Oncol Biol Phys. 2006;64:876-85. 41. Meyer CR, Boes JL, Kim B, Bland PH, Zasadny KR, Kison PV, et al. Demonstration of accuracy and clinical versatility of mutual information for automatic multimodality image fusion using affine and thin-plate spline warped geometric deformations. Med Image Anal. 1997;1:195-206.
Research. on December 24, 2018. © 2011 American Association for Cancerclincancerres.aacrjournals.org Downloaded from
Author manuscripts have been peer reviewed and accepted for publication but have not yet been edited. Author Manuscript Published OnlineFirst on April 28, 2011; DOI: 10.1158/1078-0432.CCR-10-2098

Published OnlineFirst April 28, 2011.Clin Cancer Res Craig J. Galban, Thomas L. Chenevert, Charles R. Meyer, et al. predicted by standard radiographic assessmentIdentification of early and distinct glioma response patterns not Prospective analysis of parametric MRI biomarkers:
Updated version
10.1158/1078-0432.CCR-10-2098doi:
Access the most recent version of this article at:
Manuscript
Authoredited. Author manuscripts have been peer reviewed and accepted for publication but have not yet been
E-mail alerts related to this article or journal.Sign up to receive free email-alerts
Subscriptions
Reprints and
To order reprints of this article or to subscribe to the journal, contact the AACR Publications
Permissions
Rightslink site. Click on "Request Permissions" which will take you to the Copyright Clearance Center's (CCC)
.http://clincancerres.aacrjournals.org/content/early/2011/04/28/1078-0432.CCR-10-2098To request permission to re-use all or part of this article, use this link
Research. on December 24, 2018. © 2011 American Association for Cancerclincancerres.aacrjournals.org Downloaded from
Author manuscripts have been peer reviewed and accepted for publication but have not yet been edited. Author Manuscript Published OnlineFirst on April 28, 2011; DOI: 10.1158/1078-0432.CCR-10-2098


