
Prosperity Gold-Copper Project
Supplemental Report to Taseko Mines Ltd. Prosperity Gold-Copper Project Environmental Impact Statement:
Local and Regional Environmental Effects on Wildlife and
Vegetation Resources of Importance to the Tsilhqot’in National Government at the Proposed Mine Site
Compiled by Taseko Mines Limited
October 2, 2009


Supplemental Report to Taseko Mines Ltd. Prosperity Gold-Copper Project Environmental Impact Statement
Taseko Mines Limited October 2009
Page i
Executive Summary In January 2009 Taseko Mines Limited submitted a nine volume Environmental
Impact Statement (EIS) on the proposed Prosperity Gold-Copper Project to both
a federal review Panel and the provincial Environmental Assessment Office
(EAO). During the public review and comment period that followed, comments
received from both the provincial government and the Tsilhqot‘in National
Government (TNG) indicated that additional assessment of project effects on
wildlife and vegetation at the mine site was required to characterize predicted
project effects on a more local/sub-regional scale. As a component of this
assessment, additional wildlife and vegetation species known to be of particular
importance to the TNG were also considered.
Working collaboratively with BC Ministry of Environment (BC MOE) officials,
three new study areas were established. The Eastern Trapline Area as defined in
the William case was used as the local study area. Two larger study areas were
also identified: the Rights and Title Area as defined in the William case (for
ecosystem type and wildlife habitat analyses), and a general Regional Study
Area, which is the combined area of the Taseko River and Big Creek watersheds
(for wildlife habitat analyses).
A list of 22 species of wildlife were identified by the BC MOE and, based on
habitat loss and population density estimates, local population effects expressed
in terms of numbers of animals were predicted. No attempt was made to draw
conclusions on the significance of these local effects as there was no quantitative
context available for so doing.
Linkages between 52 plant species identified as being important to the TNG and
the vegetation Key Indicators (KIs) assessed in detail in the EIS were identified
and the potential effect of the mine development on these species was
determined based upon inferences drawn from the KI-specific effects
assessments completed for the EIS. No significant residual effects were
predicted for any of the 52 plant species.
Similarly, linkages between the 24 wildlife species indentified as important to the
TNG in the William case and six of the wildlife KIs assessed in detail in the EIS
were identified the potential effect of the mine development on these species was
determined based upon inferences drawn from the KI-specific effects
assessments completed for the EIS. No significant residual effects were
predicted for any of the 24 William case species.

Supplemental Report to Taseko Mines Ltd. Prosperity Gold-Copper Project Environmental Impact Statement
October 2009 Taseko Mines Limited
Page ii
PEM-based wildlife habitat capability models were developed for four species
that were identified in the William case and also assessed as KIs in the EIS (i.e.,
moose, mule deer, fisher, and black bear) and area summaries of the change in
habitat capability from baseline to maximum disturbance (as defined in the EIS)
were generated for each of the modeled species. A similar analysis was
conducted for grizzly bear but using habitat suitability and capability map
products recently developed by the BC MOE, rather than PEM-based models.
Project-related changes in habitat availability, viewed in the context of the
smallest study area (i.e., the Eastern Trapline Study Area) were understandably
the largest, ranging from -6.1 to -36.1% for moderate and higher value habitat
classes. In a regional context, Project-related changes in habitat availability
ranged from -0.8 to -2.3% for moderate and higher value habitat classes in the
Regional Study Area, and from -1.0 to 2.5% for moderate and higher value
classes in the Rights and Title Study Area.

Supplemental Report to Taseko Mines Ltd. Prosperity Gold-Copper Project Environmental Impact Statement
Taseko Mines Limited October 2009
Page iii
Table of Contents
Executive Summary ........................................................................................................ i
Table of Contents .......................................................................................................... iii
List of Tables ................................................................................................................. iv
List of Figures ............................................................................................................... iv
1 Background and Scope of Report ..................................................................... 1
1.1 Background ........................................................................................................... 1 1.2 Scope of Report .................................................................................................... 1
2 Methods ............................................................................................................... 4
2.1 Environmental Effects Rating Criteria for Assessing Effects Significance ............. 4
2.2 Standards or Thresholds for Determining Significance ......................................... 5 2.2.1 Moose ......................................................................................................... 6
2.2.2 Mule Deer ................................................................................................... 6 2.2.3 Fisher ......................................................................................................... 6
2.2.4 Black Bear .................................................................................................. 7 2.2.5 Grizzly Bear ................................................................................................ 7
2.3 Wildlife................................................................................................................... 7
2.3.1 Local Population Effects ............................................................................. 7 2.3.2 William case Wildlife Species ..................................................................... 8
2.3.3 Habitat Loss ............................................................................................... 9 2.4 Vegetation ........................................................................................................... 14
2.4.1 Plant Species of Importance to the Tsilhqot‘in National Government ....... 14
2.4.2 Vegetation Loss ........................................................................................ 15
3 Effects Assessment .......................................................................................... 16
3.1 Wildlife................................................................................................................. 16
3.1.1 Local Population Effects ........................................................................... 16 3.1.2 William Court Case Wildlife Species ......................................................... 25
3.1.3 Habitat Loss ............................................................................................. 32 3.2 Vegetation ........................................................................................................... 51
3.2.1 Plant Species of Importance to the Tsilhqot‘in National Government ....... 51
3.2.2 Vegetation Loss ........................................................................................ 51
4 References ......................................................................................................... 62

Supplemental Report to Taseko Mines Ltd. Prosperity Gold-Copper Project Environmental Impact Statement
October 2009 Taseko Mines Limited
Page iv
List of Tables
Table 1 Characterization of Environmental Effects for Wildlife ..................... 4
Table 2 Biogeoclimatic Unit Distribution in the Maximum Disturbance (Footprint) Area and Rights and Title Study Area .......................... 12
Table 3 Local Population Effect Predictions for Twenty-two Wildlife Species .......................................................................................... 17
Table 4 William Court Case Species – Effects Assessment Approach ...... 26
Table 5 Portion of MSxv and SBPSxc in the Rights and Title Study Area that is Protected or of Special Interest ........................................... 34
Table 6 Change in Habitat Availability from Baseline to Maximum Disturbance: Moose Winter Feeding Habitat Capability ................ 43
Table 7 Change in Habitat Availability from Baseline to Maximum Disturbance: Mule Deer Winter Shelter Habitat Capability ............ 44
Table 8 Change in Habitat Availability from Baseline to Maximum Disturbance: Fisher Natal Denning Habitat Capability ................... 45
Table 9 Change in Habitat Availability from Baseline to Maximum Disturbance: Black Bear Denning Habitat Capability ..................... 46
Table 10 Change in Habitat Availability from Baseline to Maximum Disturbance: Grizzly Bear Habitat Capability ................................. 47
Table 11 Change in Habitat Availability from Baseline to Maximum Disturbance: Grizzly Bear Habitat Suitability ................................. 48
Table 12 Effect Characterization and Determination of Significance for Wildlife ........................................................................................... 49
Table 13 Plant Species of Importance to the Tsilhqot‘in National Government – Linkages to Vegetation Key Indicators Assessed in the EIS ...... 52
Table 14 Change in Area of Old Forest from Baseline to Maximum Disturbance ................................................................................... 60
Table 15 Change in Area of Vegetation Key Indicators from Baseline to Maximum Disturbance: Alpine and Parkland, Grasslands and Wetlands ....................................................................................... 61
List of Figures Figure 1 Regional and Local Study Areas (Wildlife and Vegetation) ............. 2 Figure 2 Biogeoclimatic Units in and Around the Study Areas..................... 13

Supplemental Report to Taseko Mines Ltd. Prosperity Gold-Copper Project Environmental Impact Statement
Taseko Mines Limited October 2009
Page 1
1 Background and Scope of Report
1.1 Background
In January 2009 Taseko submitted our EIS and on March 11, 2009 the Province
of British Columbia accepted the EIS as complete. Beginning on March 26, 2009
a joint EAO and Federal Panel 60 day public comment period was held. During
this period comments were received from both provincial regulatory agencies and
First Nations to the effect that the EIS did not effectively assess project effects on
all wildlife and vegetation species that are of importance to the Tsilhqot‘in people
and that the EIS assessment of significance did not characterize project effects
on wildlife populations their habitat and vegetation in the context of more
meaningful local areas. It was subsequently determined that this needed to be
done in order that any residual project effects could be better understood.
In considering these comments Taseko took into account the fact that In the
Effects Prediction, Mitigation Measures and Significance of Residual Effects
section of the approved Environmental Impact Statement (EIS) Guidelines
(January 2009) direction was given to pay specific attention only to interactions
between the Project and the 21 identified KIs (Section 1.0, page 39).
Notwithstanding that this was done, in consultation and collaboration with the
Williams Lake office of the BC Ministry of Environment (BC MOE), Taseko and its
consultants have undertaken additional analysis to further characterize project
effects to address the above mentioned comments. This supplemental report
provides the results of this additional analysis.
While the body of this report was compiled by Taseko Mines Ltd., GIS, wildlife
and vegetation experts from Stantec (formerly Jacques Whitford AXYS Ltd.)
undertook the technical analysis and drafted the methods and effects
assessment sections of the report.
1.2 Scope of Report
For this assessment, Local, Regional and Rights and Title study areas, were
chosen to provide a more relevant and local context in which to evaluate and
assess significance of effects. The Eastern Trapline Area as defined in the
William case was chosen as a local study area in which to evaluate project
effects, the combined area of both the Taseko River and Big Creek Watersheds
was chosen as a natural ecologically based Regional Study Area and the Rights
and Title Study Area, including the Eastern Trapline Area as defined in the
William case, was chosen as a relevant area with which to evaluate significance
of effects. All three study areas are shown on Figure 1.

!.
!.!.
!.
!.!.
!.
!.
Ch i l c ot in R ive r
Tase
ko
R
iver
C H I L K O L A KE
F R A S E R R I V E R
Tat layokoLake
Ta se
ko L ake Road Segment
Chi lko
Rive r
Redstone
Riske Creek
Alexis Creek
Tatlayoko Lake
400000
400000
450000
450000
500000
500000
550000
550000
5650
000
5650
000
5700
000
5700
000
5750
000
5750
000
0 5 10 15 20Kilometres
Map Prepared by Jacques Whitford AXYS Ltd.
Data Sources:Province of British Columbia, Taseko Mines Ltd.Projection: UTM Zone 10, NAD 83
Produced by: Steve ParkerVerified by: Tony DinneenDate: September 18, 2009
Rev #: 02
Figure 1Study Areas
$
Spatial_data\Analysis\PEM_Analysis\MXDs\TASEKO_PEM_Study_Area.mxd
450 0
Roa
d
£¤20
Segm
ent
1:1,250,000
£¤20
Taseko Prosperity Mine SIte
Eastern Trap LineArea
(Local Study Area)
LEGENDExisting Access RoadProposed Prosperity Mine Access RoadMaximum Disturbance AreaRegional Study AreaRights and Title Study AreaLocal Study Area
!. City/TownHighwayRoadRiver (1:2mil)Lake (1:2mil)Tsilhqot'in Aboriginal Title AreaTsilhqot'in Aboriginal Rights Area
**Anaham is currently not represented by the TNG but forillustrative purposes included here in the TNG boundary.

Supplemental Report to Taseko Mines Ltd. Prosperity Gold-Copper Project Environmental Impact Statement
Taseko Mines Limited October 2009
Page 3
In a May 2009 comment made while reviewing the EIS, the Tsilhqot‘in National
Government (TNG) listed some 52 plant species of importance to them and
asked Taseko to comment on how they might be affected by the Project. In this
report Taseko establishes linkages between those 52 species and those
vegetation KIs already assessed within the EIS and predicts effects significance
for all 52 species. Using the wildlife species identified in the William case, similar
linkages between these species and the wildlife assessment presented within the
EIS were also established.
Taking the assessment even further, Predictive Ecosystem Mapping (PEM)
based habitat capability models were utilized to develop new predictions of direct
habitat loss from within the mine site area. In turn these losses, presented in the
context of the two newly defined study areas, provide a meaningful context in
which to assess effects at a local level. As a final step in this assessment a list of
22 species of wildlife were identified by the BC MOE and, based on habitat loss
and population density estimates, local population effects, expressed in terms of
numbers of animals were predicted.
For all the habitat area assessments two temporal scenarios are used for the
prediction of potential mine site area effects on both wildlife and vegetation:
Baseline: Represents conditions prior to any Project-specific
developments.
Maximum Disturbance: Represents the potential worst-case conditions
(represented by the maximum disturbance footprint) that could occur
during the construction and operations phases. The total area (footprint) of
maximum disturbance is 4997 ha. This includes 4410 ha associated with
the mine site and 578 ha associated with the transmission line right-of-
way. There is a 9 ha overlap between the mine site footprint and the
transmission line right-of-way. Note that only part of the maximum
disturbance (footprint) area (i.e., 3118 ha) overlaps with the Rights and
Title and Eastern Trapline study areas (see Figure 1).
The analysis and results presented in this supplemental report build upon and
complement the extensive work completed and reported in the EIS.

Supplemental Report to Taseko Mines Ltd. Prosperity Gold-Copper Project Environmental Impact Statement
October 2009 Taseko Mines Limited
Page 4
2 Methods
2.1 Environmental Effects Rating Criteria for Assessing Effects Significance
Each residual Project effect1 identified in the assessment is evaluated using
multiple criteria: direction, magnitude, geographic extent, duration, ecological
context, and reversibility. These criteria are assessed in the context of the nature
of potential effects, the mitigation strategies that are available for reducing or
eliminating such effects (as described in the EIS), and the nature and anticipated
severity of residual effects after mitigation. The definitions for the effect attributes
for each criterion are presented in Table 1. In addition, a ―prediction confidence‖
rating is applied to each residual Project effect characterization (Table 1). The
confidence rating considers the accuracy and application of analytical tools, an
understanding of the effectiveness of mitigation measures, and an understanding
of known responses of a species to potential Project effects.
Table 1 Characterization of Environmental Effects for Wildlife
Criterion Environmental Effect Attribute Definitions
Direction
Positive: measurable environmental effect moves condition in a positive direction relative to baseline
Negative: measurable environmental effect moves condition in negative direction relative to baseline
Magnitude
Quantitative assessment: Expressed as a quantity. Units of expression vary depending on the measurable parameter, but, typically for wildlife the unit is hectares. In addition the quantity may be expressed as a percent change.
Qualitative assessment:
Low: ≤5% change
Medium: >5% to 15% change
High: >15% change
Geographic Extent
Site-specific: environmental effect(s) on wildlife confined to single small area within local study area
Local: environmental effect(s) on wildlife occurs within local study area
Regional: environmental effect(s) on wildlife occurs within or beyond regional study area
Duration Short-term: environmental effect(s) limited to no more than one annual cycle within the life history of an individual (≤ 1 year)
1 Residual Project effects are Project effects that persist after application of prescribed mitigation
measures (e.g., irreversible habitat loss)

Supplemental Report to Taseko Mines Ltd. Prosperity Gold-Copper Project Environmental Impact Statement
Taseko Mines Limited October 2009
Page 5
Criterion Environmental Effect Attribute Definitions
Medium-term: environmental effect(s) last for part or all of the average life span of an individual (i.e., ≤10 years for moose and fisher; ≤15 years for mule deer; ≤25 years for black and grizzly bear).
Long-term: environmental effect(s) last beyond individual life spans and will affect multiple generations (i.e., >10 years for moose and fisher; >15 years for mule deer; >25 years for black and grizzly bear).
Permanent: environmental effect(s) permanent (i.e., irreversible)
Reversibility
Reversible: environmental effect(s) reversible with reclamation and/or natural succession and/or Project closure
Irreversible: environmental effect(s) permanent and cannot be reversed with reclamation and/or natural succession and/or Project closure
Ecological Context
Undisturbed: area relatively unaffected, or not adversely affected, by human activity
Developed: area substantially previously disturbed by human activity, or human activity is still present
Prediction Confidence
Low: not confident in prediction, could vary considerably
Medium: confident in prediction, moderate variability
High: confident in prediction, low variability
2.2 Standards or Thresholds for Determining Significance
Whether or not an environmental effect exceeds a threshold or standard, in
combination with magnitude and duration (i.e., intensity of the effect), inform the
determination of the effect‘s significance. Typically, the context for the
determination of significance is the sustainability of the population (or sub-
population, herd, management unit, etc., as applicable).
Provincial or regional standards (e.g., annual allowable mortality rate) or
thresholds (e.g., maximum road density) are not available for most terrestrial
wildlife species. Consequently, in the absence of prescribed thresholds and
standards, determination of the significance of a Project environmental effect was
qualitative and based on logical reasoning. Besides magnitude and duration (as
per Table 1), considerations included status, size and range of the population
unit, broad-scale habitat conditions, thresholds developed for other jurisdictions
or closely related species, and area-specific policies for land use and species
management, where known.
Species-specific standards and/or thresholds are described below

Supplemental Report to Taseko Mines Ltd. Prosperity Gold-Copper Project Environmental Impact Statement
October 2009 Taseko Mines Limited
Page 6
2.2.1 Moose The maintenance of good quality habitat is recognized in the Cariboo-Chilcotin
Land Use Plan. A regional strategy to maintain good quality moose habitat is not
as advanced as it is for mule deer, although it will follow a similar framework as
described in Keystone (2006). Identification of areas for designation as moose
winter range is in progress (e.g., Intrepid 2004; Keystone 2006), but at present no
targets or objectives are available. In the absence of prescribed thresholds and
standards, the significance of the Project‘s environmental effects on moose is
determined qualitatively as described for wildlife in general. The context for
determining significance for moose is the sustainability of the population in the
Rights and Title Study Area and Regional Study Area.
2.2.2 Mule Deer The maintenance of good quality habitat is a priority management goal for areas
identified as mule deer winter range in the Cariboo-Chilcotin Land Use Plan. The
Management Strategy for Mule Deer Winter Ranges in the Cariboo-Chilcotin Part
1a: Management Plan for Shallow and Moderate Snowpack Zones (Dawson et
al. 2007), and the General Wildlife Measures in the FRPA Order for Shallow and
Moderate Snowpack Zones2 describe stand-level objectives for winter range
management in the area of overlap between the Project and mule deer Ungulate
Winter Range. Objectives are set for a number of parameters including basal
area, opening size, and stand structure habitat classes. However, these General
Wildlife Measures and objectives are intended for planning timber harvesting on
individual mule deer Ungulate Winter Ranges, and are not readily applicable as
thresholds or standards for the Project‘s potential effects on habitat availability. In
the absence of prescribed thresholds and standards, the significance of the
Project‘s environmental effects on mule deer is determined qualitatively as
described for wildlife in general. The context for determining significance for mule
deer is the sustainability of the population in the Rights and Title Study Area and
Regional Study Area.
2.2.3 Fisher There are no recognized standards or thresholds for fisher natal denning habitat
availability from Region 5 or any other jurisdiction. In the absence of prescribed
thresholds and standards, the significance of the Project‘s environmental effects
on fishers is determined qualitatively as described for wildlife in general. The
context for determining significance for fisher is the sustainability of the
population in the Rights and Title Study Area and Regional Study Area.
2 http://www.env.gov.bc.ca/wld/documents/wha/Amendment_ShallowModerate_Feb07_Ord.pdf

Supplemental Report to Taseko Mines Ltd. Prosperity Gold-Copper Project Environmental Impact Statement
Taseko Mines Limited October 2009
Page 7
2.2.4 Black Bear There are no provincial or regional standards or thresholds for black bear
denning habitat availability from Region 5 or any other jurisdiction. In the absence
of prescribed thresholds and standards, the significance of the Project‘s
environmental effects on black bears is determined qualitatively as described for
wildlife in general. The context for determining significance for black bear is the
sustainability of the population in the Rights and Title Study Area and Regional
Study Area.
2.2.5 Grizzly Bear There are no recognized standards or thresholds for grizzly bear habitat
suitability and capability from Region 5 or any other jurisdiction. That is, there are
no specific thresholds related to actual area required according to habitat value
class. However, minimum core area3 thresholds of >60% of available habitat
have been identified to ensure grizzly bear persistence in British Columbia
(Salmo Consulting 2003). In the absence of prescribed thresholds and standards
related to the measurable parameters used in this analysis, the significance of
the Project‘s environmental effects on grizzly bears is determined qualitatively as
described for wildlife in general. The context for determining significance for
grizzly bear is the sustainability of the population in the Rights and Title Study
Area and Regional Study Area.
2.3 Wildlife
Three approaches were used to place predicted mine site area environmental
effects on wildlife in a spatial context more relevant to the TNG:
Predictions of local population effects for a suite of 22 wildlife species
Development of a matrix that links species identified in the William case
with the wildlife effects assessment presented in the EIS
Predictions of direct habitat loss from the mine site area were made for
three study areas: the Eastern Trapline Area as defined in the William
case, the entire Rights and Title Area as defined in the William case, and a
watershed-based Regional Study Area (refer to Section 2.2 and Figure 1).
These approaches are described in more detail below.
2.3.1 Local Population Effects During their review of the EIS, the BC MOE requested that Taseko further
characterize the local effect of the project, specifically with respect to number of
3 That is, relatively undisturbed ―wilderness‖ area

Supplemental Report to Taseko Mines Ltd. Prosperity Gold-Copper Project Environmental Impact Statement
October 2009 Taseko Mines Limited
Page 8
animals potentially directly or indirectly affected. BC MOE identified 22 species4
for which they wanted to see local effects assessed. Six of these species are
species identified in the William case (i.e., moose, mule deer, California bighorn
sheep, grizzly bear, black bear, and fisher). The objective of this analysis was to
provide an estimate of the number of animals potentially affected and where
possible to characterize the nature of any effects. The study areas used for this
assessment were the Mine Site Local Study Area and Transmission Line Local
Study Area as defined in the EIS. This analysis used a relatively simple
calculation to determine number of individual animals potentially affected:
Area of habitat loss (ha) X species density (individuals/ha) = number of
individuals potentially affected (directly or indirectly)
The type and reliability of the data sources used in these calculations varied with
the species under consideration. The data source for the habitat loss information
was the EIS. The data sources for the species density information were varied
and included estimates of carrying capacity and density developed by BC MOE
Region 5 for specific species (e.g., mule deer), and information from the literature
and/or other regions. In addition, for some species (e.g., Lewis‘s woodpecker),
information on home range size or territory size was used as a surrogate for
density. All the data sources used in this analysis were determined in
consultation with BC MOE.
The results of this analysis and a summary of the data sources are presented in
Section 3.1.1.
2.3.2 William case Wildlife Species Twenty-four species were identified in the William case as being of particular
importance to the TNG. Six of these species (moose, mule deer, California
bighorn sheep, grizzly bear, black bear and fisher) were identified as wildlife KIs
and assessed in detail in the EIS. For the remaining 18 species not identified as
KIs, the assessment of mine site area effects is considered to be inferable from
the results of the effects assessment for an appropriate ―umbrella KI5‖ or for a KI
that is related or similar in behaviour and habitat use pattern or for an appropriate
vegetation (i.e., habitat type) KI. These linkages between non-KI species and KIs
are presented in Table 1.
4 The 21 wildlife KIs plus the bald eagle
5 Sensu ―umbrella species‖—an umbrella species is a species with broad habitat and resource
requirements that can be managed to also provide habitats and resources for other species
(Dunster and Dunster 1996)
Supplemental Report to Taseko Mines Ltd. Prosperity Gold-Copper Project Environmental Impact Statement
Taseko Mines Limited October 2009
Page 9
2.3.3 Habitat Loss The assessment of habitat loss at the mine site conducted for the EIS was based
on Terrestrial Ecosystem Mapping (TEM). As a first step in this supplemental
assessment, consideration was given to exploring the availability and applicability
of other TEM-based wildlife models to the study areas described in Section 1.2.
This was necessary because the TEM-based models developed for the EIS did
not extend beyond the regional study areas defined for the EIS and did not
address all William case species. To assist in this review, the BC MOE provided
a list of over 600 TEM-based wildlife habitat models available for the province.
This list was reviewed and only three models were found to have moderate
potential for application to the expanded study areas—that is, there were models
for three William case species, not presently modeled in either the EIS or this
report (i.e., marten, bobcat and montane vole), that were developed for the Churn
Creek area. While there is some overlap of biogeoclimatic units with the
expanded study areas defined for this report, there are several biogeoclimatic
units for which ratings would have to be specifically developed in order to apply
these models. In addition, there are two models for two other William case
species, not presented or modeled in the EIS or this report (i.e., cougar and lynx),
that have been developed for the Williams Lake area by Lignum. Further
information on these models was not available from the provincial database6 but
regardless there is unlikely to be substantive overlap of biogeoclimatic units with
the three study areas defined for this report. Thus, these models have only low
potential for application to the expanded study area. In summary, it was
concluded that there are no models available from the Province that can be
readily used in the habitat analysis described in this report.
As an alternative, Predictive Ecosystem Mapping (PEM) based maps and models
were considered. Two methods were used to predict the direct mine site area
loss of wildlife habitat:
Predictive Ecosystem Mapping (PEM)-based habitat capability models
Grizzly bear habitat capability and suitability mapping
These two methods are described in more detail below.
PEM-based Habitat Capability Models A list of the unique PEM ecosystem units in the study areas was generated from
the 1:20,000 PEM product created for the Williams Lake Timber Supply Area by
Moon et al. (2008). PEM is an expert-based system that uses available digital
spatial data and knowledge of ecological-landscape relationships to automate the
6 EcoCat at http://www.env.gov.bc.ca/ecocat/
Supplemental Report to Taseko Mines Ltd. Prosperity Gold-Copper Project Environmental Impact Statement
October 2009 Taseko Mines Limited
Page 10
generation of ecosystem maps, and is considered a useful alternative to
Terrestrial Ecosystem Mapping (TEM) (Resources Inventory Committee 1999a).
Moon et al. (2008) provides a detailed description of how the Williams Lake TSA
PEM was generated and describes the ecosystem units identified.
PEM wildlife habitat capability7 ratings tables were developed by Stantec based
on the provincial protocol (i.e., Resources Inventory Committee 1999b) for the
following wildlife species/life requisites:
Moose winter feeding habitat
Mule deer winter shelter habitat
Fisher natal denning habitat
Black bear denning habitat
These four species/life requisites were selected because they are species
identified in the William case and they are also key indicator species for which
TEM-based habitat models were developed for the EIS. This was important
because the wildlife habitat capability ratings for the PEM units were based on
the TEM-based habitat models developed for the EIS. A six-class rating scheme
was used for moose, mule deer and black bear (i.e., high, moderately high,
moderate, low, very low and nil [as per Resources Inventory Committee 1999b])
and a four-class rating scheme was used for fisher (i.e., high, moderate, low and
nil [as per Resources Inventory Committee 1999b]).
The PEM list for the Eastern Trapline and Regional Study Areas include five
biogeoclimatic units that were not rated as part of the EIS: Boreal Altai Fescue
Alpine zone (BAFA), Coastal Mountain-Heather Alpine zone (CMA) zone,
Montane Spruce dry very cold subzone (MSdv), Engelmann Spruce–Subalpine
Fir very cold very dry parkland subzone (ESSFxvp).and Engelmann Spruce–
Subalpine Fir very cold very dry West Chilcotin variant (ESSFxv1). Ratings for
these ecosystem units were developed based on the species accounts prepared
for the EIS (Madrone Consultants Ltd. 1999). The Rights and Title Study Area
includes six more biogeoclimatic units that were not rated as part of the EIS or as
part of the Eastern Trapline and Regional Study Areas. In order to focus the
assessment for this report on the ecosystems directly affected by the mine
development, only the two biogeoclimatic units represented within the maximum
disturbance area (footprint) of the mine (i.e., Montane Spruce very dry very cold
[MSxv] and Sub-Boreal Pine–Spruce very dry cold [SBPSxc]) were modeled for
this study area (Figure 2). Steen and Coupé (1997) and Meidinger and Pojar
7 The PEM product does not include structural stage attributes; therefore, the wildlife habitat
analysis is based on habitat capability rather than suitability
Supplemental Report to Taseko Mines Ltd. Prosperity Gold-Copper Project Environmental Impact Statement
Taseko Mines Limited October 2009
Page 11
(1991) provide detailed biophysical and ecological descriptions of these
subzones. The following are summaries of that information with supplemental
information on wildlife derived from Stevens (1995).
Montane Spruce Very Dry Very Cold Subzone (MSxv)
The MSxv is moderately large (8751 km2) and is the most extensive subzone of
the MS in the Cariboo Forest Region. The largest area occurs around the Itcha
and Ilgachuz Mountains. This subzone also occurs at middle elevations along the
leeward slopes of the Coast Mountains. The MSxv typically occurs above the
SBPSxc and below the ESSFxv. This subzone is one of the least productive units
for tree growth in BC. Winters are cold and summers are cool with frequent
growing season frost. Mature forests on zonal (typical) sites in the MSxv are
predominantly even-aged, even-sized lodgepole pine with scattered white
spruce. Subalpine fir is common in the southern parts of this subzone. Douglas-fir
is absent. The understory vegetation on zonal sites is dominated by crowberry,
grouseberry, common juniper, bunchberry, mosses and lichens. Very few
medium to tall shrubs are present. Mature pine stands have a relatively closed
canopy with little pine regeneration in the understory. Grasslands are uncommon
in the MSxv but wetlands are abundant. The main ecological factors that affect
wildlife habitat use species diversity in the MS are the cold snowy winters, short,
warm summers, extensive pine forests and mountainous topography. Fewer
wildlife species (187, mostly birds) are associated with this subzone than with the
SBPSxc (Stevens 1995). Almost all of the William case wildlife species may
occur in this subzone in one or more seasons. The exceptions are mountain
goat, short-tailed weasel (ermine) (as per Stevens 1995) and probably feral
horses.
Sub-Boreal Pine–Spruce Very Dry Cold Subzone (SBPSxc)
The SBPSxc is the most extensive subzone of the SBPS (10,898 km2). Within
the Cariboo Forest Region it extends from approximately Lessard Lake in the
northwest to Churn Creek in the southeast. It occurs along the leeward side of
the Coast Mountains so is strongly affected by the Coast Mountains rainshadow
and has the least precipitation of any subzone in the SBPS. Vegetation
production and soil development are severely limited by the cold, very dry
climate. Mature forests on zonal sites in the SBPSxc are predominantly
lodgepole pine with scattered aspen. No other tree species are common. The
understory vegetation on zonal sites is dominated by kinnikinnick, lichens and
pinegrass. Low shrubs like prickly rose and common juniper are common but
have low cover. Pine regeneration in the understory is sparse to moderately
dense, depending on canopy cover, and is often clumped. Grasslands are not
common in the SBPSxc but wetlands are very abundant. The main ecological
factors that affect wildlife habitat use and species diversity in the SBPS are the
Supplemental Report to Taseko Mines Ltd. Prosperity Gold-Copper Project Environmental Impact Statement
October 2009 Taseko Mines Limited
Page 12
cold dry winters, cool dry summers, and its position on central high elevation
plateaus, leeward of the mountains. More wildlife species (251, mostly birds) are
associated with this subzone than with the MSxv (Stevens 1995). Almost all of
the William case wildlife species may occur in this subzone in one or more
seasons. The exceptions are mountain goat and bighorn sheep (as per Stevens
1995).
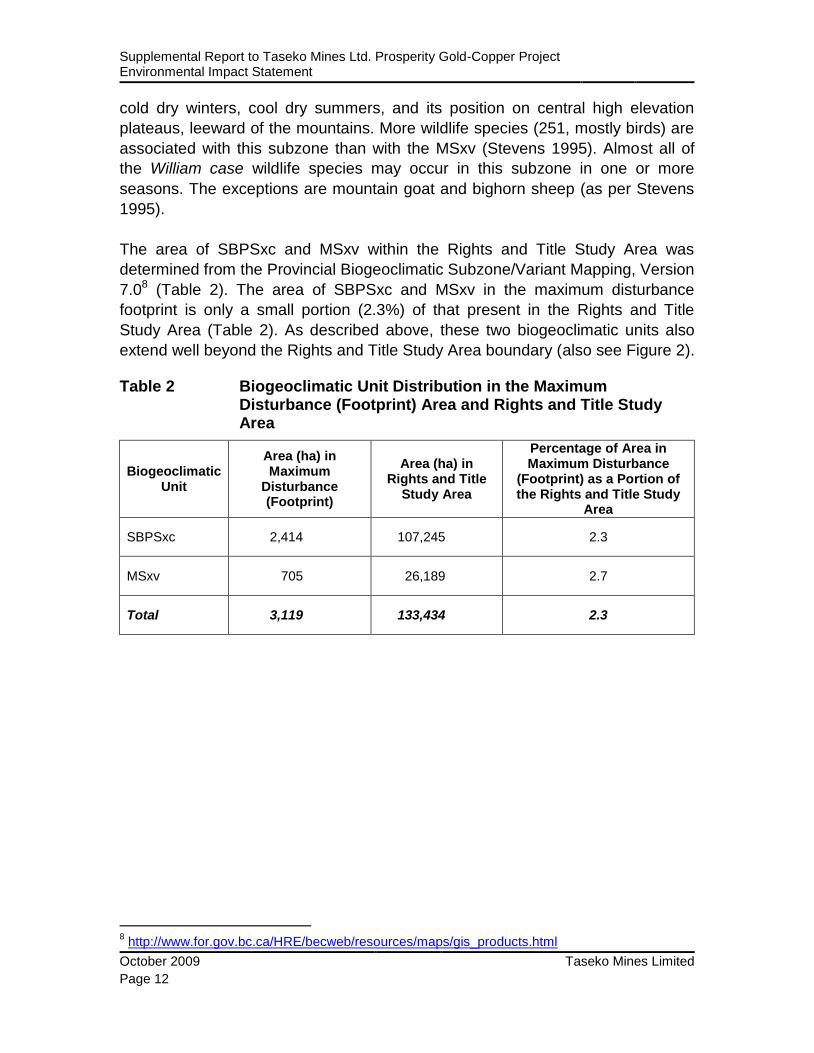
The area of SBPSxc and MSxv within the Rights and Title Study Area was
determined from the Provincial Biogeoclimatic Subzone/Variant Mapping, Version
7.08 (Table 2). The area of SBPSxc and MSxv in the maximum disturbance
footprint is only a small portion (2.3%) of that present in the Rights and Title
Study Area (Table 2). As described above, these two biogeoclimatic units also
extend well beyond the Rights and Title Study Area boundary (also see Figure 2).
Table 2 Biogeoclimatic Unit Distribution in the Maximum Disturbance (Footprint) Area and Rights and Title Study Area
Biogeoclimatic Unit
Area (ha) in Maximum
Disturbance (Footprint)
Area (ha) in Rights and Title
Study Area
Percentage of Area in Maximum Disturbance
(Footprint) as a Portion of the Rights and Title Study
Area
SBPSxc 2,414 107,245 2.3
MSxv 705 26,189 2.7
Total 3,119 133,434 2.3
8 http://www.for.gov.bc.ca/HRE/becweb/resources/maps/gis_products.html

!.
!.!.
!.
!.!.
!.
!.
Ch i l c o t in R iver
Tas e
ko
R
iver
C H I L K O L A KE
F R A S E R R I V E R
Tat layokoLake
Ta se
ko L ake Road Segment
Chi l ko
Rive r
Redstone
Riske CreekSpringhouse
Alexis Creek
Williams Lake
Tatlayoko Lake
400000
400000
450000
450000
500000
500000
550000
550000
5650
000
5650
000
5700
000
5700
000
5750
000
5750
000
0 5 10 15 20Kilometres
Map Prepared by Jacques Whitford AXYS Ltd.
Data Sources:Province of British Columbia, Taseko Mines Ltd.Projection: UTM Zone 10, NAD 83
Produced by: John BlythVerified by: Tony DinneenDate: September 18, 2009
Rev #: 01
Figure 2Biogeoclimatic Unitsin and Around the
Study Areas
$
Spatial_data\Analysis\PEM_Analysis\MXDs\TASEKO_PEM_BEC_Area.mxd
450 0
Roa
d
£¤20
Segm
ent
1:1,250,000
£¤20
Taseko Prosperity Mine SIte
Eastern Trap LineArea
(Local Study Area)
LEGENDExisting Access RoadProposed Prosperity Mine Access RoadMaximum Disturbance AreaRegional Study AreaRights and Title Study AreaLocal Study Area
!. City/TownHighwayRoadRiver (1:2mil)Lake (1:2mil)
BGC LABELBAFAunBG xw 2CMA unCMA unpCWH unESSFdvpESSFmwESSFmwpESSFxcpESSFxcwESSFxv 1ESSFxv 2ESSFxvpIDF dk 4IDF dwIDF xmIMA unMS dc 2MS dvMS xvSBPSxc
**Anaham is currently not represented by the TNG but forillustrative purposes included here in the TNG boundary.

Supplemental Report to Taseko Mines Ltd. Prosperity Gold-Copper Project Environmental Impact Statement
October 2009 Taseko Mines Limited
Page 14
Area summaries of the change in habitat capability from baseline to maximum
disturbance (as defined in the EIS) were generated for each of the modeled
species (i.e., moose, mule deer, black bear and fisher). The results of this
analysis are presented in Section 3.1.3.
Grizzly Bear Habitat Capability and Suitability Mapping The grizzly bear habitat capability and suitability map products developed by the
BC Ministry of Environment (BC MOE) for the Central Interior Ecoprovince were
used as the basis for this analysis. Hamilton (2007) describes the development of
these map products in detail. As BC MOE recommended that these map
products be used in a regional assessment for grizzly bears, they are considered
more applicable to the analysis described in this document than a PEM-based
model based on ratings developed for the EIS. Two map layers were used in this
analysis: habitat capability and average (weighted) habitat suitability. A six class
rating scheme was used for both layers (i.e., high, moderately high, moderate,
low, very low and nil [as per Resources Inventory Committee 1999b]).
An area summary of the change in habitat capability and suitability from baseline
to maximum disturbance (as defined in the EIS) were generated. The results of
this analysis are presented in Section 3.1.3.
2.4 Vegetation
Two approaches were used to assess predicted mine site area environmental
effects on vegetation of importance to the TNG:
Development of a matrix that links plants species of importance to the
TNG with the vegetation effects assessment presented in the EIS
Predictions of direct vegetation loss from the mine site area were made
using spatial contexts relevant to the TNG. Two study areas were chosen:
the Eastern Trapline Area as defined in the William case and a watershed-
based Regional Study Area (refer to Section 1.2 and Figure 1).
These two approaches are described in more detail below.
2.4.1 Plant Species of Importance to the Tsilhqot’in National Government
As part of their May 25, 2009 comments on the EIS, the TNG provided Taseko
with a list of 52 plant species of importance to the TNG and requested that
Taseko further assess the effects of the Project on these plant species. A matrix
was developed to indicate linkages between the plant species of importance to
the TNG and the vegetation KIs assessed in detail in the EIS. Each plant species
was linked to one or more vegetation KIs based on the species‘ general
Supplemental Report to Taseko Mines Ltd. Prosperity Gold-Copper Project Environmental Impact Statement
Taseko Mines Limited October 2009
Page 15
ecological requirements (e.g., a species that grows in bogs is linked to the
wetlands KI). In some cases, the linkage was very broad – for example, species
associated with forests were linked to the KI old forest; however, that does not
mean that they may not occur in younger forest stands as well. Having
established clear linkages between each of the plant species and one or more
vegetation KIs, the mine site area environmental effects on each species can be
directly inferred from the effects assessments for those KIs as presented in the
EIS.
The results of this analysis and a summary of the data sources are presented in
Section 3.2.1.
2.4.2 Vegetation Loss
Old Forest The 1:20,000 Vegetation Resources Inventory (VRI) spatial data from the
Integrated Land Management Bureau‘s (ILMB‘s) Land and Resource Data
Warehouse9 was used as basis for old forest analysis. Definitions of old forest for
each of the biogeoclimatic units represented in the study areas were based on
the ILMB‘s Provincial Non-Spatial Old Growth Retention Order10. This
methodology is consistent with the approach used for the old forest effects
assessment in the EIS. Area summaries of the change in area of old forest from
baseline to maximum disturbance (see definition in Section 1.2) were generated
by leading tree species (i.e., Douglas-fir, lodgepole pine and spruce) and are
presented in Section 3.2.2.
Alpine and Parkland, Wetlands and Grasslands As described for wildlife (Section 3.1), a unique PEM ecosystem unit list was
generated for the two study areas from the PEM spatial data provided by the BC
MOE (Moon et al. 2008). Alpine and parklands, wetlands, and grasslands
ecosystem types were identified from this list based on PEM map codes and
biogeoclimatic units. More specifically:
Alpine and parklands ecosystems were identified as any areas that fell
within the BAFA, CMA, and ESSFxvp biogeoclimatic units;
Wetland ecosystems were any units identified as non-forested meadow
(ME), non-forested wetland (WE) and open water (OW) in the PEM (but
excluding the BAFA, CMA and ESSFxvp)11; and
9 http://lrdw.ca/
10 http://ilmbwww.gov.bc.ca/slrp/lrmp/policiesguidelinesandassessements/oldgrowth/index.html
11 This identification targeted non-forested wetlands
Supplemental Report to Taseko Mines Ltd. Prosperity Gold-Copper Project Environmental Impact Statement
October 2009 Taseko Mines Limited
Page 16
Grassland ecosystems were any areas that fell within the Bunchgrass very
dry warm Alkali (BGxw2) biogeoclimatic unit except for those identified as
ME, OW or non-productive brush (BR) in the PEM plus any units identified
as grassland (GL) in the PEM in the Interior Douglas-Fir very dry mild
(IDFxm), Interior Douglas-fir dry cool (IDFdk), MSdv, MSxv, and SBPSxc
biogeoclimatic units.
Area summaries of the change in area of these ecosystem types from baseline to
maximum disturbance (see definition in Section 1.2) were generated and are
presented in Section 3.2.2.
3 Effects Assessment
3.1 Wildlife
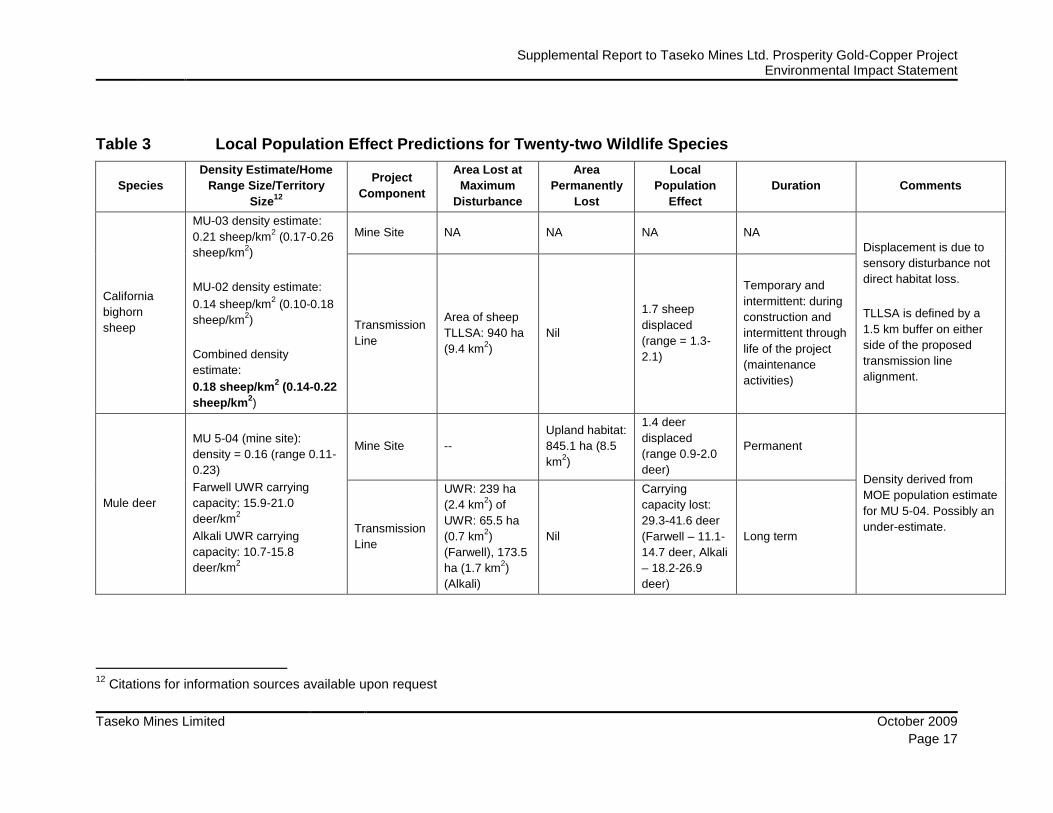
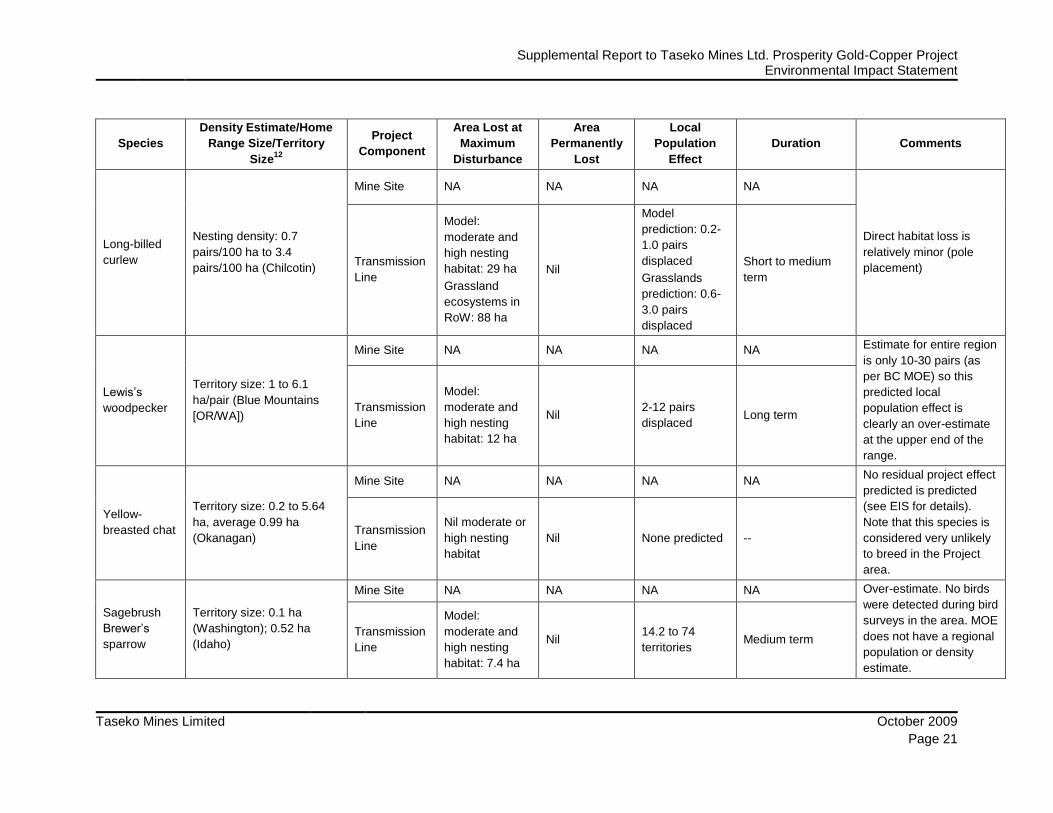
3.1.1 Local Population Effects The results of the local population effects predictions are presented in Table 3.
No attempt was made to draw conclusions on the significance of these local
effects as there was no qualitative context available for so doing.
Supplemental Report to Taseko Mines Ltd. Prosperity Gold-Copper Project Environmental Impact Statement
Taseko Mines Limited October 2009
Page 17
Table 3 Local Population Effect Predictions for Twenty-two Wildlife Species
Species
Density Estimate/Home
Range Size/Territory
Size12
Project
Component
Area Lost at
Maximum
Disturbance
Area
Permanently
Lost
Local
Population
Effect
Duration Comments
California
bighorn
sheep
MU-03 density estimate:
0.21 sheep/km2 (0.17-0.26
sheep/km2)
MU-02 density estimate:
0.14 sheep/km2 (0.10-0.18
sheep/km2)
Combined density
estimate:
0.18 sheep/km2 (0.14-0.22
sheep/km2)
Mine Site NA NA NA NA
Displacement is due to
sensory disturbance not
direct habitat loss.
TLLSA is defined by a
1.5 km buffer on either
side of the proposed
transmission line
alignment.
Transmission
Line
Area of sheep
TLLSA: 940 ha
(9.4 km2)
Nil
1.7 sheep
displaced
(range = 1.3-
2.1)
Temporary and
intermittent: during
construction and
intermittent through
life of the project
(maintenance
activities)
Mule deer
MU 5-04 (mine site):
density = 0.16 (range 0.11-
0.23)
Farwell UWR carrying
capacity: 15.9-21.0
deer/km2
Alkali UWR carrying
capacity: 10.7-15.8
deer/km2
Mine Site --
Upland habitat:
845.1 ha (8.5
km2)
1.4 deer
displaced
(range 0.9-2.0
deer)
Permanent
Density derived from
MOE population estimate
for MU 5-04. Possibly an
under-estimate. Transmission
Line
UWR: 239 ha
(2.4 km2) of
UWR: 65.5 ha
(0.7 km2)
(Farwell), 173.5
ha (1.7 km2)
(Alkali)
Nil
Carrying
capacity lost:
29.3-41.6 deer
(Farwell – 11.1-
14.7 deer, Alkali
– 18.2-26.9
deer)
Long term
12
Citations for information sources available upon request

Supplemental Report to Taseko Mines Ltd. Prosperity Gold-Copper Project Environmental Impact Statement
October 2009 Taseko Mines Limited
Page 18
Species
Density Estimate/Home
Range Size/Territory
Size12
Project
Component
Area Lost at
Maximum
Disturbance
Area
Permanently
Lost
Local
Population
Effect
Duration Comments
Moose Winter density = 0.35
moose/km2
Mine Site --
Upland: 845.1
ha
Wetlands:
403.5 ha
Combined:
1248.6 ha
(12.5 km2)
4.4 moose
displaced
(winter)
Permanent
Used same density
estimate for length of
RoW although east of
Fraser River the density
is lower (see Stalberg
2005). Transmission
Line
Wetland
ecosystems:
46.6 ha (0.5
km2)
VRI: 763.2 ha
(7.6 km2)
(forested – all
types and ages)
Total: 8.1 km2
Nil
2.8 moose
displaced
(winter)
Short to long term
Grizzly bear To be determined in
consultation with BC MOE
Mine Site Pending Pending Pending Pending TML is working closely
with the BC MOE to
refine the assessment of
the Project on grizzly
bears
Transmission
Line Pending Pending Pending Pending
Black bear Unknown (as per BC MOE) Mine Site --
Upland: 845.1
ha
Wetlands:
403.5 ha
Combined:
1248.6 ha
(12.5 km2)
Unknown (as
per BC MOE) Permanent
Black bears are not
considered a
conservation concern
regionally (as per BC
MOE)

Supplemental Report to Taseko Mines Ltd. Prosperity Gold-Copper Project Environmental Impact Statement
Taseko Mines Limited October 2009
Page 19
Species
Density Estimate/Home
Range Size/Territory
Size12
Project
Component
Area Lost at
Maximum
Disturbance
Area
Permanently
Lost
Local
Population
Effect
Duration Comments
Transmission
Line
VRI: 174.4 ha
(1.7 km2) (non-
pine leading
mature and old
forest)
Nil Unknown (as
per BC MOE)
Medium to long
term
Fisher Density: 7.9-13.1 animals
per 1000 km2
Mine Site --
Upland habitat:
845.1 ha (8.5
km2)
0.07-0.12
fishers
displaced
Permanent Density is for habitat in
general not natal denning
habitat specifically so
area loss predicted by
habitat suitability
mapping is not
applicable.
Transmission
Line
VRI: 174.4 ha
(1.7 km2) (non-
pine leading
mature and old
forest)
Nil
0.01-0.02
fishers
displaced
Long term
American
badger Undetermined
Mine Site NA NA NA NA No residual project effect
is predicted (see EIS for
details) Transmission
Line Nil Nil None predicted --
Townsend‘s
big-eared bat
Density: 1 bat
[individual]/126 ha (Santa
Cruz Island, CA)
Mine Site NA NA NA NA Low confidence in
prediction. No
appropriate information
on density is available in
the literature and the BC
MOE does not have a
regional population or
density estimate for this
species (or for density of
colonies/km2 for this
species).
Transmission
Line
VRI: 123.8 ha
(non-pine
leading mature
and old forest)
Nil 1 bat displaced Long term
Great blue
heron (interior
subspecies)
Territory size: 0.6 ha
(freshwater marsh, Oregon) Mine Site --
Wetland
ecosystems:
403.5 ha
242.1 herons
displaced Permanent
Very likely an over-
estimate. Herons have
not been reported in

Supplemental Report to Taseko Mines Ltd. Prosperity Gold-Copper Project Environmental Impact Statement
October 2009 Taseko Mines Limited
Page 20
Species
Density Estimate/Home
Range Size/Territory
Size12
Project
Component
Area Lost at
Maximum
Disturbance
Area
Permanently
Lost
Local
Population
Effect
Duration Comments
Transmission
Line
Model:
moderate and
high feeding
habitat: 176 ha
Nil 105.6 herons
displaced
Short to medium
term
such high numbers
during any project-
related field surveys.
Mallard Pending (CWS)
Mine Site --
Wetland
ecosystems:
403.5 ha
Pending (CWS) Permanent CWS will provide
information to
characterize the local
project effect for
mallards.
Transmission
Line
Wetland
ecosystems:
46.6 ha
Nil Pending (CWS) Medium term
Barrow‘s
goldeneye
(western
population)
Pending (CWS)
Mine Site --
Fish Lake
area: 116.7 ha;
Little Fish Lake
area: 6.5 ha
Pending (CWS) Permanent
CWS will provide
information to
characterize the local
project effect for
Barrow‘s goldeneye. Transmission
Line
Model:
moderate
nesting habitat:
1.3 ha
Wetland
ecosystems:
46.6 ha
Nil Pending (CWS)
Long term (nesting)
Medium term
(wetlands)
Sandhill
crane
Home range: 85 ha in
upper Michigan
Mine Site --
Wetland
ecosystems:
403.5 ha
4.7 home
ranges Permanent
CWS may be able to
provide better regionally-
specific information to
characterize the local
project effect for sandhill
cranes.
Transmission
Line
Model:
moderate and
high feeding
habitat: 44.7 ha;
moderate and
high nesting
habitat: 12.5 ha
Nil < 1 home range Short to medium
term
Supplemental Report to Taseko Mines Ltd. Prosperity Gold-Copper Project Environmental Impact Statement
Taseko Mines Limited October 2009
Page 21
Species
Density Estimate/Home
Range Size/Territory
Size12
Project
Component
Area Lost at
Maximum
Disturbance
Area
Permanently
Lost
Local
Population
Effect
Duration Comments
Long-billed
curlew
Nesting density: 0.7
pairs/100 ha to 3.4
pairs/100 ha (Chilcotin)
Mine Site NA NA NA NA
Direct habitat loss is
relatively minor (pole
placement) Transmission
Line
Model:
moderate and
high nesting
habitat: 29 ha
Grassland
ecosystems in
RoW: 88 ha
Nil
Model
prediction: 0.2-
1.0 pairs
displaced
Grasslands
prediction: 0.6-
3.0 pairs
displaced
Short to medium
term
Lewis‘s
woodpecker
Territory size: 1 to 6.1
ha/pair (Blue Mountains
[OR/WA])
Mine Site NA NA NA NA Estimate for entire region
is only 10-30 pairs (as
per BC MOE) so this
predicted local
population effect is
clearly an over-estimate
at the upper end of the
range.
Transmission
Line
Model:
moderate and
high nesting
habitat: 12 ha
Nil 2-12 pairs
displaced Long term
Yellow-
breasted chat
Territory size: 0.2 to 5.64
ha, average 0.99 ha
(Okanagan)
Mine Site NA NA NA NA No residual project effect
predicted is predicted
(see EIS for details).
Note that this species is
considered very unlikely
to breed in the Project
area.
Transmission
Line
Nil moderate or
high nesting
habitat
Nil None predicted --
Sagebrush
Brewer‘s
sparrow
Territory size: 0.1 ha
(Washington); 0.52 ha
(Idaho)
Mine Site NA NA NA NA Over-estimate. No birds
were detected during bird
surveys in the area. MOE
does not have a regional
population or density
estimate.
Transmission
Line
Model:
moderate and
high nesting
habitat: 7.4 ha
Nil 14.2 to 74
territories Medium term

Supplemental Report to Taseko Mines Ltd. Prosperity Gold-Copper Project Environmental Impact Statement
October 2009 Taseko Mines Limited
Page 22
Species
Density Estimate/Home
Range Size/Territory
Size12
Project
Component
Area Lost at
Maximum
Disturbance
Area
Permanently
Lost
Local
Population
Effect
Duration Comments
Sharp-tailed
grouse
(columbianus
subspecies)
Home range: within 2.8 km
of the lek (BC); 1.87 km2
(Idaho); males 1.7 km2 and
females 3.6 km2 (Montana)
Mine Site NA NA NA NA
No lek sites known for
Project area. BC MOE
does not have a regional
population or density
estimate.
Transmission
Line
Model:
moderate and
high feeding
habitat: 63.1 ha;
moderate and
high nesting
habitat: 31.4 ha
Nil < 1 home range Short to medium
term
Prairie falcon
Home range: known to
travel 26 km from nest to
feeding area
Mine Site
No overlap
between any of
the five buffered
cliff complexes
(including the
known nest site)
and the LSA
Nil None predicted --
No residual project effect
is predicted (see EIS for
details). Locations of
prairie falcon nest sites in
Region 5 are relatively
well known. Only one
nest site has been
identified in the Project
area.
Transmission
Line NA NA NA NA
Short-eared
owl
Density: 1 pair/5.5 ha
(Montana)
Territory size: 73.9 ha
(Manitoba)
Mine Site --
Model:
moderate
feeding
habitat: 146 ha
26.6 pairs
displaced
2 territories
Permanent
Probable over-estimate
using the pair density
estimate. Transmission
Line
Model:
moderate and
high feeding
habitat: 37.2 ha
Nil
6.8 pairs
displaced
< 1 territory
Short to medium
term
Flammulated Home range: 2.2-3.7 ha Mine Site NA NA NA NA Probable overestimate.

Supplemental Report to Taseko Mines Ltd. Prosperity Gold-Copper Project Environmental Impact Statement
Taseko Mines Limited October 2009
Page 23
Species
Density Estimate/Home
Range Size/Territory
Size12
Project
Component
Area Lost at
Maximum
Disturbance
Area
Permanently
Lost
Local
Population
Effect
Duration Comments
owl (BC)
Transmission
Line
Model:
moderate and
high nesting
habitat: 17.4 ha
Nil
4.7-7.9 home
ranges
(assumes no
overlap)
Long term
BC MOE does not have
a regional population or
density estimate but this
species is not common in
the Region. The
province‘s breeding
population is estimated
to be 600-750 pairs (van
Woudenberg 1999).
Bald eagle
Nest density: 9 active
nests/100 km of shoreline
(Nechako River)
Mine Site --
Fish Lake
shoreline: 9.4
km; Little Fish
Lake shoreline:
1.4 km)
Total: 10.8 km
1 active nest
predicted based
on shoreline
length; spring
2009 site visit
by BC MOE
estimated 5-10
active nests and
50-100 birds
feeding in the
Project area13
Permanent
Shoreline length estimate
includes islands
Transmission
Line
Riparian
ecosystems:
123.8 ha
Nil Unknown Long term
Amphibians Unknown14
Mine Site --
Wetland
ecosystems:
403.5 ha
Unknown Permanent
Not all the wetland
ecosystems predicted to
occur within the RoW will
13
BC MOE 2009, unpublished data (R. Packham, J. Youds) 14
No appropriate density estimate is available from the literature and the BC MOE does not have a regional density estimate to provide. Project-
related field data collected in 2006 was focused on species inventory and presence/absence rather than the development of density estimates.

Supplemental Report to Taseko Mines Ltd. Prosperity Gold-Copper Project Environmental Impact Statement
October 2009 Taseko Mines Limited
Page 24
Species
Density Estimate/Home
Range Size/Territory
Size12
Project
Component
Area Lost at
Maximum
Disturbance
Area
Permanently
Lost
Local
Population
Effect
Duration Comments
Transmission
Line
Wetland
ecosystems in
RoW: 46.6 ha
Nil Unknown Short to medium
term
be directly affected (lost).
Supplemental Report to Taseko Mines Ltd. Prosperity Gold-Copper Project Environmental Impact Statement
Taseko Mines Limited October 2009
Page 25
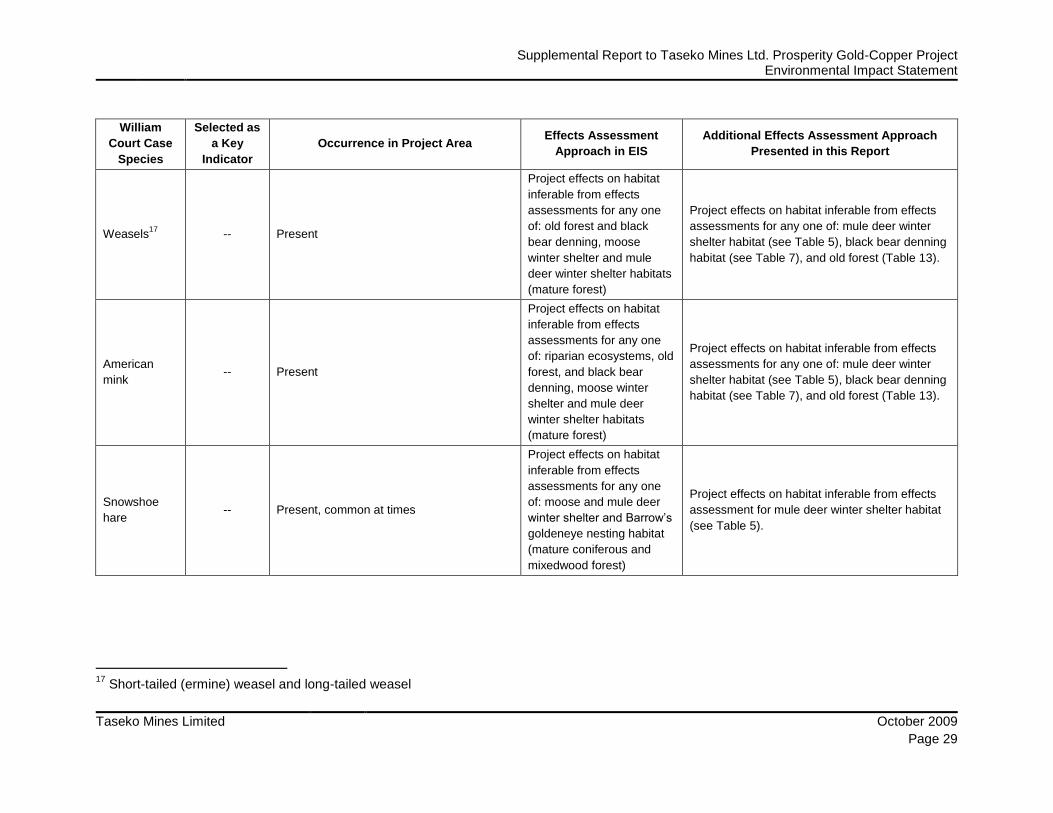
3.1.2 William Court Case Wildlife Species The linkages between the William court case wildlife species and the wildlife and vegetation KIs are presented in Table 3. The linkages presented in this table allow for inferences of project effects based on the findings of the EIS and the findings presented in this report (i.e., Tables 6 to 12 in Section 3.1.3 and Tables 14 and 15 in Section 3.2.2).

Supplemental Report to Taseko Mines Ltd. Prosperity Gold-Copper Project Environmental Impact Statement
October 2009 Taseko Mines Limited
Page 26
Table 4 William Court Case Species – Effects Assessment Approach
William
Court Case
Species
Selected as
a Key
Indicator
Occurrence in Project Area Effects Assessment
Approach in EIS
Additional Effects Assessment Approach
Presented in this Report
Moose Yes Common Key Indicator
See Table 4 for effects assessment for moose
winter feeding habitat. Also see Table 2 for local
population effect prediction for moose.
Mule deer Yes Common Key Indicator
See Table 5 for effects assessment for mule
deer winter shelter habitat. Also see Table 2 for
local population effect prediction for mule deer.
Mountain
goat --
Sporadic; record from Fish Creek Canyon,
more numerous in the adjacent coast
mountain ranges
Project effects on escape
terrain inferable from
effects assessment for
prairie falcon (cliffs)
None – mountain goats are not an issue with
respect to the mine development
California
bighorn
sheep
Yes
Present year-round in eastern portion of
Project area; common along the Fraser R.,
in particular at confluence of the Chilcotin
and Fraser
Key Indicator
California bighorn sheep not an issue with
respect to the mine development; however, see
Table 2 for local population effect prediction for
sheep with respect to transmission line corridor
Feral horses --
The Brittany Triangle, bounded on the west
by the Chilko River, on the east by the
Taseko River, and to the south by Nemaiah
Valley and the South Chilcotin Mountains,
holds the last major numbers of feral horses
in the province (McCrory 2002). However,
this area only marginally overlaps the mine
site RSA (i.e., where the access road follows
the Taseko River).
Qualitative assessment None

Supplemental Report to Taseko Mines Ltd. Prosperity Gold-Copper Project Environmental Impact Statement
Taseko Mines Limited October 2009
Page 27
William
Court Case
Species
Selected as
a Key
Indicator
Occurrence in Project Area Effects Assessment
Approach in EIS
Additional Effects Assessment Approach
Presented in this Report
Grizzly bear Yes
Present in the Project area, west of Big Cr.;
current population estimate of the South
Chilcotin Ranges population is 10415
Key Indicator
See Tables 8 and 9 for effects assessment for
grizzly bear habitat. Local population effect
prediction for grizzly bear pending (see Table 2).
Black bear Yes Present Key Indicator
See Table 7 for effects assessment for black
bear denning habitat. Also see Table 2 for local
population effect prediction for black bear.
Wolf -- Present
Project effects inferable
from effects assessments
for ungulates (prey base)
and grizzly bear
Project effects on habitat inferable from effects
assessments for moose winter feeding habitat
(see Table 4), mule deer winter shelter habitat
(see Table 5), and grizzly bear habitat (see
Tables 8 and 9). Also see Table 2 for local
population effect predictions for moose and mule
deer.
Cougar -- Present
Project effects inferable
from effects assessments
for ungulates (prey base)
and grizzly bear
Project effects on habitat inferable from effects
assessments for moose winter feeding habitat
(see Table 4), mule deer winter shelter habitat
(see Table 5), and grizzly bear habitat (see
Tables 8 and 9). Also see Table 2 for local
population effect predictions for moose and mule
deer.
Canada lynx -- Present
Project effects on habitat
inferable from effects
assessments for any one
of: old forest and black
bear denning, moose
winter shelter and mule
deer winter shelter habitats
(mature forest)
Project effects on habitat inferable from effects
assessments for any one of: mule deer winter
shelter habitat (see Table 5), black bear denning
habitat (see Table 7), and old forest (Table 13).
15
Hamilton 2008; a updated population estimate has recently been completed (July 2009) but not released yet

Supplemental Report to Taseko Mines Ltd. Prosperity Gold-Copper Project Environmental Impact Statement
October 2009 Taseko Mines Limited
Page 28
William
Court Case
Species
Selected as
a Key
Indicator
Occurrence in Project Area Effects Assessment
Approach in EIS
Additional Effects Assessment Approach
Presented in this Report
Bobcat -- Possible
Project effects on habitat
inferable from effects
assessments for any one
of: old forest and black
bear denning, moose
winter shelter and mule
deer winter shelter habitats
(mature forest)
Project effects on habitat inferable from effects
assessments for any one of: mule deer winter
shelter habitat (see Table 5), black bear denning
habitat (see Table 7), and old forest (Table 13).
Wolverine --
Present; current population estimate of the
South Chilcotin Ranges population unit is
4516
Project effects inferable
from effects assessments
for ungulates (winter food
source) and grizzly bear
Project effects on habitat inferable from effects
assessments for moose winter feeding habitat
(see Table 4), mule deer winter shelter habitat
(see Table 5), and grizzly bear habitat (see
Tables 8 and 9). Also see Table 2 for local
population effect predictions for moose and mule
deer.
Fisher Yes Present Key Indicator
See Table 6 for effects assessment for fisher
natal denning habitat. Also see Table 2 for local
population effect prediction for fisher.
American
marten -- Present, apparently common
Project effects on habitat
inferable from effects
assessments for any one
of: old forest and black
bear denning, moose
winter shelter and mule
deer winter shelter habitats
(mature forest)
Project effects on habitat inferable from effects
assessments for any one of: mule deer winter
shelter habitat (see Table 5), black bear denning
habitat (see Table 7), and old forest (Table 13).
16
Lofroth and Ott 2007
Supplemental Report to Taseko Mines Ltd. Prosperity Gold-Copper Project Environmental Impact Statement
Taseko Mines Limited October 2009
Page 29
William
Court Case
Species
Selected as
a Key
Indicator
Occurrence in Project Area Effects Assessment
Approach in EIS
Additional Effects Assessment Approach
Presented in this Report
Weasels17
-- Present
Project effects on habitat
inferable from effects
assessments for any one
of: old forest and black
bear denning, moose
winter shelter and mule
deer winter shelter habitats
(mature forest)
Project effects on habitat inferable from effects
assessments for any one of: mule deer winter
shelter habitat (see Table 5), black bear denning
habitat (see Table 7), and old forest (Table 13).
American
mink -- Present
Project effects on habitat
inferable from effects
assessments for any one
of: riparian ecosystems, old
forest, and black bear
denning, moose winter
shelter and mule deer
winter shelter habitats
(mature forest)
Project effects on habitat inferable from effects
assessments for any one of: mule deer winter
shelter habitat (see Table 5), black bear denning
habitat (see Table 7), and old forest (Table 13).
Snowshoe
hare -- Present, common at times
Project effects on habitat
inferable from effects
assessments for any one
of: moose and mule deer
winter shelter and Barrow‘s
goldeneye nesting habitat
(mature coniferous and
mixedwood forest)
Project effects on habitat inferable from effects
assessment for mule deer winter shelter habitat
(see Table 5).
17
Short-tailed (ermine) weasel and long-tailed weasel

Supplemental Report to Taseko Mines Ltd. Prosperity Gold-Copper Project Environmental Impact Statement
October 2009 Taseko Mines Limited
Page 30
William
Court Case
Species
Selected as
a Key
Indicator
Occurrence in Project Area Effects Assessment
Approach in EIS
Additional Effects Assessment Approach
Presented in this Report
Red squirrel -- Present, common
Project effects on habitat
inferable from effects
assessments for any one
of: old forest, black bear
denning, moose and mule
deer winter shelter (mature
forest)
Project effects on habitat inferable from effects
assessments for any one of: mule deer winter
shelter habitat (see Table 5), black bear denning
habitat (see Table 7), and old forest (Table 13).
Northern
flying squirrel -- Likely present
Project effects on habitat
inferable from effects
assessments for any one
of: old forest and black
bear denning, moose
winter shelter and mule
deer winter shelter habitats
(mature forest)
Project effects on habitat inferable from effects
assessments for any one of: mule deer winter
shelter habitat (see Table 5), black bear denning
habitat (see Table 7), and old forest (Table 13).
American
beaver -- Present
Project effects on habitat
inferable from effects
assessments for any one
of: wetlands and mallard
breeding and feeding
habitat
Project effects on habitat inferable from effects
assessment for wetlands (see Table 14).
Common
muskrat -- Present
Project effects on habitat
inferable from effects
assessments for any one
of: wetlands and mallard
breeding and feeding
habitat
Project effects on habitat inferable from effects
assessment for wetlands (see Table 14).

Supplemental Report to Taseko Mines Ltd. Prosperity Gold-Copper Project Environmental Impact Statement
Taseko Mines Limited October 2009
Page 31
William
Court Case
Species
Selected as
a Key
Indicator
Occurrence in Project Area Effects Assessment
Approach in EIS
Additional Effects Assessment Approach
Presented in this Report
Northern river
otter -- Present
Project effects on habitat
inferable from effects
assessments for any one
of: riparian ecosystems,
wetlands and mallard
breeding and feeding
habitat
Project effects on habitat inferable from effects
assessment for wetlands (see Table 14).
Mice and
voles -- Present, likely common and ubiquitous Qualitative assessment None

Supplemental Report to Taseko Mines Ltd. Prosperity Gold-Copper Project Environmental Impact Statement
October 2009 Taseko Mines Limited
Page 32
3.1.3 Habitat Loss Any evaluation of the wildlife habitat loss predictions presented in this report
should consider the following points:
As discussed in the EIS, the habitat loss predicted at maximum
disturbance is a worst case scenario. The actual habitat loss will be less
than predicted as only 52% of the ―maximum disturbance area‖ used to
determine the peak Project effect on habitat is likely to be physically
disturbed.
Note the differences between habitat capability and habitat suitability as
per the Resources Inventory Committee (1999b): ―Capability is defined as
the ability of the habitat, under the optimal natural (seral) conditions for a
species to provide its life requisites, irrespective of the current condition of
the habitat. It is an estimate of the highest potential value of a particular
habitat for a particular species and is useful in providing predictive
scenarios for various habitat management options…Suitability is defined
as the ability of the habitat in its current condition to provide the life
requisites of a species. It is an estimate of how well current habitat
conditions provide the specified life requisite(s) of the species being
considered. The suitability of the land is frequently less than the capability
because of unfavourable seral conditions.‖ Thus, the habitat capability of a
landscape does not necessarily reflect current wildlife habitat use patterns.
For example, a particular ecosystem unit may have high capability as
mule deer winter shelter habitat but have low suitability as mule deer
winter shelter habitat if it is currently a young forest rather than old forest
and, as such is unlikely to be used by mule deer.
Note that for all species considered here there will be some permanent
loss of habitat as the post-closure water features associated with the mine
development will cover an area of 1088 ha18—a more than three-fold
increase in the open water area in the Fish Creek drainage from baseline
conditions.
In addition, the mine development is proposed for an area that already has some
degree of human disturbance (e.g., logging, cattle grazing, recreation); therefore,
the ecological context is not pristine. In a broader regional context, wildlife habitat
is primarily affected by widespread logging, ranching activities, and mountain
pine beetle. Portions of the Rights and Title Study Area have been identified for
special consideration (i.e., Brittany Triangle) and there are two provincial parks
18
845 ha of upland habitat and 243 ha of aquatic and wetland habitat
Supplemental Report to Taseko Mines Ltd. Prosperity Gold-Copper Project Environmental Impact Statement
Taseko Mines Limited October 2009
Page 33
that overlap the Rights and Title Study Area (Nuntsi Provincial Park and Ts‘yl-os
Provincial Park).
Nuntsi Provincial Park is entirely within the area delineated as the Brittany
Triangle. Up to at least 2002, the Brittany Triangle was still an intact ecosystem
area that was unroaded and had not been subject to commercial logging
(McCrory 2002). The Brittany Triangle is area delineated by the Chilko River to
the west, the Taseko River to the east and the Coast Range to the south
(McCrory 2002). Seventy-five percent of the MSxv and SBPSxc present in the
Rights and Title Study Area is within the Brittany Triangle (Table 5). The SBPSxc
areas within the Brittany Triangle are dominated by pine-leading stands of
various ages, reflecting a diverse fire history (McCrory 2002). Pine forests in the
upland areas are interspersed with wet and dry graminoid-dominated meadow
complexes with small isolated pockets of wet spruce forest and aspen stands
(McCrory 2002). Mountain pine beetle effects will be similar to what is occurring
in the Fish Lake area. Following the beetle kill, the forested ecosystem types in
the SBPSxc will likely be influenced by increased forest fire incidence in the short
term and an increase in aspen-dominated ecosystem types over the long term.
Pine regeneration will likely be dense on drier sites and burned areas. McCrory
(2002) describes the Brittany Triangle as a core intact wilderness area with high
security and feeding value for large carnivores, ungulates and feral horses.

Supplemental Report to Taseko Mines Ltd. Prosperity Gold-Copper Project Environmental Impact Statement
October 2009 Taseko Mines Limited
Page 34
Table 5 Portion of MSxv and SBPSxc in the Rights and Title Study Area that is Protected or of Special Interest
Special Interest or
Protected Area
MSxv in Rights and Title Study
Area
SBPSxc in Rights and Title
Study Area
MSxv and SBPSxc in Rights and
Title Study Area
Area (ha) in
Special Interest
or Protected
Area
As a Portion
(%) of Total
Present
Area (ha) in
Special Interest
or Protected
Area
As a Portion
(%) of Total
Present
Area (ha) in
Special Interest
or Protected
Area
As a Portion
(%) of Total
Present
Brittany Triangle 14516 55.4 86102 80.3 100618 75.4
Nuntsi Provincial Park 0 0.0 19187 17.9 19187 14.4
Ts‘yl-os Provincial Park 38 0.1 0 0.0 38 <0.1
All Special Interest or
Protected Areas Combined 14554 55.6 86102 80.3 100656 75.4
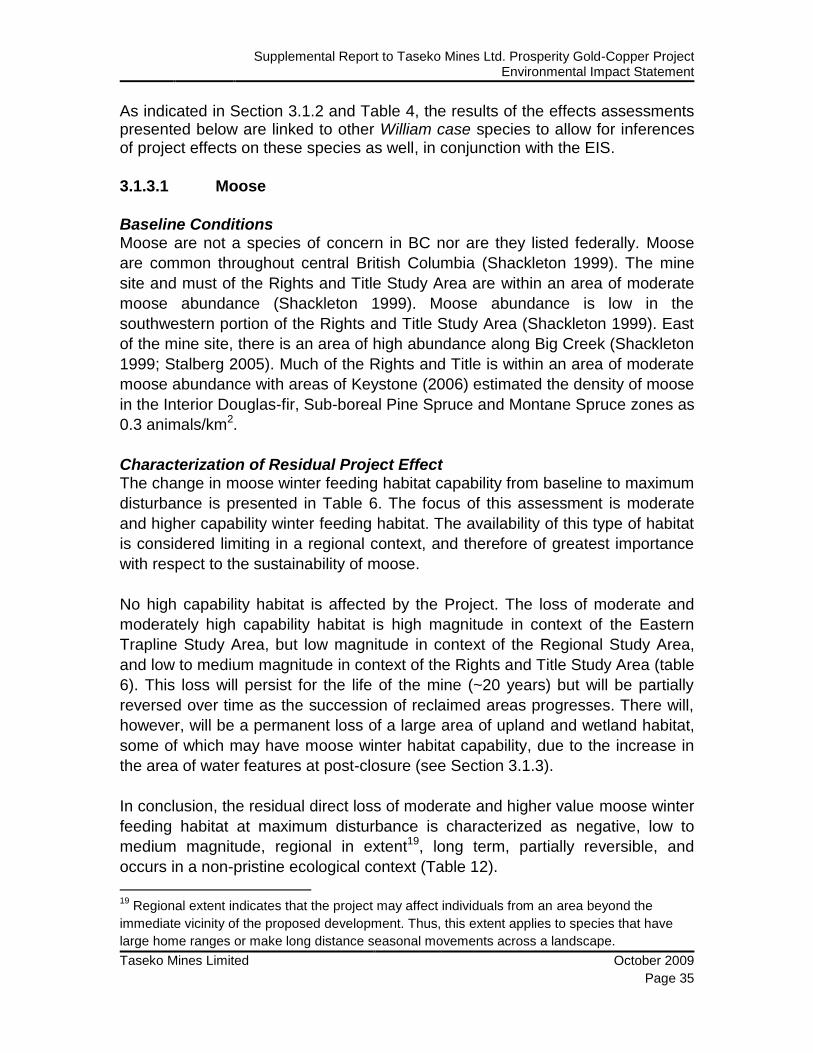
Supplemental Report to Taseko Mines Ltd. Prosperity Gold-Copper Project Environmental Impact Statement
Taseko Mines Limited October 2009
Page 35
As indicated in Section 3.1.2 and Table 4, the results of the effects assessments presented below are linked to other William case species to allow for inferences of project effects on these species as well, in conjunction with the EIS.
3.1.3.1 Moose
Baseline Conditions Moose are not a species of concern in BC nor are they listed federally. Moose
are common throughout central British Columbia (Shackleton 1999). The mine
site and must of the Rights and Title Study Area are within an area of moderate
moose abundance (Shackleton 1999). Moose abundance is low in the
southwestern portion of the Rights and Title Study Area (Shackleton 1999). East
of the mine site, there is an area of high abundance along Big Creek (Shackleton
1999; Stalberg 2005). Much of the Rights and Title is within an area of moderate
moose abundance with areas of Keystone (2006) estimated the density of moose
in the Interior Douglas-fir, Sub-boreal Pine Spruce and Montane Spruce zones as
0.3 animals/km2.
Characterization of Residual Project Effect The change in moose winter feeding habitat capability from baseline to maximum
disturbance is presented in Table 6. The focus of this assessment is moderate
and higher capability winter feeding habitat. The availability of this type of habitat
is considered limiting in a regional context, and therefore of greatest importance
with respect to the sustainability of moose.
No high capability habitat is affected by the Project. The loss of moderate and
moderately high capability habitat is high magnitude in context of the Eastern
Trapline Study Area, but low magnitude in context of the Regional Study Area,
and low to medium magnitude in context of the Rights and Title Study Area (table
6). This loss will persist for the life of the mine (~20 years) but will be partially
reversed over time as the succession of reclaimed areas progresses. There will,
however, will be a permanent loss of a large area of upland and wetland habitat,
some of which may have moose winter habitat capability, due to the increase in
the area of water features at post-closure (see Section 3.1.3).
In conclusion, the residual direct loss of moderate and higher value moose winter
feeding habitat at maximum disturbance is characterized as negative, low to
medium magnitude, regional in extent19, long term, partially reversible, and
occurs in a non-pristine ecological context (Table 12).
19
Regional extent indicates that the project may affect individuals from an area beyond the
immediate vicinity of the proposed development. Thus, this extent applies to species that have
large home ranges or make long distance seasonal movements across a landscape.

Supplemental Report to Taseko Mines Ltd. Prosperity Gold-Copper Project Environmental Impact Statement
October 2009 Taseko Mines Limited
Page 36
Determination of Significance The residual loss of moderate or higher capability moose winter feeding habitat
at maximum disturbance is large locally (Eastern Trapline Study Area) and
moderately large to relatively small regionally (Rights and Title and Regional
study areas, respectively). This loss of moose winter feeding habitat is also
reflected in the predicted loss of wetlands (Section 3.2.2). However, the mine site
area has not been identified as a regionally important moose area and the
characterization of effect magnitude (area of habitat lost) is considered
conservative as it represents a ―worst case scenario‖ (see Section 3.1.3).
Therefore, with the implementation of the mitigation measures proposed in the
EIS (e.g., minimization of clearing area, reclamation of shoreline areas), the
residual Project effect on moose winter feeding habitat is predicted to be not
significant with respect to the sustainability of the moose population in the
Regional and Rights and Title study areas (Table 12). This finding is consistent
with the results of the assessment of residual effects on moose habitat presented
in the EIS.
Confidence in Prediction Confidence in the Project effect and significance prediction is medium (Table 12)
for the following reasons: the availability and loss of habitat was determined
using a quantitative model considered suitable for analyses at this scale;
information on the relative habitat quality and presence/relative abundance of
moose in the study areas is only generally known; the effect mechanism (direct
loss of habitat, including some permanent loss) is clear; and the proposed
mitigation measures, in combination with natural succession, may be effective at
minimizing the Project effect, although the success of the mitigation measures
will not be known until post-closure.
3.1.3.2 Mule Deer
Baseline Conditions Mule deer are not a species of concern in BC nor are they listed federally. Mule
deer are widely distributed and relatively common in central and south-central
British Columbia (Shackleton 1999). The mine site and Rights and Title Study
Area are within an area of moderate mule deer abundance (Shackleton 1999).
East of this area, mule deer become more common, with areas of high
abundance along the Fraser and Chilcotin rivers and around Churn Creek
Protected Area and Big Creek Provincial Park (Shackleton 1999).
Characterization of Residual Project Effect The change in mule deer winter shelter habitat capability from baseline to
maximum disturbance is presented in Table 7. The focus of this assessment is

Supplemental Report to Taseko Mines Ltd. Prosperity Gold-Copper Project Environmental Impact Statement
Taseko Mines Limited October 2009
Page 37
moderate and higher capability winter shelter habitat. The availability of this type
of habitat is considered limiting in a regional context, and therefore of greatest
importance with respect to the sustainability of mule deer.
Almost no high capability habitat is affected by the Project. The loss of moderate
and moderately high capability habitat is medium magnitude in context of the
Eastern Trapline Study Area, but low magnitude in context of the Regional and
Rights and Title study areas (Table 7). This loss will persist for the life of the mine
but will be partially reversed over time as the succession of reclaimed areas
progresses toward mature forest condition. There will, however, will be a
permanent loss of a large area of upland habitat, some of which may have mule
deer winter habitat capability, due to the increase in the area of water features at
post-closure (see Section 3.1.3).
In conclusion, the residual direct loss of moderate and higher value mule deer
winter shelter habitat at maximum disturbance is characterized as negative, low
magnitude, regional in extent, long term, partially reversible, and occurs in a non-
pristine ecological context (Table 12).
Determination of Significance The residual loss of moderate or higher capability mule deer winter shelter
habitat at maximum disturbance is relatively small locally (Eastern Trapline Study
Area) and even smaller regionally (Regional and Rights and Title study areas).
Furthermore, the maximum disturbance area is not considered to be regionally
important as mule deer winter range (i.e., there are no designated mule deer
UWR polygons within the maximum disturbance footprint). The characterization
of effect magnitude (area of habitat lost) is considered conservative as it
represents a ―worst case scenario‖ (see Section 3.1.3). Therefore, with the
implementation of the mitigation measures proposed in the EIS (e.g.,
minimization of clearing area, reforestation of reclaimed areas), the residual
Project effect on mule deer winter shelter habitat is predicted to be not significant
with respect to the sustainability of the mule deer population in the Regional and
Rights and Title study areas (Table 12). This finding is consistent with the results
of the assessment of residual effects on mule deer habitat presented in the EIS.
Confidence in Prediction Confidence in the Project effect and significance prediction is medium (Table 12)
for the following reasons: the availability and loss of habitat was determined
using a quantitative model considered suitable for analyses at this scale;
information on the relative habitat quality and presence/relative abundance of
mule deer in the study areas is only generally known; the effect mechanism
(direct loss of habitat, including some permanent loss) is clear; and the proposed

Supplemental Report to Taseko Mines Ltd. Prosperity Gold-Copper Project Environmental Impact Statement
October 2009 Taseko Mines Limited
Page 38
mitigation measures, in combination with natural succession, may be effective at
minimizing the Project effect, although the success of the mitigation measures
will not be known until post-closure.
3.1.3.3 Fisher
Baseline Conditions The fisher is blue-listed in BC but is not considered at risk federally. The current
range of the fisher in British Columbia is primarily within the Boreal Plains, Sub-
Boreal Interior, Central Interior, and Taiga Plains ecoprovinces (Weir 2003). The
Cariboo subpopulation is estimated to be 206–522 animals, the third most
abundant in the province (Weir 2003).
Characterization of Residual Project Effect The change in fisher natal denning habitat capability from baseline to maximum
disturbance is presented in Table 8. The focus of this assessment is moderate
and higher capability natal denning habitat. The availability of this type of habitat
is considered limiting in a regional context, and therefore of greatest importance
with respect to the sustainability of fishers.
The loss of moderate and high capability habitat is medium to high magnitude in
context of the Eastern Trapline Study Area, but low magnitude in context of the
Regional and Rights and Title study areas (Table 8). This loss will persist for the
life of the mine but will be partially reversed over time as the succession of
reclaimed areas progresses toward mature forest condition. There will, however,
will be a permanent loss of a large area of upland habitat, some of which may
have fisher natal denning habitat capability due to the increase in the area of
water features at post-closure (see Section 3.1.3).
In conclusion, the residual direct loss of moderate and higher value fisher natal
denning habitat at maximum disturbance is characterized as negative, low
magnitude, regional in extent, long term, partially reversible, and occurs in a non-
pristine ecological context (Table 12).
Determination of Significance The residual loss of moderate or higher capability fisher natal denning habitat at
maximum disturbance is large locally (Eastern Trapline Study Area), but small
regionally (Rights and Title and Regional study areas). The characterization of
effect magnitude (area of habitat lost) is considered conservative as it represents
a ―worst case scenario‖ (see Section 3.1.3). Therefore, with the implementation
of the mitigation measures proposed in the EIS (e.g., minimization of clearing
area, reforestation of reclaimed areas), the residual loss of fisher natal denning

Supplemental Report to Taseko Mines Ltd. Prosperity Gold-Copper Project Environmental Impact Statement
Taseko Mines Limited October 2009
Page 39
habitat is predicted to be not significant with respect to the sustainability of the
fisher population in the Regional and Rights and Title study areas (Table 12).
This finding is consistent with the results of the assessment of residual effects on
fisher habitat presented in the EIS.
Confidence in Prediction Confidence in the Project effect and significance prediction is low (Table 12) for
the following reasons: the availability and loss of habitat was determined using a
quantitative model but, given that the availability of suitable natal denning trees is
influenced by individual tree characteristics as well as ecosystem type, this
model may be less suitable at the scale of analysis presented here; information
on the relative habitat quality and presence/relative abundance of fisher in the
study areas is only generally known; the effect mechanism (direct loss of habitat,
including some permanent loss) is clear; the proposed mitigation measures, in
combination with natural succession, may be effective at minimizing the Project
effect.
3.1.3.4 Black Bear
Baseline Conditions Black bears are not a species of concern in BC nor are they listed federally.
Black bears are widely distributed throughout British Columbia. A 2001 study of
black bears in British Columbia estimated the population to be between 120,000
and 160,000 individuals (BCMELP 2001).
Characterization of Residual Project Effect The change in black bear denning habitat capability from baseline to maximum
disturbance is presented in Table 9. The focus of this assessment is moderate
and higher capability denning habitat. However, the availability of this type of
habitat, and of black bear habitat in general, is not considered limiting in a
regional context.
No high or moderately high capability habitat is affected. The loss of moderate
capability habitat is high magnitude in context of the Eastern Trapline Study Area
but small in context of the Regional and Rights and Title study area (Table 9).
This loss will persist for the life of the mine but will be partially reversed over time
as the succession of reclaimed areas progresses toward mature forest condition.
There will, however, will be a permanent loss of a large area of upland habitat,
some of which may have black bear denning habitat capability, due to the
increase in the area of water features at post-closure (see Section 3.1.3).

Supplemental Report to Taseko Mines Ltd. Prosperity Gold-Copper Project Environmental Impact Statement
October 2009 Taseko Mines Limited
Page 40
In conclusion, the residual direct loss of moderate and higher value black bear
denning habitat at maximum disturbance is characterized as negative, low
magnitude, regional in extent, medium term, partially reversible, and occurs in a
non-pristine ecological context (Table 12).
Determination of Significance The residual loss of moderate or higher capability black bear denning habitat at
maximum disturbance is moderately large locally (Eastern Trapline Study Area),
but small regionally (Rights and Title and Regional study areas). Furthermore,
black bears are not considered a conservation concern regionally (Table 3) and
the characterization of effect magnitude (area of habitat lost) is considered
conservative as it represents a ―worst case scenario‖ (see Section 3.1.3).
Therefore, with the implementation of the mitigation measures proposed in the
EIS (e.g., minimization of clearing area, reforestation of reclaimed areas), the
residual Project effect on black bear denning habitat is predicted to be not
significant with respect to the sustainability of the black bear population in the
Regional and Rights and Title study areas (Table 12). This finding is consistent
with the results of the assessment of residual effects on black bear habitat
presented in the EIS.
Confidence in Prediction Confidence in the Project effect and significance prediction is medium (Table 12)
for the following reasons: the availability and loss of habitat was determined
using a quantitative model considered suitable for analyses at this scale;
information on the relative habitat quality and presence/relative abundance of
black bear in the study areas is only generally known; the effect mechanism
(direct loss of habitat, including some permanent loss) is clear; and the proposed
mitigation measures, in combination with natural succession, may be effective at
minimizing the Project effect, although the success of the mitigation measures
will not be known until post-closure.
3.1.3.5 Grizzly Bear
Baseline Conditions Grizzly bears are blue-listed in BC and federally designated as a species of
Special Concern and included on Schedule 320 of the Species at Risk Act. The
Rights and Title Study Area primarily overlaps with the South Chilcotin Ranges
Grizzly Bear Population Unit (GBPU) east of the Chilko River, and Klinaklini–
Homathko GBPU west of the Chilko River, to the west. The South Chilcotin
20
Schedule 3 includes species that have been designated as special concern, and have yet to be
re-assessed by COSEWIC using revised criteria. Once these species have been re-assessed,
they may be considered for inclusion in Schedule 1.
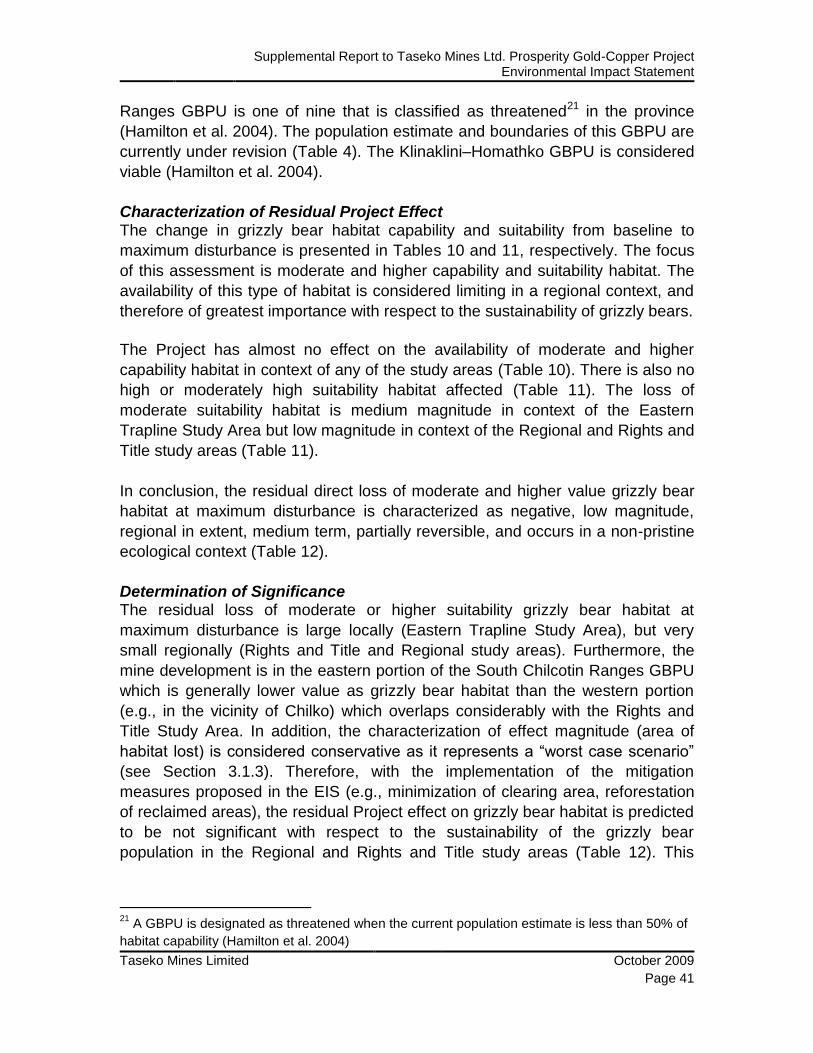
Supplemental Report to Taseko Mines Ltd. Prosperity Gold-Copper Project Environmental Impact Statement
Taseko Mines Limited October 2009
Page 41
Ranges GBPU is one of nine that is classified as threatened21 in the province
(Hamilton et al. 2004). The population estimate and boundaries of this GBPU are
currently under revision (Table 4). The Klinaklini–Homathko GBPU is considered
viable (Hamilton et al. 2004).
Characterization of Residual Project Effect The change in grizzly bear habitat capability and suitability from baseline to
maximum disturbance is presented in Tables 10 and 11, respectively. The focus
of this assessment is moderate and higher capability and suitability habitat. The
availability of this type of habitat is considered limiting in a regional context, and
therefore of greatest importance with respect to the sustainability of grizzly bears.
The Project has almost no effect on the availability of moderate and higher
capability habitat in context of any of the study areas (Table 10). There is also no
high or moderately high suitability habitat affected (Table 11). The loss of
moderate suitability habitat is medium magnitude in context of the Eastern
Trapline Study Area but low magnitude in context of the Regional and Rights and
Title study areas (Table 11).
In conclusion, the residual direct loss of moderate and higher value grizzly bear
habitat at maximum disturbance is characterized as negative, low magnitude,
regional in extent, medium term, partially reversible, and occurs in a non-pristine
ecological context (Table 12).
Determination of Significance The residual loss of moderate or higher suitability grizzly bear habitat at
maximum disturbance is large locally (Eastern Trapline Study Area), but very
small regionally (Rights and Title and Regional study areas). Furthermore, the
mine development is in the eastern portion of the South Chilcotin Ranges GBPU
which is generally lower value as grizzly bear habitat than the western portion
(e.g., in the vicinity of Chilko) which overlaps considerably with the Rights and
Title Study Area. In addition, the characterization of effect magnitude (area of
habitat lost) is considered conservative as it represents a ―worst case scenario‖
(see Section 3.1.3). Therefore, with the implementation of the mitigation
measures proposed in the EIS (e.g., minimization of clearing area, reforestation
of reclaimed areas), the residual Project effect on grizzly bear habitat is predicted
to be not significant with respect to the sustainability of the grizzly bear
population in the Regional and Rights and Title study areas (Table 12). This
21
A GBPU is designated as threatened when the current population estimate is less than 50% of
habitat capability (Hamilton et al. 2004)

Supplemental Report to Taseko Mines Ltd. Prosperity Gold-Copper Project Environmental Impact Statement
October 2009 Taseko Mines Limited
Page 42
finding is consistent with the results of the assessment of residual effects on
grizzly bear habitat presented in the EIS.
Confidence in Prediction Confidence in the Project effect and significance prediction is medium (Table 12)
for the following reasons: the availability and loss of habitat was determined
using quantitative models based on map products developed by the BC MOE
and considered suitable for analyses at this scale; information on the relative
habitat quality and presence/relative abundance of grizzly bear in the study areas
is only generally known; the effect mechanism (direct loss of habitat, including
some permanent loss) is clear; and the proposed mitigation measures, in
combination with natural succession, may be effective at minimizing the Project
effect, although the success of the mitigation measures will not be known until
post-closure.

Supplemental Report to Taseko Mines Ltd. Prosperity Gold-Copper Project Environmental Impact Statement
Taseko Mines Limited October 2009
Page 43
Table 6 Change in Habitat Availability from Baseline to Maximum Disturbance: Moose Winter Feeding Habitat Capability
Habitat Capability Class
Regional Study Area Rights and Title Study Area (SBPSxc and
MSxv only) Eastern Trapline Study Area
Are
a (
ha
) a
t B
as
elin
e
Are
a (
ha
) a
t M
ax
imu
m
Dis
turb
an
ce
Ch
an
ge
in
Are
a (
ha)
fro
m
Bas
eli
ne t
o M
ax
imu
m
Dis
turb
an
ce
Pe
rce
nt
Ch
an
ge
in
Are
a (
%)
fro
m B
as
elin
e t
o M
ax
imu
m
Dis
turb
an
ce
Are
a (
ha
) a
t B
as
elin
e
Are
a (
ha
) a
t M
ax
imu
m
Dis
turb
an
ce
Ch
an
ge
in
Are
a (
ha)
fro
m
Bas
eli
ne t
o M
ax
imu
m
Dis
turb
an
ce
Pe
rce
nt
Ch
an
ge
in
Are
a (
%)
fro
m B
as
elin
e t
o M
ax
imu
m
Dis
turb
an
ce
Are
a (
ha
) a
t B
as
elin
e
Are
a (
ha
) a
t M
ax
imu
m
Dis
turb
an
ce
Ch
an
ge
in
Are
a (
ha)
fro
m
Bas
eli
ne t
o M
ax
imu
m
Dis
turb
an
ce
Pe
rce
nt
Ch
an
ge
in
Are
a (
%)
fro
m B
as
elin
e t
o M
ax
imu
m
Dis
turb
an
ce
High 0 0 0 0.0 0 0 0 0.0 0 0 0 0.0
Moderately High 19,253 18,728 -525 -2.7 3,062 2,663 -399 -13.0 1,106 707 -399 -36.1
Moderate 41,326 40,854 -471 -1.1 16,511 16,286 -225 -1.4 1,211 987 -225 -18.5
Low 247,201 243,557 -3,644 -1.5 108,087 105,736 -2,351 -2.2 18,731 16,380 -2,351 -12.5
Very Low 111,457 111,225 -232 -0.2 1,158 1,137 -21 -1.8 7,427 7,406 -21 -0.3
Total Habitat 419,237 414,366 -4,872* -1.2 128,818 125,822 -2,996** -2.3 28,476 25,480 -2,996** -10.5
* Total change in area (ha) from baseline to maximum disturbance does not add up to the maximum disturbance area (footprint) in the regional study area (i.e., 4997 ha) because some of the footprint area is already nil value as moose winter feeding habitat at baseline ** Total change in area (ha) from baseline to maximum disturbance does not add up to the maximum disturbance area (footprint) in the Rights and Title and Eastern Trapline study areas (i.e., 3118 ha) because some of the footprint area is already nil value as moose winter feeding habitat at baseline.

Supplemental Report to Taseko Mines Ltd. Prosperity Gold-Copper Project Environmental Impact Statement
October 2009 Taseko Mines Limited
Page 44
Table 7 Change in Habitat Availability from Baseline to Maximum Disturbance: Mule Deer Winter Shelter Habitat Capability
Habitat Capability Class
Regional Study Area Rights and Title Study Area (SBPSxc and
MSxv only) Eastern Trapline Study Area
Are
a (
ha
) a
t B
as
elin
e
Are
a (
ha
) a
t M
ax
imu
m
Dis
turb
an
ce
Ch
an
ge
in
Are
a (
ha)
fro
m
Bas
eli
ne t
o M
ax
imu
m
Dis
turb
an
ce
Pe
rce
nt
Ch
an
ge
in
Are
a
(%)
fro
m B
ase
lin
e t
o
Ma
xim
um
Dis
turb
an
ce
Are
a (
ha
) a
t B
as
elin
e
Are
a (
ha
) a
t M
ax
imu
m
Dis
turb
an
ce
Ch
an
ge
in
Are
a (
ha)
fro
m
Bas
eli
ne t
o M
ax
imu
m
Dis
turb
an
ce
Pe
rce
nt
Ch
an
ge
in
Are
a
(%)
fro
m B
ase
lin
e t
o
Ma
xim
um
Dis
turb
an
ce
Are
a (
ha
) a
t B
as
elin
e
Are
a (
ha
) a
t M
ax
imu
m
Dis
turb
an
ce
Ch
an
ge
in
Are
a (
ha)
fro
m
Bas
eli
ne t
o M
ax
imu
m
Dis
turb
an
ce
Pe
rce
nt
Ch
an
ge
in
Are
a
(%)
fro
m B
ase
lin
e t
o
Ma
xim
um
Dis
turb
an
ce
High 3,359 3,358 -1 - <0.1 0 0 0 0.0 0 0 0 0.0
Moderately High 47,861 47,689 -172 -0.4 436 436 - <1 -0.1 3 3 - <1 -7.1
Moderate 150,682 149,122 -1,560 -1.0 29,130 28,405 -725 -2.5 11,943 11,218 -725 -6.1
Low 185,221 182,641 -2,580 -1.4 93,994 92,153 -1,841 -2.0 14,225 12,385 -1,841 -12.9
Very Low 8,209 8,183 -26 -0.3 619 600 -19 -3.0 645 627 -19 -2.9
Total Habitat 395,332 390,994 -4,338* -1.1 124,179 121,595 -2,585** -2.1 26,817 24,232 -2,585** -9.6
* Total change in area (ha) from baseline to maximum disturbance does not add up to the maximum disturbance area (footprint) in the regional study area (i.e., 4997 ha) because some of the footprint area is already nil value as mule deer winter shelter habitat at baseline ** Total change in area (ha) from baseline to maximum disturbance does not add up to the maximum disturbance area (footprint) in the Rights and Title and Eastern Trapline study areas (i.e., 3118 ha) because some of the footprint area is already nil value as mule deer winter shelter habitat at baseline

Supplemental Report to Taseko Mines Ltd. Prosperity Gold-Copper Project Environmental Impact Statement
Taseko Mines Limited October 2009
Page 45
Table 8 Change in Habitat Availability from Baseline to Maximum Disturbance: Fisher Natal Denning Habitat Capability
Habitat Capability Class
Regional Study Area Rights and Title Study Area (SBPSxc and
MSxv only) Eastern Trapline Study Area
Are
a (
ha
) a
t B
as
elin
e
Are
a (
ha
) a
t M
ax
imu
m
Dis
turb
an
ce
Ch
an
ge
in
Are
a (
ha)
fro
m
Bas
eli
ne t
o M
ax
imu
m
Dis
turb
an
ce
Pe
rce
nt
Ch
an
ge
in
Are
a
(%)
fro
m B
ase
lin
e t
o
Ma
xim
um
Dis
turb
an
ce
Are
a (
ha
) a
t B
as
elin
e
Are
a (
ha
) a
t M
ax
imu
m
Dis
turb
an
ce
Ch
an
ge
in
Are
a (
ha)
fro
m
Bas
eli
ne t
o M
ax
imu
m
Dis
turb
an
ce
Pe
rce
nt
Ch
an
ge
in
Are
a
(%)
fro
m B
ase
lin
e t
o
Ma
xim
um
Dis
turb
an
ce
Are
a (
ha
) a
t B
as
elin
e
Are
a (
ha
) a
t M
ax
imu
m
Dis
turb
an
ce
Ch
an
ge
in
Are
a (
ha)
fro
m
Bas
eli
ne t
o M
ax
imu
m
Dis
turb
an
ce
Pe
rce
nt
Ch
an
ge
in
Are
a
(%)
fro
m B
ase
lin
e t
o
Ma
xim
um
Dis
turb
an
ce
High 1468 1435 -33 -2.3 1,030 1,014 -16 -1.6 153 137 -16 -10.7
Moderate 79676 79072 -604 -0.8 14,206 13,968 -238 -1.7 986 748 -238 -24.1
Low 280075 276405 -3670 -1.3 108,274 105,962 -2,312 -2.1 19150 16839 -2312 -12.1
Total Habitat 361219 356911 -4308* -1.2 123,510 120,944 -2,566** -2.1 20289 17723 -2566** -12.6
* Total change in area (ha) from baseline to maximum disturbance does not add up to the maximum disturbance area (footprint) in the regional study area (i.e., 4997 ha) because some of the footprint area is already nil value as fisher natal denning habitat at baseline ** Total change in area (ha) from baseline to maximum disturbance does not add up to the maximum disturbance area (footprint) in the Rights and Title and Eastern Trapline study areas (i.e., 3118 ha) because some of the footprint area is already nil value as fisher natal denning habitat at baseline

Supplemental Report to Taseko Mines Ltd. Prosperity Gold-Copper Project Environmental Impact Statement
October 2009 Taseko Mines Limited
Page 46
Table 9 Change in Habitat Availability from Baseline to Maximum Disturbance: Black Bear Denning Habitat Capability
Habitat Capability Class
Regional Study Area Rights and Title Study Area (SBPSxc and
MSxv only) Eastern Trapline Study Area
Are
a (
ha
) a
t B
as
elin
e
Are
a (
ha
) a
t M
ax
imu
m
Dis
turb
an
ce
Ch
an
ge
in
Are
a (
ha)
fro
m
Bas
eli
ne t
o M
ax
imu
m
Dis
turb
an
ce
Pe
rce
nt
Ch
an
ge
in
Are
a
(%)
fro
m B
ase
lin
e t
o
Ma
xim
um
Dis
turb
an
ce
Are
a (
ha
) a
t B
as
elin
e
Are
a (
ha
) a
t M
ax
imu
m
Dis
turb
an
ce
Ch
an
ge
in
Are
a (
ha)
fro
m
Bas
eli
ne t
o M
ax
imu
m
Dis
turb
an
ce
Pe
rce
nt
Ch
an
ge
in
Are
a
(%)
fro
m B
ase
lin
e t
o
Ma
xim
um
Dis
turb
an
ce
Are
a (
ha
) a
t B
as
elin
e
Are
a (
ha
) a
t M
ax
imu
m
Dis
turb
an
ce
Ch
an
ge
in
Are
a (
ha)
fro
m
Bas
eli
ne t
o M
ax
imu
m
Dis
turb
an
ce
Pe
rce
nt
Ch
an
ge
in
Are
a
(%)
fro
m B
ase
lin
e t
o
Ma
xim
um
Dis
turb
an
ce
High 0 0 0 0.0 0 0 0 0.0 0 0 0 0.0
Moderately High 0 0 0 0.0 0 0 0 0.0 0 0 0 0.0
Moderate 168,539 165,867 -2,673 -1.6 88,754 87,178 -1575 -1.8 6,888 5,312 -1,575 -22.9
Low 151,369 149,972 -1,398 -0.9 29,086 28,196 -890 -3.1 12,393 11,503 -890 -7.2
Very Low 62,953 62,784 -169 -0.3 3,588 3,527 -60 -1.7 6,224 6,164 -60 -1.0
Total Habitat 382,862 378,622 -4,240* -1.1 121,428 118,902 -2526** -2.1 25,505 22,979 -2,526** -9.9
* Total change in area (ha) from baseline to maximum disturbance does not add up to the maximum disturbance area (footprint) in the regional study area (i.e., 4997 ha) because some of the footprint area is already nil value as black bear denning habitat at baseline ** Total change in area (ha) from baseline to maximum disturbance does not add up to the maximum disturbance area (footprint) in the Rights and Title and Eastern Trapline study areas (i.e., 3118 ha) because some of the footprint area is already nil value as black bear denning habitat at baseline

Supplemental Report to Taseko Mines Ltd. Prosperity Gold-Copper Project Environmental Impact Statement
Taseko Mines Limited October 2009
Page 47
Table 10 Change in Habitat Availability from Baseline to Maximum Disturbance: Grizzly Bear Habitat Capability
Habitat Capability Class
Regional Study Area Rights and Title Study Area Eastern Trapline Study Area
Are
a (
ha
) a
t B
as
elin
e
Are
a (
ha
) a
t M
ax
imu
m
Dis
turb
an
ce
Ch
an
ge
in
Are
a (
ha)
fro
m
Bas
eli
ne t
o M
ax
imu
m
Dis
turb
an
ce
Pe
rce
nt
Ch
an
ge
in
Are
a
(%)
fro
m B
ase
lin
e t
o
Ma
xim
um
Dis
turb
an
ce
Are
a (
ha
) a
t B
as
elin
e
Are
a (
ha
) a
t M
ax
imu
m
Dis
turb
an
ce
Ch
an
ge
in
Are
a (
ha)
fro
m
Bas
eli
ne t
o M
ax
imu
m
Dis
turb
an
ce
Pe
rce
nt
Ch
an
ge
in
Are
a
(%)
fro
m B
ase
lin
e t
o
Ma
xim
um
Dis
turb
an
ce
Are
a (
ha
) a
t B
as
elin
e
Are
a (
ha
) a
t M
ax
imu
m
Dis
turb
an
ce
Ch
an
ge
in
Are
a (
ha)
fro
m
Bas
eli
ne t
o M
ax
imu
m
Dis
turb
an
ce
Pe
rce
nt
Ch
an
ge
in
Are
a
(%)
fro
m B
ase
lin
e t
o
Ma
xim
um
Dis
turb
an
ce
High 0 0 0 0.0 0 0 0 0.0 0 0 0 0.0
Moderately High 68 68 0 0.0 0 0 0 0.0 0 0 0 0.0
Moderate 136,228 136,191 -37 - <0.1 125,289 125,289 0 0.0 19,281 19,281 0 0.0
Low 197,930 195,794 -2,137 -1.1 154,397 153,498 -899 -0.6 12,969 12,069 -900 -6.9
Very Low 142,097 139,659 -2,438 -1.7 101,840 99,792 -2,047 -2.0 9,393 7,344 -2,049 -21.8
Total Habitat 476,324 471,712 -4,612* -1.0 381,525 378,579 -2,947** -0.8 41,643 38,694 -2,949** -7.1
* Total change in area (ha) from baseline to maximum disturbance does not add up to the maximum disturbance area (footprint) in the regional study area (i.e., 4997 ha) because some of the footprint area is already nil value as grizzly bear habitat at baseline ** Total change in area (ha) from baseline to maximum disturbance does not add up to the maximum disturbance area (footprint) in the Rights and Title and Eastern Trapline study areas (i.e., 3118 ha) because some of the footprint area is already nil value as grizzly bear habitat at baseline

Supplemental Report to Taseko Mines Ltd. Prosperity Gold-Copper Project Environmental Impact Statement
October 2009 Taseko Mines Limited
Page 48
Table 11 Change in Habitat Availability from Baseline to Maximum Disturbance: Grizzly Bear Habitat Suitability
Habitat Capability Class
Regional Study Area Rights and Title Study Area Eastern Trapline Study Area
Are
a (
ha
) a
t B
as
elin
e
Are
a (
ha
) a
t M
ax
imu
m
Dis
turb
an
ce
Ch
an
ge
in
Are
a (
ha)
fro
m B
as
elin
e t
o
Ma
xim
um
Dis
turb
an
ce
Pe
rce
nt
Ch
an
ge
in
Are
a
(%)
fro
m B
ase
lin
e t
o
Ma
xim
um
Dis
turb
an
ce
Are
a (
ha
) a
t B
as
elin
e
Are
a (
ha
) a
t M
ax
imu
m
Dis
turb
an
ce
Ch
an
ge
in
Are
a (
ha)
fro
m B
as
elin
e t
o
Ma
xim
um
Dis
turb
an
ce
Pe
rce
nt
Ch
an
ge
in
Are
a
(%)
fro
m B
ase
lin
e t
o
Ma
xim
um
Dis
turb
an
ce
Are
a (
ha
) a
t B
as
elin
e
Are
a (
ha
) a
t M
ax
imu
m
Dis
turb
an
ce
Ch
an
ge
in
Are
a (
ha)
fro
m B
as
elin
e t
o
Ma
xim
um
Dis
turb
an
ce
Pe
rce
nt
Ch
an
ge
in
Are
a
(%)
fro
m B
ase
lin
e t
o
Ma
xim
um
Dis
turb
an
ce
High 5,983 5,983 0 0.0 10,669 10,669 0 0.0 426 426 0 0.0
Moderately High 28,135 28,135 0 0.0 9,932 9,932 0 0.0 1,216 1,216 0 0.0
Moderate 54,799 54,372 -426 -0.8 38,496 38,126 -371 -1.0 2,659 2,288 -371 -14.0
Low 135,316 131,243 -4,073 -3.0 72,236 69,748 -2,488 -3.4 15,193 12,703 -2,490 -16.4
Very Low 175,487 175,203 -284 -0.2 183,291 183,032 -259 -0.1 15,494 15,235 -259 -1.7
Total Habitat 399,720 394,936 -4,783* -1.2 314,624 311,506 -3,118 -1.0 34,989 31,869 -3,120** -8.9
* Total change in area (ha) from baseline to maximum disturbance does not add up to the maximum disturbance area (footprint) in the regional study area (i.e., 4997 ha) because some of the footprint area is already nil value as grizzly bear habitat at baseline ** Total change in area (ha) from baseline to maximum disturbance is slightly more than the maximum disturbance area (footprint) in the Eastern Trapline study area (i.e., 3118 ha) due to rounding error

Supplemental Report to Taseko Mines Ltd. Prosperity Gold-Copper Project Environmental Impact Statement
Taseko Mines Limited October 2009
Page 49
Table 12 Effect Characterization and Determination of Significance for Wildlife
Potential Residual Environmental Effects
Residual Environmental Effects Characteristics
Sig
nif
ican
ce
Pre
dic
tio
n
Co
nfi
de
nce
Dir
ec
tio
n
Ma
gn
itu
de
Ge
og
rap
hic
Ex
ten
t
Du
rati
on
Rev
ers
ibilit
y
Ec
olo
gic
al
Co
nte
xt
Loss of Moose Winter Feeding Habitat at Maximum Disturbance
N Low to medium; 624 ha of moderate and moderately high capability habitat lost in Rights and Title Study Area (Table 6)
R LT/P R/I D N M
Loss of Mule Deer Winter Shelter Habitat at Maximum Disturbance
N Low; 725 ha of moderate and moderately high capability habitat lost in Rights and Title Study Area (Table 7)
R LT/P R/I D N M
Loss of Fisher Natal Denning Habitat at Maximum Disturbance
N Low; 254 ha of moderate and high capability habitat lost in Rights and Title Study Area (Table 8)
R LT/P R/I D N L
Loss of Black Bear Denning Habitat at Maximum Disturbance
N Low; 1575 ha of moderate capability habitat lost in Rights and Title Study Area (Table 9)
R MT/P R/I D N M
Change in Grizzly Bear Habitat Capability at Maximum Disturbance
N No effect; nil moderate and higher capability habitat lost in Rights and Title Study Area (Table 10)
R MT/P R/I D N M
Change in Grizzly Bear Habitat Suitability at Maximum Disturbance
N Low; 371 ha of moderate suitability habitat lost in Rights and Title Study Area (Table 11)
R MT/P R/I D N M
KEY
Direction: P Positive: measurable effect moves
condition in a positive direction relative to baseline N Negative: measurable effect moves
condition in negative direction relative to baseline Magnitude:
Quantitative assessment: Expressed as a quantity. Units of expression vary depending on the measurable parameter, but, typically for wildlife the unit is hectares. In addition the
Geographic Extent: S Site-specific: effect(s) on wildlife confined
to single small area within local study area L Local: effect(s) on wildlife occurs within
local study area R Regional: effect(s) on wildlife occurs
within or beyond regional study area Duration: ST Short-term: effect(s) limited to no more
than one annual cycle within the life history of an individual (≤ 1 year) MT Medium-term: effect(s) last for part or
all of the average life span of an individual;
Reversibility: R Reversible: effect(s) reversible
with reclamation and/or over time I Irreversible: effect(s) permanent
and cannot be reversed with reclamation and/or over time Ecological Context: U Undisturbed—area relatively
unaffected, or not adversely affected, by human activity D Developed—area substantially
previously disturbed by human activity, or human activity is still
Significance: S Significant N Not Significant
Prediction Confidence: Based on literature review, data analysis, professional judgment and effectiveness of mitigation L Low: not confident in prediction,
could vary considerably M Medium: confident in prediction,
moderate variability H High: confident in prediction,
low variability

Supplemental Report to Taseko Mines Ltd. Prosperity Gold-Copper Project Environmental Impact Statement
October 2009 Taseko Mines Limited
Page 50
quantity may be expressed as a percent change.
Qualitative assessment:
Low: ≤5% change
Medium: >5% to 15% change
High: >15% change
actual number of years is KI-specific LT Long-term: effect(s) last beyond
individual life spans and will affect multiple generations; actual number of years is KI-specific P Effect(s) permanent (i.e., irreversible)
present
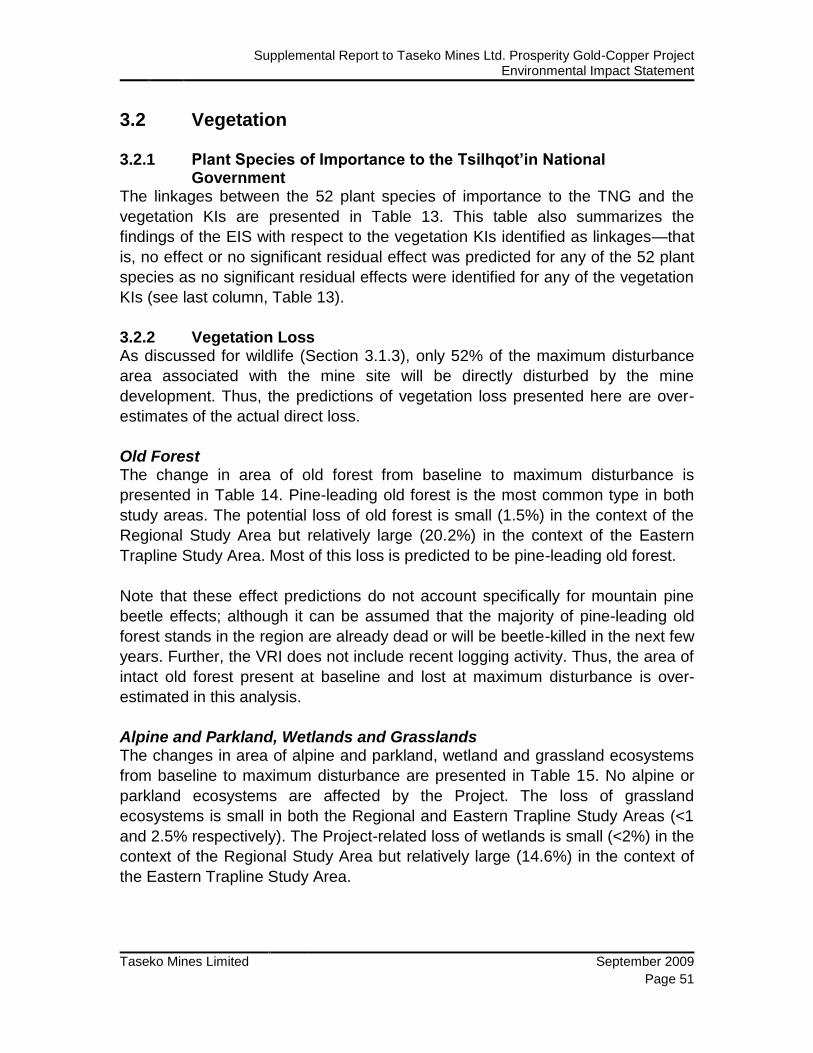
Supplemental Report to Taseko Mines Ltd. Prosperity Gold-Copper Project Environmental Impact Statement
Taseko Mines Limited September 2009
Page 51
3.2 Vegetation
3.2.1 Plant Species of Importance to the Tsilhqot’in National Government
The linkages between the 52 plant species of importance to the TNG and the
vegetation KIs are presented in Table 13. This table also summarizes the
findings of the EIS with respect to the vegetation KIs identified as linkages—that
is, no effect or no significant residual effect was predicted for any of the 52 plant
species as no significant residual effects were identified for any of the vegetation
KIs (see last column, Table 13).
3.2.2 Vegetation Loss As discussed for wildlife (Section 3.1.3), only 52% of the maximum disturbance
area associated with the mine site will be directly disturbed by the mine
development. Thus, the predictions of vegetation loss presented here are over-
estimates of the actual direct loss.
Old Forest The change in area of old forest from baseline to maximum disturbance is
presented in Table 14. Pine-leading old forest is the most common type in both
study areas. The potential loss of old forest is small (1.5%) in the context of the
Regional Study Area but relatively large (20.2%) in the context of the Eastern
Trapline Study Area. Most of this loss is predicted to be pine-leading old forest.
Note that these effect predictions do not account specifically for mountain pine
beetle effects; although it can be assumed that the majority of pine-leading old
forest stands in the region are already dead or will be beetle-killed in the next few
years. Further, the VRI does not include recent logging activity. Thus, the area of
intact old forest present at baseline and lost at maximum disturbance is over-
estimated in this analysis.
Alpine and Parkland, Wetlands and Grasslands The changes in area of alpine and parkland, wetland and grassland ecosystems
from baseline to maximum disturbance are presented in Table 15. No alpine or
parkland ecosystems are affected by the Project. The loss of grassland
ecosystems is small in both the Regional and Eastern Trapline Study Areas (<1
and 2.5% respectively). The Project-related loss of wetlands is small (<2%) in the
context of the Regional Study Area but relatively large (14.6%) in the context of
the Eastern Trapline Study Area.
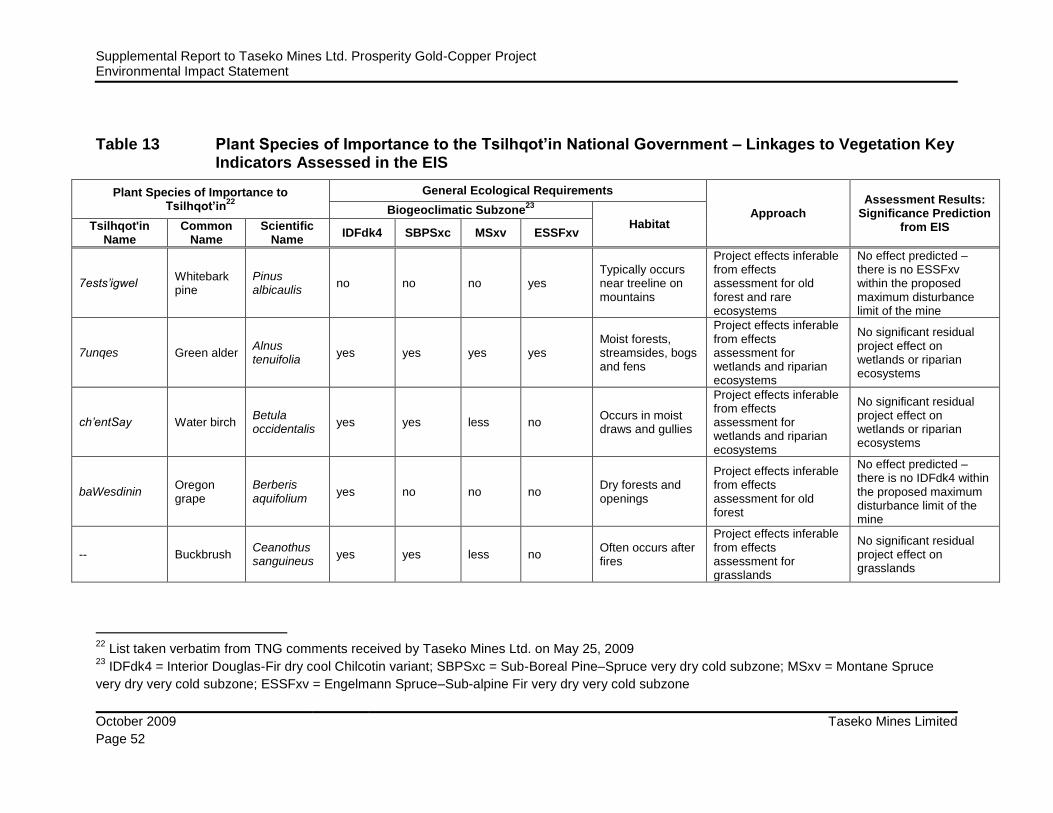
Supplemental Report to Taseko Mines Ltd. Prosperity Gold-Copper Project Environmental Impact Statement
October 2009 Taseko Mines Limited
Page 52
Table 13 Plant Species of Importance to the Tsilhqot’in National Government – Linkages to Vegetation Key Indicators Assessed in the EIS
Plant Species of Importance to Tsilhqot’in
22
General Ecological Requirements
Approach Assessment Results:
Significance Prediction from EIS
Biogeoclimatic Subzone23
Habitat Tsilhqot'in Name
Common Name
Scientific Name
IDFdk4 SBPSxc MSxv ESSFxv
7ests‟igwel Whitebark pine
Pinus albicaulis
no no no yes Typically occurs near treeline on mountains
Project effects inferable from effects assessment for old forest and rare ecosystems
No effect predicted – there is no ESSFxv within the proposed maximum disturbance limit of the mine
7unqes Green alder Alnus tenuifolia
yes yes yes yes Moist forests, streamsides, bogs and fens
Project effects inferable from effects assessment for wetlands and riparian ecosystems
No significant residual project effect on wetlands or riparian ecosystems
ch‟entSay Water birch Betula occidentalis
yes yes less no Occurs in moist draws and gullies
Project effects inferable from effects assessment for wetlands and riparian ecosystems
No significant residual project effect on wetlands or riparian ecosystems
baWesdinin Oregon grape
Berberis aquifolium
yes no no no Dry forests and openings
Project effects inferable from effects assessment for old forest
No effect predicted – there is no IDFdk4 within the proposed maximum disturbance limit of the mine
-- Buckbrush Ceanothus sanguineus
yes yes less no Often occurs after fires
Project effects inferable from effects assessment for grasslands
No significant residual project effect on grasslands
22
List taken verbatim from TNG comments received by Taseko Mines Ltd. on May 25, 2009 23
IDFdk4 = Interior Douglas-Fir dry cool Chilcotin variant; SBPSxc = Sub-Boreal Pine–Spruce very dry cold subzone; MSxv = Montane Spruce
very dry very cold subzone; ESSFxv = Engelmann Spruce–Sub-alpine Fir very dry very cold subzone
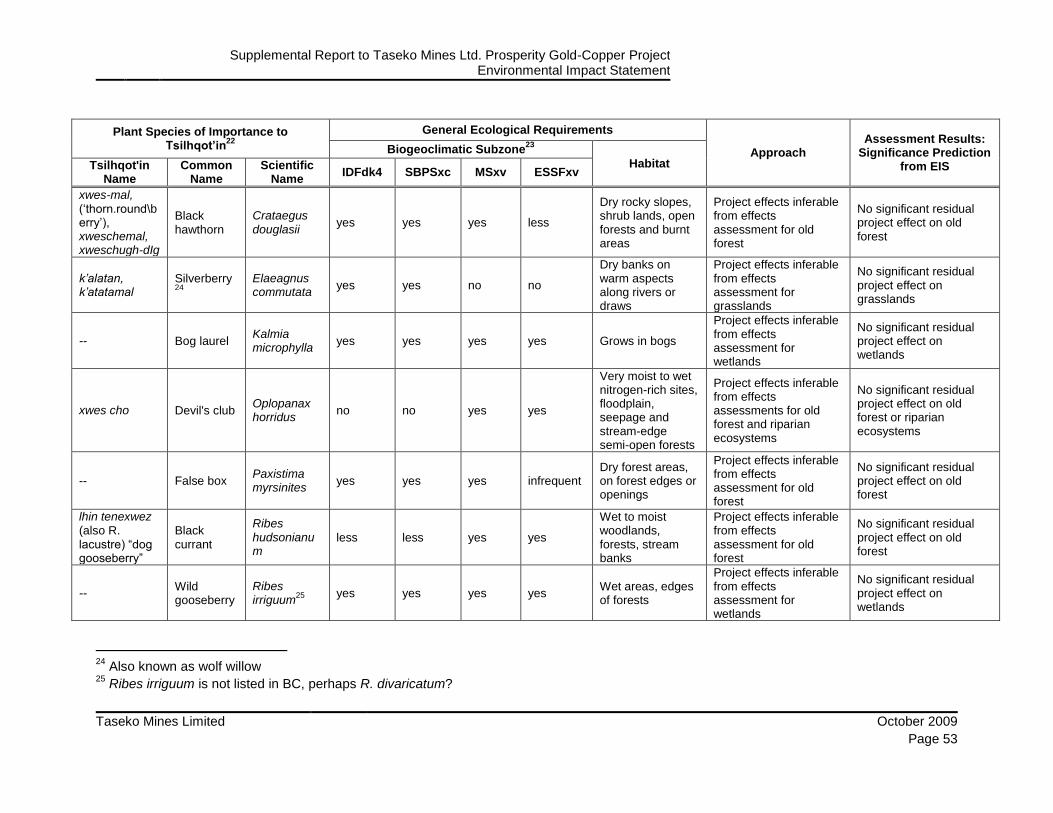
Supplemental Report to Taseko Mines Ltd. Prosperity Gold-Copper Project Environmental Impact Statement
Taseko Mines Limited October 2009
Page 53
Plant Species of Importance to Tsilhqot’in
22
General Ecological Requirements
Approach Assessment Results:
Significance Prediction from EIS
Biogeoclimatic Subzone23
Habitat Tsilhqot'in Name
Common Name
Scientific Name
IDFdk4 SBPSxc MSxv ESSFxv
xwes-mal, (‗thorn.round\berry‘), xweschemal, xweschugh-dIg
Black hawthorn
Crataegus douglasii
yes yes yes less
Dry rocky slopes, shrub lands, open forests and burnt areas
Project effects inferable from effects assessment for old forest
No significant residual project effect on old forest
k‟alatan, k‟atatamal
Silverberry24
Elaeagnus commutata
yes yes no no
Dry banks on warm aspects along rivers or draws
Project effects inferable from effects assessment for grasslands
No significant residual project effect on grasslands
-- Bog laurel Kalmia microphylla
yes yes yes yes Grows in bogs
Project effects inferable from effects assessment for wetlands
No significant residual project effect on wetlands
xwes cho Devil's club Oplopanax horridus
no no yes yes
Very moist to wet nitrogen-rich sites, floodplain, seepage and stream-edge semi-open forests
Project effects inferable from effects assessments for old forest and riparian ecosystems
No significant residual project effect on old forest or riparian ecosystems
-- False box Paxistima myrsinites
yes yes yes infrequent Dry forest areas, on forest edges or openings
Project effects inferable from effects assessment for old forest
No significant residual project effect on old forest
lhin tenexwez (also R. lacustre) ―dog gooseberry‖
Black currant
Ribes hudsonianum
less less yes yes
Wet to moist woodlands, forests, stream banks
Project effects inferable from effects assessment for old forest
No significant residual project effect on old forest
-- Wild gooseberry
Ribes irriguum
25
yes yes yes yes Wet areas, edges of forests
Project effects inferable from effects assessment for wetlands
No significant residual project effect on wetlands
24
Also known as wolf willow 25
Ribes irriguum is not listed in BC, perhaps R. divaricatum?

Supplemental Report to Taseko Mines Ltd. Prosperity Gold-Copper Project Environmental Impact Statement
October 2009 Taseko Mines Limited
Page 54
Plant Species of Importance to Tsilhqot’in
22
General Ecological Requirements
Approach Assessment Results:
Significance Prediction from EIS
Biogeoclimatic Subzone23
Habitat Tsilhqot'in Name
Common Name
Scientific Name
IDFdk4 SBPSxc MSxv ESSFxv
lhin tenexwez ‗dog gooseberry‘
Swamp gooseberry
Ribes lacustre
yes yes yes yes Moist woods and seepage areas
Project effects inferable from effects assessments for old forest, wetlands and riparian ecosystems
No significant residual project effect on old forest, wetlands or riparian ecosystems
ts‟elhiq Dwarf raspberry
Rubus arcticus, and/or R. pubescens
less yes yes yes Moist woods
Project effects inferable from effects assessments for old forest and riparian ecosystems
No significant residual project effect on old forest or riparian ecosystems
texaltsel Wild raspberry
Rubus idaeus
yes yes yes no Moist rich forest openings
Project effects inferable from effects assessments for old forest and riparian ecosystems
No significant residual project effect on old forest or riparian ecosystems
NitSan nibaxalyish „it takes away one‟s Dress”
Blackcap Rubus leucodermis
yes yes less no
Dry forest openings, often on disturbed areas like clear-cuts
Project effects inferable from effects assessment for old forest
No significant residual project effect on wetlands and riparian ecosystems
-- Dwarf/alpine willow
Salix arctica no no yes yes Grows in bogs, and at high elevation
Project effects inferable from effects assessment for grasslands (alpine)
No significant residual project effect on grasslands; there are no alpine areas within the proposed maximum disturbance limit of mine
chib (tchib) Red elderberry
Sambucus racemosa
only along creeks
only along creeks
yes in clearings
Moist to mesic meadows and forests, streambanks, disturbed areas
Project effects inferable from effects assessments for old forest and riparian ecosystems
No significant residual project effect on old forest or riparian ecosystems
nelghes Dwarf mountain blueberry
Vaccinium caespitosum (?also V. myrtilloides)
yes yes yes yes Dry, sunny forest openings,
Project effects inferable from effects assessment for old forest
No significant residual project effect on old forest
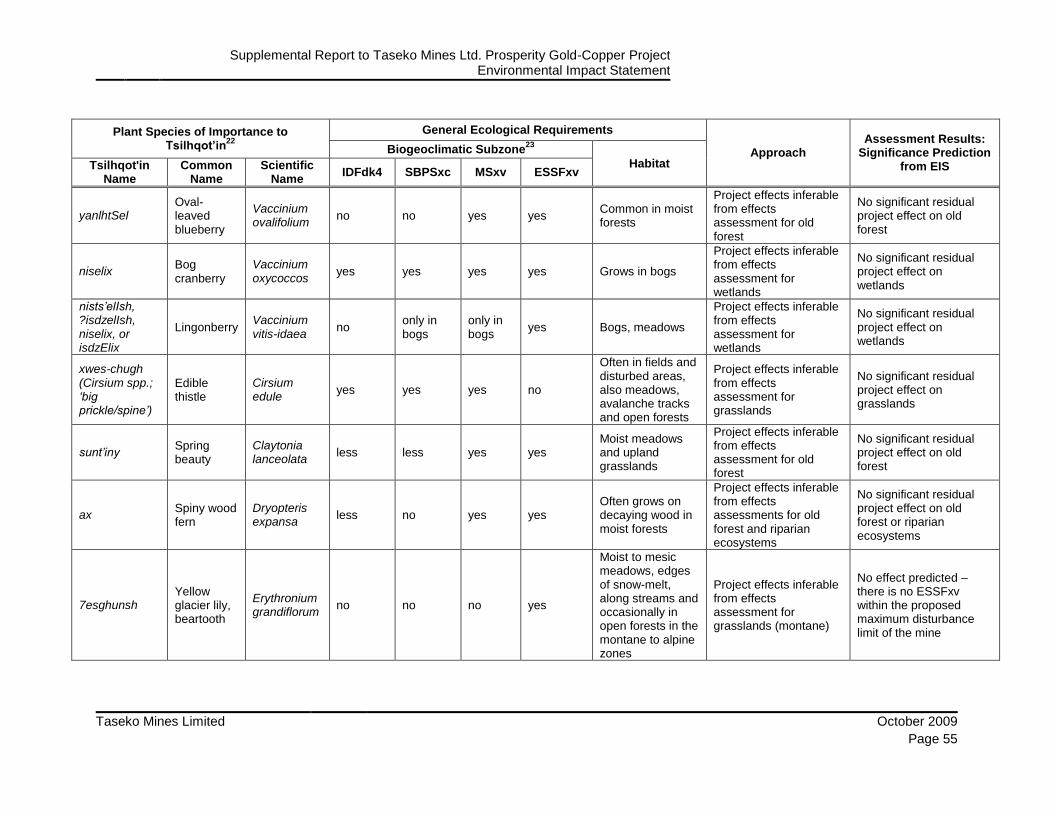
Supplemental Report to Taseko Mines Ltd. Prosperity Gold-Copper Project Environmental Impact Statement
Taseko Mines Limited October 2009
Page 55
Plant Species of Importance to Tsilhqot’in
22
General Ecological Requirements
Approach Assessment Results:
Significance Prediction from EIS
Biogeoclimatic Subzone23
Habitat Tsilhqot'in Name
Common Name
Scientific Name
IDFdk4 SBPSxc MSxv ESSFxv
yanlhtSel Oval-leaved blueberry
Vaccinium ovalifolium
no no yes yes Common in moist forests
Project effects inferable from effects assessment for old forest
No significant residual project effect on old forest
niselix Bog cranberry
Vaccinium oxycoccos
yes yes yes yes Grows in bogs
Project effects inferable from effects assessment for wetlands
No significant residual project effect on wetlands
nists‟elIsh, ?isdzelIsh, niselix, or isdzElix
Lingonberry Vaccinium vitis-idaea
no only in bogs
only in bogs
yes Bogs, meadows
Project effects inferable from effects assessment for wetlands
No significant residual project effect on wetlands
xwes-chugh (Cirsium spp.; „big prickle/spine‟)
Edible thistle
Cirsium edule
yes yes yes no
Often in fields and disturbed areas, also meadows, avalanche tracks and open forests
Project effects inferable from effects assessment for grasslands
No significant residual project effect on grasslands
sunt‟iny Spring beauty
Claytonia lanceolata
less less yes yes Moist meadows and upland grasslands
Project effects inferable from effects assessment for old forest
No significant residual project effect on old forest
ax Spiny wood fern
Dryopteris expansa
less no yes yes Often grows on decaying wood in moist forests
Project effects inferable from effects assessments for old forest and riparian ecosystems
No significant residual project effect on old forest or riparian ecosystems
7esghunsh Yellow glacier lily, beartooth
Erythronium grandiflorum
no no no yes
Moist to mesic meadows, edges of snow-melt, along streams and occasionally in open forests in the montane to alpine zones
Project effects inferable from effects assessment for grasslands (montane)
No effect predicted – there is no ESSFxv within the proposed maximum disturbance limit of the mine

Supplemental Report to Taseko Mines Ltd. Prosperity Gold-Copper Project Environmental Impact Statement
October 2009 Taseko Mines Limited
Page 56
Plant Species of Importance to Tsilhqot’in
22
General Ecological Requirements
Approach Assessment Results:
Significance Prediction from EIS
Biogeoclimatic Subzone23
Habitat Tsilhqot'in Name
Common Name
Scientific Name
IDFdk4 SBPSxc MSxv ESSFxv
7undziny Blueleaf wild strawberry
Fragaria virginiana
yes yes yes less Common forest plant as well as in open areas
Project effects inferable from effects assessments for old forest and riparian ecosystems
No significant residual project effect on old forest or riparian ecosystems
sachen Tiger lily
Lilium columbianum
yes yes yes yes Moist forest openings
Project effects inferable from effects assessment for old forest
No significant residual project effect on old forest
7est‟anchis (see also Rumex)
Wild celery, barestem lomatium
Lomatium nudicaule
yes only on warm slopes
no rarely
Dry rocky or grassy slopes, and open forest in the dry IDF
Project effects inferable from effects assessment for grasslands
No significant residual project effect on grasslands; unlikely to be present within the proposed maximum disturbance limit of the mine
tl‟etch‟et nelhtsen („meadow fragrant‟)
Field mint Mentha arvensis
yes yes yes less
Wet marshes, meadows, thickets, and stream and lake margins
Project effects inferable from effects assessment for riparian ecosystems
No significant residual project effect on riparian ecosystems
7est‟anchis Sour dock26
Rumex acetosa ssp. alpestris
yes yes less no Often grows in fields and grazed areas
None (introduced species)
Non-invasive introduced species, unlikely to be affected by Project, may increase following project-related disturbance
? nistiny yaz chuZ ―deer‘s young?‖
Mountain dandelion
Agoseris glauca var. dasycephala
yes yes yes yes
Grasslands and montane areas, often on scree slopes
Project effects inferable from effects assessment for grasslands (montane)
No significant residual project effect on grasslands
26
Also known as green sorrel or garden sorrel

Supplemental Report to Taseko Mines Ltd. Prosperity Gold-Copper Project Environmental Impact Statement
Taseko Mines Limited October 2009
Page 57
Plant Species of Importance to Tsilhqot’in
22
General Ecological Requirements
Approach Assessment Results:
Significance Prediction from EIS
Biogeoclimatic Subzone23
Habitat Tsilhqot'in Name
Common Name
Scientific Name
IDFdk4 SBPSxc MSxv ESSFxv
tl‟uWesen niZt‟an (‗snake
berry‘)
Pacific anemone
Anemone multifida
yes yes yes yes Rocky outcrops, and warm, open areas
Project effects inferable from effects assessment for grasslands
No significant residual project effect on grasslands
?tsachén ? Red columbine
Aquilegia formosa
yes yes yes yes Often grows in openings, and logging areas
Project effects inferable from effects assessments for old forest and riparian ecosystems
No significant residual project effect on old forest or riparian ecosystems
-- Heart-leaved arnica
Arnica cordifolia
yes yes yes yes Common plant in conifer forests
Project effects inferable from effects assessment for old forest
No significant residual project effect on old forest
ts‟elh niZt‟an? False Solomon‘s seal
Maianthemum racemosum
yes yes yes yes
Moist to mesic forests, streambanks, meadows and clearings
Project effects inferable from effects assessments for old forest and riparian ecosystems
No significant residual project effect on old forest or riparian ecosystems
xilhday Yellow pond-lily
Nuphar polysepala
yes yes yes yes Grows in open water
Project effects inferable from effects assessment for wetlands
No significant residual project effect on wetlands; any population associated with Fish Lake will be lost but this species is likely to re-establish on Prosperity Lake
-- Great mullein
Verbascum thapsus
yes yes no no Dry roadsides, gravel pits, fields and waste places
None (introduced species)
Invasive species, unlikely to be affected by Project, may increase following project-related disturbance
-- Mountain valerian
Valeriana sitchensis
no no yes yes Grows at higher elevations
Project effects inferable from effects assessment for grasslands (montane)
No significant residual project effect on grasslands

Supplemental Report to Taseko Mines Ltd. Prosperity Gold-Copper Project Environmental Impact Statement
October 2009 Taseko Mines Limited
Page 58
Plant Species of Importance to Tsilhqot’in
22
General Ecological Requirements
Approach Assessment Results:
Significance Prediction from EIS
Biogeoclimatic Subzone23
Habitat Tsilhqot'in Name
Common Name
Scientific Name
IDFdk4 SBPSxc MSxv ESSFxv
sesdan (?‘bear leaves‘)
Death camus
Zygadenus venenosus
yes yes yes yes Edges of wetlands, in fens
Project effects inferable from effects assessment for wetlands
No significant residual project effect on wetlands
tishbinlh Indian-hemp
Apocynum cannabinum
yes yes less less Often grows on warm, gravelly slopes and banks
Project effects inferable from effects assessment for grasslands
No significant residual project effect on grasslands
Timber milkvetch
Astragalus miser
yes yes less less Grows in forest openings and dry, sunny areas
Project effects inferable from effects assessment for grasslands and old forest
No significant residual project effect on grasslands or old forest
ts‟utanchuny ya?elhdeZ
Paintbrush Castilleja miniata
yes yes yes yes
Grows on moist soils, often close to creeks and rivers
Project effects inferable from effects assessment for riparian ecosystems
No significant residual project effect on riparian ecosystems
binek‟en (‗you colour yourself with it‘)
Strawberry-blite
Chenopodium capitatum
yes yes no no
Often grows in disturbed places like roadsides and fields
Project effects inferable from effects assessment for grasslands
No significant residual project effect on grasslands
tlh‟EgwElzEyx Giant wildrye grass
Leymus cinereus
yes yes no no More common in grasslands in valley bottoms
Project effects inferable from effects assessment for grasslands and old forest
No significant residual project effect on grasslands or old forest
-- Pineapple weed
Matricaria matricarioides
yes yes yes no
Grows on disturbed soils such as roadsides and grazed areas
None (introduced species)
Invasive species, unlikely to be affected by Project, may increase following project-related disturbance
-- Alfalfa Medicago sativa
yes yes less no Fields and roadsides
None (introduced species)
Agricultural plant, unlikely to be affected by Project, and may increase following project-related

Supplemental Report to Taseko Mines Ltd. Prosperity Gold-Copper Project Environmental Impact Statement
Taseko Mines Limited October 2009
Page 59
Plant Species of Importance to Tsilhqot’in
22
General Ecological Requirements
Approach Assessment Results:
Significance Prediction from EIS
Biogeoclimatic Subzone23
Habitat Tsilhqot'in Name
Common Name
Scientific Name
IDFdk4 SBPSxc MSxv ESSFxv
disturbance
tl‟ekw‟a, tl‟eqw‟a
Reedgrass27
Phragmites australis
yes yes no no Grows on edges of marshes with open water
Project effects inferable from effects assessment for wetlands
No significant residual project effect on wetlands
“takatlh‟ulh” taqatl‟ulh
Pondweed
Potamogeton natans and other spp. of pondweed
yes yes yes yes
Grows in open water such as ponds and lake edges
Project effects inferable from effects assessment for wetlands
No significant residual project effect on wetlands; any population associated with Fish Lake will be lost but pondweeds are likely to re-establish on Prosperity Lake
gwelhts‟i (‗it stings)
Stinging nettle
Urtica dioica yes yes yes yes Grows on rich soils
Project effects inferable from effects assessment for riparian ecosystems
No significant residual project effect on riparian ecosystems
dech-lizba Tree fungus
-- yes yes yes yes Common in older forests of all types
Project effects inferable from effects assessment for old forest
No significant residual project effect on old forest
7elhts‟ibadzagh
Mushrooms -- yes yes yes yes Common in all forested areas
Project effects inferable from effects assessment for old forest
No significant residual project effect on old forest
27
Also known as common reed

Supplemental Report to Taseko Mines Ltd. Prosperity Gold-Copper Project Environmental Impact Statement
October 2009 Taseko Mines Limited
Page 60
Table 14 Change in Area of Old Forest from Baseline to Maximum Disturbance
Leading Tree Species
Regional Study Area Eastern Trapline Study Area
Bas
eli
ne A
rea
(h
a)
Ma
xim
um
Dis
turb
an
ce
Are
a (
ha
)
Ch
an
ge
in
Are
a (
ha)
fro
m B
as
elin
e t
o
Ma
xim
um
Dis
turb
an
ce
Pe
rce
nt
Ch
an
ge
in
Are
a (
%)
fro
m
Bas
eli
ne t
o M
ax
imu
m
Dis
turb
an
ce
Bas
eli
ne A
rea
(h
a)
Ma
xim
um
Dis
turb
an
ce
Are
a (
ha
)
Ch
an
ge
in
Are
a (
ha)
fro
m B
as
elin
e t
o
Ma
xim
um
Dis
turb
an
ce
Pe
rce
nt
Ch
an
ge
in
Are
a (
%)
fro
m
Bas
eli
ne t
o M
ax
imu
m
Dis
turb
an
ce
Douglas-fir 8,191 8,182 -10 -0.1 9 9 0 0.0
Lodgepole pine 94,502 93,110 -1,392 -1.5 6,789 5,571 -1,219 -18.0
Spruce 9,441 9,142 -299 -3.2 742 436 -306 -41.3
Total Old Forest 112,134 110,434 -1,700 -1.5 7,540 6,015 -1,525 -20.2

Supplemental Report to Taseko Mines Ltd. Prosperity Gold-Copper Project Environmental Impact Statement
Taseko Mines Limited October 2009
Page 61
Table 15 Change in Area of Vegetation Key Indicators from Baseline to Maximum Disturbance: Alpine and Parkland, Grasslands and Wetlands
Ecosystem Type
Regional Study Area Eastern Trapline Study Area
Bas
eli
ne A
rea
(h
a)
Ma
xim
um
Dis
turb
an
ce
Are
a (
ha
)
Ch
an
ge
in
Are
a (
ha)
fro
m B
as
elin
e t
o
Ma
xim
um
Dis
turb
an
ce
Pe
rce
nt
Ch
an
ge
in
Are
a (
%)
fro
m
Bas
eli
ne t
o M
ax
imu
m
Dis
turb
an
ce
Bas
eli
ne A
rea
(h
a)
Ma
xim
um
Dis
turb
an
ce
Are
a (
ha
)
Ch
an
ge
in
Are
a (
ha)
fro
m B
as
elin
e t
o
Ma
xim
um
Dis
turb
an
ce
Pe
rce
nt
Ch
an
ge
in
Are
a (
%)
fro
m
Bas
eli
ne t
o M
ax
imu
m
Dis
turb
an
ce
Alpine and Parkland 131,664 131,664 0 0.0 13,424 13,424 0 0.0
Grasslands 3,587 3,569 -18 -0.5 582 567 -15 -2.5
Wetlands 34,397 33,737 -660 -1.9 3,653 3,120 -533 -14.6

Supplemental Report to Taseko Mines Ltd. Prosperity Gold-Copper Project Environmental Impact Statement
October 2009 Taseko Mines Limited
Page 62
4 References
BC Ministry of Environment, Lands and Parks (BCMELP). 2001. Black Bears in
British Columbia. Ecology, Conservation and Management. Wildlife
Branch, Victoria, BC.
Dawson, R.J., H.M. Armleder, B.A. Bings, and D.E. Peel. 2007. Management
strategy for mule deer winter ranges in the Cariboo-Chilcotin–Part A:
Management Plan for shallow and moderate snowpack zones. Land
Management Handbook 60, BC Ministry of Forest and Range, Research
Branch, Victoria, BC.
Dunster, J.A. and K.J. Dunster. 1996. Dictionary of Natural Resource
Management. UBC Press, Vancouver, BC.
Hamilton, A.N. 2007. Central Interior ecoregional assessment: grizzly bear
habitat capability and suitability mapping. Unpublished report, BC Ministry
of Environment, Victoria, BC.
Hamilton, A.N. 2008. 2008 Grizzly bear population estimate for British Columbia.
BC Ministry of Environment, Victoria, B.C.
Hamilton, A.N., D.C. Heard and M.A. Austin. 2004. British Columbia Grizzly Bear
(Ursus arctos) Population Estimate 2004. BC Ministry of Water, Land and
Air Protection. Victoria, BC.
Intrepid Biological Contracting (Intrepid). 2004. Preliminary list of ‗high value‘
wetlands for moose within the Cariboo Forest Region. Prepared for BC
Ministry of Water, Land, and Air Protection, Williams Lake, BC.
Keystone Wildlife Research (Keystone). 2006. Identification and management of
moose winter habitat in the Cariboo region: literature review and mapping
pilot study. Prepared for BC Ministry of Environment, Williams Lake, BC.
Loforth, E.C. and P.K. Ott. 2007. Assessment of the sustainability of wolverine
harvest in British Columbia, Canada. Journal of Wildlife Management 71:
2193-2200
Madrone Consultants Ltd. 1999. Technical Report: Species-habitat models for
Prosperity Project Area. Prepared for Taseko Mines Ltd., Vancouver, BC.
McCrory, W. 2002. Preliminary Conservation Assessment of the Rainshadow
Wild Horse Ecosystem, Brittany Triangle, Chilcotin, British Columbia,
Canada: A Review of Grizzly and Black Bears, Other Wildlife, Feral

Supplemental Report to Taseko Mines Ltd. Prosperity Gold-Copper Project Environmental Impact Statement
Taseko Mines Limited October 2009
Page 63
Horses, and Wild Salmon. Prepared for Friends of Nemaiah Valley,
Victoria, BC.
Meidinger, D. and J. Pojar. 1991. Ecosystems of British Columbia. Research
Branch, BC Ministry of Forests, Victoria, BC.
Moon, D.E., R.A. MacMillan, R. Coupé, and N. Phillips, 2008. Williams Lake TSA
PEM Final Report. Prepared for BC Ministry of Forests and Range,
Williams Lake, BC.
Resources Inventory Committee. 1999a. Standards for Predictive Ecosystem
Mapping. Inventory Standard. Version 1.0. BC Ministry of Environment,
Lands and Parks, Terrestrial Ecosystem Mapping Alternatives Task Force,
Victoria, BC.
Resources Inventory Committee. 1999b. British Columbia Wildlife Habitat Rating
Standards. Version 2.0. BC Ministry of Environment, Lands and Parks,
Resources Inventory Branch. Victoria, BC.
Salmo Consulting Inc., Diversified Environmental Services, GAIA Consultants
Inc., Forem Technologies Ltd. and AXYS Environmental Consulting Ltd.
(Salmo Consulting). 2003. Volume 2: Cumulative Effects Indicators,
Thresholds, and Case Studies. Prepared for BC Oil and Gas Commission
and Muskwa-Kechika Advisory Board, Fort St. John, BC.
Shackleton, D. 1999. Hoofed Mammals of British Columbia. Royal British
Columbia Museum Handbook. UBC Press. Vancouver, BC.
Stalberg, M. 2005. 2005-Big Creek (5-04) Winter Moose Inventory. BC Ministry of
Water, Land and Air Protection. Williams Lake, BC.
Steen, O.A. and R.A. Coupé. 1997. A field guide to forest site identification and
interpretation for the Cariboo Forest Region. Land Management
Handbook No. 30. BC Ministry of Forests, Victoria, BC.
Stevens, V. 1995. Wildlife diversity in British Columbia: distribution and habitat
use of amphibians, reptiles, birds, and mammals in biogeoclimatic zones.
Working Paper 04/1995. Research Branch, BC Ministry of Forests, and
Wildlife Branch, BC Ministry of Environment, Lands and Parks, Wildlife
Branch, Victoria, BC.
Weir, R.D. 2003. Status of the Fisher in British Columbia. Wildlife Bulletin No. B-
105. BC Ministry of Water, Land and Air Protection, Biodiversity Branch,

Supplemental Report to Taseko Mines Ltd. Prosperity Gold-Copper Project Environmental Impact Statement
October 2009 Taseko Mines Limited
Page 64
and BC Ministry of Sustainable Resource Management, Conservation
Data Centre. Victoria, BC.


