
ProTechnics Completion Diagnostics
■ Not Naturally Occurring In Reservoir ■ Chemically Inert in Reservoir Environments ■ Thermally Stable at Reservoir Temperatures ■ Gas Soluble ■ Predictable and Repeatable Analytical Detection ■ Detectable at Low Concentrations(low parts per billion, ppb)
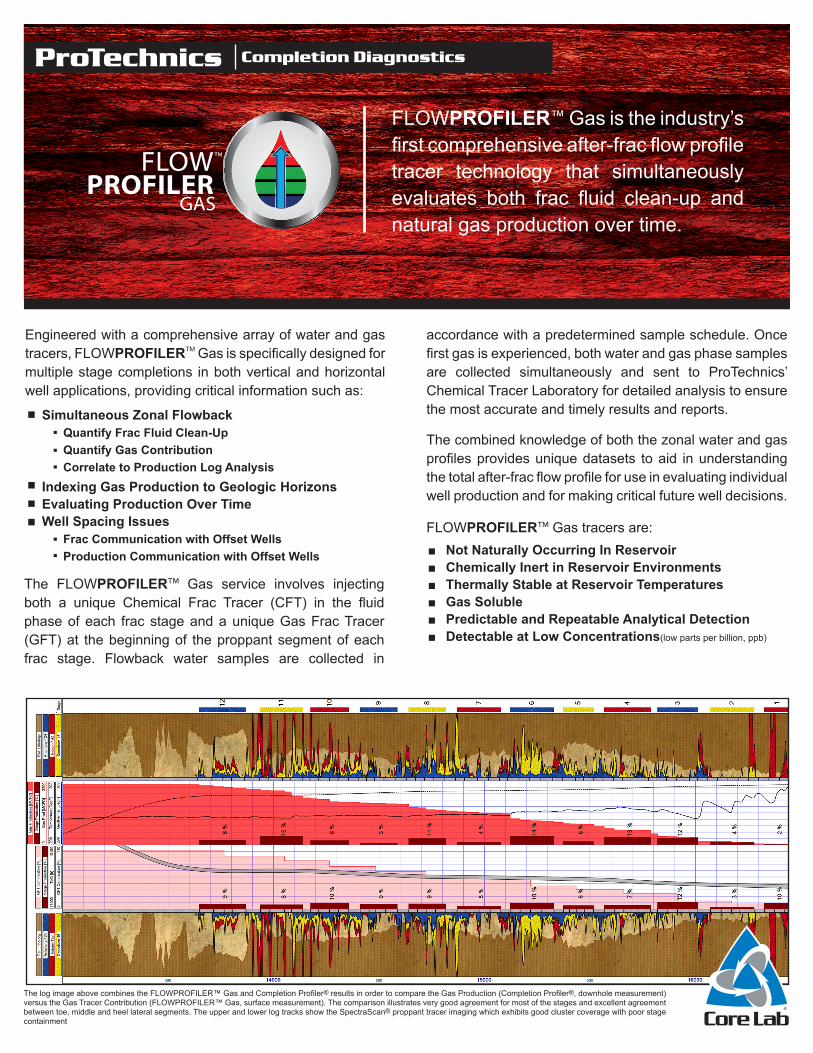
The log image above combines the FLOWPROFILER™ Gas and Completion Profiler® results in order to compare the Gas Production (Completion Profiler®, downhole measurement) versus the Gas Tracer Contribution (FLOWPROFILER™ Gas, surface measurement). The comparison illustrates very good agreement for most of the stages and excellent agreement between toe, middle and heel lateral segments. The upper and lower log tracks show the SpectraScan® proppant tracer imaging which exhibits good cluster coverage with poor stage containment
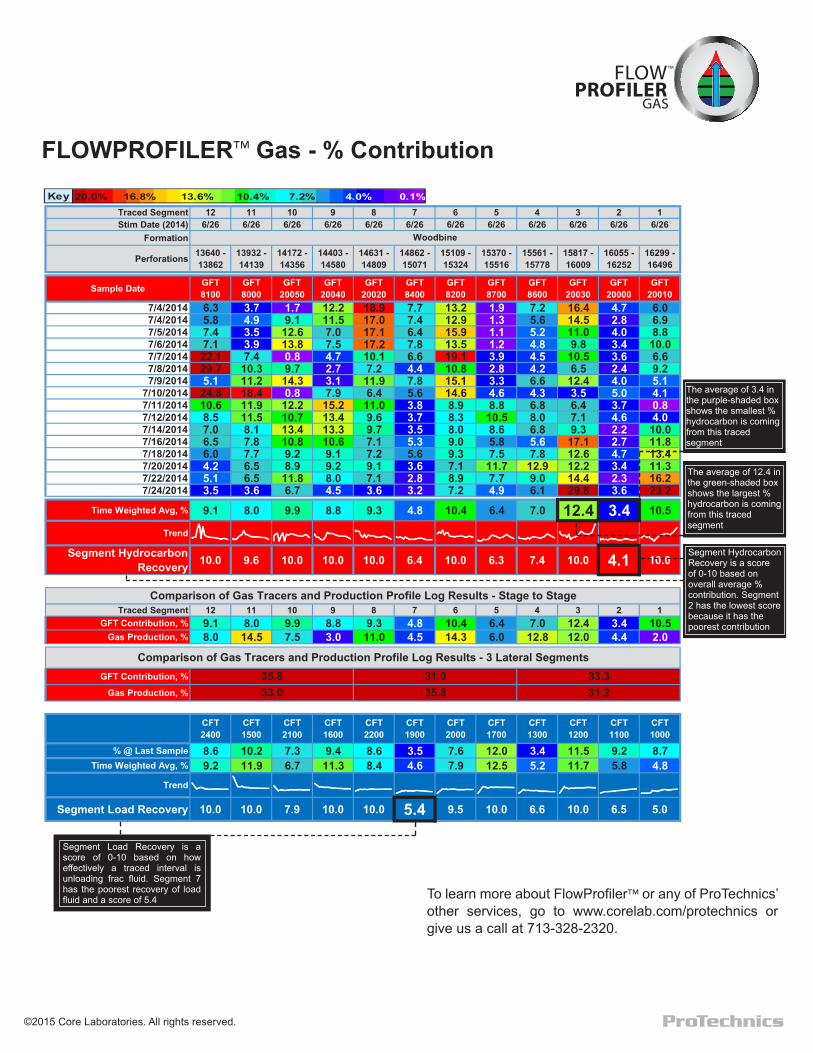
Traced Segment 12 11 10 9 8 7 6 5 4 3 2 1Stim Date (2014) 6/26 6/26 6/26 6/26 6/26 6/26 6/26 6/26 6/26 6/26 6/26 6/26
Formation
Perforations 13640 - 13862
13932 - 14139
14172 - 14356
14403 - 14580
14631 - 14809
14862 - 15071
15109 - 15324
15370 - 15516
15561 - 15778
15817 - 16009
16055 - 16252
16299 - 16496
Sample Date GFT 8100
GFT 8000
GFT 20050
GFT 20040
GFT 20020
GFT 8400
GFT 8200
GFT 8700
GFT 8600
GFT 20030
GFT 20000
GFT 20010
7/4/2014 6.3 3.7 1.7 12.2 18.9 7.7 13.2 1.9 7.2 16.4 4.7 6.07/4/2014 5.8 4.9 9.1 11.5 17.0 7.4 12.9 1.3 5.6 14.5 2.8 6.97/5/2014 7.4 3.5 12.6 7.0 17.1 6.4 15.9 1.1 5.2 11.0 4.0 8.87/6/2014 7.1 3.9 13.8 7.5 17.2 7.8 13.5 1.2 4.8 9.8 3.4 10.07/7/2014 22.1 7.4 0.8 4.7 10.1 6.6 19.1 3.9 4.5 10.5 3.6 6.67/8/2014 29.7 10.3 9.7 2.7 7.2 4.4 10.8 2.8 4.2 6.5 2.4 9.27/9/2014 5.1 11.2 14.3 3.1 11.9 7.8 15.1 3.3 6.6 12.4 4.0 5.1
7/10/2014 24.8 18.4 0.8 7.9 6.4 5.6 14.6 4.6 4.3 3.5 5.0 4.17/11/2014 10.6 11.9 12.2 15.2 11.0 3.8 8.9 8.8 6.8 6.4 3.7 0.87/12/2014 8.5 11.5 10.7 13.4 9.6 3.7 8.3 10.5 8.0 7.1 4.6 4.07/14/2014 7.0 8.1 13.4 13.3 9.7 3.5 8.0 8.6 6.8 9.3 2.2 10.07/16/2014 6.5 7.8 10.8 10.6 7.1 5.3 9.0 5.8 5.6 17.1 2.7 11.87/18/2014 6.0 7.7 9.2 9.1 7.2 5.6 9.3 7.5 7.8 12.6 4.7 13.47/20/2014 4.2 6.5 8.9 9.2 9.1 3.6 7.1 11.7 12.9 12.2 3.4 11.37/22/2014 5.1 6.5 11.8 8.0 7.1 2.8 8.9 7.7 9.0 14.4 2.3 16.27/24/2014 3.5 3.6 6.7 4.5 3.6 3.2 7.2 4.9 6.1 29.8 3.6 23.2
Time Weighted Avg, % 9.1 8.0 9.9 8.8 9.3 4.8 10.4 6.4 7.0 12.4 3.4 10.5
Trend
Segment Hydrocarbon Recovery 10.0 9.6 10.0 10.0 10.0 6.4 10.0 6.3 7.4 10.0 4.1 10.0
Traced Segment 12 11 10 9 8 7 6 5 4 3 2 1GFT Contribution, % 9.1 8.0 9.9 8.8 9.3 4.8 10.4 6.4 7.0 12.4 3.4 10.5
Gas Production, % 8.0 14.5 7.5 3.0 11.0 4.5 14.3 6.0 12.8 12.0 4.4 2.0
GFT Contribution, %
Gas Production, %
CFT 2400
CFT 1500
CFT 2100
CFT 1600
CFT 2200
CFT 1900
CFT 2000
CFT 1700
CFT 1300
CFT 1200
CFT 1100
CFT 1000
% @ Last Sample 8.6 10.2 7.3 9.4 8.6 3.5 7.6 12.0 3.4 11.5 9.2 8.7Time Weighted Avg, % 9.2 11.9 6.7 11.3 8.4 4.6 7.9 12.5 5.2 11.7 5.8 4.8
Trend
Segment Load Recovery 10.0 10.0 7.9 10.0 10.0 5.4 9.5 10.0 6.6 10.0 6.5 5.0
33.0 35.8 31.2
Woodbine
Comparison of Gas Tracers and Production Profile Log Results - Stage to Stage
Comparison of Gas Tracers and Production Profile Log Results - 3 Lateral Segments33.331.035.8
Key 20.0% 16.8% 13.6% 10.4% 7.2% 4.0% 0.1%
The average of 3.4 in the purple-shaded box shows the smallest % hydrocarbon is coming from this traced segment
The average of 12.4 in the green-shaded box shows the largest % hydrocarbon is coming from this traced segment


