

Danielle Garfinkel, FPwatch Communications Fellow, and the
ACTwatch group, PSI
2017 Annual CUGH Global Health Conference, April 8th
Protecting the Quality of AntimalarialsThe market penetration of non-quality assured artemisinin
combination therapies in eight African countries

Background
ACTwatch was a research project implemented by PSI and Ministries of Health in 13 countries
• 50 outlet surveys conducted between 2008-2017
• Outlet types: public and private hospitals/clinics/health centres, pharmacies, drug stores, retail shops, mobile drug sellers, community health workers
• Outlet surveys measure availability, price, and market share
What is Non Quality-Assured ACT?Not approved by 1)WHO Prequalification Programme; 2) European Medicines Agency; or 3) stringent regulatory authority
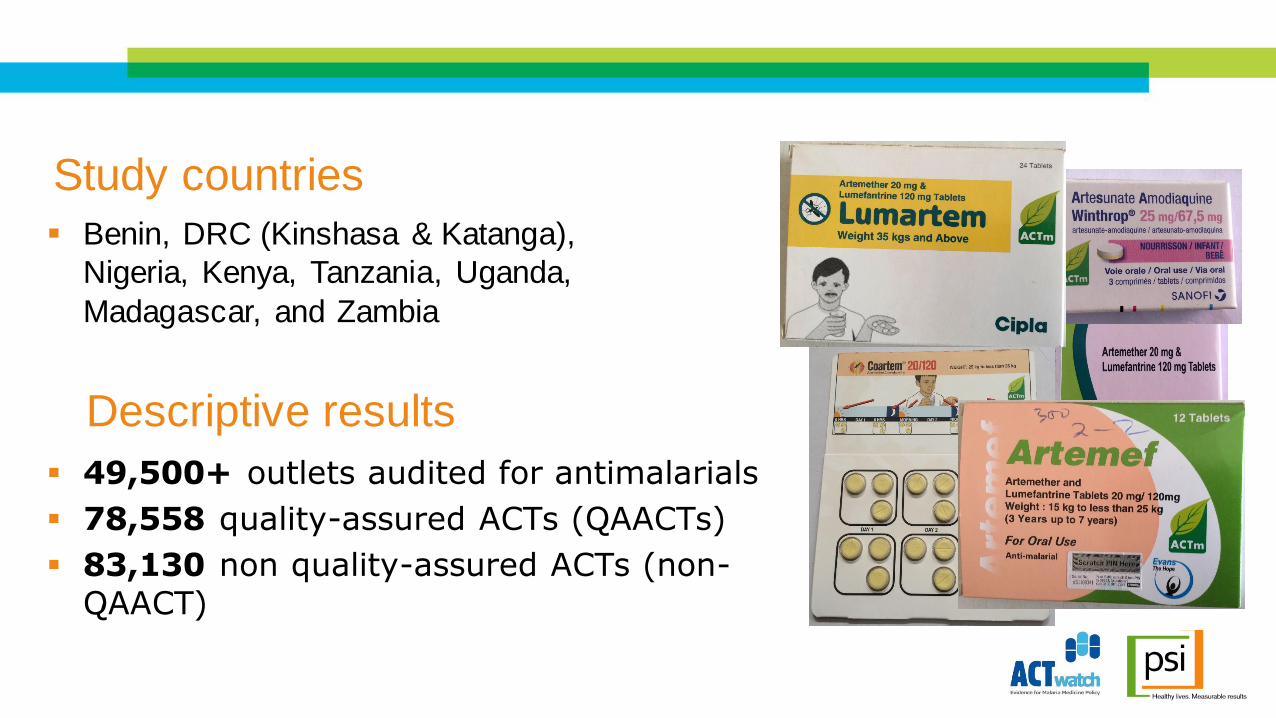
▪ 49,500+ outlets audited for antimalarials
▪ 78,558 quality-assured ACTs (QAACTs)
▪ 83,130 non quality-assured ACTs (non-QAACT)
Study countries
Descriptive results
▪ Benin, DRC (Kinshasa & Katanga),
Nigeria, Kenya, Tanzania, Uganda,
Madagascar, and Zambia

0%
20%
40%
60%
80%
100%
20
09
20
11
20
14
20
09
20
13
20
15
20
13
20
15
20
09
20
11
20
13
20
15
20
10
20
11
20
14
20
10
20
11
20
14
20
10
20
11
20
13
20
15
20
10
20
11
20
13
/14
20
15
20
09
20
11
20
14
Benin Kinshasa
DRC
Katanga
DRC
Nigeria Kenya Tanzania Uganda Madagascar Zambia
West & Central Africa East Africa Southern Africa
PE
RC
EN
T O
F O
UT
LE
TS
Private sector availability QA ACT Non QA ACT
Notes:
Significant difference in non-QA ACT availability between first and final survey year: * p<0.05 ** p<0.01 *** p<0.001
The whiskers indicate the interquartile range, or 25th and 75th percentile.
*** *** ***
0%
20%
40%
60%
80%
100%
20
09
20
11
20
14
20
09
20
13
20
15
20
13
20
15
20
09
20
11
20
13
20
15
20
10
20
11
20
14
20
10
20
11
20
14
20
10
20
11
20
13
20
15
20
10
20
11
20
13
/14
20
15
20
09
20
11
20
14
Benin Kinshasa
DRC
Katanga
DRC
Nigeria Kenya Tanzania Uganda Madagascar Zambia
West & Central Africa East Africa Southern Africa
PE
RC
EN
T O
F O
UT
LE
TS
Non QA
ACT: 21%
42%
Non QA
ACT: 23%
48%
Non QA ACT:
61% 83%

Private sector market shareQA ACT Non QA ACT
Notes:
Significant difference in non-QA ACT relative market share between first and final survey year: * p<0.05 ** p<0.01 *** p<0.001
Non-artemisinin therapy Artemisinin monotherapy
0%
20%
40%
60%
80%
100%
2009
2014
2009
2013
2015
2013
2015
2009
2011
2013
2015
2010
2011
2014
2010
2011
2014
2010
2011
2013
2015
2010
2011
2013
2015
2009
2011
2014
Benin Kinshasa Katanga Nigeria Kenya Tanzania Uganda Madagascar Zambia
West & Central Africa East Africa Southern Africa
Pe
rce
nt
pri
vate
an
ti-m
alar
ial
shar
e
*** ***

Additional findings
▪ Non-QAACT was typically more expensive than QA ACT
▪ Non-QAACT private market share tended to be highest among pharmacies and drug stores and in urban areas
▪ 180 unique manufacturers of non-QAACT, most in India and China

Opportunities for reducing non-QA product
penetration in the supply chain
ManufacturersNational Registration
SystemsWholesalers/
RetailersConsumers
• Support manufacturers to establish Good Manufacturing Processes
• Align national registration medicine lists to match drugs that meet global quality assurance standards
• Improve regulation
• Strengthen training and supervision
• Identifying logos• Implement
consumer product authentication technologies

Questions?
Comments?
Thank You! Learn more at www.ACTwatch.info


