
Protein Docking by the Underestimation of Free EnergyFunnels in the Space of Encounter ComplexesYang Shen1,2, Ioannis Ch. Paschalidis2,3,4, Pirooz Vakili2,3,5, Sandor Vajda1*
1 BioMolecular Engineering Research Center, Department of Biomedical Engineering, Boston University, Boston, Massachusetts, United States of America, 2 Center for
Information and Systems Engineering, Boston University, Boston, Massachusetts, United States of America, 3 Division of Systems Engineering, Boston University, Boston,
Massachusetts, United States of America, 4 Department of Electrical and Computer Engineering, Boston University, Boston, Massachusetts, United States of America,
5 Department of Mechanical Engineering, Boston University, Boston, Massachusetts, United States of America
Abstract
Similarly to protein folding, the association of two proteins is driven by a free energy funnel, determined by favorableinteractions in some neighborhood of the native state. We describe a docking method based on stochastic globalminimization of funnel-shaped energy functions in the space of rigid body motions (SE(3)) while accounting for flexibility ofthe interface side chains. The method, called semi-definite programming-based underestimation (SDU), employs a generalquadratic function to underestimate a set of local energy minima and uses the resulting underestimator to bias furthersampling. While SDU effectively minimizes functions with funnel-shaped basins, its application to docking in the rotationaland translational space SE(3) is not straightforward due to the geometry of that space. We introduce a strategy that usesseparate independent variables for side-chain optimization, center-to-center distance of the two proteins, and five angulardescriptors of the relative orientations of the molecules. The removal of the center-to-center distance turns out to vastlyimprove the efficiency of the search, because the five-dimensional space now exhibits a well-behaved energy surfacesuitable for underestimation. This algorithm explores the free energy surface spanned by encounter complexes thatcorrespond to local free energy minima and shows similarity to the model of macromolecular association that proceedsthrough a series of collisions. Results for standard protein docking benchmarks establish that in this space the free energylandscape is a funnel in a reasonably broad neighborhood of the native state and that the SDU strategy can generatedocking predictions with less than 5 A ligand interface Ca root-mean-square deviation while achieving an approximately 20-fold efficiency gain compared to Monte Carlo methods.
Citation: Shen Y, Paschalidis ICh, Vakili P, Vajda S (2008) Protein Docking by the Underestimation of Free Energy Funnels in the Space of EncounterComplexes. PLoS Comput Biol 4(10): e1000191. doi:10.1371/journal.pcbi.1000191
Editor: Matthew P. Jacobson, University of California San Francisco, United States of America
Received June 2, 2008; Accepted August 22, 2008; Published October 10, 2008
Copyright: � 2008 Shen et al. This is an open-access article distributed under the terms of the Creative Commons Attribution License, which permitsunrestricted use, distribution, and reproduction in any medium, provided the original author and source are credited.
Funding: This research was supported by National Institutes of Health/National Institute of General Medical Sciences grants R21-GM079396 and R01-GM061867.
Competing Interests: The authors have declared that no competing interests exist.
* E-mail: [email protected]
Introduction
Genomewide proteomics studies, primarily yeast two-hybrid
assays [1,2] and high-throughput mass spectrometry [3,4], provide
a growing list of putative protein–protein interactions, and
demonstrate that most if not all proteins have interacting partners
in the cell. Elucidating the atomic details of these complexes
requires further biochemical and structural information. While the
most complete structural characterization of a complex is provided
by X-ray crystallography, protein–protein hetero-complexes
constitute less than 2% of protein structures in the Protein Data
Bank (PDB) [5], and their number increases at a slow rate. In fact,
many biologically important interactions occur in weak, transient
complexes that will not be amenable to direct experimental
analysis, even when both proteins can be isolated and their
structures determined. Thus, there is substantial need for
computational docking methods that can determine the structure
of a complex from the separately solved structures of two
component proteins.
Based on the thermodynamic hypothesis, at fixed temperature
and pressure the Gibbs free energy of the macromolecule-solvent
system reaches its global minimum at the native state of the
complex. Thus, docking requires a computationally feasible free
energy evaluation model and an effective minimization algorithm.
It is expected that docking methods can utilize the rich set of
modeling tools developed for predicting the structures of folded
proteins. It has been established over the last two decades that the
energy landscape of a foldable protein resembles a many-
dimensional funnel with a free energy gradient toward the native
structure [6–9]. A number of papers suggest that the landscape
theory also applies to protein–protein association [10–12]. The
size of the funnel is determined by the length scales of the long-
range electrostatic and hydrophobic interactions and the geometry
of the proteins, and hence the funnel is restricted to a
neighborhood of the native complex [13]. There is a free energy
gradient toward the native state, but the funnel is rough, giving rise
to many local minima [14] that correspond to encounter
complexes, some of which may be visited along a particular
association pathway [15,16].
While homology modeling approaches play an important role in
protein structure prediction, most current docking methods are
based on direct optimization, and attempt to find the global
minimum of a function approximating the free energy of the
complex. According to the results of CAPRI (Comparative
Assessment of PRotein Interactions), a community-wide experi-
ment devoted to protein–protein docking [17–20], the optimiza-
PLoS Computational Biology | www.ploscompbiol.org 1 October 2008 | Volume 4 | Issue 10 | e1000191
tion involves either the systematic sampling of the discretized
rotational/translational space using Fast Fourier Transforms
[21,22] or geometric hashing [23], or it relies on Monte Carlo
(or Monte Carlo minimization) algorithms [24,25]. Both optimi-
zation methods are generic, i.e., they do not rely on any
assumption about the specific shape of the energy function to be
minimized.
The use of special optimization methods that account for the
funnel-like shape of the free energy function offers two potential
advantages. First, being designed for minimizing funnel-like
functions, such algorithms can be more efficient than generic
approaches. Second, the success of such algorithms will be a
stringent test of how well the funnel assumption describes the binding
free energy landscape. This second point is particularly interesting,
because protein–protein association occurs in the six-dimensional
(6D) space of translations and rotations, at least for the classes of
proteins whose backbones remain essentially unchanged upon
association (e.g., many enzymes interacting with their inhibitors).
Although the association is accompanied by conformational
changes, these can be considered auxiliary, and the shape of the
funnel can be studied over the entire conformational space. In
contrast, the free energy of protein folding is defined in a
substantially higher-dimensional space, and hence funnels can be
generally studied only along some reaction coordinates [6–9].
Minimization by UnderestimationA minimization approach which is specific to funnel-like
functions can be based on the concept of underestimation. The
existence of a funnel implies that the free energy can be locally
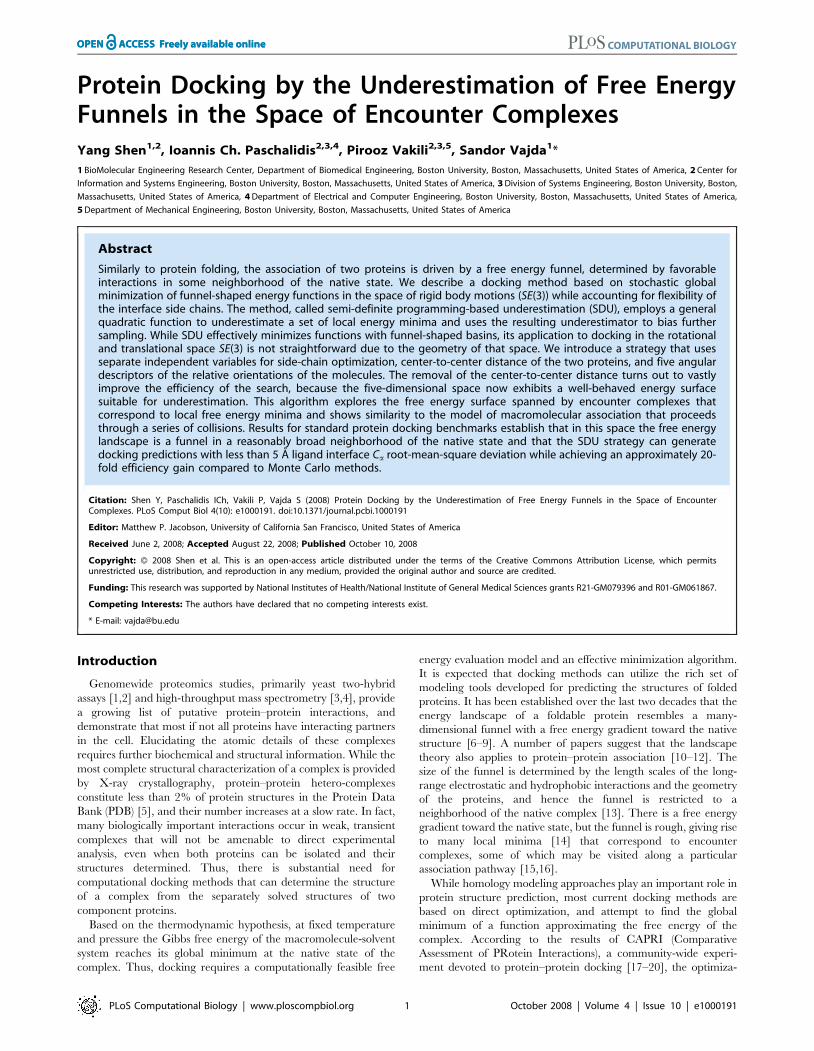
underestimated by a convex function (Figure 1). The original free
energy function is extremely rugged with a huge number of local
minima even in a small region of conformational space. Yet its
convex underestimator is much smoother and still captures the
overall funnel-like landscape, which provides a handle to free
energy minimization. The quality of minimization through
underestimation depends on the choice of underestimator
functions, the way they are constructed and utilized to locate the
global minimum, as well as how structured the free energy funnels
are in conformational space. The Convex Global Underestimation
(CGU) method [26] employed canonical quadratic functions as
underestimators without any cross-terms. In that case the under-
estimator, based on a set of local minima, can be constructed by
solving a Linear Programming (LP) problem. Uniformly distrib-
uted samples in the neighborhood of the underestimator’s global
minimum were then used to bias further sampling. The process
was iterated with the set of local minima being updated, and the
search region being reduced until certain convergence criteria are
satisfied. CGU has been a very promising method with various
applications in molecular structure prediction, including protein
folding [27] and docking small molecules to proteins [28].
However, its restriction of using canonical quadratic functions
limits its success in some cases [29], since the principal axes of the
free energy surface are not necessarily aligned with the canonical
coordinates. The performance further deteriorates as the dimen-
sionality of the search space increases. We have used theoretical
analysis to show and simple test problems to demonstrate that this
restriction can lead to incorrect convergence [30].
Motivated by the potential advantages of underestimation and
practical shortcomings of the CGU algorithm, we have recently
extended the method using general quadratic underestimators and
introduced biased sampling guided by the underestimator [30,31].
Since the tightest underestimator in this class is obtained by solving
a semi-definite programming problem, the method is termed SDU
(Semi-Definite programming-based Underestimation). Semi-defi-
nite programming is computationally more demanding than the
linear programming (still solvable in polynomial-time though) used
in the CGU method. However, SDU typically requires fewer
iterations and substantially improves optimization performance.
The SDU method starts from a set of K local minima x1, …, xK
of a funnel-like function f(x): Rn?R within a given region B of the
search space. Throughout the course of the algorithm we maintain
a set L of local minima in the search region; initially
L~ x1, . . . , xK� �
. To capture the global funnel-like structure of
f(x) within B we construct a smooth (convex) quadratic function
U(x) = x9Qx+b9x+c, where Q is a positive semi-definite matrix,
b[Rn, c is a scalar, and prime denotes transpose, such that U(x)
underestimates f(x) at all local minima in L, i.e., U(xi)#f(xi) for all
i = {1, 2, …, K}. The tightest possible underestimator (with an L1
Figure 1. Funnel-like function and underestimator at a set oflocal minima indicated by small squares.doi:10.1371/journal.pcbi.1000191.g001
Author Summary
Protein–protein interactions play a central role in variousaspects of the structural and functional organization of thecell, and their elucidation is crucial for a better under-standing of processes such as metabolic control, signaltransduction, and gene regulation. Genomewide proteo-mics studies, primarily yeast two-hybrid assays, willprovide an increasing list of interacting proteins, but onlya small fraction of the potential complexes will beamenable to direct experimental analysis. Thus, it isimportant to develop computational docking methodsthat can elucidate the details of specific interactions at theatomic level. Protein–protein docking generally starts witha rigid body search that generates a large number ofdocked conformations with good shape, electrostatic, andchemical complementarity. The conformations are clus-tered to obtain a manageable number of models, but thecurrent methods are unable to select the most likelystructure among these models. Here we describe arefinement algorithm that, applied to the individualclusters, improves the quality of the models. The bettermodels are suitable for higher-accuracy energy calculation,thereby increasing the chances that near-native structurescan be identified, and thus the refinement increases thereliability of the entire docking algorithm.
Protein Docking by Underestimation
PLoS Computational Biology | www.ploscompbiol.org 2 October 2008 | Volume 4 | Issue 10 | e1000191
norm metric) can be found by solving a semi-definite program-
ming problem [30]. U(x) is a general convex quadratic function.
The underestimator U is used to guide further sampling. The
minimum of U, denoted by xP and referred to as the predictive
conformation, is in an energetically favorable region, and hence a new
conformation can be generated by local minimization starting from
xP. Additional conformations are obtained by local minimization
with randomly generated starting points such that points in the
vicinity of xP have a higher probability of being selected than points
further away. To that end, we simply sample within B using a density
function shaped as 2U. The set L is being updated by adding these
newly obtained conformations while removing unfavorable (i.e.,
higher energy) conformations, and the search area B is being
reduced to a neighborhood of xP. Using the updated conformations
in L we repeat the underestimation step and the whole process is
being iterated until a convergence criterion is met.
The SDU algorithm has a number of favorable properties when
applied to funnel-shaped functions. Theoretical analysis shows
[30] that xP converges in probability to the global minimum x* of
the funnel-like function f as the number of samples K grows. When
applied to test functions resembling the funnel-like free energy
functions, SDU has been shown outperforming CGU and a
simulated annealing algorithm which adaptively tunes its param-
eters, with much less required function evaluations and much
higher success rates [30].
Docking by Semi-Definite UnderestimationThe main goal of this paper is to develop and test docking
methods that use the SDU algorithm in order to find the global
minimum of a funnel-like function approximating the free energy
over regions of the conformational space. Over the last few years
we have developed a multistage docking method that starts with
rigid body search based on Fast Fourier Transform (FFT), selects
and clusters 1000 to 2000 low energy docked structures, and
retains the 10 to 30 largest clusters for further processing [32]. The
conformational space is decomposed into separate regions defined
by the clusters, where free energy attraction basins are believed to
exist and the free energy landscape is assumed to be funnel-like.
Then SDU is called upon to locate the global minimum within
each region, by utilizing such funnel-like behavior.
As will be shown, in spite of the success of SDU as an optimizer
for functions with funnel-shaped basins, its application to docking
turned out to be far from straightforward. Although the method
yields meaningful moves in either translational or rotational
subspaces [30], minimization in the full 6D space of rigid body
motions poses a challenge. This difficulty is well known in the
robotics literature [33]. The Euclidean group SE(3), which is the
semidirect product of R3 (translations) and the special orthogonal
Euclidean group SO(3) (rotations), is a nonlinear manifold and its
parametrization is critical to any optimization procedure [33]. In
particular, we will show that the funnel-like shape of the free
energy surface is affected by the parameterization of the search
space, and that underestimation tends to fail unless appropriate
parameters are selected.
We will describe two implementations of the SDU method: (i)
SDU1, a cyclic coordinate descent strategy where rotational and
translational moves alternate; and (ii) SDU2, a 5D strategy in
which the distance of the two proteins is separately optimized and
the SDU-driven search is performed in a lower dimensional space
defined by 5 angular coordinates. Since the most energetically
favorable distances occur when the two proteins are in contact but
do not overlap, this strategy explores the free energy surface
spanned by encounter complexes [15]. Results will show that the
methods discover broad energy funnels, generate high quality
docking predictions, and produce a substantial efficiency gain
compared to Monte Carlo methods.
The comparison with Monte Carlo methods is based on our
earlier preliminary work [34] where we have tested a method
similar to SDU1 against a 10-protein set using reduced Go-type
potentials. Even with these relatively smooth potentials, underes-
timation in the full 6D space has not been effective, and we had to
rely on optimizing in each (rotational or translational) subspace
separately. In the present paper, we show that the SDU1 strategy
is effective against a larger benchmark set using much more
refined energy potentials. However, our main contribution is the
introduction of SDU2 which is more effective and improves
efficiency by a factor of 10 compared to SDU1. In addition, SDU2
provides interesting biophysical insights with its resemblance to
docking by repeated micro-collisions.
Results/Discussion
Development of SDU-Based Docking AlgorithmsTo define the docking problem we fix the position and orientation
of the first (receptor) protein. The six-dimensional vector x specifies
the position and orientation of the second (ligand) protein. The
variables s account for the side chain conformations in both proteins,
and DG(x,s) denotes the free energy function. The minimization of
DG(x,s) with respect to s is restricted to the side chains in the
interface and is carried out by local methods. We define
DG*(x) =DG(x,s*), where s* is an optimal solution; then the protein
docking problem is finding the lowest minimum of DG*(x) in the
region defined by the cluster, where x belongs to the space of rigid
body motions, i.e., the Euclidean group SE(3). As described before,
the parameterization of SE(3) is critical for optimization purposes,
and hence we first describe our results concerning the parameter-
ization of the search space.
The space SE(3) is the semidirect product of R3 (translations)
and SO(3) (rotations). The rotation group SO(3) is a 3-dimensional
Lie group consisting of rotation matrices, i.e, SO 3ð Þ~R R[R3|3���
, RR9 = I, det(R) = 1. The Lie algebra of SO(3),
denoted by so(3), may be represented by the real skew-symmetric
matrices
V~
0 {v3 v2
v3 0 {v1
{v2 v1 0
264
375,
where v~ v1,v2,v3ð Þ[R3. It is well-known that the one-
parameter subgroups of SO(3), i.e., R tð Þ~eVt V[so 3ð Þ, t[Rð Þ are
geodesics [33,35,36], i.e., the shortest paths between two points on
SO(3). Moreover, for R0, R1MSO(3), V= log(R09R1)Mso(3) and the
distance between R0 and R1 can be defined by r(R0,R1) =
Ilog(R09R1)I = Iv12v0I. This distance is a natural Riemannian
metric on SO(3), i.e., it is bi-invariant with respect to the actions of
the group (rotations). The exponential map from so(3) to SO(3)
defined by V R R0eV is a local diffeomorphism, i.e., there exist an
open neighborhood of 0Mso(3) and an open neighborhood of
R0MSO(3) and an invertible, surjective, and smooth map from one
neighborhood to the other whose inverse is also smooth. The local
diffeomorphism induces a coordinate chart in a neighborhood of
R0 that is known as exponential coordinate system. Given the
definition of so(3) this coordinate system can be parameterized by
v~ v1,v2,v3ð Þ[R3.
Given the favorable properties of SO(3) (more generally SO(n))
such as the existence of a natural bi-invariant metric and, in
particular, the simplicity of determining the geodesics of the
Protein Docking by Underestimation
PLoS Computational Biology | www.ploscompbiol.org 3 October 2008 | Volume 4 | Issue 10 | e1000191
manifold, the standard gradient based optimization algorithms on
Rn can be generalized for optimization on SO(n) [35]. However,
generalization to the entire SE(3) is more difficult [33,36].
Although SE(3) is also Lie group, its one-parameter subgroups
are no longer geodesics. Moreover, SE(3) does not admit a natural
(bi-invariant) Riemannian metric while its subspaces SO(3) and R3
do [33,36]. Attempting to implement SDU to SE(3) by
simultaneous translational and rotational optimization, we have
generally failed to construct useful underestimators. We have,
however, found two strategies that were able to overcome this
problem.
SDU1: Cyclic coordinate descent. A natural search strategy
in SE(3) is to alternate between optimizing the free energy in SO(3)
and in R3 by a series of rotational and translational adjustments.
As will be further discussed, the major disadvantage of this
approach is that samples in one subspace cannot be reused in the
other subspace, resulting in inefficient search.
SDU2: 5D search in the space of encounter
complexes. The distance between the two proteins is
separately optimized along the center-to-center vector, and the
SDU search space is reduced to S26SO(3), where S2 denotes the
surface of the unit sphere in R3. The receptor is fixed, with its
center of mass placed at the origin of the coordinate system, and
y[R3 denotes the position of the center of mass of the ligand. In
spherical coordinates y can be represented by (r,h,Q), where
r = IyI, h is the azimuth angle between the projection of y on the
xy-plane and the x-axis (longitude, 0#h,2p), and Q is the zenith
angle between the z-axis and the vector y (colatitude, 0#Q#p).
The corresponding exponential coordinates are s = (2sin h?Q, cos
h?Q). The rotation of the ligand is described by the exponential
coordinates v[R3 in SO(3).
In this coordinate system the free energy function is DG(r,s,v,s),
where s describes the side chain conformations. Since s and r,
respectively, are determined by local minimization and by a line
search along the vectors connecting the centers of mass, by SDU
we minimize the function
DG� s,vð Þ~ minr,s
DG r,s,v,sð Þ,
in the (s,v)-space. Thus, the SDU2 algorithm uses separate
independent variables for side-chain optimization, center-to-center
distance of the two proteins, and five angular descriptors of the
relative orientations of the molecules. As will be shown, the
removal of the center-to-center distance turns out to vastly
improve the efficiency of the search, since the 5-dimensional space
now exhibits a well-behaved energy surface suitable for underes-
timation. In addition, successive underestimators obtained during
the course of the SDU2 algorithm can reuse the local minima
obtained in the earlier steps, thereby reducing the number of
required function evaluations. Moreover, SDU2 can use all
conformations contained in the cluster to be refined, while
SDU1 may use very few (or none) of these points as they may
not lie in the subspaces explored. In fact, we have tested SDU1 for
a 10-protein set with reduced energy potentials and compared its
performance with a standard Monte Carlo method in [34]. SDU1
showed a modest speed-up factor of 2 compared with the Monte
Carlo method, partly due to the issues mentioned above.
It is important that for any rotational state the energy is separately
minimized along the vector connecting the centers of the two
molecules. Since the lowest energy is generally attained at a distance
that eliminates all atomic overlaps but retains some of the favorable
van der Waals interactions, after minimization the two proteins are
in contact with each other. Based on this property, the SDU2
algorithm essentially samples encounter complexes [15], resulting in
meaningful energy values and efficient sampling. Simple arguments
show that this parameterization is more natural than the sampling in
the space of translations and rotations. In fact, the SDU2 strategy
shows strong similarity to the model of macromolecular association
in which translational diffusion brings the two proteins to a collision.
Unless the enthalpy change of favorable interactions compensates for
the free energy increase due to the loss of entropy, the proteins
separate, rotate, and collide again. Thus, the conformational search
proceeds in a series of ‘‘micro-collisions’’, each resulting in an
encounter complex [37].
Test Results for SDU-Based Docking AlgorithmsThe SDU1 and SDU2 algorithms were tested on the protein
pairs given in protein docking benchmark sets [38,39] that contain
enzyme–inhibitor, antigen–antibody, and ‘‘other’’ types of com-
plexes, using the independently determined (unbound) structures
of the component proteins. The algorithms were used to refine the
top (most populated) clusters of docked structures generated by the
rigid body docking program PIPER [22]. We consider the 10
largest clusters for enzyme–inhibitor complexes, and 30 clusters for
antigen–antibody and ‘‘other’’ complexes. Table 1 shows results
both from the rigid body docking and the SDU-based refinement
procedures for all three types of complexes, each defined by its
Protein Data Bank (PDB) code [5] in Column 1 of Table 1. We
emphasize that for most complexes we docked the unbound
(separately crystallized) protein structures rather than their bound
conformations obtained by separating the complex. The excep-
tions are mostly a few antigen–antibody complexes for which no
separate antibody structures were available and hence were taken
from the complex. However, even in these cases we used the
separately crystallized structure of the antigen as given in the
benchmark sets [38,39]. PDB codes for these ‘‘semi-bound’’
complexes are shown in bold italic fonts in Table 1.
Columns 2–4 of Table 1 describe the docked complex structures
generated by the rigid body docking [22] before any refinement.
As described in the Methods, the PIPER docking program
evaluates the energy for billions of docked conformations. We
retain the 1000 best scoring structures, and cluster them using the
pairwise RMSD as the distance measure and an optimally selected
clustering radius. We have observed that the near-native structures
tend to be in one of the largest clusters, and hence rank the clusters
on the basis of their size. In fact, calculated for the rigid protein
structures, the energy function is approximate, and better
discrimination of the native structures can be achieved by focusing
on the large clusters. The properties shown in Table 1 are the
number of near-native conformations (or ‘‘hits’’ with less than 10
A ligand interface Ca RMSD) among the 1000 best scoring
structures retained from the PIPER results, the Root Mean Square
deviation (RMSD) between the native ligand structure and the
docked structure at the center of the first cluster that includes a
near-native conformation, and the rank of the particular cluster
based on cluster size. Results are fairly good for enzyme–inhibitor
complexes, as the 1000 structures, on the average, include over
200 hits, and the average RMSD is less than 5 A between the
native structure and the center of one of the three largest clusters.
Although PIPER yields almost 200 hits for the ‘‘other’’ types of
complexes, discrimination by cluster size is more difficult, and
retaining the top 6 clusters results in 6.16 A average RMSD. For
antibody-antigen complexes PIPER generates much fewer hits,
and on the average we have to retain 15 clusters to have a near-
native structure in them.
The next 6 columns in Table 1 show the results for the SDU1
and SDU2 algorithms, in each case listing the RMSD for the
Protein Docking by Underestimation
PLoS Computational Biology | www.ploscompbiol.org 4 October 2008 | Volume 4 | Issue 10 | e1000191

Table 1. Docking and refinement results.
Complexa PIPER SDU1 SDU2 ZDOCK+RDOCK
Hits RMSD Rank RMSD Rank n RMSD Rank n RMSD Rank
Enzyme–Inhibitor Complexes
1ACB 632 6.11 1 0.86 2 1425 2.78 3 93.8 5.66 1
1AVW 81 3.87 4 3.31 1 1381 3.54 2 90.0 2.50 1
1AVX 193 3.27 1 2.57 1 1393 4.18 1 91.2 2.62 39
1BRC 375 8.60 2 9.97 2 1431 4.50 2 98.5 8.92 1
1BVN 443 6.65 1 5.95 2 1498 1.11 1 81.7 1.78 8
1CGI 477 8.54 1 7.77 3 1425 2.40 3 100.0 9.03 16
1CHO 510 1.10 1 2.08 1 1475 2.64 2 91.4 5.25 1
1CSE 45 2.15 5 3.03 2 1340 5.99 2 97.3 2.83 6
1DFJ 30 6.59 4 3.80 2 1378 7.20 1 97.6 5.46 1
1E6E 55 6.88 9 4.85 1 1506 5.12 3 84.7 5.39 3
1EAW 114 2.02 3 3.03 2 1442 3.96 3 97.1 3.21 30
1MAH 171 1.80 3 1.37 1 1413 1.44 3 91.2 2.48 6
1PPE 605 4.24 1 2.42 1 1435 2.34 1 96.7 2.58 1
1STF 35 2.12 8 1.31 1 1303 0.80 1 92.7 1.70 4
1TGS 365 4.01 1 5.37 1 1343 6.02 1 98.0 6.18 158
1TMQ 25 3.03 9 1.01 2 1420 3.09 4 89.3 4.99 13
1UDI 217 4.37 1 1.73 2 1401 2.79 1 100.8 2.42 18
1UGH 97 4.75 3 4.86 1 1386 4.75 1 92.0 3.63 1
2MTA 161 5.30 1 6.47 3 1478 5.25 6 86.7 6.54 428
2PTC 322 7.49 1 7.37 4 1306 7.88 3 98.0 4.72 68
2SIC 76 7.76 4 1.93 1 1368 2.62 1 94.5 1.99 2
2SNI 103 8.56 2 8.71 1 1386 9.33 1 99.3 7.08 9
2TEC 235 1.89 1 1.56 1 1375 1.69 1 91.7 4.85 1
4HTC 73 5.21 7 4.82 3 1436 1.79 1 85.8 1.41 2
7CEI 178 7.68 1 6.61 3 1345 6.62 5 97.5 6.15 1
Average 224.7 4.96 3.0 4.11 1.76 1403 3.99 2.12 93.5 4.37 32.8
Antigen–Antibody Complexes
1AHW 131 5.94 3 5.16 13 1163 2.83 4 98.7 3.08 2
1BVK 41 5.66 28 9.84 8 1249 5.80 29 96.0 6.34 435
1EO8 25 6.15 29 {11.60} 30 1194 2.50 6 97.3 N/A N/A
1FBI 32 6.49 20 9.47 14 1212 3.43 17 92.7 7.97 266
1IAI 35 7.11 4 7.97 2 1210 6.20 4 96.7 7.90 212
1MEL 112 5.90 2 6.34 7 1239 2.65 4 100.0 3.52 103
1MLC 16 5.86 26 8.96 22 1242 7.57 19 93.3 9.50 47
1QFU 54 4.20 3 7.32 24 1091 2.54 22 90.0 2.97 96
1WEJ 26 3.65 19 5.45 19 1257 1.89 1 90.0 2.41 6
2JEL 136 6.74 4 5.40 6 1246 4.74 10 99.3 6.84 142
2VIR 14 8.90 25 8.50 28 1223 {11.12} 26 95.3 N/A N/A
Average 56.6 6.05 14.8 7.82 15.7 1211 4.66 12.7 93.4 5.61 145.4
Other Complexes
1A0O 193 6.01 2 6.91 1 1230 8.45 1 89.3 3.27 50
1ATN 272 6.57 1 6.38 4 1046 0.87 2 83.3 2.72 16
1GLA 396 8.38 1 5.65 3 1366 3.03 4 84.3 2.29 28
1MDA 60 7.59 15 {12.00} 13 1179 8.19 22 92.0 N/A N/A
1SPB 252 3.41 3 1.80 1 1162 1.40 1 90.7 1.31 1
1WQ1 143 8.44 3 4.99 9 1164 10.00 1 93.3 4.88 656
2BTF 140 0.81 2 0.91 1 1165 1.68 1 86.0 2.50 1
Protein Docking by Underestimation
PLoS Computational Biology | www.ploscompbiol.org 5 October 2008 | Volume 4 | Issue 10 | e1000191

lowest energy conformation in the first cluster that includes a near-
native structure, the rank of the cluster, and the average number n
of function evaluations. It is important to note that after the SDU
refinement the clusters are ranked based on the energies of the
SDU solutions rather than on cluster size. For comparison we also
generated 2000 conformations (based on the original protocol) for
each complex using version 2.3 of the rigid body docking program
ZDOCK [21], and refined the structures using RDOCK [40],
which performs local energy minimization. The last two columns
of Table 1 show the RMSD of the first near-native structure found
and its rank based on the RDOCK energy function.
For enzyme–inhibitor complexes both SDU1 and SDU2 give
excellent results. On the average, the RMSD is reduced by almost
1 A and the average rank is around 2. As the overall performance
measure of the refinement we consider the number of complexes
that have at least one prediction with less than 5 A ligand interface
Ca RMSD from the native structure in the top 5 clusters. Such
predictions would be termed ‘‘5 A models’’ later for simplicity. As
noted, the clusters of PIPER-generated structures are ranked
based on their size (i.e., the number of structures). However, after
the refinement the clusters are ranked based on the energy of their
lowest energy structures. Among the PIPER-generated structures
the top 5 clusters include less than 5 A ligand interface RMSD
predictions for only 11 of the 25 enzyme–inhibitor complexes. As
shown in Table 1, both SDU1 and SDU2 increase this number to
17, i.e., a more than 50% improvement relative to the PIPER
results. Notice that the 5 lowest energy predictions obtained by the
ZDOCK/RDOCK procedure include 5 A models only for 7
complexes. However, from the ZDOCK/RDOCK runs we retain
low energy models, whereas the results provided by SDU1 and
SDU2 are low energy clusters, and ranking clusters rather than
individual structures generally removes some false positives, i.e.,
conformations that have low energy but are far from the native.
It is well known that antigen–antibody and ‘‘other’’ complexes
are more difficult to predict than enzyme–inhibitor complexes
[20]. For antibody-antigen pairs only the refinement by SDU2
improves the PIPER results. Although both the RMSD and the
average rank of the first near-native cluster are reduced, at 12.7
the latter remains high (Table 1). Similarly, for the complexes in
the ‘‘other’’ category only SDU2 improves both the RMSD and
the rank. Even SDU2 yields only a total of seven 5 A models in the
top five clusters for antibody–antigen and ‘‘other’’ types of
complexes. This result is somewhat disappointing, but note that
docking by ZDOCK and refining by RDOCK leads to 5 A models
only for three complexes, and no near-native solution is found in
four cases.
Calculated Free Energy SurfacesFigure 2 shows the RMSD vs. calculated free energy for the 25
enzyme–inhibitor complexes. Again we show PDB codes for the
‘‘semi-bound’’ complexes in bold italic fonts. Each point represents
a structure sampled in the process of refining the 10 largest clusters
using the SDU2 algorithm. The encircled blue asterisk indicates
the native structure and the first hit is shown as a red square. In
spite of the one-dimensional representation of the energy function
defined in the 6D rotational and translational space, the figure
demonstrates the multi-funnel behavior over a relatively broad
region (within 20 A RMSD) of the native state. For most
complexes the figure shows a well defined deep funnel within 5 A
RMSD from the native structure. According to Table 1, for 12 of
the 25 complexes (including 5 ‘‘semi-bound’’ cases), this funnel is
deepest among the 10 clusters sampled. For example, for 4HTC
the near-native cluster is the 7th largest, but it is energetically the
most favorable after refinement. For the remaining 13 complexes,
clusters farther from the native structure yield the deepest funnels,
resulting in false positive predictions. One of the worst behaviors
can be observed for 2PTC with the first near-native cluster ranked
4, and Figure 2 shows a number of deep non-native funnels.
However, on the average, one of the 3 deepest funnels is near-
native (Table 1). This also shows the power of heuristic
combination of entropic and enthalpic measurement, i.e., cluster
size as a filter and refined cluster depth as ranking parameter.
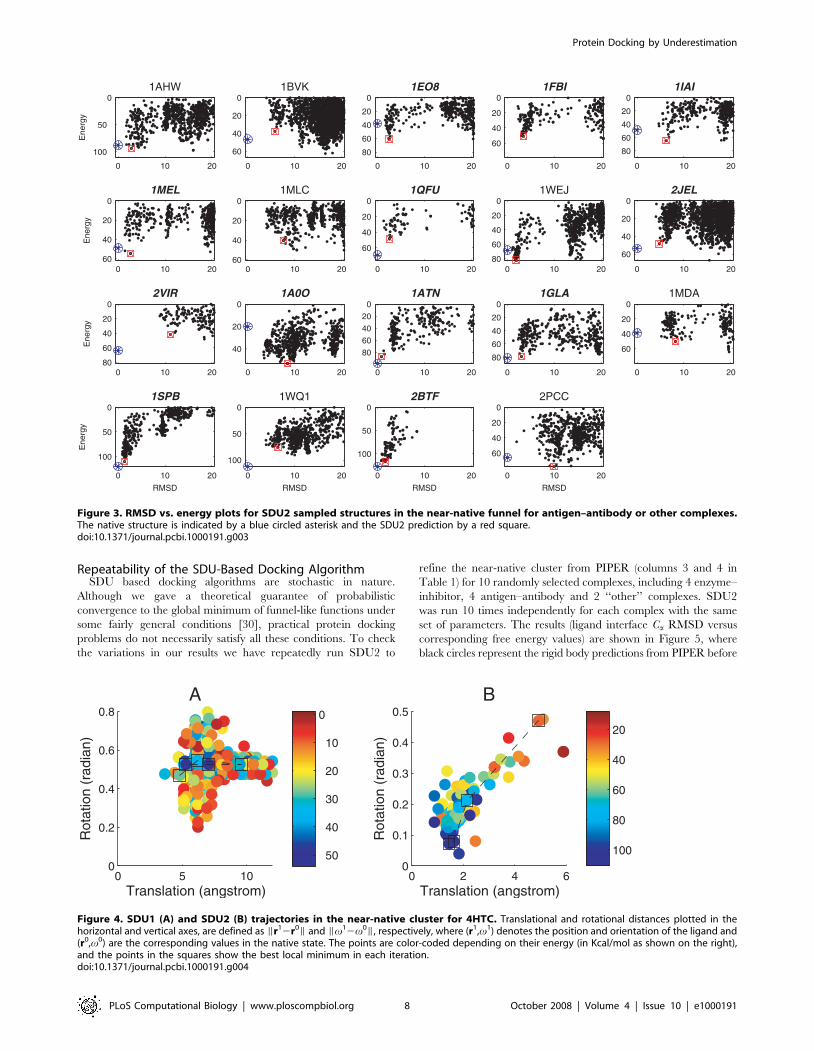
Figure 3 shows the RMSD vs. calculated free energy for the
antigen–antibody and ‘‘other’’ complexes, sampled in the
refinement of the 30 largest clusters by SDU2. All but 1SPB and
2BTF have multiple funnels, and the funnels are further from the
native state than for enzyme–inhibitor pairs, demonstrating the
well-known difficulty of estimating free energy using simple
models, particularly for antigen–antibody complexes. Adjusting
the conformation of interface side chains only by local minimi-
zation and keeping the backbone rigid also limits the accuracy of
free energy calculation.
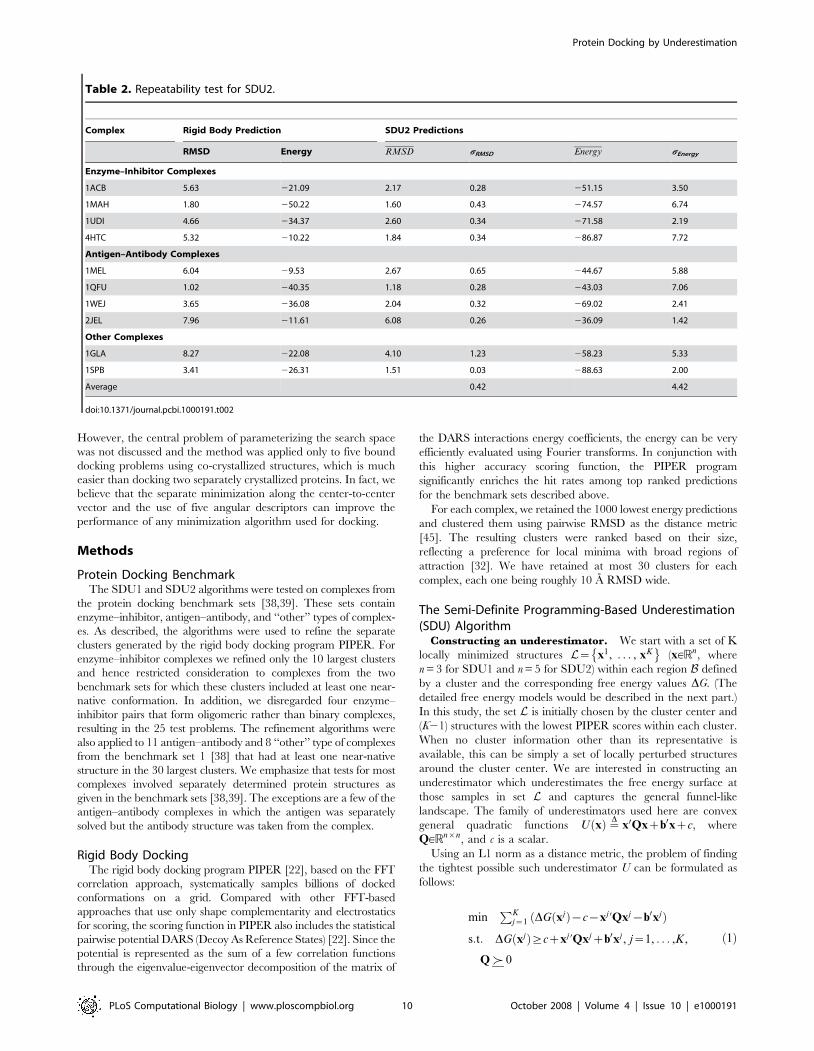
The Effect of Space Selection on Search EfficiencyAs shown in Table 1, the SDU2 strategy is much more efficient
than SDU1, and also provides substantially better results for the
more difficult problem of docking antigen–antibody and ‘‘other’’
complexes. These differences are demonstrated in Figure 4A and
4B that show, for the near-native cluster of the complex 4HTC,
the conformations sampled and minimized by each algorithm.
The horizontal and vertical axes, respectively, represent transla-
tional and rotational distances between each sampled ligand
conformation and the one in the native structure, the latter placed
at the origin of this coordinate system. The rotational distance
here is defined as the length of the minimum geodesic (i.e., the
minimum rotation in radian) between two rotations [36]. As
discussed earlier, this distance between R0 and R1 can be defined
by r(R0,R1) = Ilog(R09R1)I = Iv12v0I. The points are color-
coded according to their energies, from low (blue) to high (red)
energy structures.
As shown in Figure 4A, the separate treatment of translational
and rotational subspaces in the SDU1 algorithm is highly
inefficient, resulting in the sampling of many conformations with
relatively high energies. Although all energy values shown are
Complexa PIPER SDU1 SDU2 ZDOCK+RDOCK
Hits RMSD Rank RMSD Rank n RMSD Rank n RMSD Rank
2PCC 59 8.12 16 7.78 26 1168 9.96 1 93.6 N/A N/A
Average 189.3 6.16 5.4 5.80 7.2 1185 5.44 4.1 89.1 5.62 125.3
aPDB codes for the bound-unbound docking problems are shown in italics. All others are unbound-unbound cases.doi:10.1371/journal.pcbi.1000191.t001
Table 1.cont.
Protein Docking by Underestimation
PLoS Computational Biology | www.ploscompbiol.org 6 October 2008 | Volume 4 | Issue 10 | e1000191

obtained by local minimization, the latter is unable to reduce the
energy if the two proteins are too far from each other, which
frequently occurs with the SDU1 algorithm. In addition, as
indicated by the parallel lines, very similar translational regions are
re-sampled at slightly different rotational coordinates, and vice
versa. In contrast, as shown in Figure 4B, the SDU2 algorithm
smoothly and efficiently descends toward the bottom of the free
energy funnel. Based on the ranges of sampled free energy values,
SDU2 sampled much lower energy regions compared to SDU1.
Since the search is restricted to biophysically meaningful
encounter complexes, the more consistent energy values facilitate
the construction of better underestimators during the search.
According to Figure 4B, for SDU2 there is a clear trend that
structures closer to the native complex generally have lower
energies, resulting in a deep and broad free energy funnel in this
space. The existence of such free energy funnels is much less
obvious, even in each separate subspace, when sampled by the
SDU1 algorithm (Figure 4A).
In test docking problems even the slower SDU1 algorithm
outperformed a standard Monte Carlo method by reducing the
number of function evaluations by a factor of two [34]. As shown
in Table 1, SDU2 further reduces the computational costs by a
factor of 11 to 15, depending on the type of complex. Since most of
the computational time is spent in energy evaluations, the
computational gain of SDU2 over SDU1 is more than a factor
of 10, and we estimate that SDU2 achieves more than 20-fold
efficiency gain compared to Monte Carlo methods. We tested our
algorithms on a 128-node biowulf cluster (IBM eServer6Series).
Each node contains dual 1 GHz PIII processors with 2 GB
memory. A typical refinement by SDU2 for each PIPER-
generated cluster would take 2 to 6 processor-hours. The running
time varies with the protein complex size (especially the interface
size) and the number of iterations before convergence. Notice that
on the average SDU2 samples only about 100 encounter structures
for each cluster. No particular efforts have been made to
accelerate either the interface side-chain search or the line search
to determine the center-to-center distance. The CPU times can be
compared to those reported for a server [41] based on the
RosettaDock algorithm [42]. The server performs 1000 indepen-
dent Monte Carlo simulations within 30 A Ca RMSD of a starting
structure, as described in the RosettaDock protocol [42]. A typical
run requires about 65 processor-hours.
0 5 10 15 20
60
40
20
01ACB
Ene
rgy
0 5 10 15 20
60
40
20
01AVW
0 5 10 15 20
60
40
20
01AVX
0 5 10 15 20
80
60
40
20
01BRC
0 5 10 15 20
80
60
40
20
01BVN
0 5 10 15 20
60
40
20
01CGI
Ene
rgy
0 5 10 15 20
60
40
20
01CHO
0 5 10 15 20
50
40
30
20
10
01CSE
0 5 10 15 20
120
100
80
60
40
20
01DFJ
0 5 10 15 20
100
80
60
40
20
01E6E
0 5 10 15 20
60
40
20
01EAW
Ene
rgy
0 5 10 15 20
80
60
40
20
01MAH
0 5 10 15 20
80
60
40
20
01PPE
0 5 10 15 20
60
40
20
01STF
0 5 10 15 20
60
40
20
01TGS
0 5 10 15 20
80
60
40
20
01TMQ
Ene
rgy
0 5 10 15 20
100
80
60
40
20
01UDI
0 5 10 15 20
60
40
20
01UGH
0 5 10 15 20
60
40
20
02MTA
0 5 10 15 20
60
40
20
02PTC
0 5 10 15 20
60
40
20
02SIC
RMSD
Ene
rgy
0 5 10 15 20 60
40
20
02SNI
RMSD0 5 10 15 20
80
60
40
20
02TEC
RMSD0 5 10 15 20
120
100
80
60
40
20
04HTC
RMSD0 5 10 15 20
100
80
60
40
20
07CEI
RMSD
Figure 2. RMSD vs. energy plots for SDU2 sampled structures in the near-native funnel for enzyme–inhibitor complexes. The nativestructure is indicated by a blue circled asterisk and the SDU2 prediction by a red square.doi:10.1371/journal.pcbi.1000191.g002
Protein Docking by Underestimation
PLoS Computational Biology | www.ploscompbiol.org 7 October 2008 | Volume 4 | Issue 10 | e1000191
Repeatability of the SDU-Based Docking AlgorithmSDU based docking algorithms are stochastic in nature.
Although we gave a theoretical guarantee of probabilistic
convergence to the global minimum of funnel-like functions under
some fairly general conditions [30], practical protein docking
problems do not necessarily satisfy all these conditions. To check
the variations in our results we have repeatedly run SDU2 to
refine the near-native cluster from PIPER (columns 3 and 4 in
Table 1) for 10 randomly selected complexes, including 4 enzyme–
inhibitor, 4 antigen–antibody and 2 ‘‘other’’ complexes. SDU2
was run 10 times independently for each complex with the same
set of parameters. The results (ligand interface Ca RMSD versus
corresponding free energy values) are shown in Figure 5, where
black circles represent the rigid body predictions from PIPER before
0 10 20
100
50
01AHW
Ene
rgy
0 10 20
60
40
20
01BVK
0 10 20
80
60
40
20
01EO8
0 10 20
60
40
20
01FBI
0 10 20
80
60
40
20
01IAI
0 10 20 60
40
20
01MEL
Ene
rgy
0 10 20 60
40
20
01MLC
0 10 20
60
40
20
01QFU
0 10 20 80
60
40
20
01WEJ
0 10 20
60
40
20
02JEL
0 10 20 80
60
40
20
02VIR
Ene
rgy
0 10 20
40
20
01A0O
0 10 20
80
60
40
20
01ATN
0 10 20
80
60
40
20
01GLA
0 10 20
60
40
20
01MDA
0 10 20
100
50
01SPB
RMSD
Ene
rgy
0 10 20
100
50
01WQ1
RMSD
0 10 20
100
50
02BTF
RMSD
0 10 20
60
40
20
02PCC
RMSD
Figure 3. RMSD vs. energy plots for SDU2 sampled structures in the near-native funnel for antigen–antibody or other complexes.The native structure is indicated by a blue circled asterisk and the SDU2 prediction by a red square.doi:10.1371/journal.pcbi.1000191.g003
0 2 4 60
0.1
0.2
0.3
0.4
0.5
Translation (angstrom)
Rot
atio
n (r
adia
n)
B
100
80
60
40
20
0 5 100
0.2
0.4
0.6
0.8
Translation (angstrom)
Rot
atio
n (r
adia
n)
A
50
40
30
20
10
0
Figure 4. SDU1 (A) and SDU2 (B) trajectories in the near-native cluster for 4HTC. Translational and rotational distances plotted in thehorizontal and vertical axes, are defined as Ir12r0I and Iv12v0I, respectively, where (r1,v1) denotes the position and orientation of the ligand and(r0,v0) are the corresponding values in the native state. The points are color-coded depending on their energy (in Kcal/mol as shown on the right),and the points in the squares show the best local minimum in each iteration.doi:10.1371/journal.pcbi.1000191.g004
Protein Docking by Underestimation
PLoS Computational Biology | www.ploscompbiol.org 8 October 2008 | Volume 4 | Issue 10 | e1000191

refinement and blue asterisks represent the independent SDU2
predictions. Some of the latter overlap, resulting in less than 10
distinct solutions. SDU2 is able to lower the free energy values in all
cases and to improve RMSD in most of them. Table 2 shows the
mean (indicated by overline) and the standard deviation (indicated
by s) for both the ligand interface RMSD and the free energy for
each complex. Although the average standard deviation is relatively
large (about 4.4 Kcal/mol) for free energies, it is less than 0.5 A for
RMSDs. This result indicates a good level of robustness, considering
that our free energy model does not discriminate among structures
within 1 A RMSD from each other. Note that the SDU-based
algorithms rely more on the collective distribution of a set of
encounter structures in the free energy funnel, rather than on a single
low energy structure, which reduces the sensitivity of the results to
the variations in the starting structures.
ConclusionsThe successful application of the Semi-Definite programming-
based Underestimation (SDU) search algorithm to protein–protein
docking further validates the assumption that the free energy
landscape of the complex is a funnel in some neighborhood of the
native state. However, the direct application of SDU in the space
SE(3) of rotations and translations fails to yield useful under-
estimators. Alternating searches in rotational and translational
subspaces yields a feasible but inefficient algorithm. We have
substantially improved performance by separately optimizing the
center-to-center distance and describing SE(3) in terms of five
angles. It is potentially important that this strategy samples
encounter complexes, and hence it is reminiscent of the model of
molecular association through a series of micro-collisions [37].
Results emphasize that the funnel-like shape of the free energy
surface seen in this parameterization of SE(3) is largely lost when
changing to the straightforward description of the space in terms of
rotational and translational coordinates.
The underestimation approach has been used in the latest
rounds of CAPRI with considerable success [19,43], and it
provides a promising platform for improving docking methods.
We note that Marcia et al. [44] recently reported the application
of SDU to the docking problem using the general quadratic
underestimation method we have earlier developed [30,31].
0 2 4 6 8
55
50
45
40
35
30
25
20
15
10
5
01ACB
Ene
rgy
0 2 4 6 8
80
70
60
50
40
30
20
10
01MAH
0 2 4 6 8
70
60
50
40
30
20
10
01UDI
0 2 4 6 8
100
90
80
70
60
50
40
30
20
10
04HTC
0 2 4 6 8
50
45
40
35
30
25
20
15
10
5
01MEL
0 2 4 6 8
60
50
40
30
20
10
01QFU
RMSD
Ene
rgy
0 2 4 6 8
70
60
50
40
30
20
10
01WEJ
RMSD0 2 4 6 8
35
30
25
20
15
10
5
02JEL
RMSD0 2 4 6 8
70
60
50
40
30
20
10
01GLA
RMSD0 2 4 6 8
90
80
70
60
50
40
30
20
10
01SPB
RMSD
Figure 5. RMSD vs. energy plots for predictions from 10 independent SDU2 runs for the first near-native clusters of 10 randomlychosen protein complexes. The rigid body prediction before SDU2 refinement is indicated by a black circle and the SDU2 predictions by blueasterisks. (Note that some of the latter points overlap.)doi:10.1371/journal.pcbi.1000191.g005
Protein Docking by Underestimation
PLoS Computational Biology | www.ploscompbiol.org 9 October 2008 | Volume 4 | Issue 10 | e1000191
However, the central problem of parameterizing the search space
was not discussed and the method was applied only to five bound
docking problems using co-crystallized structures, which is much
easier than docking two separately crystallized proteins. In fact, we
believe that the separate minimization along the center-to-center
vector and the use of five angular descriptors can improve the
performance of any minimization algorithm used for docking.
Methods
Protein Docking BenchmarkThe SDU1 and SDU2 algorithms were tested on complexes from
the protein docking benchmark sets [38,39]. These sets contain
enzyme–inhibitor, antigen–antibody, and ‘‘other’’ types of complex-
es. As described, the algorithms were used to refine the separate
clusters generated by the rigid body docking program PIPER. For
enzyme–inhibitor complexes we refined only the 10 largest clusters
and hence restricted consideration to complexes from the two
benchmark sets for which these clusters included at least one near-
native conformation. In addition, we disregarded four enzyme–
inhibitor pairs that form oligomeric rather than binary complexes,
resulting in the 25 test problems. The refinement algorithms were
also applied to 11 antigen–antibody and 8 ‘‘other’’ type of complexes
from the benchmark set 1 [38] that had at least one near-native
structure in the 30 largest clusters. We emphasize that tests for most
complexes involved separately determined protein structures as
given in the benchmark sets [38,39]. The exceptions are a few of the
antigen–antibody complexes in which the antigen was separately
solved but the antibody structure was taken from the complex.
Rigid Body DockingThe rigid body docking program PIPER [22], based on the FFT
correlation approach, systematically samples billions of docked
conformations on a grid. Compared with other FFT-based
approaches that use only shape complementarity and electrostatics
for scoring, the scoring function in PIPER also includes the statistical
pairwise potential DARS (Decoy As Reference States) [22]. Since the
potential is represented as the sum of a few correlation functions
through the eigenvalue-eigenvector decomposition of the matrix of
the DARS interactions energy coefficients, the energy can be very
efficiently evaluated using Fourier transforms. In conjunction with
this higher accuracy scoring function, the PIPER program
significantly enriches the hit rates among top ranked predictions
for the benchmark sets described above.
For each complex, we retained the 1000 lowest energy predictions
and clustered them using pairwise RMSD as the distance metric
[45]. The resulting clusters were ranked based on their size,
reflecting a preference for local minima with broad regions of
attraction [32]. We have retained at most 30 clusters for each
complex, each one being roughly 10 A RMSD wide.
The Semi-Definite Programming-Based Underestimation(SDU) Algorithm
Constructing an underestimator. We start with a set of K
locally minimized structures L~ x1, . . . , xK� �
(x[Rn, where
n = 3 for SDU1 and n = 5 for SDU2) within each region B defined
by a cluster and the corresponding free energy values DG. (The
detailed free energy models would be described in the next part.)
In this study, the set L is initially chosen by the cluster center and
(K21) structures with the lowest PIPER scores within each cluster.
When no cluster information other than its representative is
available, this can be simply a set of locally perturbed structures
around the cluster center. We are interested in constructing an
underestimator which underestimates the free energy surface at
those samples in set L and captures the general funnel-like
landscape. The family of underestimators used here are convex
general quadratic functions U xð Þ ¼D x0Qxzb0xzc, where
Q[Rn|n, and c is a scalar.
Using an L1 norm as a distance metric, the problem of finding
the tightest possible such underestimator U can be formulated as
follows:
minPK
j~1 DG xjð Þ{c{xj ’Qxj{b0xjð Þ
s:t: DG xjð Þ§czxj ’Qxjzb0xj , j~1, . . . ,K ,
Q] 0
ð1Þ
Table 2. Repeatability test for SDU2.
Complex Rigid Body Prediction SDU2 Predictions
RMSD Energy RMSD sRMSD Energy sEnergy
Enzyme–Inhibitor Complexes
1ACB 5.63 221.09 2.17 0.28 251.15 3.50
1MAH 1.80 250.22 1.60 0.43 274.57 6.74
1UDI 4.66 234.37 2.60 0.34 271.58 2.19
4HTC 5.32 210.22 1.84 0.34 286.87 7.72
Antigen–Antibody Complexes
1MEL 6.04 29.53 2.67 0.65 244.67 5.88
1QFU 1.02 240.35 1.18 0.28 243.03 7.06
1WEJ 3.65 236.08 2.04 0.32 269.02 2.41
2JEL 7.96 211.61 6.08 0.26 236.09 1.42
Other Complexes
1GLA 8.27 222.08 4.10 1.23 258.23 5.33
1SPB 3.41 226.31 1.51 0.03 288.63 2.00
Average 0.42 4.42
doi:10.1371/journal.pcbi.1000191.t002
Protein Docking by Underestimation
PLoS Computational Biology | www.ploscompbiol.org 10 October 2008 | Volume 4 | Issue 10 | e1000191

where the decision variables are Q, b, and c, and ‘‘]0’’ denotes
positive semi-definiteness. This problem can be reformulated as a
Semi-Definite Programming (SDP) problem [30], an important class of
convex programming problems [46] which finds many applications
in various subjects recently. SDP problems aim at minimizing a
linear function subject to the constraints of linear matrix inequalities.
Such constraints are nonlinear but convex. Efficient polynomial-time
algorithms, such as interior-point algorithms, exist for solving SDP
problems. General-purpose solvers are also readily available [47,48].
We use the callable library of SDPA v6.20 [48] which solves the SDP
problem efficiently with a primal-dual interior-point method and
exploits the sparsity of the problem. When canonical quadratic
underestimators are used as in CGU [26], Q is restricted to diagonal
matrices without off-diagonal elements. The problem then becomes
a Linear Programming (LP) one, which can be regarded as a special
case of SDP problems.
There are K0~12
nz1ð Þ nz2ð Þ coefficients for U, which suggests
that the number of samples K$K0. K0 equals 10 and 21, respectively,
for SDU1 and SDU2. K is set to 40 for both SDU methods.Biased sampling. The derived optimal underestimator U is
exploited to bias further sampling in B. The global minimum of U is
denoted by xP and referred to as the predictive conformation. Since U
reflects the general structure of the free energy landscape, at least
based on the discrete sampling of B, our strategy is to sample in the
area around xP such that conformations close to xP are more likely to
be selected. This can be achieved by using an acceptance/rejection
scheme and the following probability density function (pdf) in B:
g xð Þ~ U xð Þ{UmaxÐB U xð Þ{Umaxð Þdx
¼D U xð Þ{Umax
A,x[B
where Umax~maxiU xið Þ xi[Lð Þ.Iteration techniques. The processes of underestimation and
biased sampling are iterated with the set of local minima being
updated and the search region being gradually shrunk to the
neighborhood of predictive conformation xP. Previous samples in
L which are energetically unfavorable or too far from xP are be
discarded, namely those structures xi[L withUmax{U xið ÞUmax{U xPð Þƒf.
(f = 0.7 in this work). Newly sampled structures are added to Lwith local minimization starting from xP and 1
2K{1 additional
biased samples.
We set the convergence criterion based on the proximity of the
predictive conformation xP and the current lowest-energy
structure xmin in L xmin~argx[L minDG xð Þð Þ. At most 5 iterations
are carried on unless convergence is observed earlier, i.e.,
IxP2xminI#e. e is set at 1 A in translations and 0.087 radian
(5 degrees) in rotations for SDU1. To approximate equal
convergence definition, e is set at 0.1 radian for SDU2. The
value of xmin at the final iteration provides the final solution for
either SDU method.
Free Energy Evaluation ModelsDocking by the SDU algorithms involves the use of two different
free energy models. In the rigid body global search the scoring
function is
DG~DGdeszDEeleczlDEvdw:
where the desolvation free energy DGdes is estimated by the Atomic
Contact Potential [49], an atom-level extension of the Miyazawa-
Jernigan potential [50], the electrostatic energy DEelec is based on
the Coulombic formula with distance-dependent dielectrics E= 4r,
and the Van der Waals term DEvdw is adopted from the Charmm
potential [51]. The scaling factor lM[0,1] is dynamically adjusted
during the course of the refinement to improve the quality of the
underestimator by dampening the effect of the van der Waals term
DEvdw and thereby smoothing DG. Specifically, whenever a ‘‘flat’’
underestimator U (this can be determined when the minimum
eigenvalue of Q is close to zero) is being computed with l = 1, we
gradually reduce l with a stepsize of 0.1 until we obtain a more
informative underestimator or l reaches 0.
In the flexible local minimization we use the Charmm potential
with E= 4r, including the internal energy terms, and perform 100
steps of adopted base Newton-Raphson (ABNR) minimization
allowing for side-chain flexibility in the interface [51]. The
distance between two components is separately optimized.
Specifically, the ligand is pushed towards or pulled apart from
the receptor at a stepsize of 0.5 A along the line segment
connecting the two centers of mass. The maximum shift in
distance (which defines locality) is 2 A in this study. Each position
is followed by a Charmm minimization described above and
energy evaluation. Only non-clashing structures are accepted,
judged by the condition DEvdw,0. In fact, we found that PIPER
had a higher tolerance toward clashing structures and pushing
component proteins closer generally resulted in increased positive
DEvdw. To reduce calls to Charmm minimization, in practice we
only pull them apart if necessary, i.e., when DEvdw.0 is found. For
simplicity we will call the work involved in evaluating DG*(x) for
each conformation x a function evaluation, although it generally
involves several evaluations of DG(x,s).
Quality MeasuresAs a measure of prediction quality, we select the ligand Ca atoms
in the binding site, and calculate the RMSD between their
predicted and observed positions. A ligand residue is considered to
be in the binding site if any of its atom is within 10 A of an atom
on the receptor. We refer to a structure as near-native (or a ‘‘hit’’)
if its ligand binding site Ca RMSD is less than 10 A. Although such
structures are not really close to the native complex, by rigid body
docking it is generally difficult to obtain better results. In fact, since
the near-native binding region is selected by cluster size using a
clustering radius on the order of 10 A, the goal of this first step is to
generate as many such 10 A RMSD structures as possible. To
show the improvements due to the SDU method, we list the rank
of the first cluster that includes a hit, as well as the RMSD between
the native structure and the center of the cluster. However, as a
more appropriate overall performance measure of the refinement,
we also note the number of complexes that have at least one
prediction with less than 5 A RMSD from the native structure in
the top 5 clusters.
Author Contributions
Conceived and designed the experiments: YS ICP PV SV. Performed the
experiments: YS. Analyzed the data: YS. Wrote the paper: YS ICP PV SV.
References
1. Uetz P, Giot L, Cagney G, Mansfield TA, Judson RS, et al. (2000) A
comprehensive analysis of protein–protein interactions in Saccharomyces
cerevisiae. Nature 403: 623–627.
2. Ito T, Chiba T, Ozawa R, Yoshida M, Hattori M, et al. (2001) A comprehensive
two-hybrid analysis to explore the yeast protein interactome. Proc Natl Acad
Sci U S A 98: 4569–4574.
Protein Docking by Underestimation
PLoS Computational Biology | www.ploscompbiol.org 11 October 2008 | Volume 4 | Issue 10 | e1000191
3. Gavin AC, Bosche M, Krause R, Grandi P, Marzioch M, et al. (2002)
Functional organization of the yeast proteome by systematic analysis of proteincomplexes. Nature 415: 141–147.
4. Ho Y, Gruhler A, Heilbut A, Bader GD, Moore L, et al. (2002) Systematic
identification of protein complexes in Saccharomyces cerevisiae by massspectrometry. Nature 415: 180–183.
5. Berman H, Westbrook J, Feng Z, Gilliland G, Bhat TN, et al. (2000) TheProtein Data Bank. Nucleic Acids Res 28: 235–242.
6. Leopold PE, Montal M, Onuchic JN (1992) Protein folding funnels: a kinetic
approach to the sequence-structure relationship. Proc Natl Acad Sci U S A 89:8721–8725.
7. Bryngelson J, Onuchic JN, Socci ND, Wolynes PG (1995) Funnels, pathways,and the energy landscape of protein-folding: a synthesis. Proteins 21: 167–195.
8. Dill KA (1999) Polymer principles and protein folding. Protein Sci 8:1166–1180.
9. Tsai CJ, Kumar S, Ma B, Nussinov R (1999) Folding funnels, binding funnels,
and protein function. Protein Sci 8: 1981–1990.10. McCammon JA (1998) Theory of biomolecular recognition. Curr Opin Struct
Biol 8: 245–249.11. Zhang C, Chan J, DeLisi C (1999) Protein–protein recognition: exploring the
energy funnels near the binding sites. Proteins 34: 255–267.
12. Tovchigrechko A, Vakser IA (2001) How common is the funnel-like energylandscape in protein–protein interactions? Protein Sci 10: 1572–1583.
13. Selzer T, Schreiber G (2001) New insights into the mechanism of protein–protein association. Proteins 45: 190–198.
14. Trosset JY, Scheraga HA (1998) Reaching the global minimum in dockingsimulations: a monte carlo energy minimization approach using bezier splines.
Proc Natl Acad Sci U S A 95: 8011–8015.
15. Camacho CJ, Weng Z, Vajda S, DeLisi C (1999) Free energy landscapes ofencounter complexes in protein–protein association. Biophys J 76: 1166–1178.
16. Camacho CJ, Kimura SR, DeLisi C, Vajda S (2000) Kinetics of desolvation-mediated protein–protein binding. Biophys J 78: 1094–1105.
17. Mendez R, Leplae R, De Maria L, Wodak SJ (2003) Assessment of blind
predictions of protein–protein interactions: current status of docking methods.Proteins 52: 51–67.
18. Mendez R, Leplae R, Lensink MF, Wodak SJ (2005) Assessment of CAPRIpredictions in rounds 3–5 shows progress in docking procedures. Proteins 60:
150–169.19. Lensink MF, Mendez R, Wodak SJ (2007) Docking and scoring protein
complexes: CAPRI 3rd edition. Proteins 69: 704–718.
20. Vajda S, Camacho CJ (2004) Protein–protein docking: is the glass half full orhalf empty? Trends Biotechnol 22: 110–116.
21. Chen R, Li L, Weng Z (2003) ZDOCK: an initial-stage protein dockingalgorithm. Proteins 52: 80–87.
22. Kozakov D, Brenke R, Comeau SR, Vajda S (2006) PIPER: an FFT-based
protein docking program with pairwise potentials. Proteins 65: 392–406.23. Fischer D, Lin SL, Wolfson H, Nussinov R (1995) A geometry-based suite of
molecular docking processes. J Mol Biol 248: 459–477.24. Gray JJ, Moughon S, Wang C, Schueler-Furman O, Kuhlman B, et al. (2003)
Protein–protein docking with simultaneous optimization of rigid-body displace-ment and side-chain conformations. J Mol Biol 331: 281–299.
25. Abagyan R, Totrov M (1994) Biased probability Monte Carlo conformational
searches and electrostatic calculations for peptides and proteins. J Mol Biol 235:983–1002.
26. Phillips AT, Rosen JB, Dill KA (2001) Convex global underestimation formolecular structure prediction. In: From Local to Global Optimization.
Migdalas A, Pardalos PM, Varbrand P, eds. Boston (Massachusetts): Kluwer
Academic Publishers. pp 1–18.27. Dill KA, Phillips AT, Rosen JB (1997) Protein structure and energy landscape
dependence on sequence using a continuous energy function. J Comput Biol 4:227–240.
28. Mitchell JC, Rosen JB, Phillips AT, Ten Eyck LF (1999) Coupled optimization
in protein docking. In: Proceedings of the 3rd Annual International Conferenceon Computational Molecular Biology. Lyon, France. pp 280–284.
29. Dennis S, Vajda S (2002) Semi-global simplex optimization and its application to
deter-mining the preferred solvation sites of proteins. J Comput Chem 23:
319–334.
30. Paschalidis IC, Shen Y, Vakili P, Vajda S (2007) A semi-definite programming-
based underestimation method for stochastic global optimization in protein
docking. IEEE Trans Automat Contr 52: 664–676.
31. Paschalidis IC, Shen Y, Vajda S, Vakili P (2005) A semi-definite programming-
based underestimation method for global optimization in molecular docking. In:
Proceedings of the 44th IEEE Conference on Descision and Control. Seville,Spain. pp 3675–3680.
32. Comeau SR, Gatchell D, Vajda S, Camacho CJ (2004) ClusPro: an automated
docking and discrimination method for the prediction of protein complexes.Bioinformatics 20: 45–50.
33. Gwak S, Kim J, Park FC (2003) Numerical optimization on the Euclidean group
with applications to camera calibration. IEEE Trans Robot Autom 19: 65–74.
34. Paschalidis IC, Shen Y, Vakili P, Vajda S (2006) Protein–protein docking with
reduced potentials by exploiting multi-dimensional energy funnels. In:
Proceedings of the 28th IEEE Engineering in Medicine and Biology SocietyAnnual International Conference. New York, NY. pp 5330–5333.
35. Park FC, Ravani B (1997) Smooth invariant interpolation of rotations. ACM
Trans Graph 16: 277–295.
36. Park FC (1995) Distance metrics on the rigid-body motions with applications to
mechanism design. J Mech Des 117: 48–54.
37. Berg OG, von Hippel PH (1985) Diffusion-controlled macromolecularinteractions. Annu Rev Biophys Biophys Chem 14: 131–158.
38. Chen R, Mintseris J, Janin J, Weng Z (2003) A protein–protein docking
benchmark. Proteins 52: 88–91.
39. Mintseris J, Wiehe K, Pierce B, Anderson R, Chen R, et al. (2005) Protein–protein docking benchmark 2.0: an update. Proteins 60: 214–216.
40. Li L, Chen R, Weng Z (2003) RDOCK: refinement of rigid-body protein
docking predictions. Proteins 53: 629–639.
41. Lyskov S, Gray JJ (2008) The RosettaDock server for local protein–protein
docking. Nucleic Acids Res 36: W233–W238.
42. Gray JJ, Moughon S, Wang C, Schueler-Furman O, Kuhlman B, et al. (2003)Protein–protein docking with simultaneous optimization of rigid-body displace-
ment and side-chain conformations. J Mol Biol 331: 281–299.
43. Shen Y, Brenke R, Kozakov D, Comeau SR, Beglov D, et al. (2007) Dockingwith PIPER and refinement with SDU in rounds 6–11 of CAPRI. Proteins 69:
734–742.
44. Marcia RF, Mitchell JC, Wright SJ (2007) Global optimization in proteindocking us-ing convex underestimation and semidefinite programming. Optim
Methods Softw 22: 803–811.
45. Kozakov D, Clodfelter KH, Vajda S, Camacho CJ (2005) Optimal clustering fordetecting near-native conformation in protein docking. Biophys J 89: 867–875.
46. Boyd S, Vandenberghe L (2003) Convex Optimization. Cambridge, UK:
Cambridge University Press.
47. Sturm JF (1999) Using SeDuMi 1.02, a MATLAB toolbox for optimization oversymmet-ric cones. Optim Methods Softw 11–12: 625–653. Special issue on
Interior Point Methods (CD supplement with software).
48. Fujisawa K, Kojima M, Nakata K, Yamashita M (2002) SDPA (SemiDefiniteProgramming Algorithm) User’s Manual Version 6.00. Department of
Mathematical and Com-puting Sciences, Tokyo Institute of Technology.Research Reports on Mathematical and Computing Sciences Series B :
Operations Research.
49. Zhang C, Vasmatzis G, Cornette J, DeLisi C (1997) Determination of atomicdesolvation energies from the structures of crystallized proteins. J Mol Biol 267:
707–726.
50. Miyazawa S, Jernigan RL (1985) Estimation of effective interresidue contactenergies from protein crystal structures: quasi-chemical approximation.
Macromolecules 18: 534–552.
51. Brooks BR, Bruccoleri RE, Olafson BD, States DJ, Swaminathan S, et al. (1983)CHARMM: a program for macromolecular energy, minimization, and
dynamics calculations. J Comput Chem 4: 187–217.
Protein Docking by Underestimation
PLoS Computational Biology | www.ploscompbiol.org 12 October 2008 | Volume 4 | Issue 10 | e1000191


![Docking interactions in protein kinase and phosphatase ...interacting protein–protein motifs for MAP kinases and tyrosine phosphatases [12,13]. Docking interactions in protein phosphatases](https://static.documents.pub/doc/80x56/60ee63efe2bdd8639d7712a5/docking-interactions-in-protein-kinase-and-phosphatase-interacting-proteinaprotein.jpg)