Protein Quantitation by Mass
SpectrometryLet’s weigh proteins !
Amit Kumar Yadav
21st Dec 2012

Absence of evidence is not
evidence of absence !

Quantitation Bias
Quantitative mass spectrometry in proteomics: a critical review. Analytical
and bioanalytical chemistry, 389(4), 1017–31. doi:10.1007/s00216-007-
1486-6

Relative or Absolute?

Quantitative Approaches
Labeling approaches
Metabolic (SILAC)
Enzymatic (O18)
Chemical (ICAT)
Label-free approaches (Unlabeled)
Intensity based (MS1)
Spectral Counting
(MS2)

LABELED APPROACHES
Tag and measure !
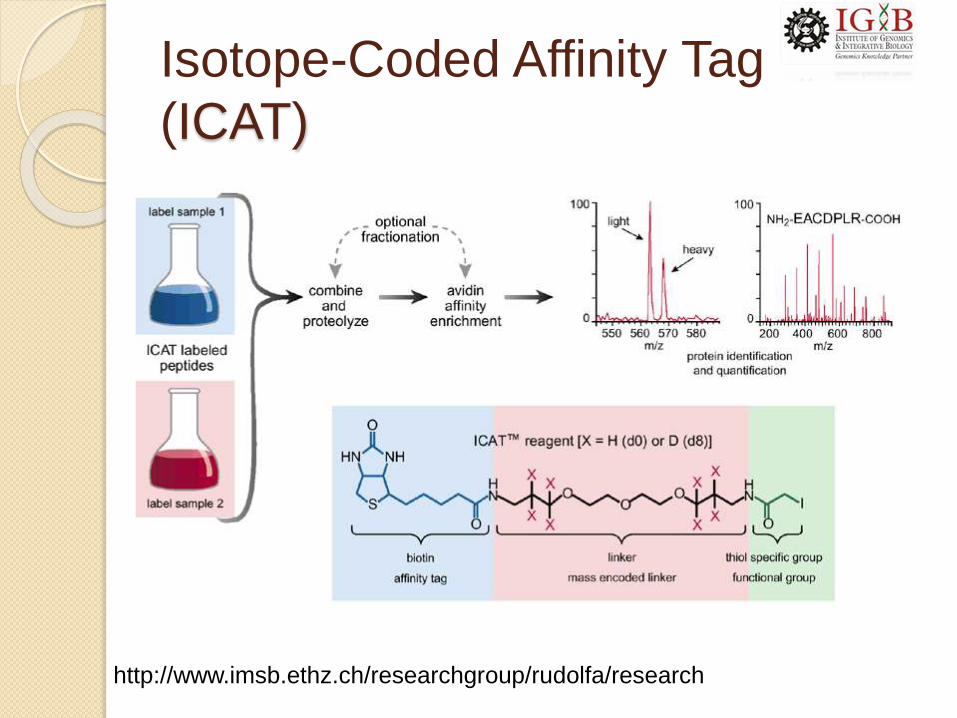
Isotope-Coded Affinity Tag
(ICAT)
http://www.imsb.ethz.ch/researchgroup/rudolfa/research

Stable Isotope Labeling with
Amino Acids in Cell
Culture(SILAC)
http://www.biochem.mpg.de/mann/SILAC/index.html

Isobaric tags for relative and
absolute quantitation (iTRAQ)
Analysis of protein complexes using mass spectrometry
Nature Reviews Molecular Cell Biology 8, 645-654 (August 2007)
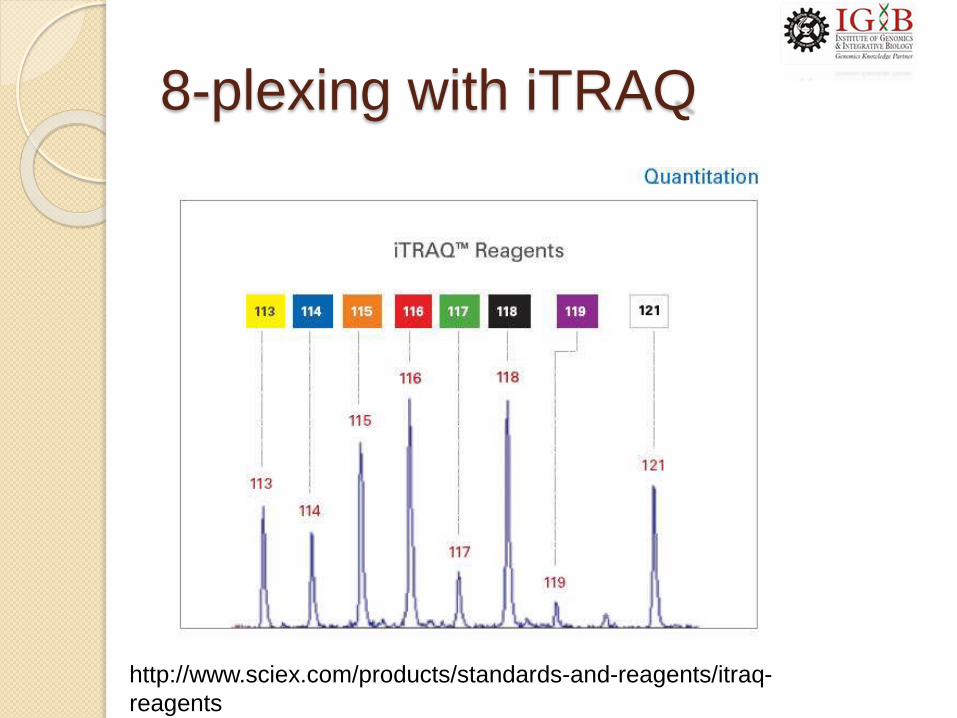
8-plexing with iTRAQ
http://www.sciex.com/products/standards-and-reagents/itraq-
reagents

LABEL FREE
Its free !
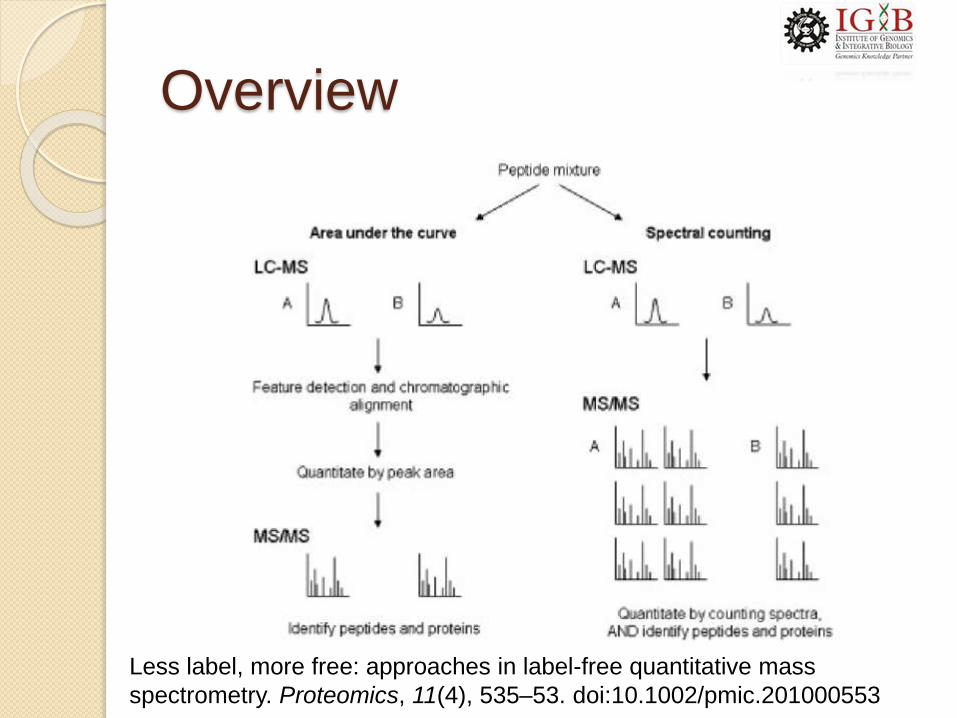
Overview
Less label, more free: approaches in label-free quantitative mass
spectrometry. Proteomics, 11(4), 535–53. doi:10.1002/pmic.201000553
Spectral Counting (SpC)
More abundant peptides will be
selected for fragmentation and will
produce a higher abundance of
MS/MS spectra, and is therefore
proportional to protein amount in data-
dependent acquisition
SpC = the number of MS/MS spectra
per peptide

Normalised Spectral Index(SIn)
SIN = a normalised spectral
indexTo convert SI into SIn, SI is normalised for
variations between protein amounts across
data sets by dividing the SI for protein k by the
sum of the SI for all proteins in a replicate, and
is further normalised by dividing by the length
of a protein to account for the expectation that
a longer protein will yield a greater number of

RSC
RSC, = log2 of a ratio of abundance
between two samples
Protein Abundance Index
(PAI) An estimate of the protein abundance
in a sample can be calculated using
the protein abundance index (PAI),
which is defined as the number of
observed peptides in the experiment
divided by the number of observable
tryptic peptides for each protein within
a given mass range of the mass
spectrometer employed

Exponentially modified
Protein Abundance Index
(emPAI)
which is directly proportional to the
protein content in a sample
The protein content can be calculated
in terms of a molar percentage by
dividing the emPAI value of a protein
by the sum of all emPAI values
multiplied by 100
Absolute Protein Expression
(APEX)
Absolute Protein Expression (APEX) is a modified spectral counting technique that takes into account the number of observed peptide mass spectra for a protein and the probability of the peptides being detected by the MS instrument
The key feature of APEX is Oi, a correction factor for the expectation of observing a tryptic peptide in an experiment, which is calculated by a machine learning classification algorithm based on peptide length and amino acid composition. This technology is based on the findings of Mallickand colleagues in a study involving the prediction of proteotypic peptides

Normalised Spectral
Abundance Factor (NSAF)
Normalised Spectral Abundance Factor (NSAF) provides an improved measure for relative abundance by taking into account the length of the protein, which is calculated by dividing the SpC for a protein by its length (L)
This value is then normalised by dividing by the sum of all SpC/L for all proteins in an experiment
The dynamic range for NSAF values is approximately four orders of magnitude, and abundance changes as low as 1.4-fold can be detected

Tools for Label free

Potential Bias at various steps