

Public Higher Education: Public Trust, Private Investment, or Lost Cause!
Public Higher Education: Public Trust, Private Investment, or Lost Cause!
University of Denver – Strategic Issues Panel
The Future of State Government in Colorado Presentation by:David LonganeckerPresident, Western Interstate Commission for Higher Education (WICHE)
University of Denver – Strategic Issues Panel
The Future of State Government in Colorado Presentation by:David LonganeckerPresident, Western Interstate Commission for Higher Education (WICHE)
The Colorado Story A Perfect Situation

Public Higher Education: Public Trust, Private Investment, or Lost Cause!
Public Higher Education: Public Trust, Private Investment, or Lost Cause!
University of Denver – Strategic Issues Panel
The Future of State Government in Colorado Presentation by:David LonganeckerPresident, Western Interstate Commission for Higher Education (WICHE)
University of Denver – Strategic Issues Panel
The Future of State Government in Colorado Presentation by:David LonganeckerPresident, Western Interstate Commission for Higher Education (WICHE)
The Colorado Story A Perfect Situation
Perfect Storm orPerfect Opportunity

The Perfect Storm: Three Converging WavesThe Perfect Storm: Three Converging Waves
Wave One: Colorado’s Economic Competitiveness
Wave Two: Who We Are – Can Colorado Be Competitive
Wave Three: What Colorado Has in Resources to Commit to This Venture

The Liberal BorrowingsThe Liberal Borrowings
Knocking on the College Door (WICHE)
Beyond Social Justice (WICHE)
National Center for Higher Education Management Systems (NCHEMS) : www.higheredinfo.org.
State Higher Education Executive Officers (SHEEO), SHEF Report, February 2010.

The Converging WavesThe Converging Waves
Wave One: Colorado’s Economic Competitiveness
Wave Two: Who We Are – Can Colorado Be Competitive
Wave Three: What Colorado Has in Resources

Relationship Between Educational Attainment, Personal Income, and Economic Strength
Relationship Between Educational Attainment, Personal Income, and Economic Strength
AL
AZ
AR
CA
CO
CT
DE IL
IN
IA
KY
LA
MDMA
MS
NJ
NY
NDOK
OR
SC
SD
UT
VA
WAMN
NH
TN TX
WV
WI
WY
$15,000
$20,000
$25,000
$30,000
15% 20% 25% 30% 35% 40%
Pers
onal In
com
e P
er
Capit
a,
20
00
Percent of Adults Age 25-64 with a Bachelor’s Degree or Higher
MT
HI
AK
GA
KS
ME NE
NV
NC
OH PAVT
ID
MI
MO
NM
RIFL US
Low Income, High Educational AttainmentLow Income, Low Educational Attainment
High Income, High Educational AttainmentHigh Income, Low Educational Attainment
State New Economy Index (2002)
Top Tier
Middle Tier
Low Tier

Adams
Alamosa
Arapahoe
Archuleta
Baca
Bent
Boulder
Chaffee
Cheyenne
Clear Creek
CO
Conejos
Costilla
Crowley
Custer
Delta
Denver
Dolores
Douglas
Eagle
El PasoElbert
Fremont
Garfield
Gilpin
Grand
GunnisonHinsdale
HuerfanoJacksonJefferson
Kiowa
Kit Carson
La Plata
Lake
Larimer
Las Animas
Lincoln
Logan MesaMineral
Moffat MontezumaMontrose
MorganOtero
OurayPark
Phillips
Pitkin
ProwersPueblo
Rio Blanco
Rio Grande
Saguache
San Juan
San Miguel
Sedgwick
Summit
Teller
Washington
Weld
Yuma
$10,000
$20,000
$30,000
$40,000
$50,000
$60,000
$70,000
10.0% 15.0% 20.0% 25.0% 30.0% 35.0% 40.0% 45.0% 50.0% 55.0% 60.0%
Pers
onal
Inco
me
per
Capi
ta
Adults aged 25 - 64 with a Bachelor's Degree or Higher (%)
Educational Attainment & Personal Income by Colorado CountiesEducational Attainment & Personal Income by Colorado Counties

Differences in College Attainment (Associate and Higher) Between Younger and Older Adults - U.S. and OECD Countries, 2005
Differences in College Attainment (Associate and Higher) Between Younger and Older Adults - U.S. and OECD Countries, 2005
Source: Organisation for Economic Co-operation and Development (OECD), Education at a Glance 2007
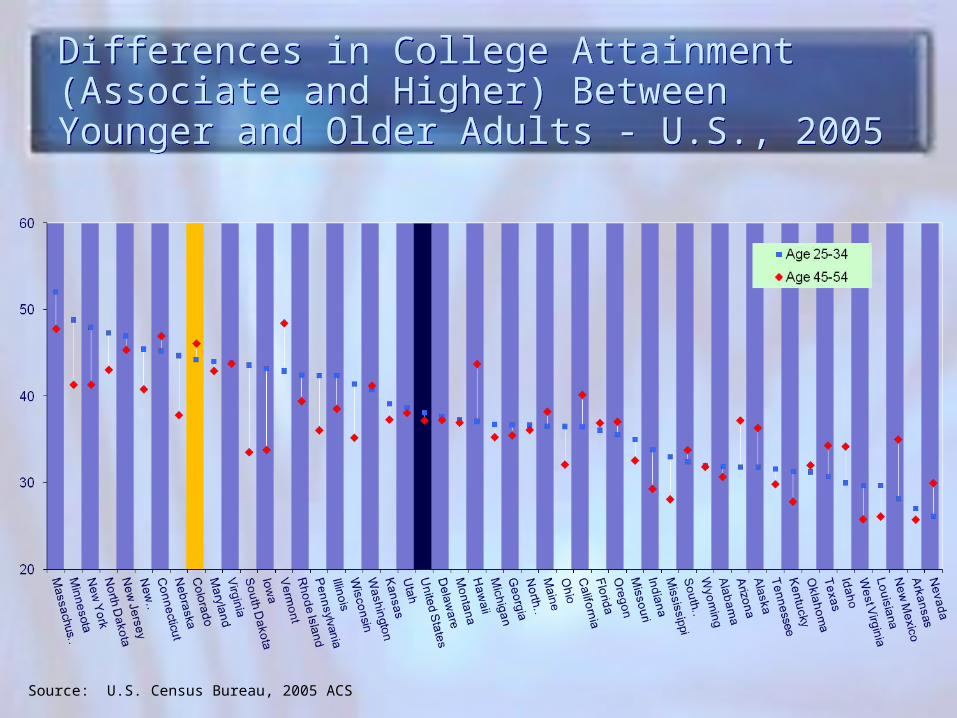
Differences in College Attainment (Associate and Higher) Between Younger and Older Adults - U.S., 2005
Differences in College Attainment (Associate and Higher) Between Younger and Older Adults - U.S., 2005
Source: U.S. Census Bureau, 2005 ACS

Percent of Adults with an Associate Degree or Higher by Age Group – Colorado, U.S. & Leading OECD Countries
Percent of Adults with an Associate Degree or Higher by Age Group – Colorado, U.S. & Leading OECD Countries
54.8
54.1
53.0
43.6
42.2
41.9
41.5
41.4
40.8
39.2
40.4
50.8
46.2
37.5
39.5
32.8
34.8
34.6
26.9
36.2
40.9
45.843.2 39.3
19.2
38.1
24.0
26.8
30.0
19.4
33.2
39.6
44.3
37.4
22.9
10.6
30.3
16.9
22.5
24.9
16.0
28.5
37.7
47.6
0
10
20
30
40
50
60
Canada Japan Korea NewZealand
Ireland Belgium Norway France Denmark U.S. Colorado
Age 25-34 Age 35-44 Age 45-54 Age 55-64
Source: OECD, Education at a Glance 2008

The White Caps on the First WaveThe White Caps on the First Wave
We’ve Been A LeaderBut Slip-Sliding Away
Losing Ground:Falling Internationally (Comparatively)Mixed Bag Nationally
One Size Doesn’t Fit AllTwo Stories – The Haves & the Have Nots

The Public Policy Response: Thinking Here & ElsewhereThe Public Policy Response: Thinking Here & ElsewhereNational/Federal
The President’s Goal – Lead Again by 2020Increased visibility – Education & Workforce
Gates and Lumina
Regions & Their StatesEast: Status Quo, more or lessMid-West: A Mixed Bag
Rhetoric trumps action
South: Investing in EducationBut still disconnects
West (and Colorado): Question the Data Blame ImmigrationDisinvest in Access and Quality
Question the dataFight for Immigration Reform (Less and More)

The Converging WavesThe Converging Waves
Wave One: Colorado’s Economic Competitiveness
Wave Two: Who We Are – Can Colorado Be Competitive
Wave Three: What Colorado Has in Resources

Public & Nonpublic High School Graduates 1991-92 through 2021-22, Colorado
Public & Nonpublic High School Graduates 1991-92 through 2021-22, Colorado
Total = public and non public, all races. Source: WICHE, Knocking at the College Door
Actual Projected

WICHE Projections of High School GradsWICHE Projections of High School Grads
Source: WICHE, Knocking at the College Door: Projections of High School Graduates by State and Race/Ethnicity 1992-2022. 2008.

WICHE Projections of High School GradsWICHE Projections of High School Grads
Source: WICHE, Knocking at the College Door: Projections of High School Graduates by State and Race/Ethnicity 1992-2022. 2008.

Difference in Education Attainment Between Whites and Hispanics (2006, Percent)
Difference in Education Attainment Between Whites and Hispanics (2006, Percent)
Source: U.S. Census Bureau, 2006 American Community Survey (ACS) Public Use Microdata Sample (PUMS) File. Via NCHEMS

Difference Between Whites and Next Largest Race/Ethnic Group in Percentage of Adults Age 25-34 with an Associate Degree or Higher, 2000
Difference Between Whites and Next Largest Race/Ethnic Group in Percentage of Adults Age 25-34 with an Associate Degree or Higher, 2000
Source: U.S. Census Bureau, PUMS (based on 2000 Census), Via NCHEMS

The White Caps on the Second WaveThe White Caps on the Second Wave
Those with whom we have succeeded are decliningThose with whom we have not succeeded are increasing“Average” won’t sustain us, and may not even be achievableAnd, One Size Doesn’t Fit All
Really Two Stories – The Haves & the Have Nots

The Public Policy Response: Here and ElsewhereThe Public Policy Response: Here and Elsewhere
The Good NewsNational Consensus Efforts
Complete College America (Colorado is in)NGA focus area for New Governors
Equity focus – Nevada, WisconsinAn emerging “Change” agenda – Metro state/NCAT
The Other News – Same Old, same oldMission creepFocus on highest achieving (financial aid & enrolment protections)Challenges to diversity & diverse populationsWhining trumps Changing -- it’s “their” fault
Students for not being smartStates for not being supportive

The Converging WavesThe Converging Waves
Wave One: Colorado’s Economic Competitiveness
Wave Two: Who We Are – Can Colorado Be Competitive
Wave Three: What Colorado Has in Resources

Life could have been worseLife could have been worse
Public FTE Enrollment, Educational Appropriations and Total Educational Revenue per FTE, U.S., Fiscal 1983-2009
Source: SHEEO, SHEF 2009

$4,9
46
$5,0
52
$5,2
76
$5,4
20
$5,4
93
$5,4
53
$5,3
50
$5,2
14
$5,1
01
$4,8
90
$4,8
33
$4,8
71
$4,9
61
$5,2
48
$5,4
13
$5,4
68
$5,4
65
$5,5
13
$5,6
13
$5,2
45
$3,9
91
$3,6
26
$3,6
81
$3,9
65
$4,0
75
$4,2
13
$3,2
55
$3,2
57
$3,5
26
$3,6
29
$3,7
53
$3,6
94
$3,8
01
$3,6
73
$3,8
73
$4,1
05
$4,3
56
$4,3
89
$4,5
41
$4,7
07
$4,6
88
$4,6
76
$4,6
98
$4,5
46
$4,6
00
$4,7
06
$4,6
44
$5,2
69
$5,0
27
$5,4
34
$5,1
55
$5,7
03
$0
$2,000
$4,000
$6,000
$8,000
$10,000
$12,000
0
20
40
60
80
100
120
140
160
180
1983
1984
1985
1986
1987
1988
1989
1990
1991
1992
1993
1994
1995
1996
1997
1998
1999
2000
2001
2002
2003
2004
2005
2006
2007
2008
Do
llars
pe
r F
TE
Pu
blic
FT
E E
nro
llme
nt
(Th
ou
sa
nd
s)
State/Local Funding plus Tuition Revenues per Student (FTE)Colorado Public Institutions, 1983 - 2008
Net Tuition Revenue per FTE (constant $) Educational Appropriations per FTE (constant $) Public FTE Enrollment
Note: Constant 2008 dollars adjusted by SHEEO Higher Education Cost Adjustment. (HECA) Source:SHEEO SHEF Note: Constant 2008 dollars adjusted by SHEEO Higher Education Cost Adjustment. (HECA) Source:SHEEO SHEF
But not in ColoradoBut not in Colorado Public FTE Enrollment, Educational Appropriations andTotal Educational Revenue per FTE, U.S., Fiscal 1983-2008

-$6,000 -$4,000 -$2,000 $0 $2,000 $4,000 $6,000 $8,000 $10,000
Wyom ingWisconsin
West Vi rg in iaWashington
Vi rg in iaVerm ont
UtahTexas
TennesseeSouth Dakota
South Caro l inaRhode IslandPennsylvania
OregonOklahom a
OhioNorth Dakota
North Carol inaNew York
New MexicoNew Jersey
New Ham pshi reNevada
NebraskaMontanaMissouri
MississippiMinnesota
Mich iganMassachusetts
MarylandMaine
LouisianaKentucky
KansasIowa
IndianaIl l ino is
IdahoHawai i
Georg iaFlorida
DelawareConnecticut
ColoradoCal i f orn iaArkansas
ArizonaAlaska
Alabam a
Rankings and Trends in State/Local Funding per Student (FTE)Divergence from U.S. Average in 2008 and past 25 years
25 Year Average Dif ference
FY 2008 Dif ference
Constant Dollar Difference from U.S. Average
Note: All dollars are adjusted by HECA, Cost of Living Adjustment, and Enrollment Mix.
Source: SHEEO SHEF
-$6,000 -$4,000 -$2,000 $0 $2,000 $4,000 $6,000 $8,000 $10,000
Wyom ingWisconsin
West Vi rg in iaWashington
Virg in iaVerm ont
UtahTexas
TennesseeSouth Dakota
South Carol inaRhode IslandPennsylvania
OregonOklahom a
OhioNorth Dakota
North Carol inaNew York
New MexicoNew Jersey
New Ham pshi reNevada
NebraskaMontanaMissouri
MississippiMinnesota
MichiganMassachusetts
MarylandMaine
LouisianaKentucky
KansasIowa
IndianaIl l ino isIdaho
Hawai iGeorgiaFlorida
DelawareConnecticut
ColoradoCal i f orn iaArkansas
ArizonaAlaska
Alabam a
Rankings and Trends in State/Local Funding per Student (FTE)Divergence from U.S. Average in 2008 and past 25 years
25 Year Average Dif ference
FY 2008 Dif ference
Constant Dollar Difference from U.S. Average
Note: All dollars are adjusted by HECA, Cost of Living Adjustment, and Enrollment Mix.
Source: SHEEO SHEF
-$6,000 -$4,000 -$2,000 $0 $2,000 $4,000 $6,000 $8,000 $10,000
Wyom ingWisconsin
West Vi rg in iaWashington
Vi rg in iaVerm ont
UtahTexas
TennesseeSouth Dakota
South Caro l inaRhode IslandPennsylvania
OregonOklahom a
OhioNorth Dakota
North Carol inaNew York
New MexicoNew Jersey
New Ham pshi reNevada
NebraskaMontanaMissouri
MississippiMinnesota
MichiganMassachusetts
MarylandMaine
LouisianaKentucky
KansasIowa
IndianaIl l ino isIdaho
Hawai iGeorg iaFlorida
DelawareConnecticut
ColoradoCal i f orn iaArkansas
ArizonaAlaska
Alabam a
Rankings and Trends in State/Local Funding per Student (FTE)Divergence from U.S. Average in 2008 and past 25 years
25 Year Average Dif ference
FY 2008 Dif ference
Constant Dollar Difference from U.S. Average
Note: All dollars are adjusted by HECA, Cost of Living Adjustment, and Enrollment Mix.
Source: SHEEO SHEF

-$3,000 -$2,000 -$1,000 $0 $1,000 $2,000 $3,000 $4,000 $5,000 $6,000 $7,000
Wyom ingWisconsin
West Vi rg in iaWashington
Virg in iaVerm ont
UtahTexas
TennesseeSouth Dakota
South Carol inaRhode IslandPennsylvania
OregonOklahom a
OhioNorth Dakota
North Carol inaNew York
New MexicoNew Jersey
New Ham pshi reNevada
NebraskaMontanaMissouri
MississippiMinnesota
MichiganMassachusetts
MarylandMaine
LouisianaKentucky
KansasIowa
IndianaIl l ino isIdaho
Hawai iGeorgiaFlorida
DelawareConnecticut
ColoradoCal i f orn iaArkansas
ArizonaAlaska
Alabam a
Rankings and Trends in Core Revenues per StudentDivergence from U.S. average in 2008 and past 25 years
25 Year Average Dif ference
FY 2008 Dif ference
Note: All dollars are adjusted by HECA, Cost of Living Adjustment, and Enrollment Mix. Total educational revenuedoes not include net tuition revenue used for debt service.
Source: SHEEO SHEF
-$3,000 -$2,000 -$1,000 $0 $1,000 $2,000 $3,000 $4,000 $5,000 $6,000 $7,000
Wyom ingWisconsin
West Vi rg in iaWashington
Vi rg in iaVerm ont
UtahTexas
TennesseeSouth Dakota
South Caro l inaRhode IslandPennsylvania
OregonOklahom a
OhioNorth Dakota
North Carol inaNew York
New MexicoNew Jersey
New Ham pshi reNevada
NebraskaMontanaMissouri
MississippiMinnesota
Mich iganMassachusetts
MarylandMaine
LouisianaKentucky
KansasIowa
IndianaIl l ino is
IdahoHawai i
Georg iaFlorida
DelawareConnecticut
ColoradoCal i f orn iaArkansas
ArizonaAlaska
Alabam a
Rankings and Trends in Core Revenues per StudentDivergence from U.S. average in 2008 and past 25 years
25 Year Average Dif ference
FY 2008 Dif ference
Note: All dollars are adjusted by HECA, Cost of Living Adjustment, and Enrollment Mix. Total educational revenuedoes not include net tuition revenue used for debt service.
Source: SHEEO SHEF
-$3,000 -$2,000 -$1,000 $0 $1,000 $2,000 $3,000 $4,000 $5,000 $6,000 $7,000
Wyom ingWisconsin
West Vi rg in iaWashington
Vi rg in iaVerm ont
UtahTexas
TennesseeSouth Dakota
South Caro l inaRhode IslandPennsylvania
OregonOklahom a
OhioNorth Dakota
North Carol inaNew York
New MexicoNew Jersey
New Ham pshi reNevada
NebraskaMontanaMissouri
MississippiMinnesota
Mich iganMassachusetts
MarylandMaine
LouisianaKentucky
KansasIowa
IndianaIl l ino isIdaho
Hawai iGeorg iaFlorida
DelawareConnecticut
ColoradoCal i f orn iaArkansas
ArizonaAlaska
Alabam a
Rankings and Trends in Core Revenues per StudentDivergence from U.S. average in 2008 and past 25 years
25 Year Average Dif ference
FY 2008 Dif ference
Note: All dollars are adjusted by HECA, Cost of Living Adjustment, and Enrollment Mix. Total educational revenuedoes not include net tuition revenue used for debt service.
Source: SHEEO SHEF

Revenues Per Student from Net Tuition, State, & Local Appropriations Public Research
Revenues Per Student from Net Tuition, State, & Local Appropriations Public Research
Sources: NCES, IPEDS 2006-07 Finance Files; f0607_f1a and f0607_f2 Final Release Data Files. NCES, IPEDS 2007-08 Institutional Characteristics File; hd2007 Final Release Data File. NCES, IPEDS 2006-07 Enrollment Files; ef2006a, effy2007, and efia2007 Final Release Data Files. Via NCHEMS

Revenues Per Student from Net Tuition, State, & Local Appropriations Public Masters and Baccalaureate
Revenues Per Student from Net Tuition, State, & Local Appropriations Public Masters and Baccalaureate
Sources: NCES, IPEDS 2006-07 Finance Files; f0607_f1a and f0607_f2 Final Release Data Files. NCES, IPEDS 2007-08 Institutional Characteristics File; hd2007 Final Release Data File. NCES, IPEDS 2006-07 Enrollment Files; ef2006a, effy2007, and efia2007 Final Release Data Files. Via NCHEMS

Revenues Per Student from Net Tuition, State, & Local Appropriations Public 2-Year
Revenues Per Student from Net Tuition, State, & Local Appropriations Public 2-Year
Sources: NCES, IPEDS 2006-07 Finance Files; f0607_f1a and f0607_f2 Final Release Data Files. NCES, IPEDS 2007-08 Institutional Characteristics File; hd2007 Final Release Data File. NCES, IPEDS 2006-07 Enrollment Files; ef2006a, effy2007, and efia2007 Final Release Data Files. Via NCHEMS

General Operating Revenues Per Student Available to Colorado Community Colleges, 2006-07
General Operating Revenues Per Student Available to Colorado Community Colleges, 2006-07
Gen Op Revenues = State + Local + Net Tuition
Source: NCHEMS NCES IPEDS Finance Survey, 2006-07
ColoradoMtn
College
Aims CC Red Rocks
CC
Arapahoe CC
CC of Aurora
Front Range
CC
Pikes Peak CC
Morgan CC
CC of Denver
Colorado N’western
CC
N’eastern Jr College
Pueblo CC
Otero Jr College
Lamar CC
$20,000
$18,000
$16,000
$14,000
$12,000
$10,000
$8,000
$6,000
$4,000
$2,000
$0

Projected State and Local Budget Surplus (Gap) as a Percent of Revenues, 2016
Projected State and Local Budget Surplus (Gap) as a Percent of Revenues, 2016
Source: NCHEMS; Don Boyd (Rockefeller Institute of Government), 2009 Via NCHEMS

The White Caps on the Third WaveThe White Caps on the Third Wave
Prospects look bleak for much more in the short termNew Normal suggests a very different future than past.Triage often sacrifices the most vulnerable

The Public Policy Response: Here and ElsewhereThe Public Policy Response: Here and Elsewhere
A stimulus package that discouraged innovation and change
A funding structure that inadequately supports equity oriented institutions
Mission creep, which reduces teaching productivity
Tax cuts over tax investments

The Colorado story – Three Huge Converging WavesThe Colorado story – Three Huge Converging Waves
Demographics present a challenge, all else being equal
The finances are perilous
We have been educationally competitive, which has made us economically competitive and comparative just, but:
Were slipping And the good life has not been equitably distributePublic Policy inconsistent with the times or their needs

The Colorado Story – Three Real OpportunitiesThe Colorado Story – Three Real OpportunitiesOpportunity One: Our Economic
Competitiveness
Opportunity Two: Our Changing Demographics
Opportunity Three: Our Revenue Base

The Colorado Story – Three Real OpportunitiesThe Colorado Story – Three Real OpportunitiesOpportunity One: Our Economic
Competitiveness Colorado is relatively wealthy
Among highest Nationally in per capata income In the Nation that remains the wealthiest country in
the World. We have “the financial capacity”

The Colorado Story – Three Real OpportunitiesThe Colorado Story – Three Real OpportunitiesOpportunity Two: Our Changing
DemographicsColorado starts from a reasonably successful base, over allImprovements in serving Hispanic students, will reap huge benefits

The Colorado Story – Three Real OpportunitiesThe Colorado Story – Three Real OpportunitiesOpportunity Two: Our Changing
Demographics Positive Policy Trends
Pay for Outcomes Evidence based Many focused on reducing the Gaps
Renewed focus on smart need-based student financial aid
Preservation New Initiatives
Less is More in the Curriculum Reinvention of Remediation (CAT) Broader adoption of the Equity Scorecard Federal Initiatives – SAFRA & AGI

The Colorado Story – Three Real OpportunitiesThe Colorado Story – Three Real OpportunitiesOpportunity Three: Our revenue base
Colorado Has A Cost Effective System, so investments likely to reap results

Productivity: Total Funding per Degree/Certificate (Weighted*, 2006-2007)
Productivity: Total Funding per Degree/Certificate (Weighted*, 2006-2007)
29,0
75
30,6
19
33,2
73
33,7
56
34,3
30
34,5
94
36,4
98
37,8
23
38,3
64
38,3
65
39,5
16
39,5
16
39,9
18
42,1
77
42,1
98
42,4
08
42,6
93
42,8
47
42,8
73
42,9
48
43,8
20
44,2
72
44,3
71
45,8
33
45,9
04
46,5
22
46,8
80
47,4
53
47,6
72
47,7
49
48,6
11
49,8
94
52,4
91
52,5
72
52,8
88
53,5
35
54,5
53
56,0
90
56,2
80
56,8
88
56,9
60
59,4
20
59,4
65
63,8
22
64,9
34
65,9
75
66,6
23
72,8
46
75,7
44
79,7
94
86,0
09
-
10,000
20,000
30,000
40,000
50,000
60,000
70,000
80,000
90,000
100,000
FloridaC
oloradoW
ashingtonU
tahN
orth Dakota
Oklahom
aW
est Virginia
Montana
South Dakota
KansasG
eorgiaLouisianaW
isconsinIdahoN
ew H
ampshire
IllinoisM
ississippiA
rizonaA
rkansasM
innesotaO
regonKentuckyIow
aV
irginiaM
issouriN
ation
Ohio
IndianaN
ebraskaTexasSouth C
arolinaN
orth Carolina
Michigan
TennesseeN
ew M
exicoC
aliforniaM
ainePennsylvaniaA
labama
New
YorkN
evadaM
arylandVerm
ontN
ew Jersey
Massachusett
sH
awaii
Connecti
cutR
hode IslandD
elaware
Wyom
ingA
laska
Tuition and FeesState and Local
Sources: SHEEO State Higher Education Finance Survey 2008; NCES, IPEDS Completions Survey; U.S. Census Bureau, American Community Survey (Public Use MicrodataSamples)
*Adjusted for value of degrees in the state employment market (median earnings by degree type and level)
Sources: SHEEO State Higher Education Finance Survey 2008; NCES, IPEDS Completions Survey; U.S. Census Bureau, American Community Survey (Public Use Microdata Samples)

State Tax Capacity & EffortIndexed to U.S. AverageState Tax Capacity & EffortIndexed to U.S. Average
Source: State Higher Education Executive Officers (SHEEO)
AL
AK
AZ
AR
CACO
CT
DE
GA HI
IL
IN IAKS
KYLA
ME
MD
MA
MS
MT
NE
NV
NJ
NY
NC
ND
OH
OK
PA
RI
SC
SD
UT
VT
VA
WA
FL
ID
MI
MN
MO
NH
NM
TNTX
WV
WI
WY
0.6
0.7
0.8
0.9
1.0
1.1
1.2
1.3
1.4
1.5
1.6
1.7
0.6 0.8 1.0 1.2 1.4
Sta
te T
ax C
apacity
(Tota
l Taxable
Reso
urce
s Per C
apita
)
State Tax Effort (Effective Tax Rate)
US
OR

The Colorado Story – The Colorado Story –
Perfect Storm

The Colorado Story – The Colorado Story –
Perfect Storm, orPerfect Opportunity
Our Choice


