

The PeW ChariTable TrusTs eConomiC mobiliTy ProjeCT
Economic Mobility Across Generations
Pursuing the American Dream:

July 2012
The Pew Charitable Trusts is driven by the power of knowledge to solve today’s most challenging problems. Pew applies a rigorous, analytical approach to improve public policy, inform the public and stimulate civic life.
By forging broad, nonpartisan agreement on the facts and drivers of mobility, the Economic Mobility Project fosters policy debate and action on how best to improve economic opportunity and ensure that the American Dream is kept alive for future generations.
Team members
Susan K. Urahn, Managing Director, Pew Center on the StatesErin Currier, Project Manager, Economic Mobility ProjectDiana Elliott, Research Manager, Economic Mobility ProjectLauren Wechsler, Senior Associate, Economic Mobility ProjectDenise Wilson, Senior Associate, Economic Mobility ProjectDaniel Colbert, Administrative Assistant, Economic Mobility Project
The PeW CenTer on The sTaTes
The analysis and recommendations included in this report are solely those of The Pew Charitable Trusts and do not necessarily reflect the views of outside reviewers.
aCKnoWleDGemenTs
Analysis for the report was conducted by Leonard Lopoo, associate professor of Public Administration and International Affairs of Syracuse University, and Thomas DeLeire, director of the La Follette School of Public Affairs of the University of Wisconsin-Madison.
The Economic Mobility Project thanks all team members, Laura Fahey, Kimberly Furdell, Harry Holzer, Samantha Lasky, Susan Mayer, and Liz Voyles for providing valuable feedback on the report. Design expertise was provided by Willie/Fetchko Graphic Design, Carla Uriona, and Evan Potler.
The report benefited from the insights and expertise of two external reviewers, Angela Fertig, an assistant professor in the Department of Public Administration and Policy at the University of Georgia; and Deirdre Bloome, a doctoral candidate in Sociology and Social Policy at Harvard University. Although they have reviewed the report, neither they nor their organizations necessarily endorse its findings or conclusions.
This report is intended for educational and informational purposes.
For additional information on The Pew Charitable Trusts and the Economic Mobility Project, please visit www.economicmobility.org or email us at [email protected].
©July 2012 The Pew Charitable Trusts. All Rights Reserved.
901 E Street NW, 10th Floor 2005 Market Street, Suite 1700 Washington, DC 20004 Philadelphia, PA 19103

The Pew ChariTable TrusTsiii
Table of Contents
introduction and Key Findings . . . . . . . . . . . . . . . . . . . . . . . . . . . . . . . . . . . . 1
Chart book . . . . . . . . . . . . . . . . . . . . . . . . . . . . . . . . . . . . . . . . . . . . . . . . . . . 4
Family income . . . . . . . . . . . . . . . . . . . . . . . . . . . . . . . . . . . . . . . . . . . . . . 4
Family wealth . . . . . . . . . . . . . . . . . . . . . . . . . . . . . . . . . . . . . . . . . . . . . 13
Mobility by race . . . . . . . . . . . . . . . . . . . . . . . . . . . . . . . . . . . . . . . . . . . 18
Mobility by education . . . . . . . . . . . . . . . . . . . . . . . . . . . . . . . . . . . . . . . 23
Conclusion . . . . . . . . . . . . . . . . . . . . . . . . . . . . . . . . . . . . . . . . . . . . . . . . 27
appendix . . . . . . . . . . . . . . . . . . . . . . . . . . . . . . . . . . . . . . . . . . . . . . . . . . . . 28
endnotes . . . . . . . . . . . . . . . . . . . . . . . . . . . . . . . . . . . . . . . . . . . . . . . . . . . . 33

1 Pursuing The aMeriCan DreaM: eConoMiC MobiliTy aCross generaTions
Introduction and Key FindingsThe ideal that all Americans have equality of opportunity regardless of their economic status at birth is the crux of the American Dream and a defining element of our national psyche. This study investigates the health and status of that dream by analyzing economic mobility—Americans’ movement up and down the economic ladder—during the past generation. Pursuing the American Dream: Economic Mobility Across Generations is an update to the Economic Mobility Project’s (EMP) foundational work, Getting Ahead or Losing Ground: Economic Mobility in America, originally released in 2008.1
This chart book moves the project’s work forward in two ways. First, the income mobility estimates have been adjusted for family size to account for shifts in family demographics across generations.2 Second, the analyses now include mobility estimates of personal earnings and family wealth in addition to family income. Using Panel Study of Income Dynamics (PSID) data through 2009, the study provides the most current estimates of mobility and the first estimates that overlap with the recession.
Pursuing the American Dream looks closely at the mobility experiences of Americans on different rungs of the economic ladder, divided into five equal parts or quintiles. The study measures mobility in two ways. Absolute mobility measures whether a person has more or less income, earnings, or wealth than his or her parents did at the same age.3 Relative mobility measures a person’s rank on the income, earnings, or wealth ladder compared to his or her parents’ rank at the same age.
Descriptive information on how the distribution of income and wealth has changed between the parents’ and children’s generations also is included. While information about aggregate changes across generations does not capture the unique experience of any one parent-child pair, it does provide important context about how the economic environment in which people strive to climb the ladder has changed over the past generation.
Considering both absolute and relative mobility together and in the context

2 The Pew ChariTable TrusTs
INTRODUCTION AND KEY FINDINGS
of changing distributions is essential to understanding the full picture of opportunity in America.
Family incomeThe vast majority of Americans have higher family incomes than their parents did.4
■ Eighty-four percent of Americans have higher family incomes than their parents had at the same age, and across all levels of the income distribution, this generation is doing better than the one that came before it.
■ Ninety-three percent of Americans whose parents were in the bottom fifth of the income ladder and 88 percent of those whose parents were in the middle quintile exceed their parents’ family income as adults.
Americans raised at the bottom and top of the family income ladder are likely to remain there as adults, a phenomenon known as “stickiness at the ends.”
■ While a majority of Americans exceed their parents’ family incomes, the extent of that increase is not always enough to move them to a different rung of the family income ladder.
■ Forty-three percent of Americans raised in the bottom quintile remain stuck in the bottom as adults, and
70 percent remain below the middle. Forty percent raised in the top quintile remain at the top as adults, and 63 percent remain above the middle.
■ Only 4 percent of those raised in the bottom quintile make it all the way to the top as adults, confirming that the “rags-to-riches” story is more often found in Hollywood than in reality. Similarly, just 8 percent of those raised in the top quintile fall all the way to the bottom.
Family wealthHalf of Americans surpass their parents in terms of family wealth.5
■ Fifty percent of Americans have greater wealth than their parents did at the same age.
■ Seventy-two percent of Americans whose parents were in the bottom fifth of the wealth ladder and 55 percent of those whose parents were in the middle quintile exceed their parents’ family wealth as adults.
There is stickiness at the ends of the wealth ladder.
■ Sixty-six percent of those raised in the bottom of the wealth ladder remain on the bottom two rungs themselves, and 66 percent of those raised in the top of the wealth ladder remain on the top two rungs.

3 Pursuing The aMeriCan DreaM: eConoMiC MobiliTy aCross generaTions
INTRODUCTION AND KEY FINDINGS
Mobility by raceBlacks have a harder time exceeding the family income and wealth of their parents than do whites.
■ Sixty-six percent of blacks raised in the second quintile surpass their parents’ family income compared with 89 percent of whites.
■ Only 23 percent of blacks raised in the middle surpass their parents’ family wealth compared with over half (56 percent) of whites.
Blacks are more likely to be stuck in the bottom and fall from the middle than are whites.
■ Over half of blacks (53 percent) raised in the bottom of the family income ladder remain stuck in the bottom as adults, compared with only a third (33 percent) of whites. Half of blacks (56 percent) raised in the middle of the family income ladder fall to the bottom two rungs as adults compared with just under a third of whites (32 percent).
■ Half of blacks (50 percent) raised in the bottom of the family wealth ladder remain stuck in the bottom as adults, compared with only a third (33 percent) of whites. More than two-thirds of blacks (68 percent) raised in the middle fall to the bottom two rungs of the ladder as adults compared with just under a third of whites (30 percent).
Mobility by educationA four-year college degree promotes upward mobility from the bottom and prevents downward mobility from the
middle and top.
■ Almost one-half (47 percent) of those raised in the bottom quintile of the family income ladder who do not earn a college degree are stuck there as adults, compared with 10 percent who do earn a college degree. Similarly, 45 percent without a college degree are stuck in the bottom of the family wealth ladder compared with 20 percent with a degree.
■ Having a college degree makes a person more than three times more likely to rise from the bottom of the family income ladder all the way to the top, and makes a person more than four times more likely to rise from the bottom of the family wealth ladder to the top.
■ Thirty-nine percent raised in the middle of the family income ladder who do not get a college degree fall from the middle, compared with less than a quarter (22 percent) of those with a degree. Similarly, 39 percent raised in the middle of the family wealth ladder who do not earn a degree fall down the wealth ladder, compared with 19 percent with a degree.

4 The Pew ChariTable TrusTs
Eighty-four Percent of Americans Exceed their Parents’ Family Income Percent with family income above their parents, by parents’ quintile
Figure 1
0 20 40 60 80 1000% 20% 40% 60% 80% 100%
Raised in Top Quintile
Raised in Fourth Quintile
Raised in Middle Quintile
Raised in Second Quintile
Raised in Bottom Quintile
All Adult Children 84%
70%
85%
88%
86%
93%
Percent with Higher Family Income than their Parents
Chart Book
Note: Income is adjusted for family size.
Family incomeFamily income is one of the most common ways economic mobility is measured. Family income includes all taxable income (such as earnings, interest, and dividends) and cash transfers (such as Social Security and welfare) of all family members.6 These estimates are adjusted for inflation and for family size.
Americans’ absolute mobility by family income shows a glass half full.
Eighty-four percent of Americans have higher family incomes than their parents did, and across all levels of the income distribution, this generation is doing better than the one that came before it. In fact, those at the bottom of the income ladder are the most likely to exceed their parents’ income as adults—93 percent do so.

Pursuing The aMeriCan DreaM: eConoMiC MobiliTy aCross generaTions5
FAMILY INCOME
The Size of Absolute Mobility Gains and Losses Differs Across the Income LadderChange in family income, by parents’ quintile
Figure 2
Dif
fere
nce
Bet
wee
n P
aren
t an
d C
hild
Fam
ily In
com
e
-$100K
$0
$100K
$200K
$300K
$400K
adult children’s losses under parents
adult children’s gains over parents
Top Quintile
Fourth Quintile
Middle Quintile
Second Quintile
Bottom Quintile
adult children with the same income as parents
The darker the color gradient, the more people represented at each point.
Notes: Income is adjusted for family size. Six observations above $400,000 and two observations below -$100,000 were removed from the analysis for scaling purposes.
However, the magnitude of income changes varies across the income distribution.
At all levels, Americans are likely to exceed their parents’ family incomes, but the extent of their income growth varies by quintile. Americans raised in the bottom who surpass their parents’ incomes do so by the smallest absolute amounts, while Americans raised in the top who surpass their parents’ incomes do so by the largest absolute amounts. Figure 2 displays changes in Americans’ family income compared with their parents’, depending on the income quintile in which they were raised. Adult children whose family income is no different from their parents’ are shown at the $0 mark.

6 The Pew ChariTable TrusTs
FAMILY INCOME
Americans Raised at the Top and Bottom Are Likely to Stay There as Adults Chances of moving up or down the family income ladder, by parents’ quintile
Figure 3
0%
20%
40%
60%
80%
100%
0
20
40
60
80
100
120
Per
cent
of
Ad
ult
Chi
dre
n in
Eac
h Fa
mily
Inco
me
Qui
ntile
Bottom Quintile
Second Quintile
Middle Quintile
Fourth Quintile
Top Quintile
Percent of Adult Children with Income in the:
Top Quintile
Fourth Quintile
Middle Quintile
Second Quintile
Bottom Quintile
43%
27%
17%
9%
4%
25%
24%
18%
20%
14%
14%
20%
23%
24%
19%
9%
20%
23%
24%
24%
8%
10%
19%
23%
40%
43% are stuck at the bottom
40% are stuck at the top
Parents’ Family Income Quintile
Americans’ relative mobility outcomes by family income show a glass half empty.
Americans raised at the top and bottom of the income ladder are likely to remain there themselves as adults. Forty-three percent of those who start in the bottom are stuck there as adults, and 70 percent remain below the middle quintile. Only 4 percent of adults raised in the bottom make it all the way to the top, showing that the “rags-to-riches” story is more often found in Hollywood than in reality. At the other end of the ladder, 40 percent of those raised in the top stay there as adults, and 63 percent remain above the middle quintile.
This lack of relative mobility is called “stickiness at the ends” because those at the ends of the income distribution tend to be stuck there over a generation. By contrast, those raised in the middle income quintile come closer to experiencing mathematically perfect mobility, in which they are equally likely to end up in each quintile of the distribution.
Note: Numbers are adjusted for family size.
7 Pursuing The aMeriCan DreaM: eConoMiC MobiliTy aCross generaTions
FAMILY INCOME
Why do more Americans experience upward absolute mobility than upward relative mobility?
The rungs of the income ladder have widened during the past generation, reflecting economic growth at all levels, but especially at the top. Median income in the bottom income quintile increased by 74 percent between the two generations, compared with 126 percent in the top income quintile (see Figure 4). The difference between the size of the rungs between the two generations means that while the vast majority of Americans exceeded their parents’ family incomes, the extent of that increase—particularly at the bottom—was not always enough to move them to a different rung of the income ladder.

8 The Pew ChariTable TrusTs
FAMILY INCOME
Growth Has Occured at Every Rung of the Ladder But Has Been Largest at the TopChange in the overall income distribution from parents’ generation to children’s generation
Figure 4
Top Quintile
Fourth Quintile
Middle Quintile
Second Quintile
Bottom Quintile
Parents’ Generation Children’s Generation
Fam
ily In
com
e (
20
08
do
llars
)
$39,800 AND ABOVE
$30,300–$39,800$23,400–$30,300$15,600–$23,400
LESS THAN $15,600
$81,700 AND ABOVE
$59,300–$81,700
$44,000–$59,300
$28,900–$44,000
LESS THAN $28,900
MEDIANS
$49,075
$34,596$27,036$20,010
$11,064
MEDIANS
$111,115
$68,539
$51,177
$36,969
$19,202
0
50000
100000
150000
200000
250000
300000
0
50000
100000
150000
200000
250000
300000
$0
$50,000
$100,000
$150,000
$200,000
$250,000
$300,000
126%
98%
89%
85%
74%
Notes: Numbers are adjusted for family size. Each quintile contains 20 percent of the weighted sample. The dashed line represents the 95th percentile of the PSID sample.

Pursuing The aMeriCan DreaM: eConoMiC MobiliTy aCross generaTions9
FAMILY INCOME
Most Americans Experience Absolute Upward Mobility but Few Experience Relative Upward MobilityChances of experiencing both absolute and relative mobility, by parents’ quintile
Figure 5
Parents’ Family Income Quintile
Bottom Second Middle Fourth Top All Quintile Quintile Quintile Quintile Quintile Families
57% 51% 43% 24% N/A1 35%
36% 24% 23% 24% 38% 29%
N/A2 11% 21% 36% 32% 20%
7% 14% 12% 15% 30% 16%
Upwardly mobileHigher income and up 1 or more quintiles
Riding the rising tideHigher income and same quintile
Falling despite the rising tideHigher income and down 1 quintile
Downwardly mobileLower income and lower/same quintile
Ad
ult
Chi
ldre
n
Notes: Numbers are adjusted for family size. Numbers in each column may not sum to 100 percent due to rounding.
1 Those in the top quintile cannot meet this definition of “upwardly mobile” because there is no quintile above the top quintile. 2 Those in the bottom quintile cannot meet this definition of “falling despite the rising tide” because there is no quintile below the
bottom quintile.
Analyzing both absolute and relative mobility is necessary for understanding mobility in America.
Looking at both absolute and relative mobility demonstrates why the picture of mobility in America shows a glass both half full and half empty.
On the one hand, more than one-third of Americans are upwardly mobile, defined here as experiencing gains in both absolute and relative mobility. Thirty-five percent of Americans have higher income and move up at least one rung on the ladder relative to their parents. Moreover, a minority of Americans—only 16 percent—are downwardly mobile, defined here as experiencing downward absolute mobility and having static or downward relative mobility (i.e. either remaining in the same quintile or moving down).
However, gains in absolute mobility are not always enough to propel Americans up the ladder. Thirty-six percent of those who start in the bottom experience absolute mobility gains but are still stuck in the bottom quintile as adults. Moreover, across the distribution, 20 percent of Americans are “falling despite the rising tide”—they make more money than their parents did, but have actually fallen to a lower rung of the income ladder. Another 29 percent have higher family incomes but are at the same place on the income ladder as their parents were.
Absolute income gains combined with relative stickiness at the ends underscore why looking at both absolute and relative mobility is so critical for understanding opportunity in America.

The Pew ChariTable TrusTs10
FAMILY INCOME
Most Sons Meet or Exceed the Earnings of their FathersPercent with personal earnings above their fathers, by fathers’ quintile
Figure 6
0 20 40 60 80 1000% 20% 40% 60% 80% 100%
Raised in Top Quintile
Raised in Fourth Quintile
Raised in Middle Quintile
Raised in Second Quintile
Raised in Bottom Quintile
All Adult Sons 59%
46%
52%
51%
59%
85%
Percent with Higher Personal Earnings than their Fathers
Examining earnings mobility provides a deeper understanding of income mobility.
Personal earnings are a component of family income based on one family member’s salary or wages from employment. Personal earnings provide greater insight into the importance of employment-based wages for economic mobility.7
The measures below compare sons in the children’s generation to fathers in the parents’ generation. This is the most accurate “apples to apples” comparison that can be done intergenerationally because women’s labor force participation rates have grown dramatically during the past generation. Comparing daughters’ earnings to their mothers’ earnings could overstate the gains made by women in the past generation, while comparing daughters’ earnings to their fathers’ could understate women’s gains.
Most sons are meeting or exceeding their fathers’ earnings in absolute terms.
Overall, 59 percent of sons earn more than their fathers did at the same age, and only in the top quintile do less than half of sons exceed their fathers’ earnings. Among sons raised in the bottom, 85 percent exceed their fathers’ earnings. Sons raised in the middle and fourth earnings quintiles are about equally likely to make more than their fathers as they are to make less.
Pursuing The aMeriCan DreaM: eConoMiC MobiliTy aCross generaTions11
FAMILY INCOME
Sons Raised in the Top Are the Most Likely to Stay in their Fathers’ Earnings Group Chances of moving up or down the personal earnings ladder, by fathers’ quintile
Figure 7
0
20%
40%
60%
80%
100%
Per
cent
of
Ad
ult
Sons
in E
ach
Per
sona
l Ear
ning
s Q
uint
ile
Bottom Quintile
Second Quintile
Middle Quintile
Fourth Quintile
Top Quintile
Percent of Adult Sons with Earnings in the:
Top Quintile
Fourth Quintile
Middle Quintile
Second Quintile
Bottom Quintile
31%
26%
23%
15%
4%
29%
22%
21%
19%
9%
17%
24%
21%
19%
18%
11%
17%
20%
26%
25%
12%
9%
14%
22%
43%
31% are stuck at the bottom
43% are stuck
at the top
Fathers’ Earnings Quintile
0
20
40
60
80
100
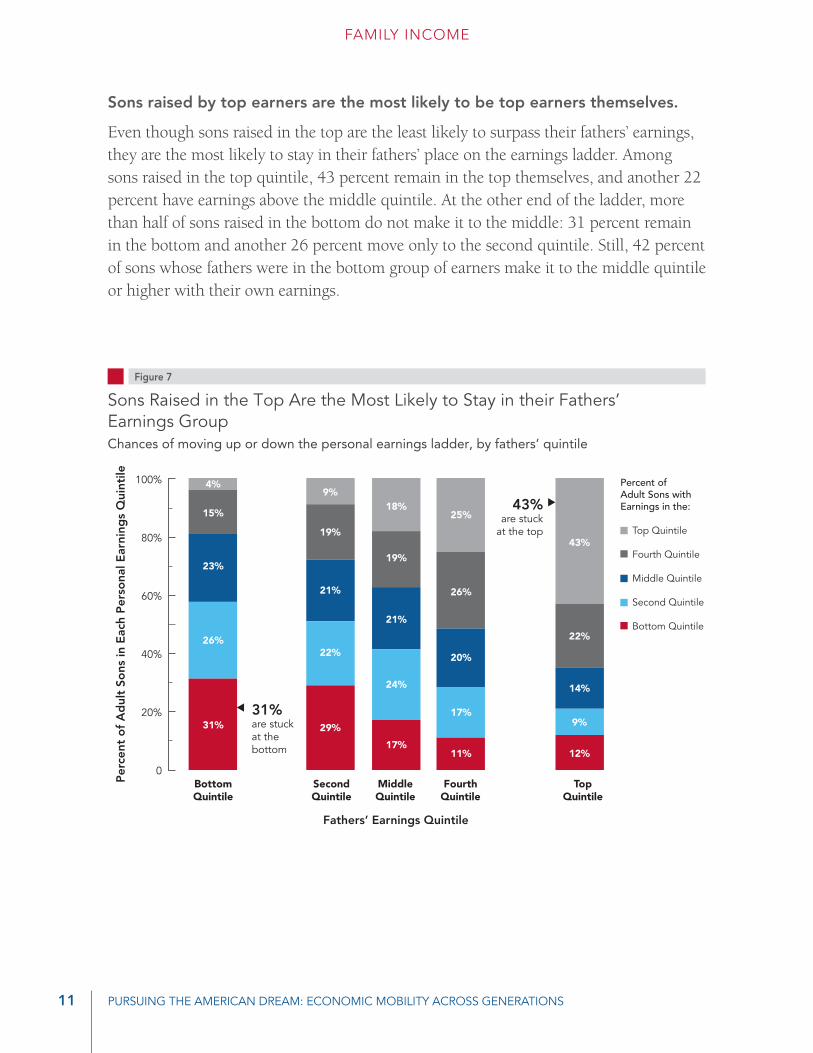
Sons raised by top earners are the most likely to be top earners themselves.
Even though sons raised in the top are the least likely to surpass their fathers’ earnings, they are the most likely to stay in their fathers’ place on the earnings ladder. Among sons raised in the top quintile, 43 percent remain in the top themselves, and another 22 percent have earnings above the middle quintile. At the other end of the ladder, more than half of sons raised in the bottom do not make it to the middle: 31 percent remain in the bottom and another 26 percent move only to the second quintile. Still, 42 percent of sons whose fathers were in the bottom group of earners make it to the middle quintile or higher with their own earnings.

The Pew ChariTable TrusTs12
FAMILY INCOME
Men’s Earnings in the Parents’ Generation Contributed More to Family IncomeAverage proportion of family income represented by male earnings
Figure 8
Fathers
Sons
75%
61%
0% 20% 40% 60% 80% 100%
0 10 20 30 40 50 60 70 80 90 100
75%
61%
Fathers
Sons
Percent of Family Income Represented by Male Earnings
Per
cent
age
wit
h H
ighe
r In
com
e th
an t
heir
Par
ents
Mobility is a family enterprise.
One of the most striking changes that has occurred between the fathers’ and sons’ generations has been the degree to which women, specifically married women, have increased their participation in the labor force. Concurrent with this shift has been a slowdown in men’s earnings gains and thus the reduction of men’s contributions to overall family income. In the parents’ generation, fathers’ earnings constituted three-quarters of total family income. Today, men’s earnings still constitute the majority of total family income, but their share has dropped to 61 percent.8 In other words, for many families, experiencing upward family income mobility requires a couple’s combined earnings.
Another trend to consider when examining the different patterns for income and earnings mobility is that men and women are increasingly partnering with those who are more like them than not, meaning high earners are forming unions with other high earners. Consequently, the family income of a combined high-earning couple is markedly higher than that of a low-earning one, contributing to the “stickiness at the ends” seen in family income measures.
Pursuing The aMeriCan DreaM: eConoMiC MobiliTy aCross generaTions13
FAMILY WEALTH
Half of Americans Exceed their Parents' Family Wealth Percent with family wealth above their parents, by parents’ quintile
Figure 9
0 20 40 60 80 1000% 20% 40% 60% 80% 100%
Raised in Top Quintile
Raised in Fourth Quintile
Raised in Middle Quintile
Raised in Second Quintile
Raised in Bottom Quintile
All Adult Sons 50%
25%
45%
55%
51%
72%
Percent with Higher Family Wealth than their Parents
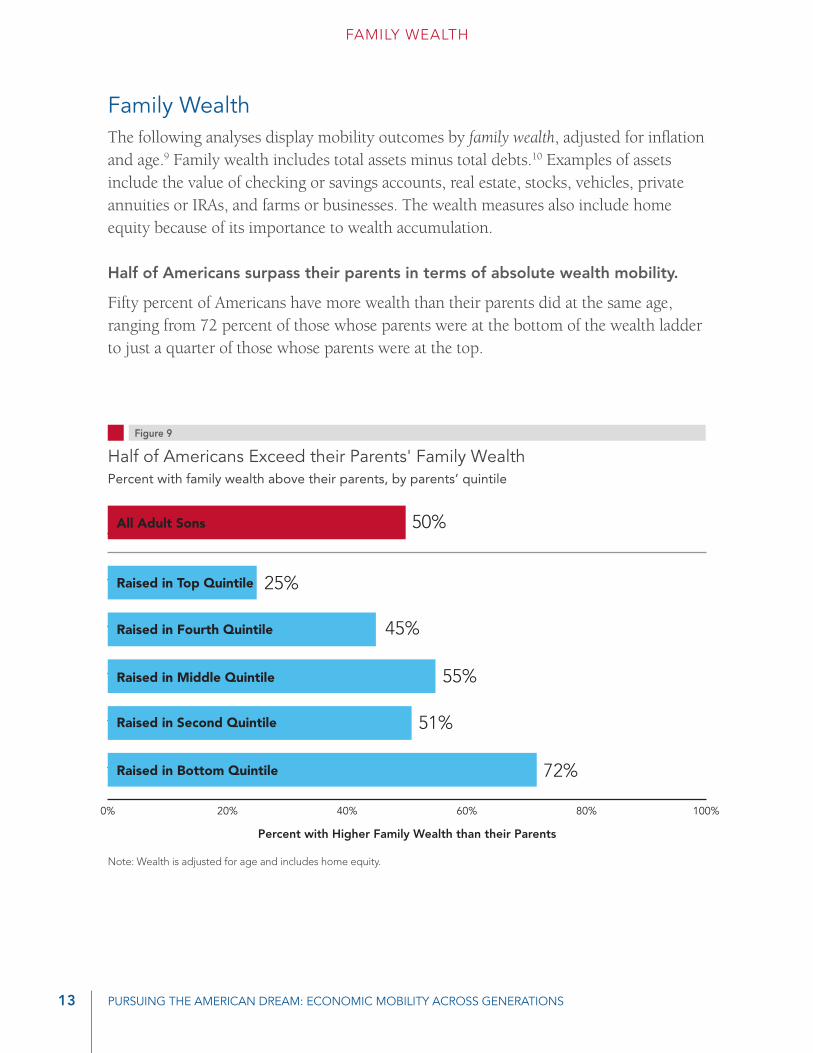
Family wealthThe following analyses display mobility outcomes by family wealth, adjusted for inflation and age.9 Family wealth includes total assets minus total debts.10 Examples of assets include the value of checking or savings accounts, real estate, stocks, vehicles, private annuities or IRAs, and farms or businesses. The wealth measures also include home equity because of its importance to wealth accumulation.
Half of Americans surpass their parents in terms of absolute wealth mobility.
Fifty percent of Americans have more wealth than their parents did at the same age, ranging from 72 percent of those whose parents were at the bottom of the wealth ladder to just a quarter of those whose parents were at the top.
Note: Wealth is adjusted for age and includes home equity.

The Pew ChariTable TrusTs14
FAMILY WEALTH
Americans Raised in the Top Have the Most Variation in Wealth Relative to their ParentsChange in family wealth, by parents’ quintile
Figure 10
Dif
fere
nce
Bet
wee
n P
aren
t an
d C
hild
Fam
ily W
ealt
h
adult children’s losses under parents
adult children’s gains over parents
Top Quintile
Fourth Quintile
Middle Quintile
Second Quintile
Bottom Quintile
adult children with the same wealth as parents
1 2 3 4 5
-4000000
-3500000
-3000000
-2500000
-2000000
-1500000
-1000000
-500000
0
500000
1000000
1500000
2000000
2500000
3000000
3500000
4000000
$-4M
$-3M
$-2M
$-1M
$0
$1M
$2M
$3M
$4M
Americans Raised in the Top Have the Most Variation in Wealth Relative to Their Parents’Change in family wealth, by parents’ quintile
Figure 10
$-4M
$-3M
$-2M
$-1M
$0
$1M
$2M
$3M
$4M
Dif
fere
nce
Bet
wee
n P
aren
t an
d C
hild
Wea
lth
The darker the color gradient, the more people represented at each point.
Note: Wealth is adjusted for age and includes home equity. Four observations above $5,000,000 and five observations below -$5,000,000 were removed from the analysis for scaling purposes.
Americans raised in the top of the wealth distribution have the most variation in wealth relative to their parents.
Those raised in the top quintile of the wealth ladder have the greatest range in their own wealth quintile as adults, with many holding fewer assets than the previous generation (shown in Figure 10 by the concentration of wealth losses below the $0 line). Of course, those whose parents were at the top of the wealth distribution face the highest bar to exceed their parents’ wealth, at $270,218 or more.
By contrast, Americans raised at the bottom of the wealth ladder are the most likely to have more wealth than their parents did, in part because their parents had few or no assets. In the parents’ generation, the bottom wealth quintile contained people with less than $31,110 in wealth. Of note, 5.6 percent of those in the parents’ generation reported having less than $1,000 in family assets, demonstrating that the bar for surpassing the previous generation’s wealth was much lower still in some families.
Pursuing The aMeriCan DreaM: eConoMiC MobiliTy aCross generaTions15
FAMILY WEALTH
Family Wealth is Sticky at the Top and Bottom of the Ladder Chances of moving up or down the family wealth ladder, by parents’ quintile
Figure 11
0
20%
40%
60%
80%
100%
Per
cent
of
Ad
ult
Chi
dre
n in
Eac
h Fa
mily
Wea
lth
Qui
ntile
Bottom Quintile
Second Quintile
Middle Quintile
Fourth Quintile
Top Quintile
Percent of Adult Children with Wealth in the:
Top Quintile
Fourth Quintile
Middle Quintile
Second Quintile
Bottom Quintile
41%
25%
17%
10%
8%
27%
30%
19%
14%
10%
15%
17%
26%
24%
17%
11%
17%
23%
27%
23%
7%
11%
16%
25%
41%
41% are stuck at the bottom
41% are stuck
at the top
Parents’ Family Wealth Quintile
0
20
40
60
80
100
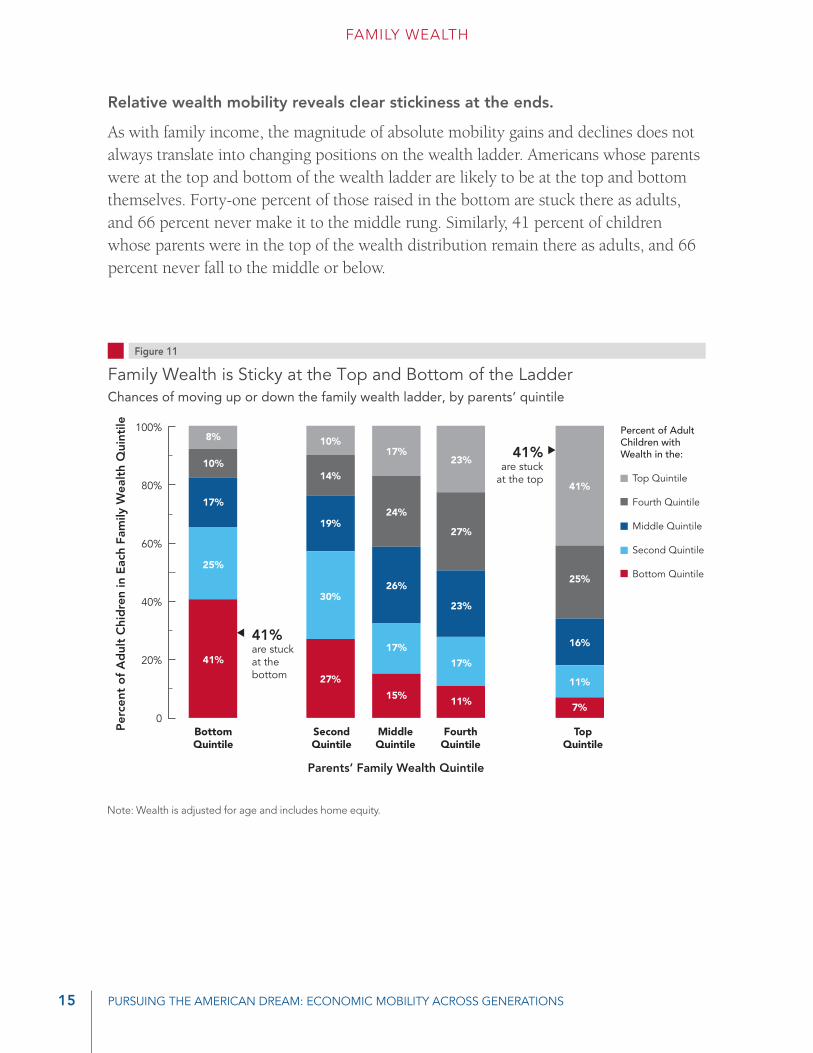
Relative wealth mobility reveals clear stickiness at the ends.
As with family income, the magnitude of absolute mobility gains and declines does not always translate into changing positions on the wealth ladder. Americans whose parents were at the top and bottom of the wealth ladder are likely to be at the top and bottom themselves. Forty-one percent of those raised in the bottom are stuck there as adults, and 66 percent never make it to the middle rung. Similarly, 41 percent of children whose parents were in the top of the wealth distribution remain there as adults, and 66 percent never fall to the middle or below.
Note: Wealth is adjusted for age and includes home equity.

16 The Pew ChariTable TrusTs
FAMILY WEALTH
The bottom three rungs of the wealth ladder have compressed during the past generation.
As with family income mobility, investigating the changing shape of the overall wealth distribution over time puts the absolute and relative wealth mobility findings in context (see Figure 12). During the past generation, the amount of wealth held by people at each rung of the ladder has diverged: Wealth has decreased at the bottom and middle and has increased at the top two rungs of the ladder. The wealth compression is especially notable at the bottom: Median wealth for those in the lowest wealth quintile decreased from just under $7,500 in the parents’ generation to less than $2,800 in the children’s generation. Conversely, at the top of the wealth distribution, median wealth increased from just under $500,000 in the parents’ generation to almost $630,000 in the children’s generation.

Pursuing The aMeriCan DreaM: eConoMiC MobiliTy aCross generaTions17
FAMILY WEALTH
LESS THAN$31,100
Wealth Has Declined at the Bottom and Middle and Risen at the TopChange in the overall wealth distribution from parents’ generation to children’s generation
Figure 12
Top Quintile
Fourth Quintile
Middle Quintile
Second Quintile
Bottom Quintile
Parents’ Generation Children’s Generation
Fam
ily W
ealt
h (2
00
8 d
olla
rs)
$270,000 AND ABOVE
$142,400–$270,000
$85,000–$142,400
$367,100 AND ABOVE
$164,200–$367,100
$73,100–$164,200LESS THAN $20,300
$189,429
$116,792$55,937$7,439
MEDIANS
$629,853
$244,879
$111,008 $44,653 $2,748
0
500000
1000000
1500000
2000000
2500000
3000000
27%
29%
-5%-20%-63%
MEDIANS
$495,510
$31,100–$85,000 $20,300–$73,100$0
$0.5M
$1.0M
$1.5M
$2.0M
$2.5M
$3.0M
Notes: Wealth is adjusted for age and includes home equity. Each quintile contains 20 percent of the weighted sample. The dashed line represents the 95th percentile of the PSID sample.

The Pew ChariTable TrusTs
Mobility by raceThe mobility estimates reported in the prior sections focus on all Americans; however, when further analyzed by race, striking differences emerge.11
Blacks are much more likely to be raised at the bottom of the family income and wealth ladders than are whites.
Before reviewing differences in mobility by race, it is important to note that the percentage of blacks and whites raised at the top and bottom of the income and wealth ladders differs dramatically. Just over two-thirds (65 percent) of blacks were raised at the bottom of the income ladder compared with only 11 percent of whites. The same pattern exists for family wealth: 57 percent of blacks were raised at the bottom, but only 14 percent of whites were. At the other end of the income and wealth ladders, almost one-quarter (23 percent) of whites were raised at the top versus only 2 percent of blacks.
In fact, the percentage of black families at the top two rungs of the family income and wealth ladders is so small that median and absolute mobility estimates cannot be calculated with statistical certainty. Therefore, the absolute mobility and median wealth figures report mobility estimates for blacks only on the bottom three rungs of the ladder.
18
MOBILITY BY RACE
Blacks Are More Likely to Start in the Bottom of the Income and Wealth DistributionsPercentage of Americans raised in each quintile, by race
Figure 13
Raised in Top Quintile 2% 23% 2% 23%
Raised in Fourth Quintile 7% 23% 6% 22%
Raised in Middle Quintile 8% 22% 7% 23%
Raised in Second Quintile 18% 21% 28% 19%
Raised in Bottom Quintile 65% 11% 57% 14%
Black White Black White
Family Income Family Wealth
Notes: Income is adjusted for family size. Wealth is adjusted for age and includes home equity. Numbers in each column may not sum to 100 percent due to rounding.
Pursuing The aMeriCan DreaM: eConoMiC MobiliTy aCross generaTions19
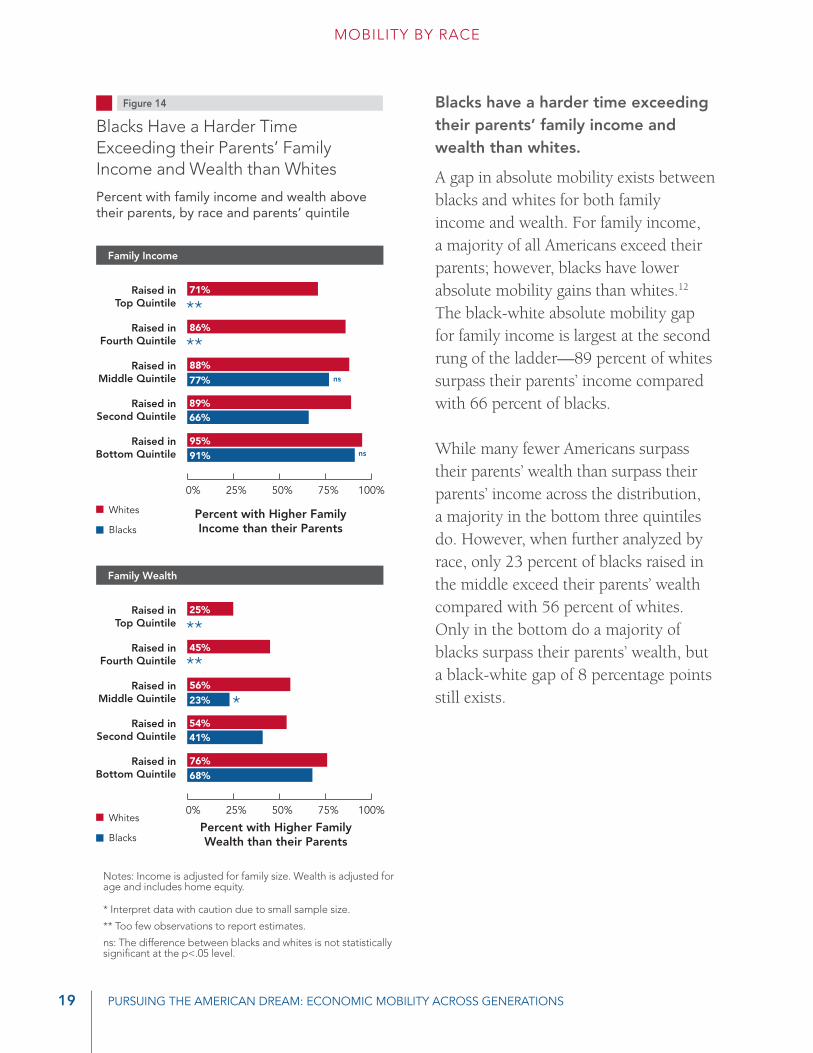
MOBILITY BY RACE
Blacks Have a Harder Time Exceeding their Parents’ Family Income and Wealth than Whites
Percent with family income and wealth above their parents, by race and parents’ quintile
Figure 14
Family Income
Percent with Higher Family Income than their Parents
Raised inTop Quintile
Raised inFourth Quintile
Raised inMiddle Quintile
Raised inSecond Quintile
Raised inBottom Quintile
**
0 25 50 75 1000% 25% 50% 75% 100%
**
71%
86%
88%
77%
89%66%
95%91%
Family Wealth
Percent with Higher Family Wealth than their Parents
Raised inTop Quintile
Raised inFourth Quintile
Raised inMiddle Quintile
Raised inSecond Quintile
Raised inBottom Quintile
**
**
25%
45%
56%
23%
54%41%
76%68%
0 20 40 60 80 100
15%
Whites
Blacks
Whites
Blacks
0% 25% 50% 75% 100%
*
*
ns
ns
Notes: Income is adjusted for family size. Wealth is adjusted for age and includes home equity.
* Interpret data with caution due to small sample size.
** Too few observations to report estimates.
ns: The difference between blacks and whites is not statistically significant at the p<.05 level.
Blacks have a harder time exceeding their parents’ family income and wealth than whites.
A gap in absolute mobility exists between blacks and whites for both family income and wealth. For family income, a majority of all Americans exceed their parents; however, blacks have lower absolute mobility gains than whites.12 The black-white absolute mobility gap for family income is largest at the second rung of the ladder—89 percent of whites surpass their parents’ income compared with 66 percent of blacks.
While many fewer Americans surpass their parents’ wealth than surpass their parents’ income across the distribution, a majority in the bottom three quintiles do. However, when further analyzed by race, only 23 percent of blacks raised in the middle exceed their parents’ wealth compared with 56 percent of whites. Only in the bottom do a majority of blacks surpass their parents’ wealth, but a black-white gap of 8 percentage points still exists.
The Pew ChariTable TrusTs20
MOBILITY BY RACE
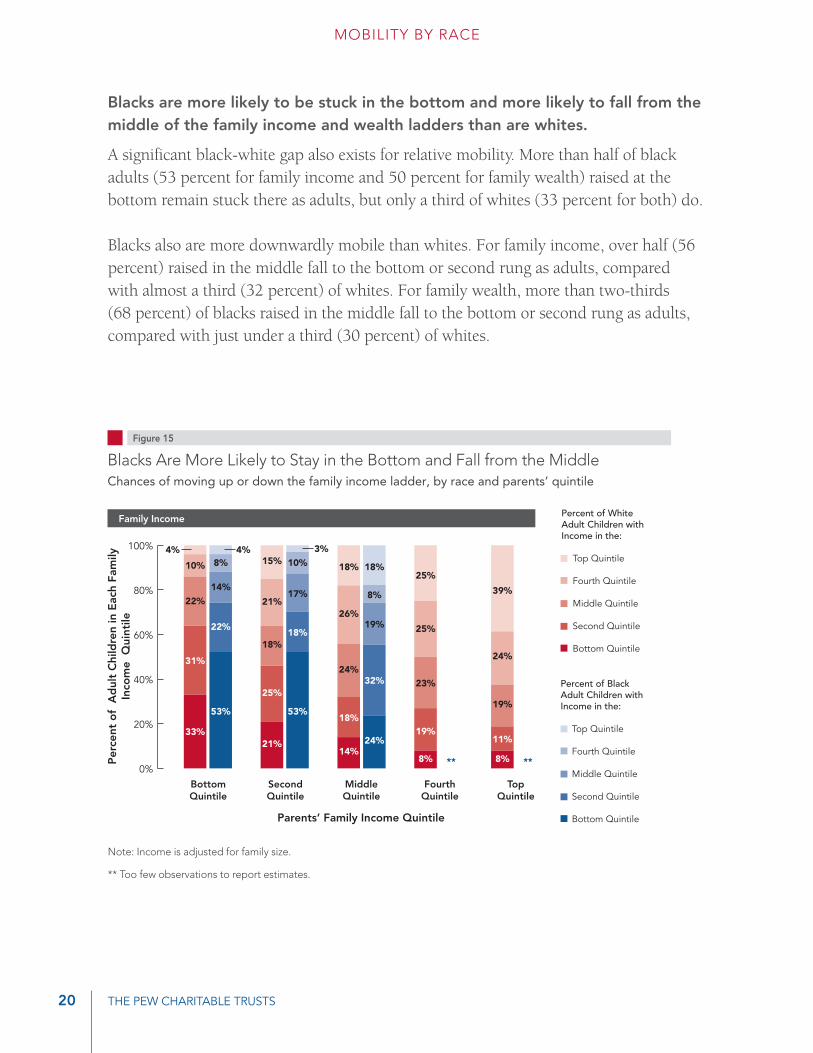
Blacks Are More Likely to Stay in the Bottom and Fall from the MiddleChances of moving up or down the family income ladder, by race and parents’ quintile
Figure 15
Percent of White Adult Children with Income in the:
Top Quintile
Fourth Quintile
Middle Quintile
Second Quintile
Bottom Quintile
Percent of Black Adult Children with Income in the:
Top Quintile
Fourth Quintile
Middle Quintile
Second Quintile
Bottom Quintile
BottomQuintile
SecondQuintile
MiddleQuintile
FourthQuintile
TopQuintile
Family Income
Per
cent
of
Ad
ult
Chi
ldre
n in
Eac
h Fa
mily
In
com
e Q
uint
ile
0%
20%
40%
60%
80%
100%
0
20
40
60
80
100
0
20
40
60
80
100
33%
31%
22%
10%
4%
53%
22%
14%
8%4%
21%
25%
18%
21%
15%
53%
18%
17%
10%3%
14%
18%
24%
26%
18%
24%
32%
19%
8%
18%
8%
19%
23%
25%
25%
8%
11%
19%
24%
39%
** **
Parents’ Family Income Quintile
Blacks are more likely to be stuck in the bottom and more likely to fall from the middle of the family income and wealth ladders than are whites.
A significant black-white gap also exists for relative mobility. More than half of black adults (53 percent for family income and 50 percent for family wealth) raised at the bottom remain stuck there as adults, but only a third of whites (33 percent for both) do.
Blacks also are more downwardly mobile than whites. For family income, over half (56 percent) raised in the middle fall to the bottom or second rung as adults, compared with almost a third (32 percent) of whites. For family wealth, more than two-thirds (68 percent) of blacks raised in the middle fall to the bottom or second rung as adults, compared with just under a third (30 percent) of whites.
Note: Income is adjusted for family size.
** Too few observations to report estimates.

Pursuing The aMeriCan DreaM: eConoMiC MobiliTy aCross generaTions21
MOBILITY BY RACE
Blacks Are More Likely to Stay in the Bottom and Fall from the MiddleChances of moving up or down the family wealth ladder, by race and parents’ quintile
Figure 15 (Continued)
0
20
40
60
80
100
0
20
40
60
80
100
BottomQuintile
SecondQuintile
MiddleQuintile
FourthQuintile
TopQuintile
Parents’ Family Wealth Quintile
Family Wealth
Per
cent
of
Ad
ult
Chi
ldre
n in
Eac
h Fa
mily
Wea
lth
Qui
ntile
0%
20%
40%
60%
80%
100%
33%
25%
19%
13%
10%
50%
27%
13%
6%4%
24%
29%
20%
16%
12%
38%
35%
15%
8%4%
14%
16%
27%
25%
18%
33%
35%
17%
15%
9%
17%
23%
28%
23%
7%
11%
16%
25%
41%
******
60%
18%
5%
16%
Percent of White Adult Children with Wealth in the:
Top Quintile
Fourth Quintile
Middle Quintile
Second Quintile
Bottom Quintile
Percent of Black Adult Children with Wealth in the:
Top Quintile
Fourth Quintile
Middle Quintile*
Second Quintile
Bottom Quintile
Median family income and wealth is higher for whites than for blacks at all levels of the income distribution.
Shifting away from parent-child pairs and looking only at median income and wealth levels across the two generations sheds light on why there is such a stark black-white mobility gap (see Figure 16). Median family income for blacks is just over $29,000, compared with more than $55,000 for whites, and median family income is lower for blacks than for whites at every rung of the ladder for which there are reliable estimates. Blacks also have less family wealth than do whites, and the racial wealth gap increases sharply between the bottom and the middle.
Note: Wealth is adjusted for age and includes home equity.
* Interpret data with caution due to small sample sizes.
** Too few observations to report estimates.

The Pew ChariTable TrusTs22
MOBILITY BY RACE
Notes: Income is adjusted for family size. Wealth is adjusted for age and includes home equity.
* Interpret data with caution due to small sample size.
** Too few observations to report estimates.
Whites Have Higher Family Income and Wealth Across the Distribution Median family income and wealth, by quintile
Figure 16
BottomQuintile
SecondQuintile
MiddleQuintile
FourthQuintile
TopQuintile
Family Income Quintile
Family Income
Med
ian
Fam
ily In
com
e (i
n th
ous
and
s o
f d
olla
rs)
Family Wealth Quintile
Family Wealth
Med
ian
Fam
ily W
ealt
h (in
tho
usan
ds
of
do
llars
)
$0
$100
$200
$300
$400
$500
0
10000
20000
30000
40000
50000
60000
70000
80000
White Parents
White Children
Black Parents
Black Children
$0
$10
$20
$30
$40
$50
$60
$70
$80
****
**
0
100000
200000
300000
400000
500000
$5
4,5
87
$8
,29
1
$2
,98
9
$1
9,7
09
$5
7,5
60
$6
5,1
40
$4
5,0
48
$6
,84
1
$1
16
,58
5
$1
42
,03
5$
11
7,1
33
$5
7,2
16
$1
94
,28
5
$1
66,9
63
$1
57
,18
6
$3
6,4
99
$4
95
,28
9
$2
66
,09
5
BottomQuintile
SecondQuintile
MiddleQuintile
FourthQuintile
TopQuintile
**
$3
8,3
85
$1
2,3
52
$9
,10
6
$2
8,0
83
$2
0,1
20
$4
6,8
69
$1
9,0
50
$2
7,1
32
$5
5,2
54
$2
5,5
76
$4
2,4
27
$3
4,6
65
$5
9,4
21
$2
7,3
11
$4
9,1
19
$6
9,9
77
*
*
*
23 Pursuing The aMeriCan DreaM: eConoMiC MobiliTy aCross generaTions
MOBILITY BY EDUCATION
Mobility by educationHaving a college degree improves Americans’ chances of surpassing their parents’ family income and wealth.
Having a college degree has long been viewed as one of the most promising ways to climb the economic ladder, and for good reason. The wage premium associated with a college degree rose dramatically during the past generation, and increased returns on education directly translate into upward absolute mobility gains.13 For example, 88 percent of those with a college degree exceed their parents’ family income, compared with 83 percent without a college degree (see Figure 17).14
College degree holders also have greater absolute wealth mobility than non-degree holders. Overall, 57 percent of college graduates have more assets than their parents, compared with less than half (46 percent) of those without a college degree. The greatest gains in absolute wealth during the prior generation were for college degree holders raised in the bottom wealth quintile; 85 percent have more wealth than their parents. For those raised in the fourth wealth quintile, the advantage of a college degree is most notable: nearly two-thirds (64 percent) of college graduates have more wealth than did their parents, compared with just one-third (34 percent) of non-graduates.

The Pew ChariTable TrusTs24
MOBILITY BY EDUCATION
Notes: Income is adjusted for family size. Wealth is adjusted for age and includes home equity.
ns: The difference between those with and without a college degree is not statistically significant at the p<.05 level.
College Graduates Are More Likely to Exceed their Parents’ Family Income and WealthPercent with family income and wealth above their parents’, by education and parents’ quintile
Figure 17
Family Income
Family Wealth
No College Degree
College Degree
0 20 40 60 80 100
0 20 40 60 80 100
Percent with Higher Family Income than their Parents
Raised in Top Quintile
Raised in Fourth Quintile
Raised in Middle Quintile
Raised in Second Quintile
Raised in Bottom Quintile
All Adult Children
0% 20% 40% 60% 80% 100%
83%
88%
60%
78%
80%
92%
84%
94%
84%
95%
93%
96%
Percent with Higher Family Wealth than their Parents
Raised in Top Quintile
Raised in Fourth Quintile
Raised in Middle Quintile
Raised in Second Quintile
Raised in Bottom Quintile
All Adult Children
0% 20% 40% 60% 80% 100%
46%
57%
17%
31%
34%
64%
49%
68%
49%
64%
69%
85%
ns

Pursuing The aMeriCan DreaM: eConoMiC MobiliTy aCross generaTions25
MOBILITY BY EDUCATION
College Graduates Are More Upwardly Mobile from the Bottom and Less Likely to Fall from the Top and MiddleChances of moving up or down the family income ladder, by education and parents’ quintile
Figure 18
Percent of Non- College Graduate Adult Children with Income in the:
Top Quintile
Fourth Quintile
Middle Quintile
Second Quintile
Bottom Quintile
Percent of College Graduate Adult Children with Income in the:
Top Quintile
Fourth Quintile
Middle Quintile
Second Quintile
Bottom Quintile
BottomQuintile
SecondQuintile
MiddleQuintile
FourthQuintile
TopQuintile
Family Income
Per
cent
of
Ad
ult
Chi
ldre
n in
Eac
h Fa
mily
In
com
e Q
uint
ile
0%
20%
40%
60%
80%
100%
0
20
40
60
80
100
47%
26%
16%
8%3%
37%
26%
17%
10%
28%
24%
20%
18%
9%
12%
14%
10%
27%
4%
17%
22%
25%
23%
12%
7%
15%
21%
26%
31%
12%
26%
22%
22%
18%
13%
16%
22%
24%
25%
Parents’ Family Income Quintile
10% 5%
37%
5%
10%
23%
27%
35%
16%
23%
51%
Earning a four-year college degree promotes upward mobility from the bottom and prevents downward mobility from the middle and top of the family income and wealth ladders.
A college degree makes individuals much less likely to become stuck at the bottom of the family income and wealth ladders. For those raised at the bottom of the family income ladder, almost one half (47 percent for family income) without a college degree are stuck there as adults, compared with 10 percent with a college degree. Similarly, 45 percent without a degree are stuck at the bottom of the family wealth ladder, compared with 20 percent with a degree. Having a four-year degree also makes one more likely to rise from the bottom of the ladder all the way to the top—over three times more likely for family income and over four times more likely for family wealth.
A college education additionally protects against downward mobility. At the top of the family income ladder, over half (51 percent) of those with a college degree raised at the top stay there compared with a quarter of those without a college degree. Thirty-nine percent without a college degree fall from the middle compared with only 22 percent with a degree. Similar patterns exist for family wealth.
Note: Income is adjusted for family size.

The Pew ChariTable TrusTs26
MOBILITY BY EDUCATION
College Graduates Are More Upwardly Mobile from the Bottom and Less Likely to Fall from the Top and MiddleChances of moving up or down the family wealth ladder, by education and parents’ quintile
Figure 18 (Continued)
Percent of Non- College Graduate Adult Children with Wealth in the:
Top Quintile
Fourth Quintile
Middle Quintile
Second Quintile
Bottom Quintile
Percent of College Graduate Adult Children with Wealth in the:
Top Quintile
Fourth Quintile
Middle Quintile
Second Quintile
Bottom Quintile
BottomQuintile
SecondQuintile
MiddleQuintile
FourthQuintile
TopQuintile
Family Wealth
Per
cent
of
Ad
ult
Chi
ldre
n in
Eac
h F
amily
Wea
lth
Qui
ntile
0%
20%
40%
60%
80%
100%
0
20
40
60
80
100
45%
27%
15%
7%5%
14%
20%
26%
21%
30%
31%
19%
13%
7%
15%
26%
17%
17%
18%
21%
26%
22%
14%
9%
10%
26%
30%
25%
13%
21%
26%
24%
15%
8%
15%
20%
30%
28%
Parents’ Family Wealth Quintile
20%
26%
7%
10%
15%
30%
37%
13%
20%
52%
9%
7%
Note: Wealth is adjusted for age and includes home equity.

27 Pursuing The aMeriCan DreaM: eConoMiC MobiliTy aCross generaTions
CONCLUSION
ConclusionThe best available data on economic mobility provide a mixed view. While a majority of Americans exceed their parents’ family income and wealth, the extent of their absolute mobility gains are not always enough to move them to a different rung of the economic ladder. Furthermore, the persistence of the black-white mobility gap undercuts the ideal of equality of opportunity, a concept central to the idea of the American Dream.
The findings highlight the importance of better understanding key drivers of economic mobility—including postsecondary education, savings and asset building, and neighborhood poverty—for policy makers seeking to promote and protect the American Dream for generations to come. To learn more about economic mobility drivers and read the complete catalog of Economic Mobility Project research, visit www.economicmobility.org.

28 The Pew ChariTable TrusTs
Data and sample
All analyses in this chart book use data from the Panel Study of Income Dynamics (PSID), a longitudinal data set that has followed families from 1968 to the present. The PSID has been conducted continuously since 1968; annually from 1968 to 1997 and biannually between 1997 and 2009. The PSID is unique among data sets because it continues to follow family members even after they split off from their original households to form separate households. This quality makes it well-suited to study intergenerational economic mobility because data for both parents and children are available at comparable points in their adult life courses. Consequently, it is one of the richest data sets available in the United States that follows multiple generations within families over time.
The original PSID core sample is composed of two parts. One part includes an oversample of low-income households, or the Survey of Economic Opportunity (SEO) sample. The other part includes a cross-sectional national sample, or the
AppendixSurvey Research Center (SRC) sample. Both parts of the PSID sample were included in the analysis. It should be noted that two-thirds of the families in the SEO sample were dropped in 1997 from the PSID, so the two-thirds also are excluded from the analysis within this chart book.15 Although the PSID added supplemental samples in the 1990s, including a sample of immigrants and a sample of Latinos, these samples are not a part of the analyses in this chart book because they lack historical family and economic data originating with the PSID in 1968.
Economic mobility in this study is examined through the lens of intergenerational mobility. Intergenerational mobility looks at how Americans are faring economically relative to how their parents fared at a comparable age by analyzing data from both parents and children within the same family. In this study, the sample was restricted to those families where the head of household had a child under the age of 18 in his or her household in 1968.16 In the children’s generation, 95 percent of the sample consisted of

29 Pursuing The aMeriCan DreaM: eConoMiC MobiliTy aCross generaTions
APPENDIX
children of the head of household. The remaining 5 percent included other related children, such as grandchildren. For simplicity’s sake, the samples are referred to as children and parents.
Because the unit of analysis in this study is the adult child, the statistics are weighted using the children’s most recently available weight as of 2009. The survey weights of each child were computed by the PSID survey designers to statistically adjust for the likelihood of sample selection and non-random attrition from the study. The application of weights in these analyses helps to reduce possible bias in the sample, but does not guarantee that bias is completely eliminated.
The data are analyzed using the total sample and also by race, education, and sex. Race is measured using the head of the household’s reported race in 1968. If race is missing, reported race up to 1972 is used. Only white and black respondents are included due to small sample sizes for other racial/ethnic groups.17 The sample includes a slightly larger proportion of whites (57 percent) compared with blacks (43 percent).
Education is measured according to whether the child is a college graduate. Children are determined to be college graduates if they reported that they had been in school for at least 16 years or more, between 2001 and 2009. Fewer
than a quarter (23 percent) of children are college graduates, and education is missing for only 6 percent of the sample.
economic status MeasuresThree forms of intergenerational economic mobility are examined in this chart book: income mobility, earnings mobility, and wealth mobility. The following sections describe the sample used for each set of analyses and the specific methodological considerations for each indicator. For all measures, both the parent and the child must have at least three years of data to be included in the analysis. All economic status measures were inflated to 2008 dollars using the CPI-U-RS and CPI-U-X1.
Family IncomeIncome is defined as the total income derived from the taxable income (such as earnings, interest, and dividends) and cash transfers (such as Social Security and welfare) of the head, spouse, and other family members. The PSID definition of family used in this analysis includes single-person families and unmarried cohabiting couples who share resources, in addition to families related by blood, marriage, or adoption. Family income does not include the value of non-cash compensation such as employer contributions to health insurance and retirement benefits, nor does it include the effect of taxes or non-cash benefits such as food stamps. All values less than or equal to zero are coded as $1.

30 The Pew ChariTable TrusTs
APPENDIX
The sample for the analysis of family income includes 2,736 children of the original PSID families who were between the ages of zero and 18 in 1968 and were tracked into adulthood.
For the parents, income is computed as the mean value of total family income taken in 1967, 1968, 1969, 1970, and 1971. Average age of the children’s parents during this five-year time period was 40.9. Five-year averages are used as a proxy for lifetime income.
For the children, income is computed as the mean value of total family income taken in 2000, 2002, 2004, 2006, and 2008. Because the PSID shifted from annual to biennial data collection in the mid 1990s, the five years of data are collected over an eight-year interval. The average age of the adult children from whom income data were collected was 45 at the time of survey interview (2000 to 2008).
Estimates of economic mobility that use family income have been adjusted for family size.18 The reason to adjust family income for family size is based on the notion of “economies of scale.” In other words, families require more resources to support additional members but not on the same scale that would be required to support one individual living alone.
These analyses use a well-established method of adjusting for family size,
often termed the “square root scale,” that divides family income by the square root of the size of the family. This method assumes that a household of four people has needs that are twice that of an individual living alone.19 Suppose two different households reported income in the previous year of $50,000, but one household was an individual living alone and another household was a family of four. The household of one would have an adjusted family income of $50,000 to devote to the individual’s consumer needs. The household of four would have an adjusted family income of $25,000 ($50,000 divided by two, or the square root of four). This method is a way of equalizing family income by acknowledging that additional family members require additional expenses. This is particularly important when comparing generations, because family sizes, on average, have gotten smaller during the past 40 years.20
Personal EarningsEarnings are defined as all labor earnings, such as wages and salary, bonuses, overtime, tips, and commissions. Earnings are a subset of family income. While family income includes all earnings from all family members as well as money from other sources ranging from investments to cash transfers, earnings constitute what one individual contributes to family income from his or her employment alone. Unlike family income, individual
31 Pursuing The aMeriCan DreaM: eConoMiC MobiliTy aCross generaTions
APPENDIX
earnings were not family-size adjusted because they constitute one person’s contribution to the whole. Therefore, family income and individual earnings should not be compared in this study because of this difference in family-size adjustments.
The sample for the analysis of individual earnings includes 1,014 sons of the original PSID fathers who were between the ages of zero and 18 in 1968 and were tracked into adulthood. This study examines the earnings of sons relative to their fathers in order to have comparable intergenerational mobility estimates. Mothers and daughters are not included in the earnings analyses because the dramatic increase in women’s labor force participation in a generation’s time would be conflated with intergenerational mobility.
For fathers, earnings are measured as the mean value of the head taken in 1967, 1968, 1969, 1970, and 1971. For sons, earnings are measured as the mean value taken in 2000, 2002, 2004, 2006, and 2008. If the son was the head of the household, the head’s labor earnings for each year were used. If the son’s relationship status was reported as spouse, the spouse’s labor earnings in the particular year were used.
Family WealthThe PSID first collected information on the wealth of respondents in 1984.
Wealth is the respondent’s estimate of the value of his or her home equity, farm or business, checking and savings accounts, other debt, other real estate, stocks, vehicles, and other assets. Although wealth is measured in the PSID in terms of family holdings, wealth is not often easily accessed, nor readily distributed amongst all family members. For these reasons, wealth is not family-size adjusted in this study.
The sample size for the analysis of wealth includes 2,277 children of the original PSID families who were between the ages of zero and 18 in 1968 and were tracked into adulthood.
Because wealth was first collected in 1984, parents’ wealth is measured in that year only. For the children, wealth is measured as the mean value taken in 2001, 2003, 2005, 2007, and 2009.
The limited availability of wealth data for parents produced differences in the mean ages for the parents and children. The average age of parents when wealth is measured was 55, and the average age of children was 46. To address the effects that an age gap in wealth measurement might have on intergenerational comparisons of wealth, age adjustments were performed on the data to make the parent and child generation wealth data more evenly matched. The adjustments are created by estimating a wealth-age profile based on a pooled sample of the parents and children. In particular, the

32 The Pew ChariTable TrusTs
APPENDIX
natural log (ln) of wealth is regressed on a quartic in age, and the residual from this regression is saved for each observation. The ln wealth value is predicted for each parent and child at an age of 40. The age-adjusted wealth
measure is the exponentiated value of the sum of the predicted wealth measure and the residual from the regression model. For those with a negative wealth or no wealth, an age-adjusted wealth value equal to zero is assigned.

33 Pursuing The aMeriCan DreaM: eConoMiC MobiliTy aCross generaTions
1 Getting Ahead or Losing Ground: Economic Mobility in
America was funded by the Pew Economic Mobility
Project in 2008. Julia Isaacs, Isabel Sawhill, and Ron
Haskins of the Brookings Institution wrote the report
based on analysis conducted by Thomas DeLeire of the
University of Wisconsin-Madison and Leonard Lopoo
of Syracuse University. This 2012 update was written by
the Pew Economic Mobility Project based on analysis
again conducted by Dr. DeLeire and Dr. Lopoo.
2 See the Appendix for details about the Panel Study
of Income Dynamics (PSID) data and the family size
adjustment methodology used in this report. Note that
family size adjustments were not made in the 2008
report Getting Ahead or Losing Ground; therefore, direct
comparisons between the two reports are not possible.
3 Measures of family income are adjusted for family
size and inflation. Measures of earnings are adjusted for
inflation. Measures of wealth are adjusted for inflation
and age. See the Appendix for more details.
4 “Family income” includes all taxable income (such
as earnings, interest, and dividends) and cash transfers
(such as Social Security and welfare) of all family
members. All mobility metrics on family income are
adjusted for inflation and family size.
5 “Wealth” measures include home equity and are
adjusted for inflation and age.
6 Family income does not include the value of non-
cash compensation, such as employer contributions to
health insurance, nor does it include the effect of taxes
or non-cash benefits such as food stamps.
7 Personal earnings and family income are both
inflation-adjusted, but only family income is adjusted
for family size. Direct comparisons of income and
earnings are not advised for this reason. See the
Appendix for details.
8 The family income data used in this figure is not
adjusted for family size in order to determine the share
of non-family size-adjusted earnings that constituted
the total.
9 These data are adjusted for age because the PSID first
collected information on the wealth of respondents
in 1984, resulting in a higher average age for parents
compared with children. See the Appendix for more
information.
10 Some of the families in this study had negative
wealth when home equity was included because they
had more debt than they had assets. In this data, 2.4
percent of the parent generation and 5.3 percent of the
child generation had more debt than assets.
11 Data limitations prevent this analysis from including
races or ethnicities other than whites and blacks. See
the Appendix for more information.
12 Only at the second income rung are these
differences statistically significant.
13 All income differences are significant, except at the
bottom rung.
14 Of note, the difference between the absolute income
mobility of non-college and college graduates would
be more pronounced had family-size adjustments
not been made. In the current generation, family
sizes are larger on average for those with a college
degree compared with those without a college degree.
This may be because college degree holders delay
Endnotes

34 The Pew ChariTable TrusTs
ENDNOTES
childbearing in the pursuit of education, increasing
the likelihood that their families have children
present in their households later in life, when the
mobility analyses are conducted. As a result, family
size adjustments may understate the family income
advantage of a college degree because the family
income of college graduates is divided over a larger
number of family members.
15 The PSID dropped this sample for budgetary
reasons.
16 Heads in the parent generation may be represented
more than once depending on how many children they
had in the data.
17 The PSID was designed in 1968 to study the
dynamics of poverty. As an indirect consequence, the
survey had a large sub-sample of black respondents. To
compensate for the absence of Latinos and immigrant
groups who emigrated to the United States after 1968,
additional samples were added in 1990 (see Martha
Hill, “The Panel Study of Income Dynamics: A User’s
Guide,” Vol. 2 (1991), http://psidonline.isr.umich.
edu/Guide/ug/psidguide.pdf). Because this study
incorporates data from the parent generation in 1968,
or before the additional Latino and immigrant samples
were added, there are not enough data in the sample to
explore mobility among Latinos.
18 PSID respondents report their income from the
previous year because it is more accurate to report
based on the last complete calendar year. Family size
is measured at the time of survey. So, the previous
year’s income is adjusted given family size at the time
of survey.
19 For additional information, see the Organization
for Economic Development write-up “What Are
Equivalence Scales?” that compares the different
methods for adjusting family income for family size
(http://www.oecd.org/dataoecd/61/52/35411111.pdf).


