Instruction Manual
PW3198
POWER QUALITYANALYZER
July 2012 Revised edition 2 PW3198A981-02 12-07H


Contents
i
1
2
3
4
5
ContentsIntroduction ..................................................1Confirming Package Contents .................... 2Safety Notes..................................................4Usage Notes..................................................6
Chapter 1 Overview 111.1 Product Overview ............................ 111.2 Features ............................................121.3 Measurement Flowchart .................. 13
Starting and Stopping Recording .........14
Chapter 2 Names and Functions of Parts Basic Operations & Screens 15
2.1 Names and Functions of Parts ....... 152.2 Basic Operations ............................. 192.3 Display Items and Screen Types ....20
Common Display Items........................ 20 Warning Indicators ...............................22 Screen Types....................................... 23
Chapter 3 Measurement Preparations 27
3.1 Preparation Flowchart ..................... 273.2 Initial Instrument Preparations ....... 28
Attaching input cable labels to the voltage cords and clamp sensors ........28
Attaching the strap............................... 28 Bundle the voltage cord leads with the spi-
ral tubes............................................... 29 Installing the battery pack ....................30
3.3 Pre-Operation Inspection ................313.4 Connecting the AC Adapter ............323.5 Inserting (Removing) an SD Memory
Card ................................................... 323.6 Connecting the Voltage Cords ....... 34
3.7 Connecting the Clamp Sensors ......343.8 Turning the Power On and Off
(Setting the Default Language) .......36
Chapter 4 Configuring the Instrument before Measurement (SYSTEM - SYSTEM screen) and Wiring37
4.1 Warm-up and Zero-adjust Operation ..........................................37
4.2 Setting the Clock ..............................384.3 Configuring the Connection Mode and
Clamp Sensors .................................39 Connection diagram ............................ 40
4.4 Setting the Vector Area (Tolerance Level) ..............................45
4.5 Connecting to the Lines to be Measured (Preparing for Current Measurement) ...................................46
4.6 Verifying Correct Wiring (Connection Check) .........................48
4.7 Quick setup .......................................504.8 Verifying Settings and Starting
Recording ..........................................534.9 Using the Instrument during a
Power Outage ...................................54
Chapter 5 Changing Settings(as necessary) 55
5.1 Changing Measurement Conditions 555.2 Changing the Measurement Period 585.3 Changing the Recording Settings ..615.4 Changing Hardware Settings ..........645.5 Changing Event Settings .................66
Contents
ii
5.6 Initializing the Instrument (System Reset) .................................73
5.7 Factory Settings ...............................74
Chapter 6 Monitoring Instantaneous Values (VIEW Screen) 75
6.1 Using the VIEW screen ....................756.2 Displaying Instantaneous
Waveforms ........................................766.3 Displaying Phase Relationships
([VECTOR] Screen) ..........................806.4 Displaying Harmonics ......................83
Displaying harmonics as a bar graph.. 83 Displaying harmonics as a list ............. 86
6.5 Displaying Measured Values Numerically (DMM Screen) ..............89
Chapter 7 Monitoring Fluctuations in Measured Values (TIME PLOT Screen) 91
7.1 Using the [TIMEPLOT] Screen ........937.2 Displaying Trends ............................947.3 Displaying detailed trends .............101
Displaying a detailed trend graph for each TIMEPLOT interval.................. 101
7.4 Displaying Harmonic Trends .........1077.5 Displaying Flicker Values in Graph
and List Form ..................................111 IEC flicker meters and V10 flicker
meters .............................................. 111 Displaying an IEC flicker fluctuation
graph ................................................. 111 Displaying an IEC flicker list.............. 114 Displaying a V10 flicker fluctuation
graph ................................................. 115 Displaying a V10 flicker list ............. 118
Chapter 8 Checking Events (EVENT screen) 119
8.1 Using the EVENT screen ............... 1208.2 Displaying the Event List .............. 1218.3 Analyzing the Measurement Line
Status When Events Occur ........... 1248.4 Analyzing Transient Waveforms .. 1268.5 Viewing High-order Harmonic
Waveforms ..................................... 1298.6 Checking Fluctuation Data ........... 132
Chapter 9 Data Saving and File Operations (SYSTEM-MEMORY screen) 135
9.1 [MEMORY] Screen ......................... 1359.2 Formatting SD Memory Cards ...... 1389.3 Save Operation and File Structure 1399.4 Saving, Display and Deleting
Measurement Data ......................... 1419.5 Saving, Displaying, and Deleting
Screen Copies ................................ 1449.6 Saving and Deleting Settings Files
(Settings Data) ............................... 1459.7 Loading Settings Files
(Settings Data) ............................... 1469.8 File and Folder Names .................. 146
Changing file and folder names ........ 146
Chapter 10 Analyzing Data Using the Computer Application (9624-50) 147
10.1 Computer Application (9624-50) Capa-bilities ............................................. 147
10.2 Downloading Data from the SD Memo-ry Card ............................................ 148
Contents
iii
14
3
4
5
7
8
9
10
Appendix
11
12
13
6
Inde
Chapter 11 Connecting External Devices 149
11.1 Using the External Control Terminal .......................................... 149 Connecting to the External Control
Terminal .............................................150 Using the event input terminal
(EVENT IN) .......................................151 Using the event input terminal
(EVENT OUT) ....................................152
Chapter 12 Operation with a Computer 155
12.1 Downloading Measurement Data Usingthe USB Interface ........................... 156
12.2 Control and Measurement via Ethernet("LAN") Interface ............................ 157 LAN Settings and Network Environment
Configuration ..................................... 158 Instrument Connection .......................160
12.3 Remote Control of the Instrument byInternet Browser ............................ 162 Connecting to the Instrument .............162 Operating Procedure .........................163
12.4 Converting Binary Data to Text Data ................................................. 164
Chapter 13 Specifications 16513.1 Environmental Safety
Specifications ................................ 16513.2 General Specifications .................. 16513.3 Measurement Specifications ........ 16913.4 Event Specifications ...................... 18913.5 Operating Specifications ............... 19013.6 Measurement and Analysis
Function Specifications ................ 19113.7 Configuration Function
Specifications ................................ 194
13.8 GPS Time Synchronization Function ..........................................197
13.9 Other Functions ..............................19713.10Calculation Formula .......................19813.11Clamp Sensors and Ranges ..........21113.12Block Diagram ................................213
Chapter 14 Maintenanceand Service 215
14.1 Cleaning ..........................................21514.2 Trouble Shooting ............................21614.3 Error Indication ...............................21814.4 Disposing of the Instrument ..........221
Appendix A1Appendix 1 Procedure for Investigating
Power Supply Quality ..........A1Appendix 2 Explanation of Power Supply
Quality Parameters and Events....................................A4
Appendix 3 Event Detection Methods ....A7Appendix 4 Recording TIMEPLOT Data
and Event Waveforms........A14Appendix 5 Detailed Explanation of IEC
Flicker and V10 Flicker ....A18Appendix 6 Making Effective Use of
Channel 4 ............................A21Appendix 7 Terminology........................A24
Index Index1
x

Contents
iv
Introduction
1
Thank you for purchasing the HIOKI PW3198 Power Quality Analyzer. To obtain maximum perfor-mance from the product, please read this manual first, and keep it handy for future reference.Clamp-on sensors (optional; see p.3) are required in order to input current to the instrument.(Clamp-on sensors are called "clamp sensors" throughout this manual.) For more information,see the instruction manual for the clamp sensors being used.
• Windows is a registered trademark of Microsoft Corporation in the United States and/or other coun-tries.
• Sun, Sun Microsystems, Java, and any logos containing Sun or Java are trademarks or registeredtrademarks of Sun Microsystems, Inc. in the United States and other countries.
• The SD logo is a trademark of SD-3C, LLC.
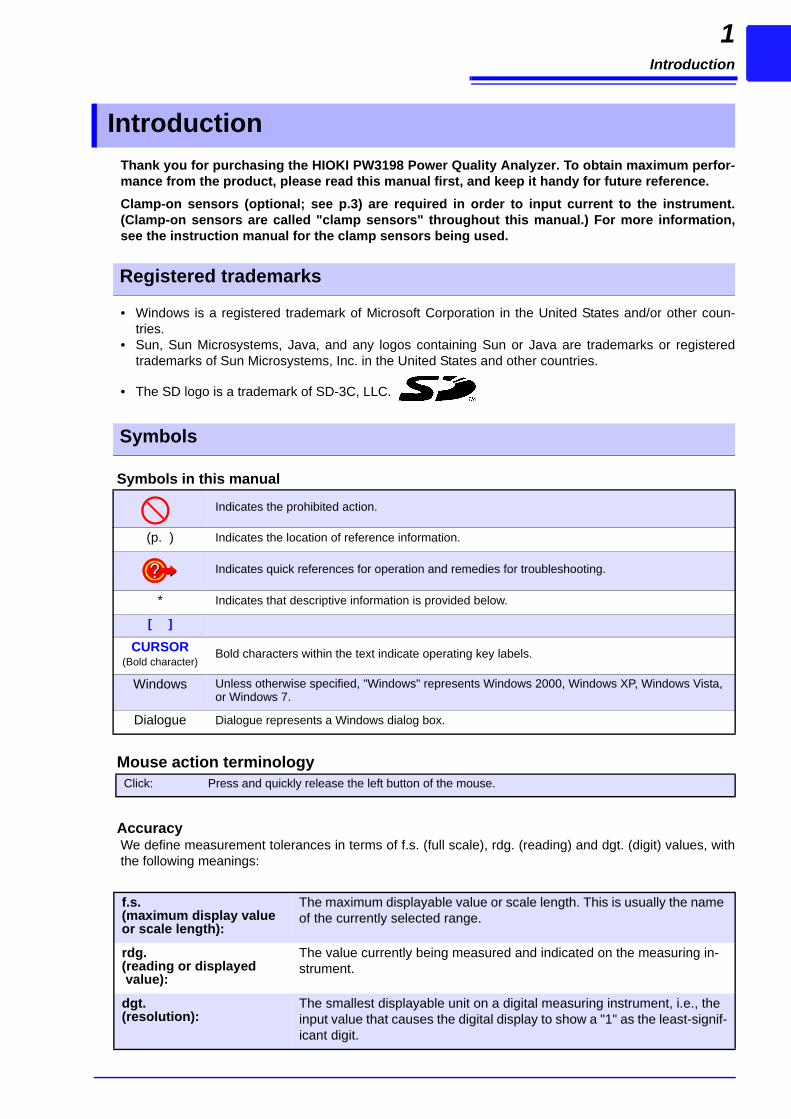
AccuracyWe define measurement tolerances in terms of f.s. (full scale), rdg. (reading) and dgt. (digit) values, withthe following meanings:
Introduction
Registered trademarks
Symbols
Symbols in this manual
Indicates the prohibited action.
(p. ) Indicates the location of reference information.
Indicates quick references for operation and remedies for troubleshooting.
* Indicates that descriptive information is provided below.
[ ]
CURSOR(Bold character)
Bold characters within the text indicate operating key labels.
Windows Unless otherwise specified, "Windows" represents Windows 2000, Windows XP, Windows Vista, or Windows 7.
Dialogue Dialogue represents a Windows dialog box.
Mouse action terminologyClick: Press and quickly release the left button of the mouse.
f.s. (maximum display value or scale length):
The maximum displayable value or scale length. This is usually the name of the currently selected range.
rdg. (reading or displayed value):
The value currently being measured and indicated on the measuring in-strument.
dgt. (resolution):
The smallest displayable unit on a digital measuring instrument, i.e., the input value that causes the digital display to show a "1" as the least-signif-icant digit.
Confirming Package Contents
2
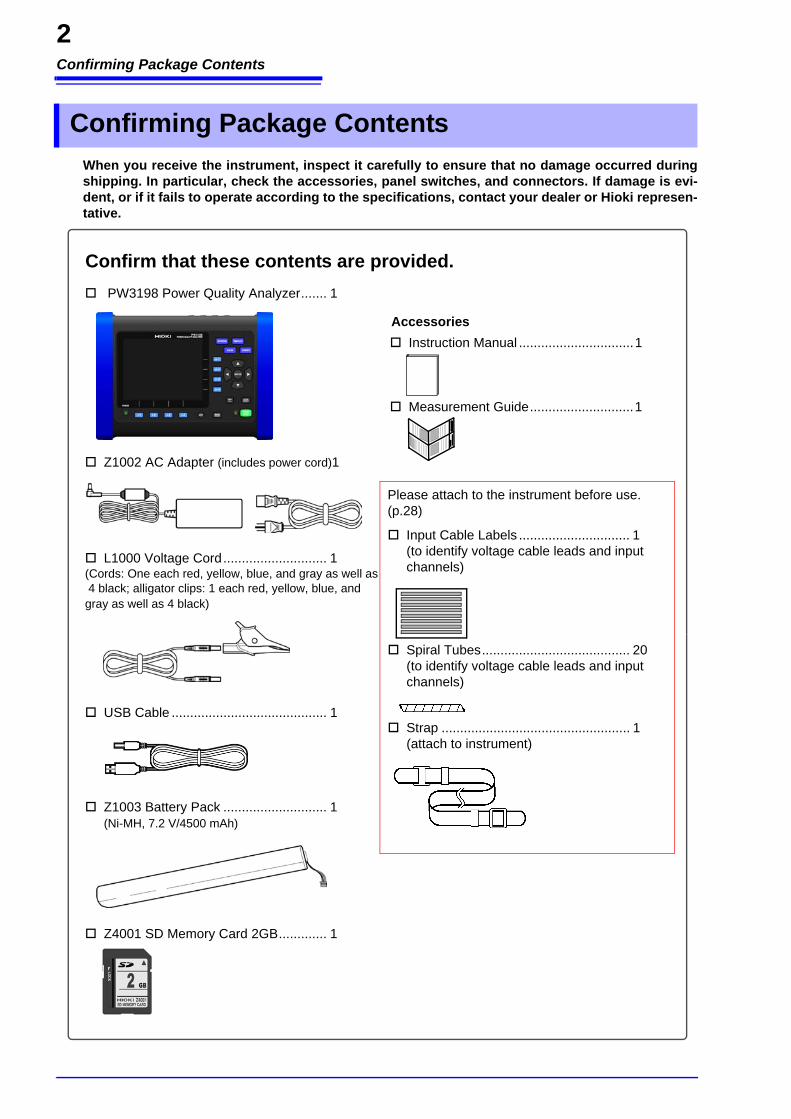
When you receive the instrument, inspect it carefully to ensure that no damage occurred duringshipping. In particular, check the accessories, panel switches, and connectors. If damage is evi-dent, or if it fails to operate according to the specifications, contact your dealer or Hioki represen-tative.
Confirming Package Contents
PW3198 Power Quality Analyzer....... 1
Confirm that these contents are provided.
Accessories Instruction Manual ...............................1
Measurement Guide............................1
Z1002 AC Adapter (includes power cord)1
L1000 Voltage Cord............................ 1(Cords: One each red, yellow, blue, and gray as well as 4 black; alligator clips: 1 each red, yellow, blue, and gray as well as 4 black)
USB Cable .......................................... 1
Z1003 Battery Pack ............................ 1(Ni-MH, 7.2 V/4500 mAh)
Z4001 SD Memory Card 2GB............. 1
Input Cable Labels .............................. 1(to identify voltage cable leads and input channels)
Spiral Tubes........................................ 20(to identify voltage cable leads and input channels)
Strap ................................................... 1(attach to instrument)
Please attach to the instrument before use. (p.28)
Confirming Package Contents
3
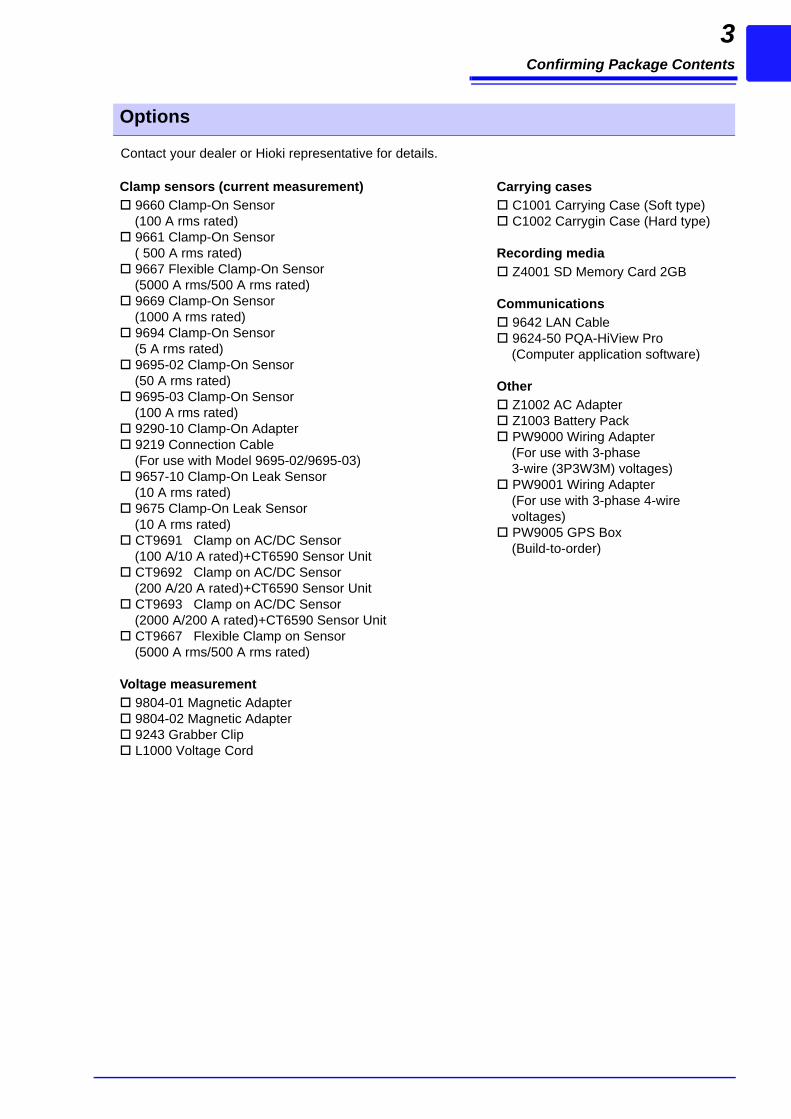
Contact your dealer or Hioki representative for details.
Options
Clamp sensors (current measurement) 9660 Clamp-On Sensor
(100 A rms rated) 9661 Clamp-On Sensor
( 500 A rms rated) 9667 Flexible Clamp-On Sensor
(5000 A rms/500 A rms rated) 9669 Clamp-On Sensor
(1000 A rms rated) 9694 Clamp-On Sensor
(5 A rms rated) 9695-02 Clamp-On Sensor
(50 A rms rated) 9695-03 Clamp-On Sensor
(100 A rms rated) 9290-10 Clamp-On Adapter 9219 Connection Cable
(For use with Model 9695-02/9695-03) 9657-10 Clamp-On Leak Sensor
(10 A rms rated) 9675 Clamp-On Leak Sensor
(10 A rms rated) CT9691 Clamp on AC/DC Sensor
(100 A/10 A rated)+CT6590 Sensor Unit CT9692 Clamp on AC/DC Sensor
(200 A/20 A rated)+CT6590 Sensor Unit CT9693 Clamp on AC/DC Sensor
(2000 A/200 A rated)+CT6590 Sensor Unit CT9667 Flexible Clamp on Sensor
(5000 A rms/500 A rms rated)
Voltage measurement 9804-01 Magnetic Adapter 9804-02 Magnetic Adapter 9243 Grabber Clip L1000 Voltage Cord
Carrying cases C1001 Carrying Case (Soft type) C1002 Carrygin Case (Hard type)
Recording media Z4001 SD Memory Card 2GB
Communications 9642 LAN Cable 9624-50 PQA-HiView Pro
(Computer application software)
Other Z1002 AC Adapter Z1003 Battery Pack PW9000 Wiring Adapter
(For use with 3-phase 3-wire (3P3W3M) voltages)
PW9001 Wiring Adapter(For use with 3-phase 4-wire voltages)
PW9005 GPS Box(Build-to-order)
Safety Notes
4
This manual contains information and warnings essential for safe operation of the product andfor maintaining it in safe operating condition. Before using the product, be sure to carefully readthe following safety notes.
The following symbols in this manual indicate the relative importance of cautions and warnings.
Safety Notes
This instrument is designed to comply with IEC 61010 Safety Standards, and hasbeen thoroughly tested for safety prior to shipment. However, mishandling dur-ing use could result in injury or death, as well as damage to the instrument. How-ever, using the instrument in a way not described in this manual may negate theprovided safety features.Be certain that you understand the instructions and precautions in the manualbefore use. We disclaim any responsibility for accidents or injuries not resultingdirectly from instrument defects.
Safety Symbols
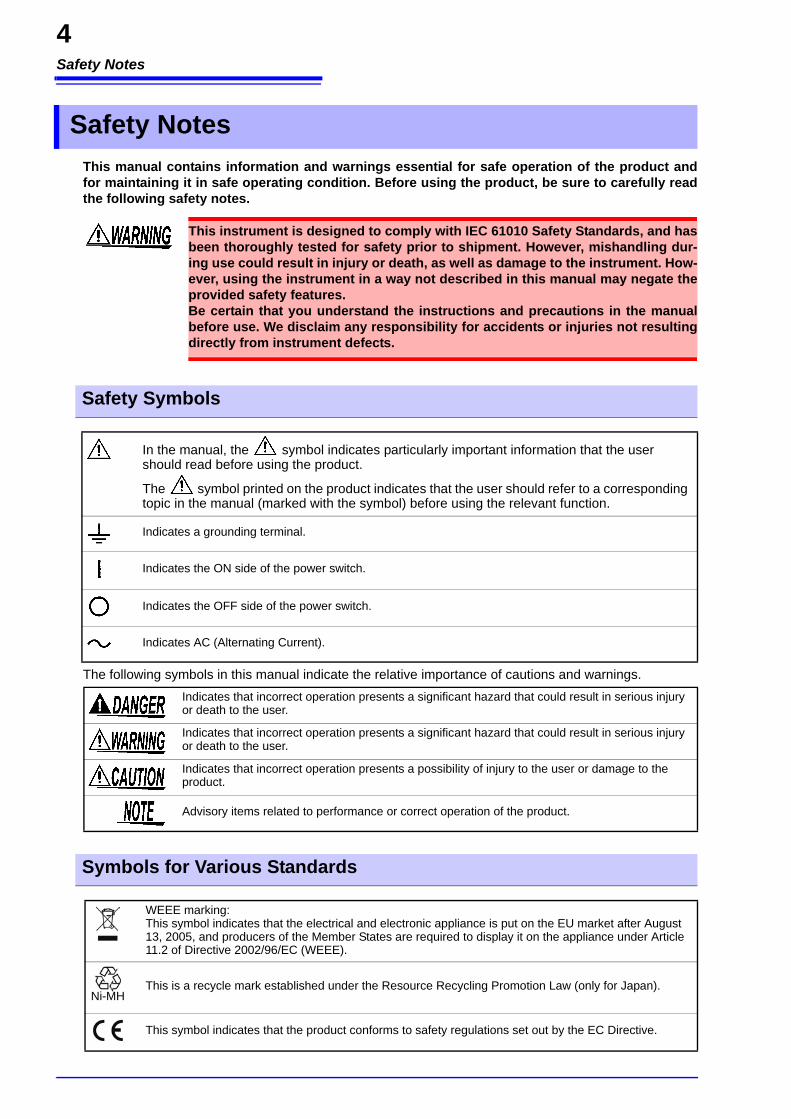
In the manual, the symbol indicates particularly important information that the user should read before using the product.
The symbol printed on the product indicates that the user should refer to a corresponding topic in the manual (marked with the symbol) before using the relevant function.
Indicates a grounding terminal.
Indicates the ON side of the power switch.
Indicates the OFF side of the power switch.
Indicates AC (Alternating Current).
Indicates that incorrect operation presents a significant hazard that could result in serious injury or death to the user.
Indicates that incorrect operation presents a significant hazard that could result in serious injury or death to the user.
Indicates that incorrect operation presents a possibility of injury to the user or damage to the product.
Advisory items related to performance or correct operation of the product.
Symbols for Various Standards
WEEE marking:This symbol indicates that the electrical and electronic appliance is put on the EU market after August 13, 2005, and producers of the Member States are required to display it on the appliance under Article 11.2 of Directive 2002/96/EC (WEEE).
This is a recycle mark established under the Resource Recycling Promotion Law (only for Japan).
This symbol indicates that the product conforms to safety regulations set out by the EC Directive.
Ni-MH
Safety Notes
5
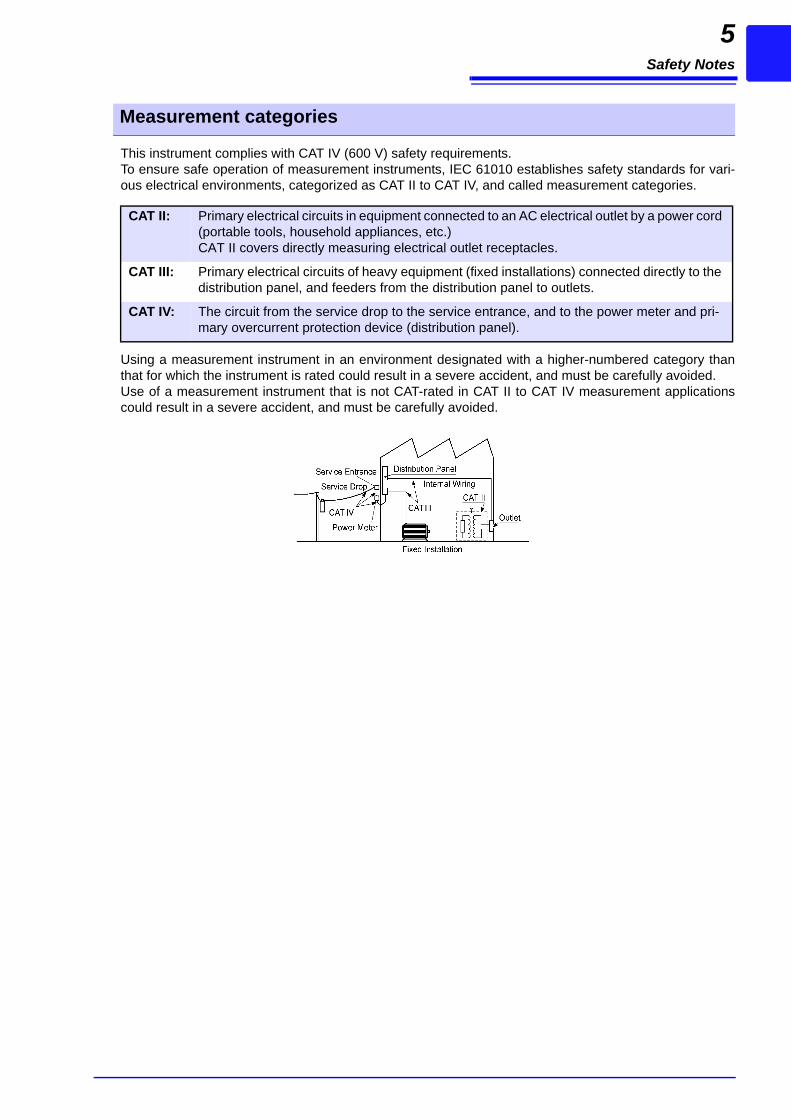
This instrument complies with CAT IV (600 V) safety requirements.To ensure safe operation of measurement instruments, IEC 61010 establishes safety standards for vari-ous electrical environments, categorized as CAT II to CAT IV, and called measurement categories.
Using a measurement instrument in an environment designated with a higher-numbered category thanthat for which the instrument is rated could result in a severe accident, and must be carefully avoided.Use of a measurement instrument that is not CAT-rated in CAT II to CAT IV measurement applicationscould result in a severe accident, and must be carefully avoided.
Measurement categories
CAT II: Primary electrical circuits in equipment connected to an AC electrical outlet by a power cord (portable tools, household appliances, etc.)CAT II covers directly measuring electrical outlet receptacles.
CAT III: Primary electrical circuits of heavy equipment (fixed installations) connected directly to the distribution panel, and feeders from the distribution panel to outlets.
CAT IV: The circuit from the service drop to the service entrance, and to the power meter and pri-mary overcurrent protection device (distribution panel).
Usage Notes
6
Follow these precautions to ensure safe operation and to obtain the full benefits of the variousfunctions.
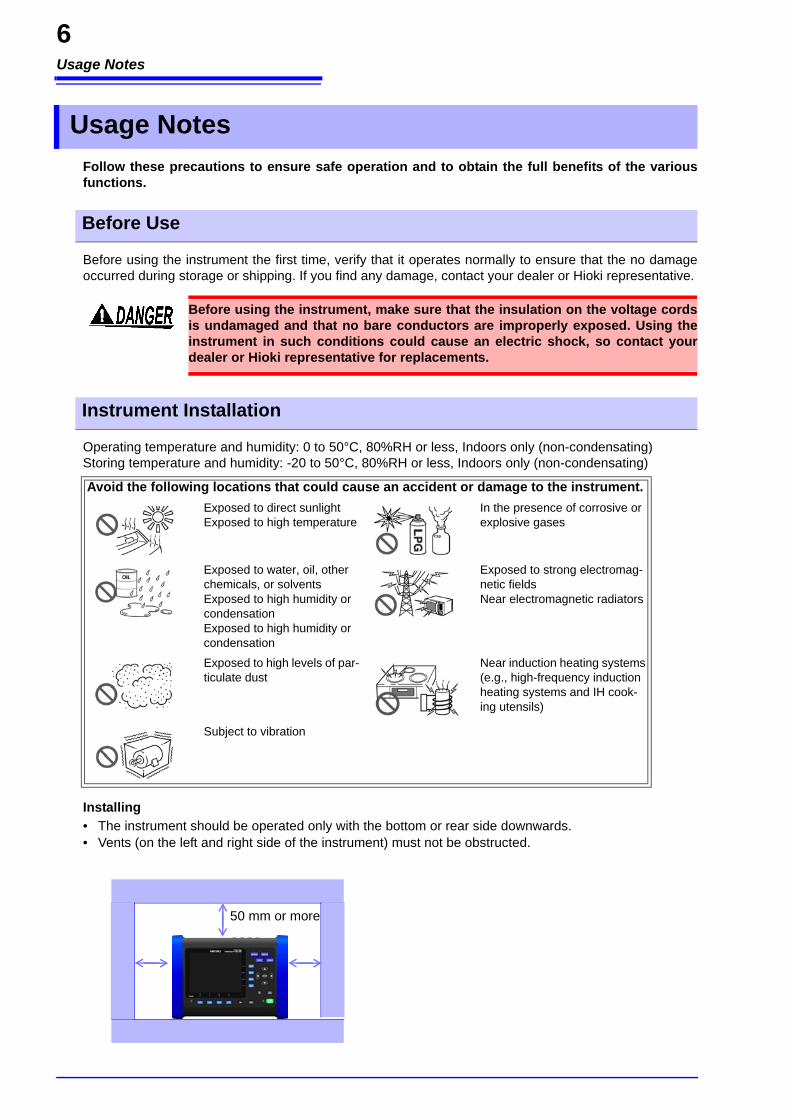
Before using the instrument the first time, verify that it operates normally to ensure that the no damageoccurred during storage or shipping. If you find any damage, contact your dealer or Hioki representative.
Operating temperature and humidity: 0 to 50°C, 80%RH or less, Indoors only (non-condensating)Storing temperature and humidity: -20 to 50°C, 80%RH or less, Indoors only (non-condensating)
Installing• The instrument should be operated only with the bottom or rear side downwards.• Vents (on the left and right side of the instrument) must not be obstructed.
Usage Notes
Before Use
Before using the instrument, make sure that the insulation on the voltage cordsis undamaged and that no bare conductors are improperly exposed. Using theinstrument in such conditions could cause an electric shock, so contact yourdealer or Hioki representative for replacements.
Instrument Installation
Avoid the following locations that could cause an accident or damage to the instrument.Exposed to direct sunlightExposed to high temperature
In the presence of corrosive or explosive gases
Exposed to water, oil, other chemicals, or solventsExposed to high humidity or condensationExposed to high humidity or condensation
Exposed to strong electromag-netic fieldsNear electromagnetic radiators
Exposed to high levels of par-ticulate dust
Near induction heating systems(e.g., high-frequency induction heating systems and IH cook-ing utensils)
Subject to vibration
50 mm or more
Usage Notes
7
Hioki disclaims responsibility for any direct or indirect damages that may occur when this instrument hasbeen combined with other devices by a systems integrator prior to sale, or when it is resold.
*IP30: This indicates the degree of protection provided by the enclosure of the device against use in haz-ardous locations, entry of solid foreign objects, and the ingress of water.3: Protected against access to hazardous parts with tools more than 2.5 mm in diameter. The
equipment inside the enclosure is protected against entry by solid foreign objects larger than 2.5 mm in diameter.
0: Not protected against use in hazardous locations. The enclosure does not protected against entry by solid foreign objects.
Shipping precautions
Handling the Instrument
To avoid electric shock, do not open the instrument's case. The internal compo-nents of the instrument carry high voltages and may become very hot duringoperation.
• If the instrument exhibits abnormal operation or display during use, review the infor-mation in "14.2 Trouble Shooting" (p.216) and "14.3 Error Indication" (p.218) beforecontacting your dealer or Hioki representative.
• To avoid damage to the instrument, protect it from physical shock when transportingand handling. Be especially careful to avoid physical shock from dropping.
• The protection rating for the enclosure of this device (based on EN60529) is *IP30.
This instrument may cause interference if used in residential areas. Such use must beavoided unless the user takes special measures to reduce electromagnetic emissionsto prevent interference to the reception of radio and television broadcasts.
Handling the cords and clamp sensors
• To prevent damage to the instrument and clamp sensors, never connect or discon-nect a sensor while the clamp sensor is clamped around a conductor.
• To avoid damaging the power cord, grasp the plug, not the cord, when unplugging itfrom the power outlet.
• To avoid breaking the cables, do not bend or pull them.• For safety reasons, when taking measurements, only use the L1000 Voltage Cord.• Avoid stepping on or pinching cables, which could damage the cable insulation.• Keep the cables well away from heat sources, as bare conductors could be exposed
if the insulation melts.• When disconnecting the BNC connector, be sure to release the lock before pulling off
the connector. Forcibly pulling the connector without releasing the lock, or pulling onthe cable, can damage the connector.
• To avoid damaging the output cable, grasp the connector, not the cable, whenunplugging the cable.
• When disconnecting the clamp sensor from the instrument, be sure to grip the part ofthe connector with the arrows and pull it straight out. Gripping the connector else-where or pulling with excessive force may damage the connector.
Usage Notes
8
About the AC adapter
• Use the 9217 Connection Cord (resin) when connecting to insulated BNC connector(resin), and the 9165 Connection Cord (metal) when connecting to metallic BNC con-nector (metal). If you connect metal BNC cable to insulated BNC connector, the insu-lated BNC connector can be damaged and the connection equipment may bedamaged.
• Be careful to avoid dropping the clamp sensors or otherwise subjecting them tomechanical shock, which could damage the mating surfaces of the core andadversely affect measurement.
• Keep the clamp jaws and core slits free from foreign objects, which could interferewith clamping action.
• Keep the clamp closed when not in use, to avoid accumulating dust or dirt on themating core surfaces, which could interfere with clamp performance.
Use only the specified voltage cords and input cables. Using a non-specified cable mayresult in incorrect measurements due to poor connection or other reasons.
Before Connecting Measurement Cables
• To avoid electric shock, turn off the power to all devices before plugging orunplugging any cables or peripherals.
• Be sure to connect the voltage input and current input terminals correctly. Anincorrect connection could damage or short circuit this instrument.
• In order to prevent electric shock or device damage, observe the following pre-cautions when making connections to the external control terminals and otherinterface connectors.
• Turn off the instrument and any equipment being connected before connectingthe measurement cables.
• Exercise care not to exceed the ratings of external control terminal and inter-face connector signals.
• Make connections securely to avoid the risk of connections coming loose dur-ing instrument operation and bringing wires into contact with other electricallyconductive parts.
• Ensure that devices and systems to be connected to the external control termi-nals are properly isolated.
• To avoid electric shock and short-circuit accidents, use only the supplied voltagecords to connect the instrument input terminals to the circuit to be tested.
Always turn both devices OFF when connecting and disconnecting an interfaceconnector.
• To avoid electrical accidents and to maintain the safety specifications of thisinstrument, connect the power cord only to a 3-contact (two-conductor +ground) outlet.
• Turn the instrument off before connecting the AC adapter to the instrument andto AC power.
• Use only the supplied Model Z1002 AC Adapter. AC adapter input voltage rangeis 100 to 240 VAC (with ±10% stability) at 50/60 Hz. To avoid electrical hazardsand damage to the instrument, do not apply voltage outside of this range.
Usage Notes
9
About the battery pack
Others
For battery operation, use only the HIOKI Model Z1003 Battery Pack. We do nottake any responsibility for accidents or damage related to the use of any otherbatteries.
• The battery pack is subject to self-discharge. Be sure to charge the battery packbefore initial use. If the battery capacity remains very low after correct recharging, theuseful battery life is at an end.
• To avoid problems with battery operation, remove the batteries from the instrument ifit is to be stored several week or more.
Avoid using an uninterruptible power supply (UPS) or DC/AC inverter with rectangularwave or pseudo-sine-wave output to power the instrument. Doing so may damage theinstrument.
Before Connecting to the Lines to be Measured
• To avoid short circuits and potentially life-threatening hazards, never attach theclamp sensor to a circuit that operates at more than the maximum rated volt-age to earth (See your clamp sensor's instruction manual for its maximum ratings.)
• The maximum input voltage is 1000 VAC, ±600 VDC. Attempting to measurevoltage in excess of the maximum input could destroy the instrument andresult in personal injury or death.
• To avoid electrical hazards and damage to the instrument, do not apply voltageexceeding the rated maximum to the input terminals.
• The maximum rated voltage between input terminals and ground is 600 VDC/AC. Attempting to measure voltages exceeding 600 V with respect to groundcould damage the instrument and result in personal injury.
• Connect the clamp sensors or voltage cords to the instrument first, and then tothe active lines to be measured. Observe the following to avoid electric shockand short circuits.
• Do not allow the voltage cord clips to touch two wires at the same time. • Never touch the edge of the metal clips.• When the clamp sensor is opened, do not allow the metal part of the clamp to
touch any exposed metal, or to short between two lines, and do not use overbare conductors.
• When connecting a clip-type input cord, you will need to clip the line to the ter-minal while it is hot. Bringing two wires into contact with each other while con-necting the clips will cause a short-circuit.
• To prevent electrical shock and personnel injury, do not touch any input termi-nals on the VT (PT), CT or the instrument when they are in operation.
Usage Notes
10
• To avoid electrical accidents, confirm that all connections are secure. Theincreased resistance of loose connections can lead to overheating and fire.
• Ensure that the input does not exceed the maximum input voltage or current toavoid instrument damage, short-circuiting and electric shock resulting fromheat building.
• To avoid electric shock when measuring live lines, wear appropriate protectivegear, such as insulated rubber gloves, boots and a safety helmet.
When the instrument's power is turned off, do not apply voltage to the instrument.Doing so may damage the instrument.
While Measuring
If an abnormality such as smoke, strange sound or offensive smell occurs, stopmeasuring immediately, disconnect from the measurement lines, turn off theinstrument, unplug the power cord from the outlet, and undo any changes to thewiring. Contact your dealer or Hioki representative as soon as possible. Continu-ing to use the instrument may result in fire or electric shock.
1
1.1 Product Overview
11
1
Chapter 1 O
verview
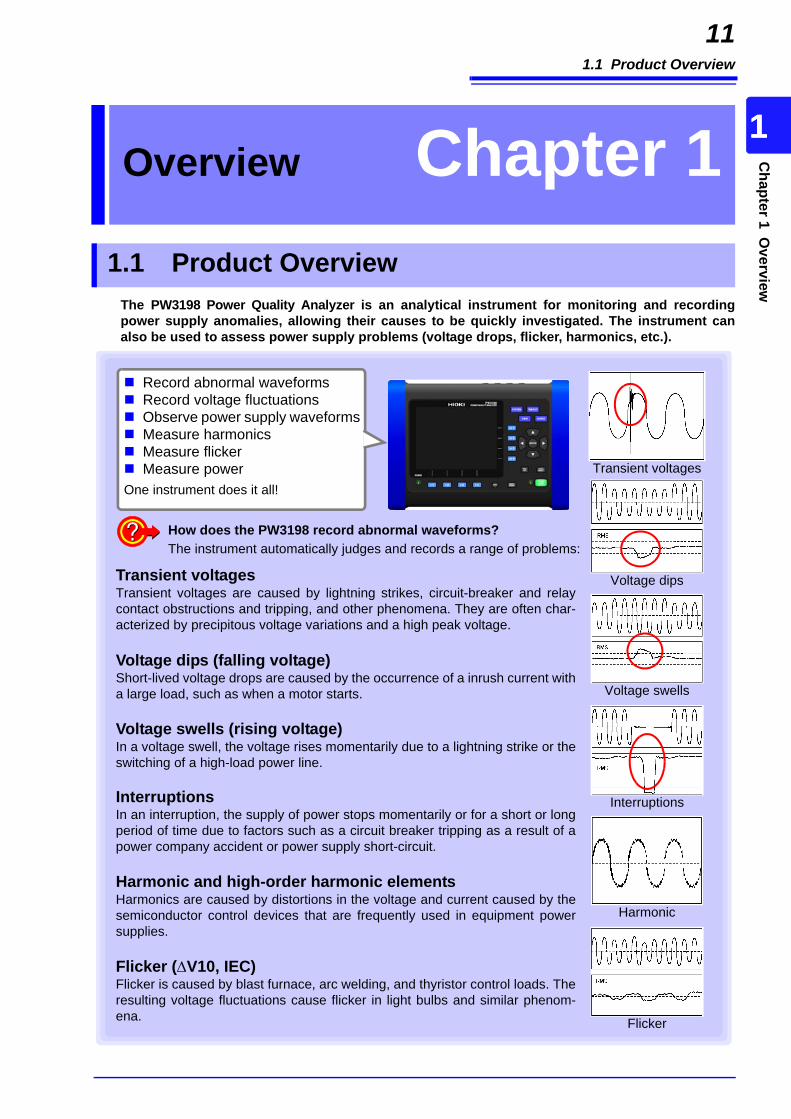
The PW3198 Power Quality Analyzer is an analytical instrument for monitoring and recordingpower supply anomalies, allowing their causes to be quickly investigated. The instrument canalso be used to assess power supply problems (voltage drops, flicker, harmonics, etc.).
Overview Chapter 11.1 Product Overview
Record abnormal waveforms Record voltage fluctuations Observe power supply waveforms Measure harmonics Measure flicker Measure powerOne instrument does it all!
How does the PW3198 record abnormal waveforms?The instrument automatically judges and records a range of problems:
Transient voltagesTransient voltages are caused by lightning strikes, circuit-breaker and relaycontact obstructions and tripping, and other phenomena. They are often char-acterized by precipitous voltage variations and a high peak voltage.
Flicker (V10, IEC)Flicker is caused by blast furnace, arc welding, and thyristor control loads. Theresulting voltage fluctuations cause flicker in light bulbs and similar phenom-ena.
Voltage dips (falling voltage)Short-lived voltage drops are caused by the occurrence of a inrush current witha large load, such as when a motor starts.
InterruptionsIn an interruption, the supply of power stops momentarily or for a short or longperiod of time due to factors such as a circuit breaker tripping as a result of apower company accident or power supply short-circuit.
Voltage swells (rising voltage)In a voltage swell, the voltage rises momentarily due to a lightning strike or theswitching of a high-load power line.
Harmonic and high-order harmonic elementsHarmonics are caused by distortions in the voltage and current caused by thesemiconductor control devices that are frequently used in equipment powersupplies.
Transient voltages
Voltage dips
Voltage swells
Interruptions
Harmonic
Flicker

1.2 Features
12
1.2 Features
Extensive selection of clamp sensors(Available rated for use with sig-nals ranging from leak currentsto a maximum of 5,000 A.)
High precisionVoltage measurement accuracy of ±0.1%rdg.Complies with the new IEC61000-4-30 Class A international powerquality standard.
SafetyCat IV 600 V compliant. Capable of measuring lead-inwires on their primary side.
Measurement of transient voltages of up to 6,000 V from 5 kHz to 700 kHz
SD memory card data storageBy allowing the PW3198 to record data continu-ously for up to one year, the ability to use high-capacity 2 GB memory cards inspires peace ofmind.
Easy downloading of data to a computer via USB or LANSeparately available software simplifies analy-sis.
Support for 400 Hz lines
Simultaneous 3-channel measure-ment of V10 flicker
Ability to measure all parameters necessary for power quality measurement
Measurement of high-order harmonic components from 2 kHz to 80 kHz
ReliableQuick setup functionalityensures you won't missthe occurrence of anyabnormal phenomena.
Capable of accommodating 1-phase 2-wire, 1-phase 3-wire, 3-phase 3-wire,and 3-phase 4-wire power supplies.
Features isolated channels for equipment analysis, neutral line ground faultmeasurement, and measurement of power supply lines from separate systems.
Lets you select line voltage or phase voltage. Includes -Y conversion and Y-conversion functionality.
Features a TFT color LCD that is easily visible in both bright and dark settings.
Capable of true simultaneous measurement with gap-less continuous opera-tion, assuring your ability to reliably capture target phenomena.
Capable of accurately assessing the time at which phenomena occur. A GPSoption allows time correction.
Can be operated with peace of mind during an extended power outage thanksto a generous battery drive time of 180 minutes.
1
1.3 Measurement Flowchart
13
1
Chapter 1 O
verview
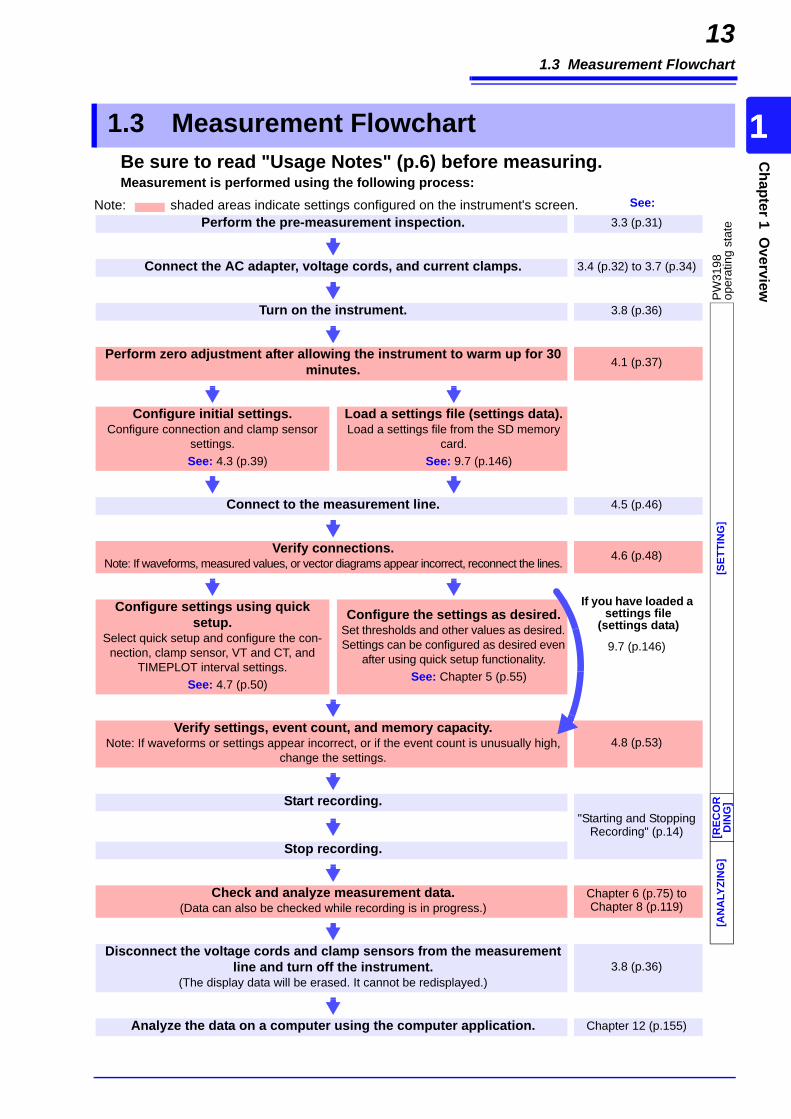
Be sure to read "Usage Notes" (p.6) before measuring.Measurement is performed using the following process:
1.3 Measurement Flowchart
Note: shaded areas indicate settings configured on the instrument's screen. Perform the pre-measurement inspection. 3.3 (p.31)
PW31
98
oper
atin
g st
ate
Connect the AC adapter, voltage cords, and current clamps. 3.4 (p.32) to 3.7 (p.34)
Turn on the instrument. 3.8 (p.36)
[SET
TIN
G]
Perform zero adjustment after allowing the instrument to warm up for 30 minutes. 4.1 (p.37)
Configure initial settings.Configure connection and clamp sensor
settings. See: 4.3 (p.39)
Load a settings file (settings data).Load a settings file from the SD memory
card.See: 9.7 (p.146)
Connect to the measurement line. 4.5 (p.46)
Verify connections.Note: If waveforms, measured values, or vector diagrams appear incorrect, reconnect the lines.
4.6 (p.48)
9.7 (p.146)
Configure settings using quick setup.
Select quick setup and configure the con-nection, clamp sensor, VT and CT, and
TIMEPLOT interval settings.See: 4.7 (p.50)
Configure the settings as desired.Set thresholds and other values as desired. Settings can be configured as desired even
after using quick setup functionality.See: Chapter 5 (p.55)
Verify settings, event count, and memory capacity.Note: If waveforms or settings appear incorrect, or if the event count is unusually high,
change the settings. 4.8 (p.53)
Start recording."Starting and Stopping
Recording" (p.14) [REC
OR
DIN
G]
Stop recording.
[AN
ALY
ZIN
G]
Check and analyze measurement data.(Data can also be checked while recording is in progress.)
Chapter 6 (p.75) to Chapter 8 (p.119)
Disconnect the voltage cords and clamp sensors from the measurement line and turn off the instrument.
(The display data will be erased. It cannot be redisplayed.)3.8 (p.36)
Analyze the data on a computer using the computer application. Chapter 12 (p.155)
See:
If you have loaded a settings file
(settings data)
1.3 Measurement Flowchart
14
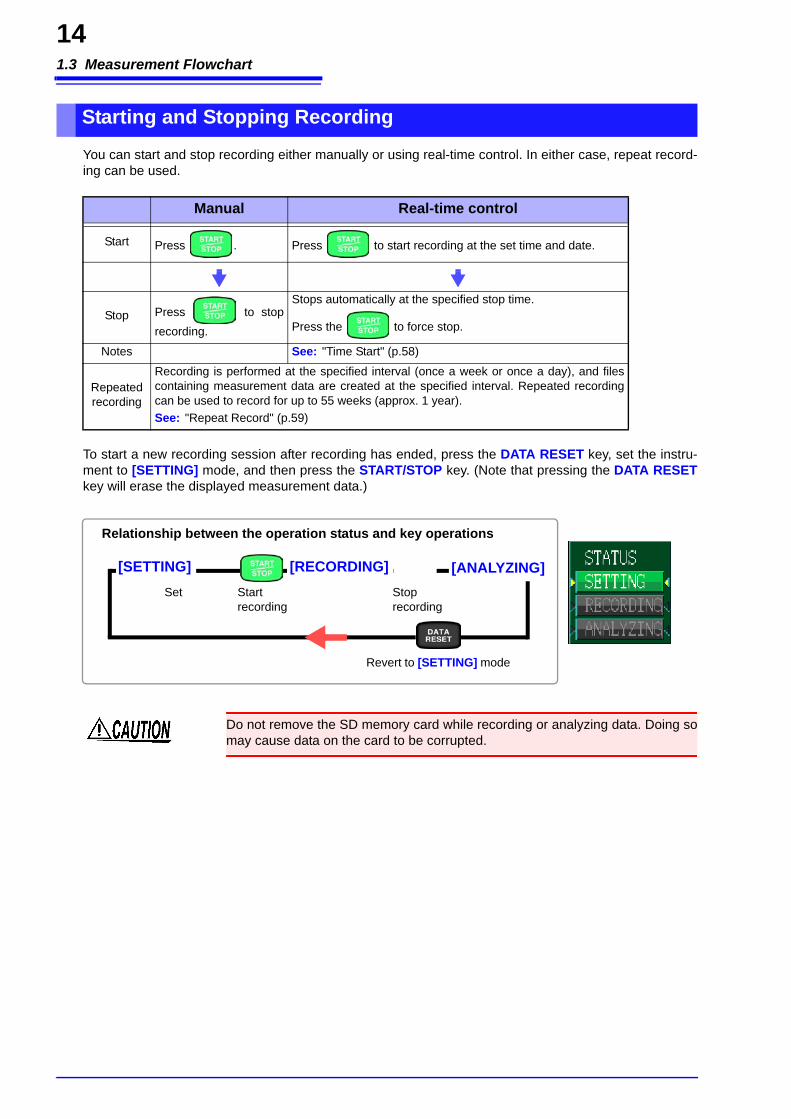
You can start and stop recording either manually or using real-time control. In either case, repeat record-ing can be used.
To start a new recording session after recording has ended, press the DATA RESET key, set the instru-ment to [SETTING] mode, and then press the START/STOP key. (Note that pressing the DATA RESETkey will erase the displayed measurement data.)
Starting and Stopping Recording
Manual Real-time control
Start Press . Press to start recording at the set time and date.
Stop Press to stoprecording.
Stops automatically at the specified stop time.
Press the to force stop.
Notes See: "Time Start" (p.58)
Repeated recording
Recording is performed at the specified interval (once a week or once a day), and filescontaining measurement data are created at the specified interval. Repeated recordingcan be used to record for up to 55 weeks (approx. 1 year). See: "Repeat Record" (p.59)
Relationship between the operation status and key operations
[SETTING] [RECORDING] [ANALYZING]Start recording
Stop recording
Revert to [SETTING] mode
Set
Do not remove the SD memory card while recording or analyzing data. Doing somay cause data on the card to be corrupted.

2
2.1 Names and Functions of Parts
15C
hapter 2 Nam
es and Functions of Parts Basic O
perations & Screens
Names and Functions of Parts Basic Operations & Screens Chapter 2
2.1 Names and Functions of Parts
Display6.5" TFT color LCD displaySee: "Display Items and Screen Types" (p.20)
Front
F key (Function key)Select and change display con-tents and settings.See:"2.2 Basic Operations" (p.19)
Operation keysSee:(p.16)
POWER LEDLights up when the POWER switch is turned on and power is supplied to the in-strument.Normal operation: Solid greenWhen using battery pack: Solid redSee: "3.8 Turning the Power On and Off (Set-
ting the Default Language)" (p.36)
START/STOP LEDWhen in the recording standby state: Flashing greenWhen recording: Solid green
2.1 Names and Functions of Parts
16
START/STOP keyStarts and stops recording. To resume re-cording, press the DATA RESET key to re-set the data followed by the START/STOPkey.
Operation keys
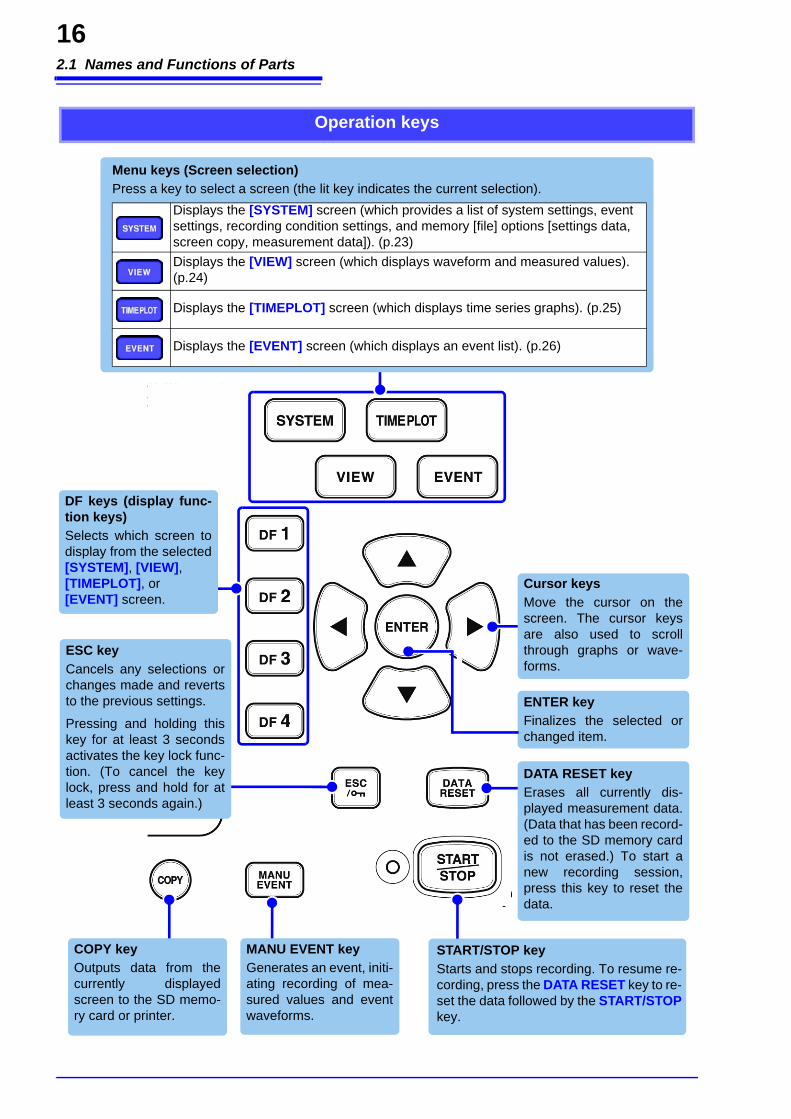
Menu keys (Screen selection)Press a key to select a screen (the lit key indicates the current selection).
Displays the [SYSTEM] screen (which provides a list of system settings, event settings, recording condition settings, and memory [file] options [settings data, screen copy, measurement data]). (p.23)Displays the [VIEW] screen (which displays waveform and measured values). (p.24)
Displays the [TIMEPLOT] screen (which displays time series graphs). (p.25)
Displays the [EVENT] screen (which displays an event list). (p.26)
Cursor keysMove the cursor on thescreen. The cursor keysare also used to scrollthrough graphs or wave-forms.
ENTER keyFinalizes the selected orchanged item.
DF keys (display func-tion keys)Selects which screen todisplay from the selected[SYSTEM], [VIEW], [TIMEPLOT], or [EVENT] screen.
MANU EVENT keyGenerates an event, initi-ating recording of mea-sured values and eventwaveforms.
COPY keyOutputs data from thecurrently displayedscreen to the SD memo-ry card or printer.
ESC keyCancels any selections orchanges made and revertsto the previous settings.
Pressing and holding thiskey for at least 3 secondsactivates the key lock func-tion. (To cancel the keylock, press and hold for atleast 3 seconds again.)
DATA RESET keyErases all currently dis-played measurement data.(Data that has been record-ed to the SD memory cardis not erased.) To start anew recording session,press this key to reset thedata.
2
2.1 Names and Functions of Parts
17C
hapter 2 Nam
es and Functions of Parts Basic O
perations & Screens
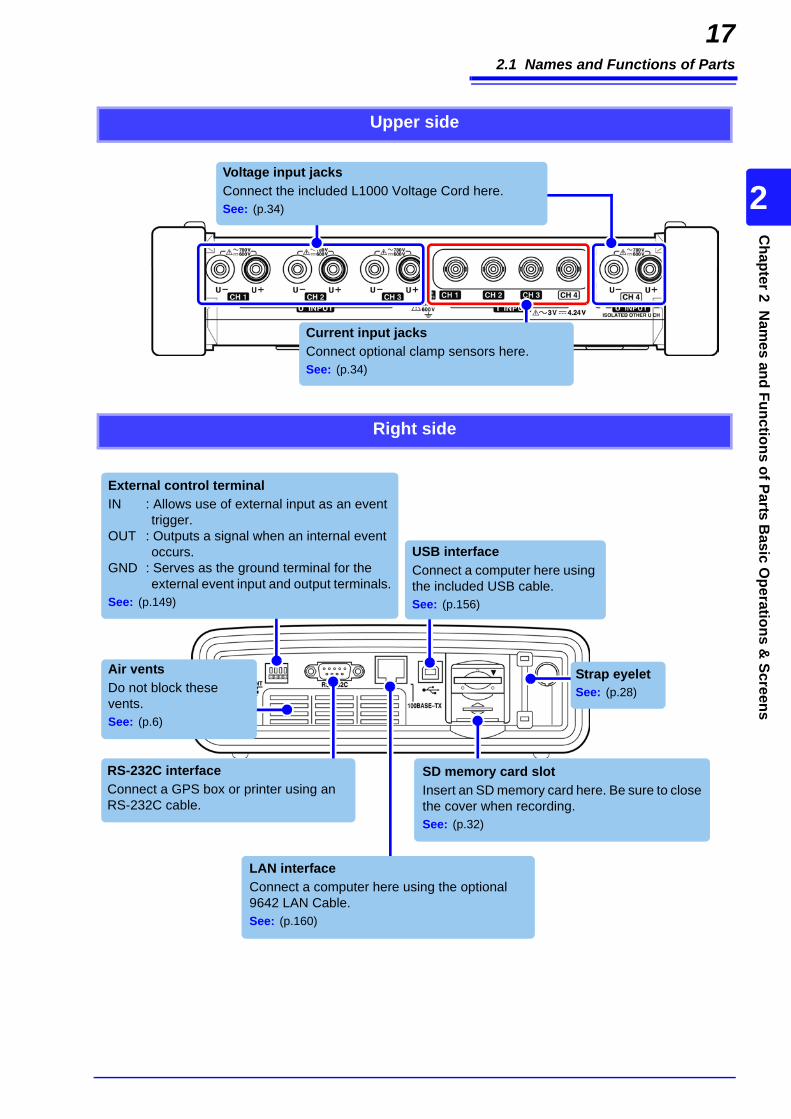
Upper side
Current input jacksConnect optional clamp sensors here.See: (p.34)
Voltage input jacksConnect the included L1000 Voltage Cord here.See: (p.34)
Right side
LAN interfaceConnect a computer here using the optional 9642 LAN Cable.See: (p.160)
RS-232C interfaceConnect a GPS box or printer using an RS-232C cable.
External control terminalIN : Allows use of external input as an event
trigger.OUT : Outputs a signal when an internal event
occurs.GND : Serves as the ground terminal for the
external event input and output terminals.See: (p.149)
Air ventsDo not block these vents.See: (p.6)
USB interfaceConnect a computer here using the included USB cable.See: (p.156)
Strap eyeletSee: (p.28)
SD memory card slotInsert an SD memory card here. Be sure to close the cover when recording.See: (p.32)
2.1 Names and Functions of Parts
18
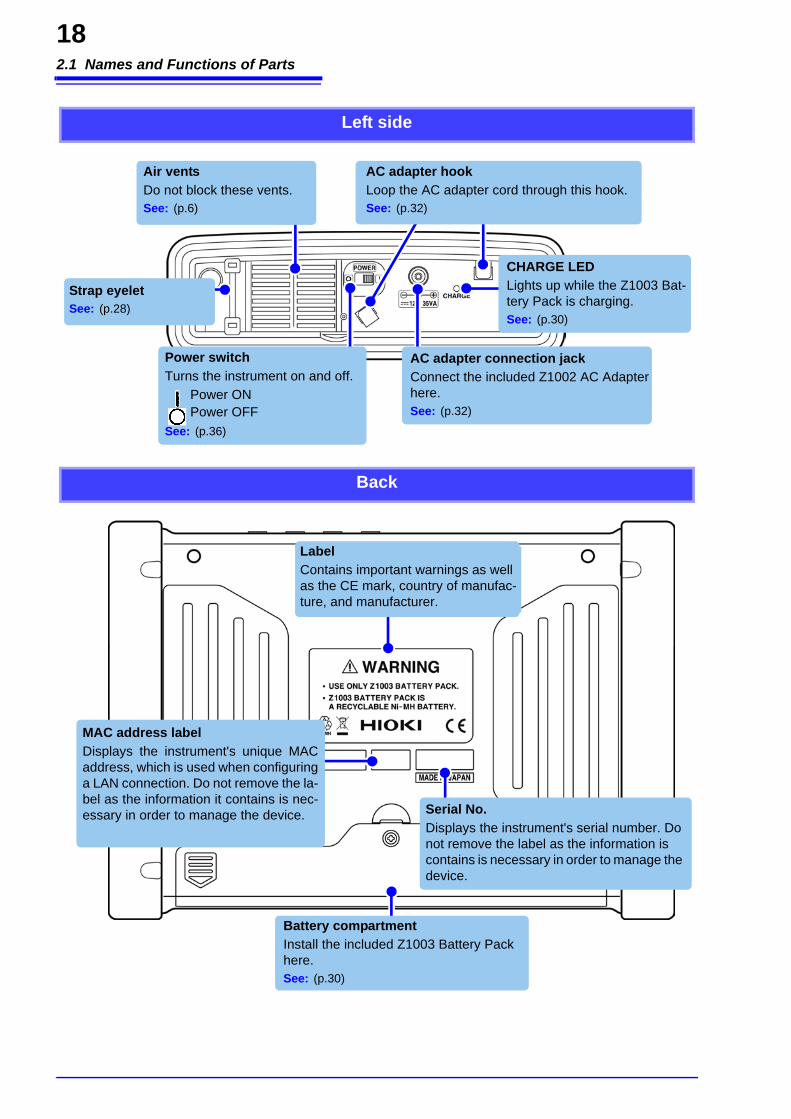
Left side
AC adapter connection jackConnect the included Z1002 AC Adapter here.See: (p.32)
Power switchTurns the instrument on and off.
See: (p.36)
Power ONPower OFF
CHARGE LEDLights up while the Z1003 Bat-tery Pack is charging.See: (p.30)
Strap eyeletSee: (p.28)
AC adapter hookLoop the AC adapter cord through this hook.See: (p.32)
Air ventsDo not block these vents.See: (p.6)
Back
LabelContains important warnings as well as the CE mark, country of manufac-ture, and manufacturer.
Serial No.Displays the instrument's serial number. Do not remove the label as the information is contains is necessary in order to manage the device.
MAC address labelDisplays the instrument's unique MACaddress, which is used when configuringa LAN connection. Do not remove the la-bel as the information it contains is nec-essary in order to manage the device.
Battery compartmentInstall the included Z1003 Battery Pack here.See: (p.30)

2
2.2 Basic Operations
19C
hapter 2 Nam
es and Functions of Parts Basic O
perations & Screens
2.2 Basic Operations
2
3
4
5
67
8 9
1
4 Select and finalize the desired settings.
Display a pull-down menu
Select the desired setting
Accept setting
Move the cursor to the desired setting
1 To select a display screenPress SYSTEM, VIEW,TIME PLOT, or EVENT to display the correspond-ing screen.See: "2.3 Display Items and Screen Types" (p.20)
To change a value
Select the value so that it can be changed
Select a digit
Select a value
Accept setting
Move the cursor to the desired setting
5 Start/stop recording.Press the START/STOP key to start/stop recording.
See: "Starting and Stopping Recording" (p.14)
6 Revert to [SETTING] mode after stopping recording.Press the DATA RESET key to reset the measurement data.The instrument will return to [SETTING] mode from [ANALYZ-ING] mode.
3 To select and change display contents and settingsPress one of the F keys to select and change display contentsand settings. The displayed function labels depend on the cur-rently displayed screen.Freeze the waveform or value display.On the [VIEW] screen, you can freeze the waveform or valuedisplay by pressing the F4 [HOLD] key.
Cancel
Cancel the setting
7 Engage the key lock.Press and hold the ESC key for at least 3 seconds. To cancelthe key lock, press and hold the key for at least 3 seconds.
8 Save screen data (output it to a printer).Press the COPY key. Data will be saved to the SDcard (or output to the printer).See: "9.5 Saving, Displaying, and Deleting Screen Copies"
(p.144)
9 Generate an event manually.Press the MANU EVENT key. Mea-sured values and event waveformsat that time will be recorded.See: "Manual Events" (p.13)
2 Select the screen to display.Press one of the DF keysto select and change dis-play contents and set-tings. The displayedfunction labels dependon the currently dis-played screen.
2.3 Display Items and Screen Types
20
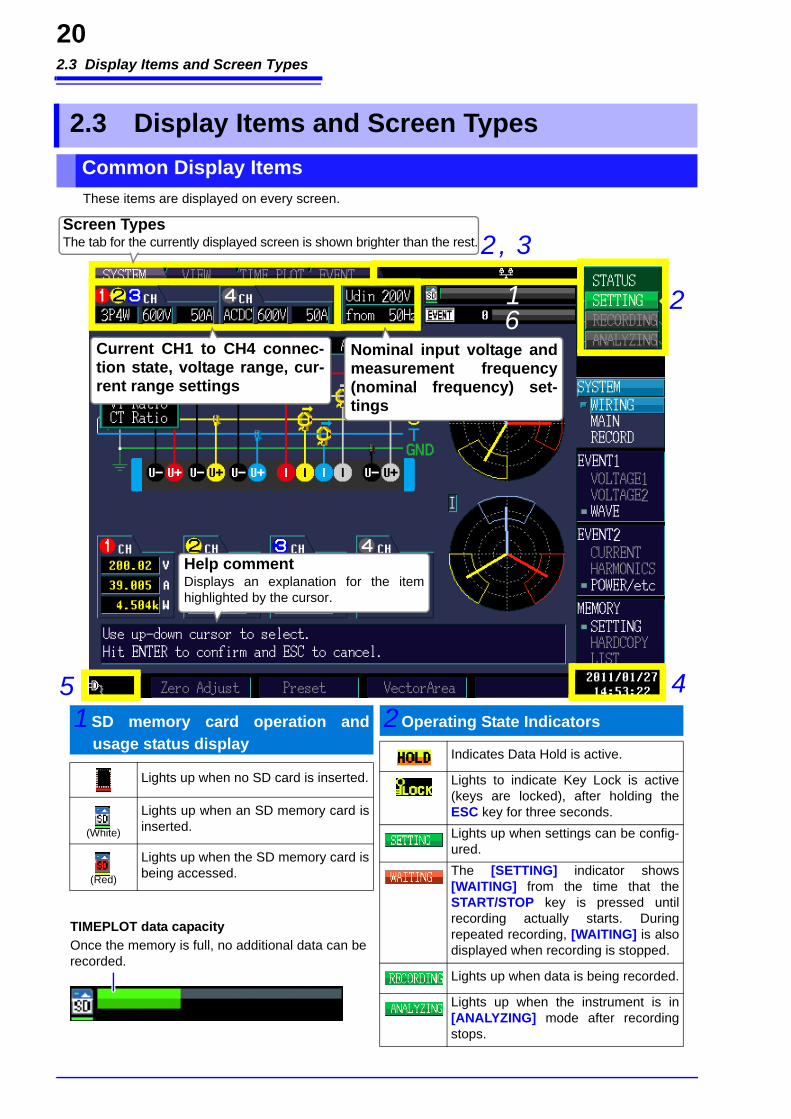
These items are displayed on every screen.
2.3 Display Items and Screen TypesCommon Display Items
5
Screen TypesThe tab for the currently displayed screen is shown brighter than the rest.
21
2, 3
41SD memory card operation and
usage status display
Lights up when no SD card is inserted.
(White)
Lights up when an SD memory card isinserted.
(Red)
Lights up when the SD memory card isbeing accessed.
2Operating State Indicators
Indicates Data Hold is active.
Lights to indicate Key Lock is active(keys are locked), after holding theESC key for three seconds.Lights up when settings can be config-ured.The [SETTING] indicator shows[WAITING] from the time that theSTART/STOP key is pressed untilrecording actually starts. Duringrepeated recording, [WAITING] is alsodisplayed when recording is stopped.
Lights up when data is being recorded.
Lights up when the instrument is in[ANALYZING] mode after recordingstops.
Current CH1 to CH4 connec-tion state, voltage range, cur-rent range settings
Nominal input voltage andmeasurement frequency(nominal frequency) set-tings
TIMEPLOT data capacityOnce the memory is full, no additional data can berecorded.
Help commentDisplays an explanation for the itemhighlighted by the cursor.
6
2
2.3 Display Items and Screen Types
21C
hapter 2 Nam
es and Functions of Parts Basic O
perations & Screens
Displays the current year, month, day, hour, minute,and second.See: Setting the Clock: (p.65)
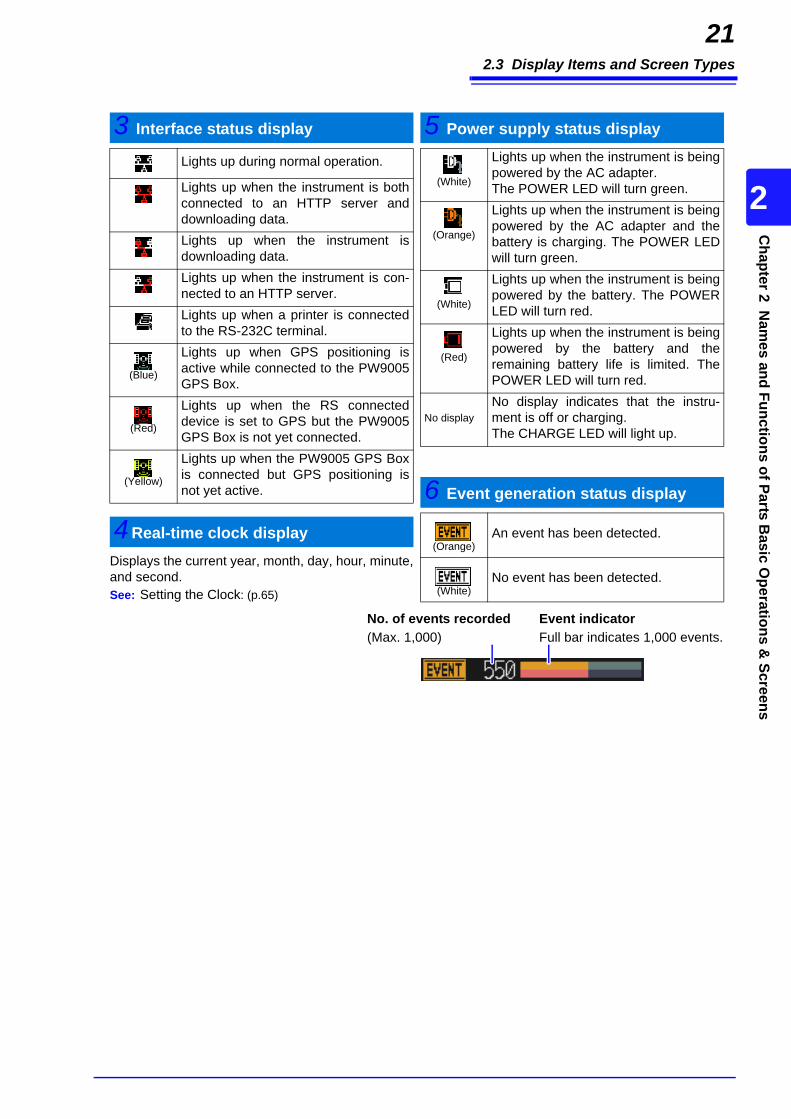
3 Interface status display
Lights up during normal operation.
Lights up when the instrument is bothconnected to an HTTP server anddownloading data.Lights up when the instrument isdownloading data.Lights up when the instrument is con-nected to an HTTP server.Lights up when a printer is connectedto the RS-232C terminal.
(Blue)
Lights up when GPS positioning isactive while connected to the PW9005GPS Box.
(Red)
Lights up when the RS connecteddevice is set to GPS but the PW9005GPS Box is not yet connected.
(Yellow)
Lights up when the PW9005 GPS Boxis connected but GPS positioning isnot yet active.
4Real-time clock display
5 Power supply status display
(White)
Lights up when the instrument is beingpowered by the AC adapter.The POWER LED will turn green.
(Orange)
Lights up when the instrument is beingpowered by the AC adapter and thebattery is charging. The POWER LEDwill turn green.
(White)
Lights up when the instrument is beingpowered by the battery. The POWERLED will turn red.
(Red)
Lights up when the instrument is beingpowered by the battery and theremaining battery life is limited. ThePOWER LED will turn red.
No displayNo display indicates that the instru-ment is off or charging. The CHARGE LED will light up.
6 Event generation status display
(Orange)An event has been detected.
(White)No event has been detected.
Event indicatorFull bar indicates 1,000 events.
No. of events recorded(Max. 1,000)
2.3 Display Items and Screen Types
22
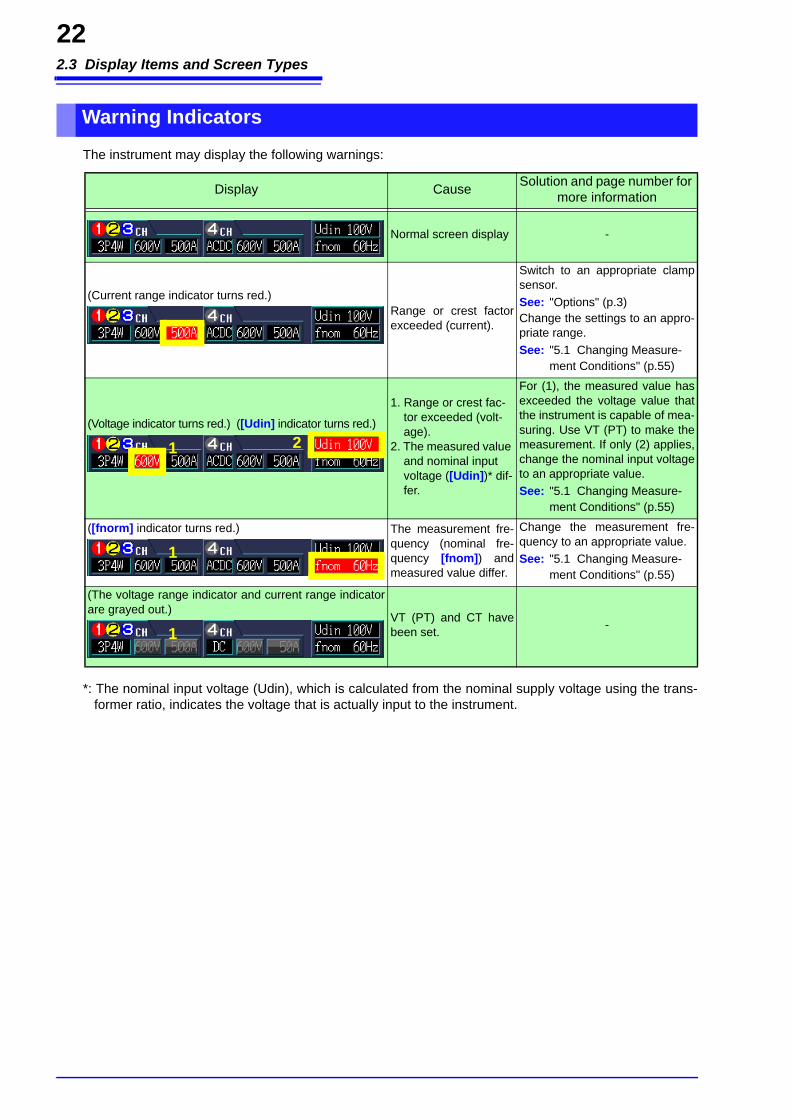
The instrument may display the following warnings:
*: The nominal input voltage (Udin), which is calculated from the nominal supply voltage using the trans-former ratio, indicates the voltage that is actually input to the instrument.
Warning Indicators
Display Cause Solution and page number for more information
Normal screen display -
(Current range indicator turns red.)Range or crest factorexceeded (current).
Switch to an appropriate clampsensor.See: "Options" (p.3)Change the settings to an appro-priate range.See: "5.1 Changing Measure-
ment Conditions" (p.55)
(Voltage indicator turns red.) ([Udin] indicator turns red.)
1. Range or crest fac-tor exceeded (volt-age).
2. The measured value and nominal input voltage ([Udin])* dif-fer.
For (1), the measured value hasexceeded the voltage value thatthe instrument is capable of mea-suring. Use VT (PT) to make themeasurement. If only (2) applies,change the nominal input voltageto an appropriate value.See: "5.1 Changing Measure-
ment Conditions" (p.55)
([fnorm] indicator turns red.) The measurement fre-quency (nominal fre-quency [fnom]) andmeasured value differ.
Change the measurement fre-quency to an appropriate value.See: "5.1 Changing Measure-
ment Conditions" (p.55)
(The voltage range indicator and current range indicatorare grayed out.)
VT (PT) and CT havebeen set. -
1 2
1
1

2
2.3 Display Items and Screen Types
23C
hapter 2 Nam
es and Functions of Parts Basic O
perations & Screens
Screen Types
Configure settings(SYSTEM screen)
The [SYSTEM] screen is used to configure various instrumentsettings.Press the SYSTEM key to display the [SYSTEM] screen. Thescreen can be changed with the DF keys.
Configures the connection,clamp sensor, VT ratio, andCT ratio settings. (Thisscreen is always displayedafter the instrument is turnedon.)See: Chapter 4 (p.37)
VOLTAGE1
VOLTAGE2
WAVE
WIRING
MAIN
RECORD
SYSTEM
MEASURE
HARDWARE
Zero Adjust
Preset
VectorArea
Configures the recording,TIMEPLOT interval, real-time control, and repeatedrecording settings.See: 5.2 (p.58) to 5.3 (p.61)
Configures the connection, clamp sensor, VT ratio, CT ratio, current range, event, and TIME-PLOT settings.See: 5.1 (p.55)
Configures the display lan-guage, screen color, clock, ex-ternal output, RS-connecteddevice, beep, LCD backlight,and LAN settings. Resets thesystem.See: 5.4 (p.64)EVENT1
Configures the frequency, swell, dip, interruption, transientthreshold, and hysteresis settings.
Configures the RMS voltage, waveform peak, DC fluctuation,harmonic distortion factor, high-order harmonic component, andunbalance factor threshold settings.
See: 5.5 (p.66)
Configures the threshold settings for generating events with thevoltage waveform.
CURRENT
HARMONICS
POWER/etc
EVENT2
Configures the inrush current, RMS current, waveform peak, DCfluctuation, harmonic distortion factor, high-order harmonic com-ponent, unbalance factor, and K factor threshold settings.
Configures the threshold settings for 0- to 50-order harmonics(voltage, current, power, phase).
See: 5.5 (p.66)
Configures the active power, reactive power, apparent power,power factor threshold, timer event, external event, and continu-ous event settings.
See: 4.7 (p.50)
See: 4.1 (p.37)

2.3 Display Items and Screen Types
24
SETTING
HARDCOPY
LIST
MEMORY
Displays a list of settings da-ta.
Displays a list of screenshotdata.
See: Chapter 9 (p.135)
Displays a list of the filesstored on the SD memorycard.
LOAD
SAVE
VIEW
DELETE
DELETE
FORMAT
DELETE
LOAD*
*The List's F1 (LOAD) will appear when the cursor is in the stored data folder. (B*******).
Monitor instantaneous values(VIEW screen)
The [VIEW] screen is used to view voltage and currentinstantaneous waveforms, phase relationships, values, andharmonics.Press the VIEW key to display the [VIEW] screen. Thescreen can be changed with the DF keys.
VOLT/CURR
VOLTAGE
CURRENT
WAVE
Displays voltage waveforms for channels 1 to 4 on one screenand current waveforms for channels 1 to 4 on another screen (fora total of two screens).
Displays separate voltage waveforms for channels 1 to 4.
See: 6.2 (p.76)
Displays separate current waveforms for channels 1 to 4.
VECTOR
GRAPH
LIST
HARMONICS
Displays the phase relationship between voltage and current forchannels 1 to 3 as a vector diagram. The RMS value and phaseinstantaneous value is also shown for each order.See: 6.3 (p.80)
Displays the sum voltage, current, and 0- to 50-order power mea-sured values for channels 1 to 4 as a graph.See: 6.4 (p.83)
Displays the sum voltage, current, power measured values (or-ders 0 to 50) for channels 1 to 4 as a graph.See: 6.4 (p.83)
2
2.3 Display Items and Screen Types
25C
hapter 2 Nam
es and Functions of Parts Basic O
perations & Screens
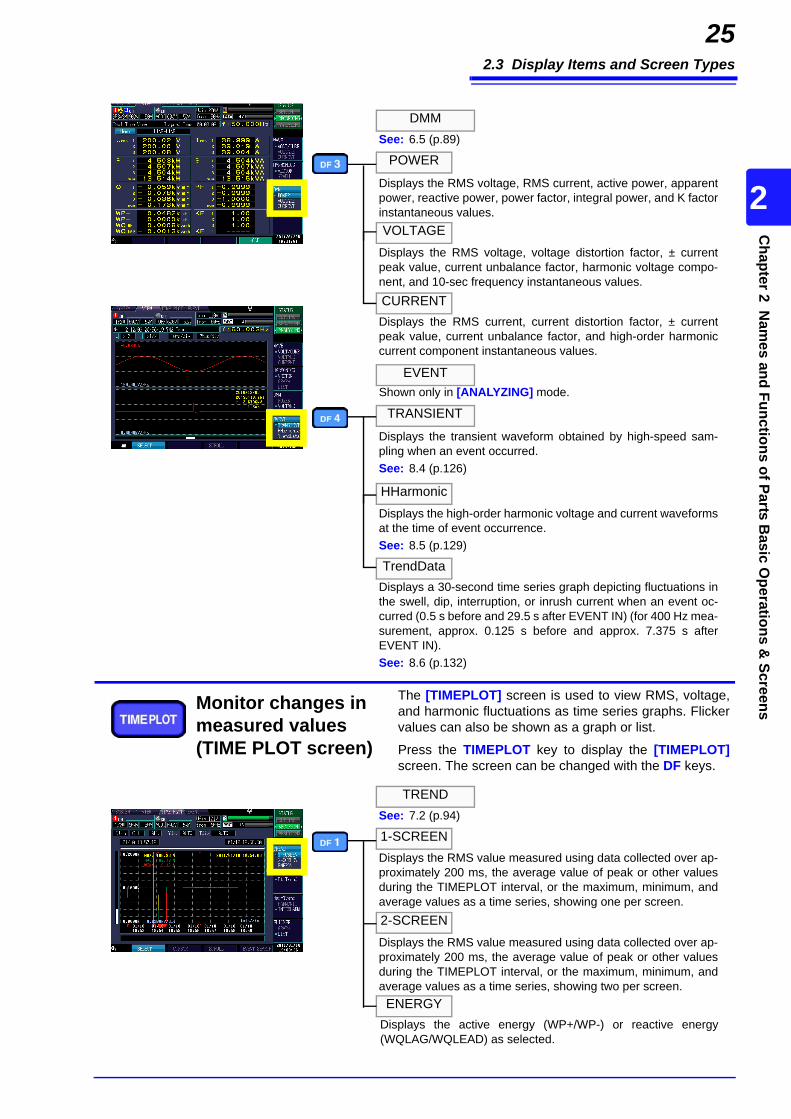
POWER
VOLTAGE
CURRENT
DMM
Displays the RMS voltage, RMS current, active power, apparentpower, reactive power, power factor, integral power, and K factorinstantaneous values.
Displays the RMS voltage, voltage distortion factor, ± currentpeak value, current unbalance factor, harmonic voltage compo-nent, and 10-sec frequency instantaneous values.
See: 6.5 (p.89)
Displays the RMS current, current distortion factor, ± currentpeak value, current unbalance factor, and high-order harmoniccurrent component instantaneous values.
TRANSIENT
HHarmonic
TrendData
EVENT
Displays the transient waveform obtained by high-speed sam-pling when an event occurred.See: 8.4 (p.126)
Displays the high-order harmonic voltage and current waveformsat the time of event occurrence.See: 8.5 (p.129)
Displays a 30-second time series graph depicting fluctuations inthe swell, dip, interruption, or inrush current when an event oc-curred (0.5 s before and 29.5 s after EVENT IN) (for 400 Hz mea-surement, approx. 0.125 s before and approx. 7.375 s afterEVENT IN).See: 8.6 (p.132)
Shown only in [ANALYZING] mode.
1-SCREEN
2-SCREEN
TREND
Displays the RMS value measured using data collected over ap-proximately 200 ms, the average value of peak or other valuesduring the TIMEPLOT interval, or the maximum, minimum, andaverage values as a time series, showing one per screen.
Displays the RMS value measured using data collected over ap-proximately 200 ms, the average value of peak or other valuesduring the TIMEPLOT interval, or the maximum, minimum, andaverage values as a time series, showing two per screen.
See: 7.2 (p.94)
Monitor changes in measured values(TIME PLOT screen)
The [TIMEPLOT] screen is used to view RMS, voltage,and harmonic fluctuations as time series graphs. Flickervalues can also be shown as a graph or list.
Press the TIMEPLOT key to display the [TIMEPLOT]screen. The screen can be changed with the DF keys.
ENERGYDisplays the active energy (WP+/WP-) or reactive energy(WQLAG/WQLEAD) as selected.

2.3 Display Items and Screen Types
26
DtlTrend
DetailTrend
Displays the maximum and minimum values during the TIME-PLOT interval for RMS voltage refreshed each half-cycle, inrushcurrent, S (t), frequency cycle, or other characteristics measuredin half-cycle or one-cycle units.
See: 7.3 (p.101)
HARMONIC
INTERHARM
HarmTrend
Can display 6 orders of harmonics. Displays the average value ormaximum, minimum, and average value during the TIMEPLOTinterval as a time series. (You can select voltage, current, power,or phase to be displayed.)
Can display 6 orders of inter-harmonics. Displays the averagevalue or the maximum, minimum, and average values during theTIMEPLOT interval as a time series. (You can select voltage orcurrent to be displayed.)
See: 7.4 (p.107)
GRAPH
FLICKER
Displays 10V (instantaneous values) or Pst and Plt values as atime series. You can select either 10V flicker or IEC flicker to bedisplayed.
Displays 10V (instantaneous values) or Pst and Plt values as alist. You can select either 10V flicker or IEC flicker to be dis-played.
See: 7.5 (p.111)
LIST
LIST
EVENT
Displays a list of events in the order of their occurrence. Detailedinformation and the waveform at the time of the event occurrenceare also shown for the event selected on the list. You can also an-alyze instantaneous values, waveforms, and other information atthe time of the event's occurrence on the [VIEW] screen.
See: Chapter 8 (p.119)
Monitor event occurrence(EVENT screen)
The [EVENT] screen is used to view a list ofevents that have occurred. In addition to checkingwhether a given event has occurred and the num-ber of times it has occurred, if any, you can viewhigh-order harmonic measured values.
Press the EVENT key to display the [EVENT]screen.
3
3.1 Preparation Flowchart
27C
hapter 3 Measurem
ent Preparations
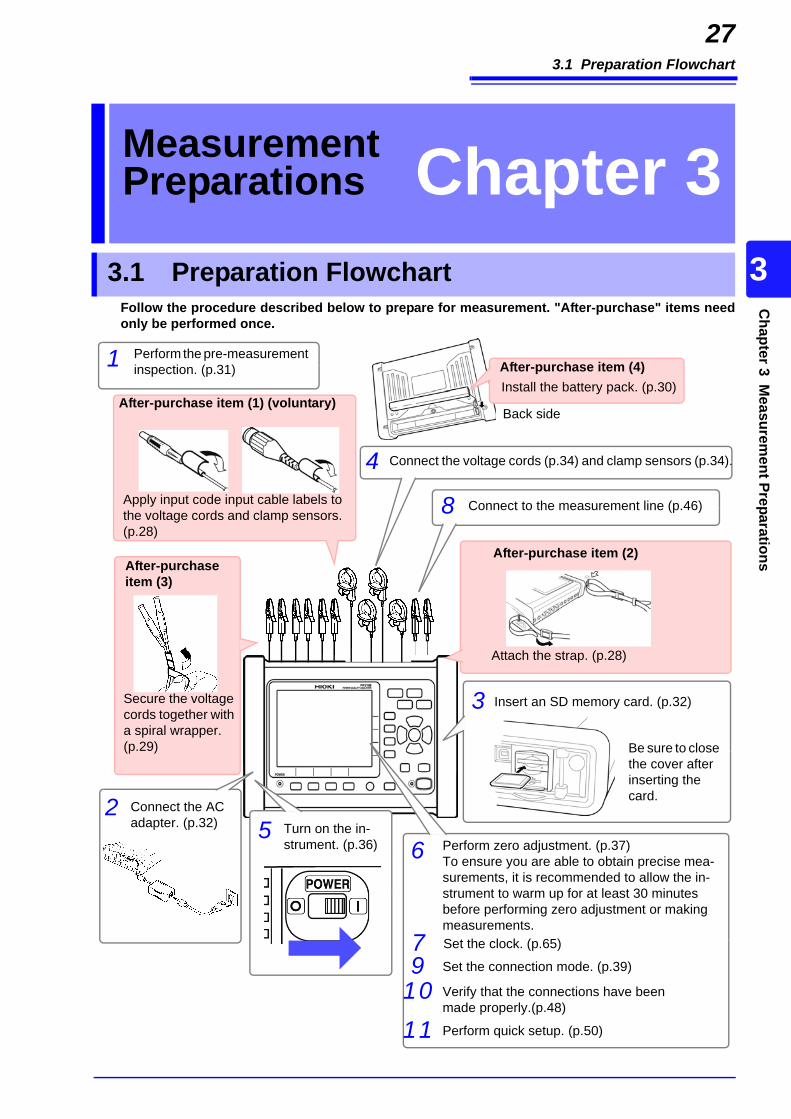
Follow the procedure described below to prepare for measurement. "After-purchase" items needonly be performed once.
Measurement Preparations Chapter 3
3.1 Preparation Flowchart
Apply input code input cable labels to the voltage cords and clamp sensors. (p.28)
Attach the strap. (p.28)
Secure the voltage cords together with a spiral wrapper. (p.29)
Perform the pre-measurement inspection. (p.31)1
After-purchase item (1) (voluntary)
After-purchase item (2)After-purchaseitem (3)
Connect the AC adapter. (p.32)
2
Connect the voltage cords (p.34) and clamp sensors (p.34).4
Turn on the in-strument. (p.36)
5
Set the connection mode. (p.39)9
Connect to the measurement line (p.46)8
Verify that the connections have been made properly.(p.48)
10
Perform quick setup. (p.50)11
Back side
Perform zero adjustment. (p.37)To ensure you are able to obtain precise mea-surements, it is recommended to allow the in-strument to warm up for at least 30 minutes before performing zero adjustment or making measurements.
6
Insert an SD memory card. (p.32)3
After-purchase item (4)Install the battery pack. (p.30)
Set the clock. (p.65)7
Be sure to close the cover after inserting the card.
3.2 Initial Instrument Preparations
28
Perform the following before starting measurement the first time.
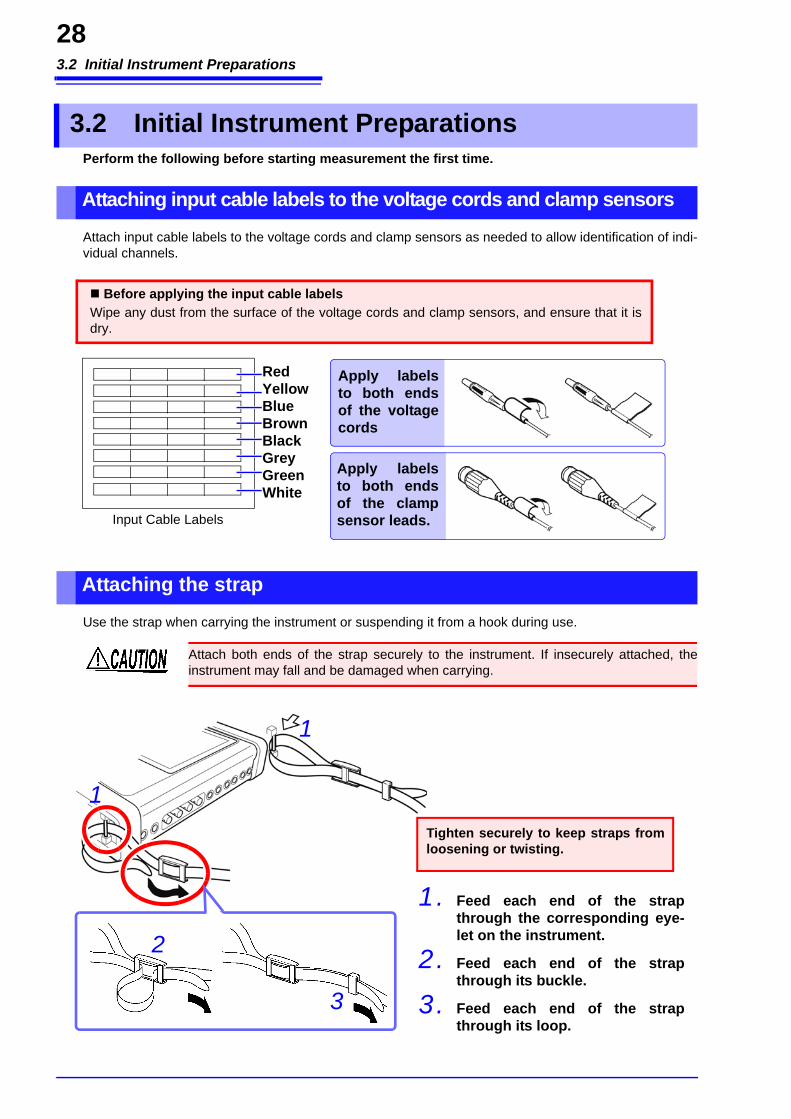
Attach input cable labels to the voltage cords and clamp sensors as needed to allow identification of indi-vidual channels.
Use the strap when carrying the instrument or suspending it from a hook during use.
3.2 Initial Instrument Preparations
Attaching input cable labels to the voltage cords and clamp sensors
RedYellowBlueBrownBlackGreyGreenWhite
Before applying the input cable labelsWipe any dust from the surface of the voltage cords and clamp sensors, and ensure that it isdry.
Input Cable Labels
Apply labelsto both endsof the voltagecords
Apply labelsto both endsof the clampsensor leads.
Attaching the strap
Attach both ends of the strap securely to the instrument. If insecurely attached, theinstrument may fall and be damaged when carrying.
1. Feed each end of the strapthrough the corresponding eye-let on the instrument.
2. Feed each end of the strapthrough its buckle.
3. Feed each end of the strapthrough its loop.
Tighten securely to keep straps fromloosening or twisting.
1
1
2
3
3
3.2 Initial Instrument Preparations
29C
hapter 3 Measurem
ent Preparations
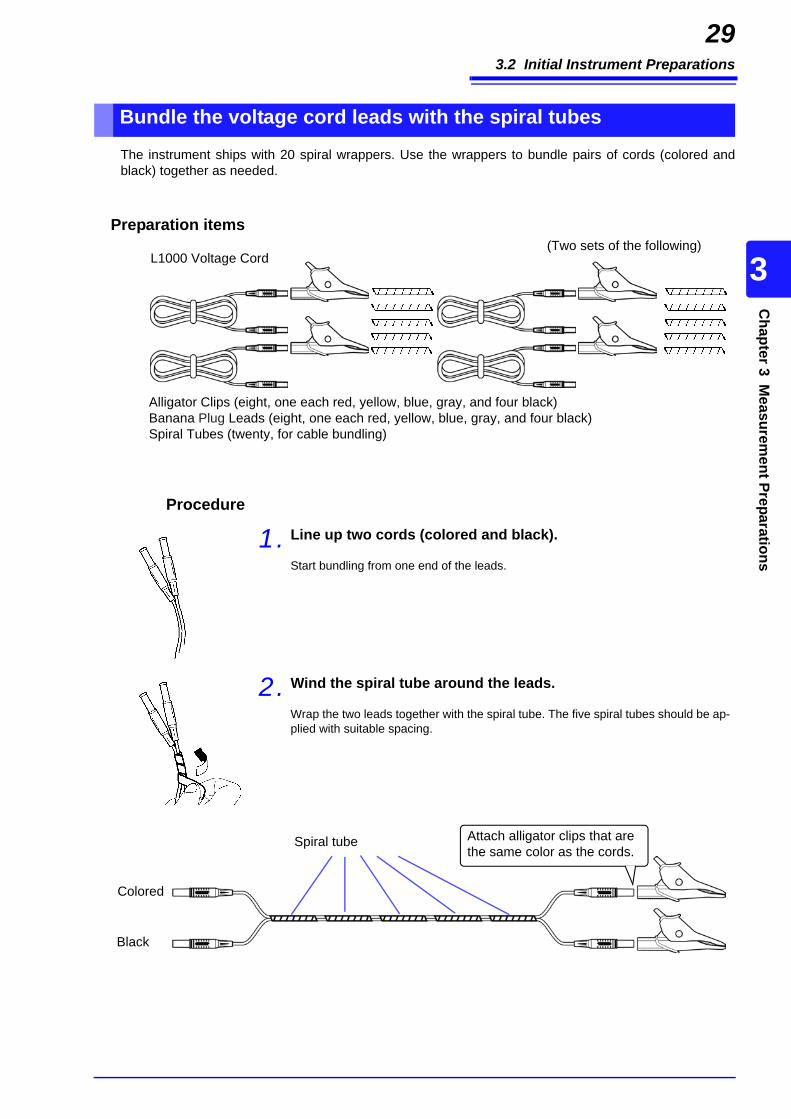
The instrument ships with 20 spiral wrappers. Use the wrappers to bundle pairs of cords (colored andblack) together as needed.
Preparation items
Procedure
Bundle the voltage cord leads with the spiral tubes
L1000 Voltage Cord
Alligator Clips (eight, one each red, yellow, blue, gray, and four black)Banana Plug Leads (eight, one each red, yellow, blue, gray, and four black)Spiral Tubes (twenty, for cable bundling)
(Two sets of the following)
1. Line up two cords (colored and black).
Start bundling from one end of the leads.
2. Wind the spiral tube around the leads.
Wrap the two leads together with the spiral tube. The five spiral tubes should be ap-plied with suitable spacing.
Colored
Black
Spiral tube Attach alligator clips that are the same color as the cords.
3.2 Initial Instrument Preparations
30
c
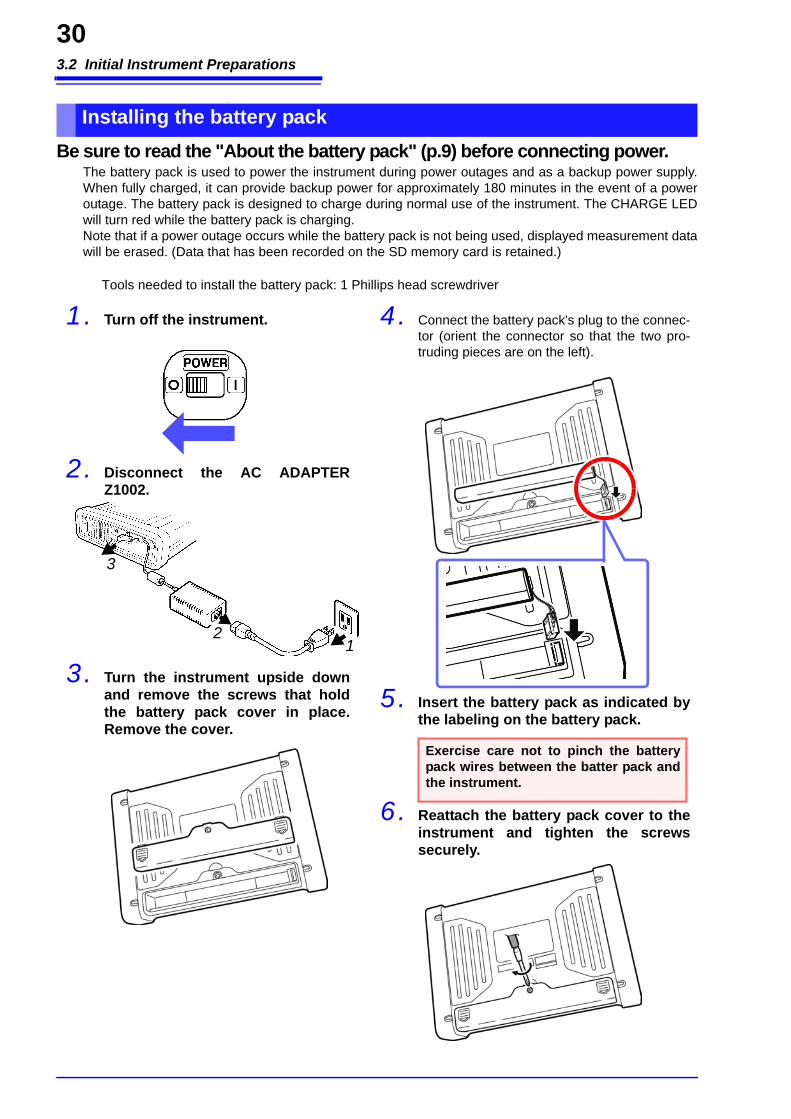
Be sure to read the "About the battery pack" (p.9) before connecting power.The battery pack is used to power the instrument during power outages and as a backup power supply.When fully charged, it can provide backup power for approximately 180 minutes in the event of a poweroutage. The battery pack is designed to charge during normal use of the instrument. The CHARGE LEDwill turn red while the battery pack is charging.Note that if a power outage occurs while the battery pack is not being used, displayed measurement datawill be erased. (Data that has been recorded on the SD memory card is retained.)
Installing the battery pack
4. Connect the battery pack's plug to the connec-tor (orient the connector so that the two pro-truding pieces are on the left).
5. Insert the battery pack as indicated bythe labeling on the battery pack.
6. Reattach the battery pack cover to theinstrument and tighten the screwssecurely.
1. Turn off the instrument.
2. Disconnect the AC ADAPTERZ1002.
3. Turn the instrument upside downand remove the screws that holdthe battery pack cover in place.Remove the cover.
21
Tools needed to install the battery pack: 1 Phillips head screwdriver
Exercise care not to pinch the batterypack wires between the batter pack andthe instrument.
3
3
3.3 Pre-Operation Inspection
31C
hapter 3 Measurem
ent Preparations
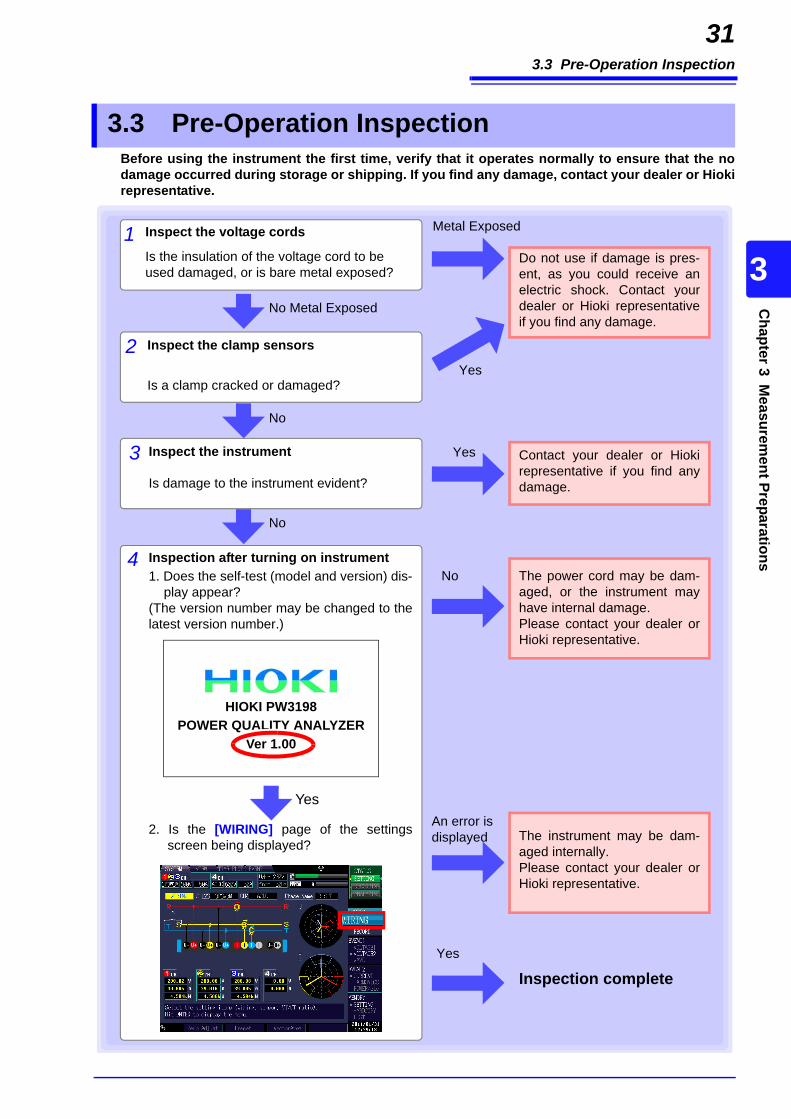
Before using the instrument the first time, verify that it operates normally to ensure that the nodamage occurred during storage or shipping. If you find any damage, contact your dealer or Hiokirepresentative.
3.3 Pre-Operation Inspection
Metal Exposed
No Metal Exposed
Inspect the voltage cords1Do not use if damage is pres-ent, as you could receive anelectric shock. Contact yourdealer or Hioki representativeif you find any damage.
2Yes
Inspect the clamp sensors
Is a clamp cracked or damaged?
An error is displayed
No
Yes
3 YesInspect the instrument
Is damage to the instrument evident?
No
Contact your dealer or Hiokirepresentative if you find anydamage.
4
Yes
Inspection after turning on instrument1. Does the self-test (model and version) dis-
play appear?(The version number may be changed to thelatest version number.)
No
2. Is the [WIRING] page of the settingsscreen being displayed?
The power cord may be dam-aged, or the instrument mayhave internal damage.Please contact your dealer orHioki representative.
The instrument may be dam-aged internally. Please contact your dealer orHioki representative.
Inspection complete
HIOKI PW3198 POWER QUALITY ANALYZER
Ver 1.00
Is the insulation of the voltage cord to be used damaged, or is bare metal exposed?

3.4 Connecting the AC Adapter
32
Be sure to read the "Handling the cords and clamp sensors" (p.7) and "About the AC adapter" (p.8) before connecting power.
Connect the AC adapter to the power inlet on the instrument, and plug it into an outlet.
Insert and remove SD memory cards as follows:
3.4 Connecting the AC Adapter
Connection Procedure
AC adapter Power cord1
3
1. Check that the instrument’spower switch is turned off.Connect the power cord tothe inlet on the AC adapter.
2. Connect the AC adapter’soutput plug to the instru-ment.
3. Plug the power cord's inputplug into an outlet.
Turn off the instrument beforeunplugging the AC adapter.
2
After connecting the output plug, loop the AC adapter cord on ei-ther of the two hooks on the instrument. (This will prevent the cord from being pulled out of the socket.)
Hooks for AC adapter
3.5 Inserting (Removing) an SD Memory Card
• Use only HIOKI-approved SD memory cards (model Z4001, etc). Proper operation is not guar-anteed if other cards are used.
• Format new SD memory cards before use.• Format SD memory cards with the instrument. Using a computer to format the card may
reduce the card’s performance.See:"9.2 Formatting SD Memory Cards" (p.138)
Important
• Inserting a SD card upside down, backwards or in the wrong direction may damagethe instrument.
• Do not turn off the instrument while the SD memory card is being accessed. Neverremove the SD memory card from the instrument. Doing so may cause data on thecard to be corrupted.
• Do not remove the SD memory card while recording or analyzing data. Doing so maycause data on the card to be corrupted.
• The operating lifetime of the SD memory card is limited by its flash memory. Afterlong-term or frequent usage, data reading and writing capabilities will be degraded. Inthat case, replace the card with a new one.
• No compensation is available for loss of data stored on the SD memory card, regard-less of the content or cause of damage or loss. Be sure to back up any important datastored on an SD memory card.
• The SD memory card operation indicator (p.20) will turn red while the card is beingaccessed.
3
3.5 Inserting (Removing) an SD Memory Card
33C
hapter 3 Measurem
ent Preparations
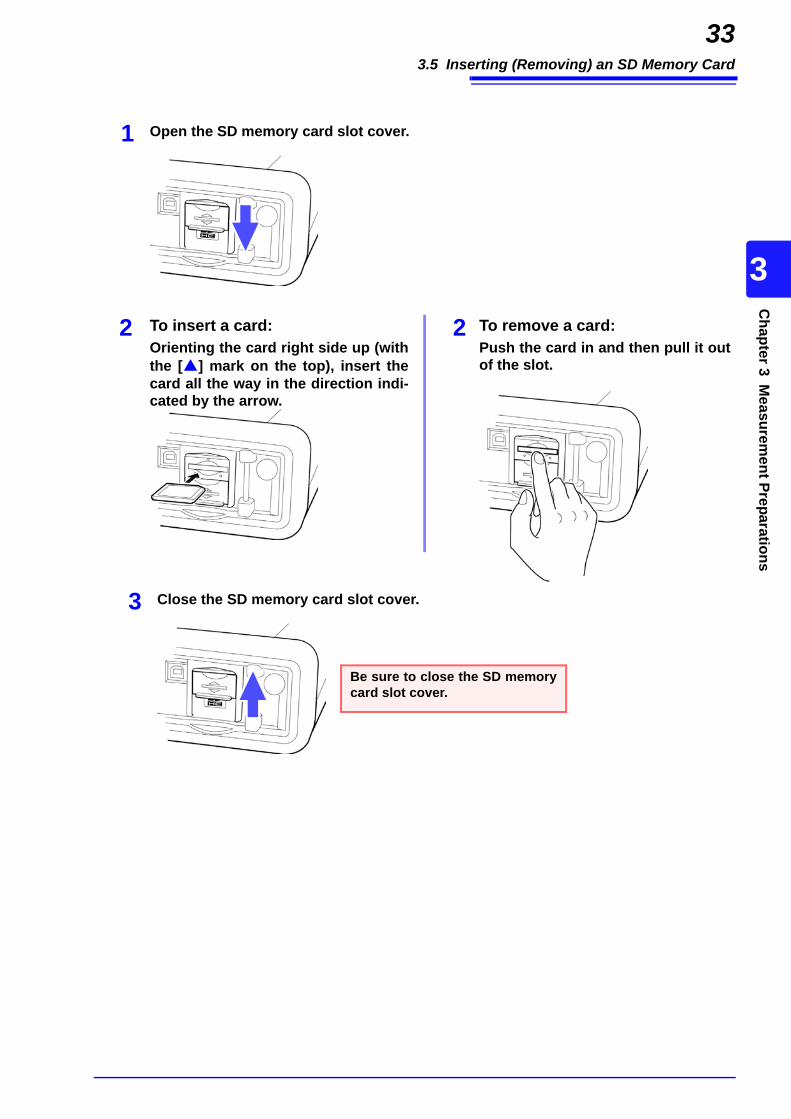
Open the SD memory card slot cover.1
2 To insert a card:Orienting the card right side up (withthe [] mark on the top), insert thecard all the way in the direction indi-cated by the arrow.
To remove a card:Push the card in and then pull it outof the slot.
2
Close the SD memory card slot cover.3
Be sure to close the SD memorycard slot cover.
3.6 Connecting the Voltage Cords
34
Be sure to read the "Usage Notes" (p.6) before connecting voltage cords.
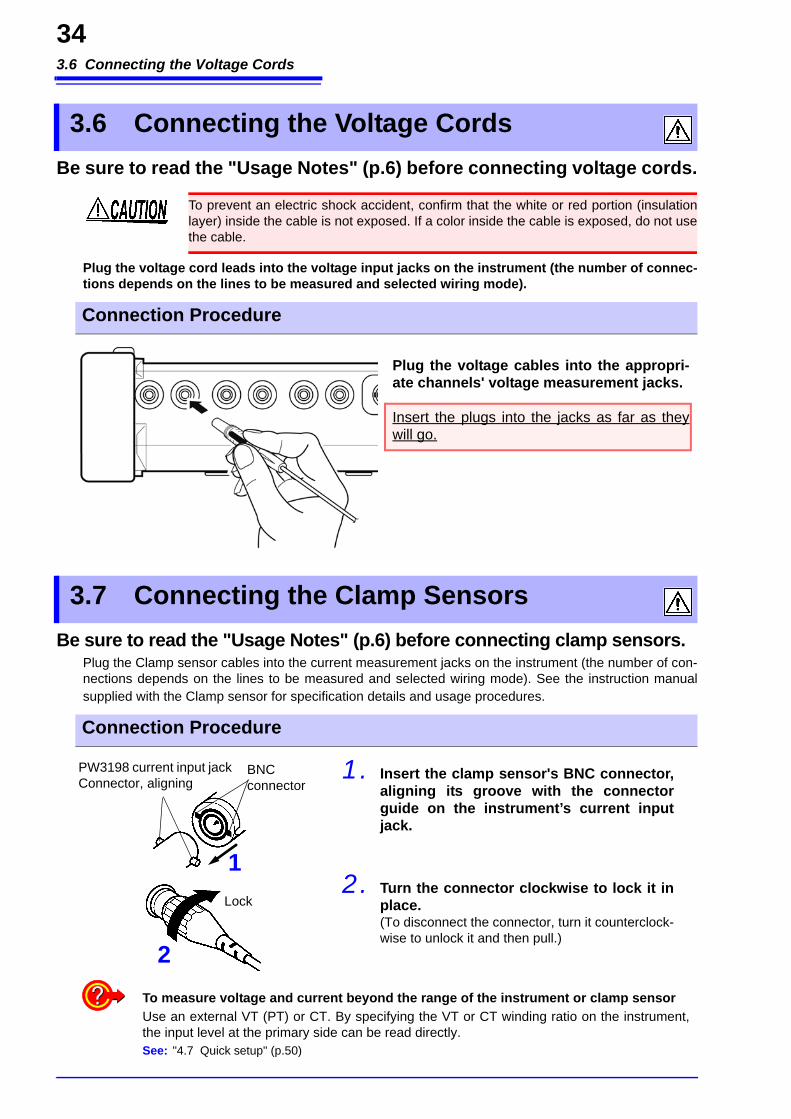
Plug the voltage cord leads into the voltage input jacks on the instrument (the number of connec-tions depends on the lines to be measured and selected wiring mode).
Be sure to read the "Usage Notes" (p.6) before connecting clamp sensors.Plug the Clamp sensor cables into the current measurement jacks on the instrument (the number of con-nections depends on the lines to be measured and selected wiring mode). See the instruction manualsupplied with the Clamp sensor for specification details and usage procedures.
3.6 Connecting the Voltage Cords
To prevent an electric shock accident, confirm that the white or red portion (insulationlayer) inside the cable is not exposed. If a color inside the cable is exposed, do not usethe cable.
Connection Procedure
Plug the voltage cables into the appropri-ate channels' voltage measurement jacks.
Insert the plugs into the jacks as far as theywill go.
3.7 Connecting the Clamp Sensors
Connection Procedure
Lock
BNC connector
PW3198 current input jackConnector, aligning
1. Insert the clamp sensor's BNC connector,aligning its groove with the connectorguide on the instrument’s current inputjack.
2. Turn the connector clockwise to lock it inplace. (To disconnect the connector, turn it counterclock-wise to unlock it and then pull.)
1
2To measure voltage and current beyond the range of the instrument or clamp sensorUse an external VT (PT) or CT. By specifying the VT or CT winding ratio on the instrument,the input level at the primary side can be read directly.See: "4.7 Quick setup" (p.50)

3
3.7 Connecting the Clamp Sensors
35C
hapter 3 Measurem
ent Preparations
During wiring, avoid touching the VT(PT), CT or input jacks. Exposed live con-tacts can cause electric shock or other accident resulting in personal injury ordeath.
• When using an external VT (PT), avoid short-circuiting the secondary winding.If voltage is applied to the primary when the secondary is shorted, high currentflow in the secondary could burn it out and cause a fire.
• When using an external CT, avoid open-circuiting the secondary winding. Ifcurrent flows through the primary when the secondary is open, high voltageacross the secondary could present a dangerous hazard.
• Phase difference in an external VT (PT) or CT can cause power measurement errors.For optimum power measurement accuracy, use a VT (PT) or CT that exhibits mini-mal phase difference at the operating frequency.
• To ensure safety when using a VT (PT) or CT, one side of the secondary should begrounded.
3.8 Turning the Power On and Off (Setting the Default Language)
36
Be sure to read the "Usage Notes" (p.6) before turning the instrument on.Turn on the instrument after connecting the AC adapter, voltage cords, and clamp sensors.
For best precision, allow at least 30 minutes warm-up before executing zero adjustment and measuring.
When power on the instrument under factory default condition or immediately after a boot key reset(p.73), the following will be displayed in the startup screen.
Select the desired language with the F key. (F1: English, F2: Japanese, F3: Chinese)This default language setting is retained even if the system is reset (p.73). The language is not retainedwhen the instrument is reset to its factory settings with a boot key reset (p.73).
3.8 Turning the Power On and Off (Setting the Default Language)
Turning the power on
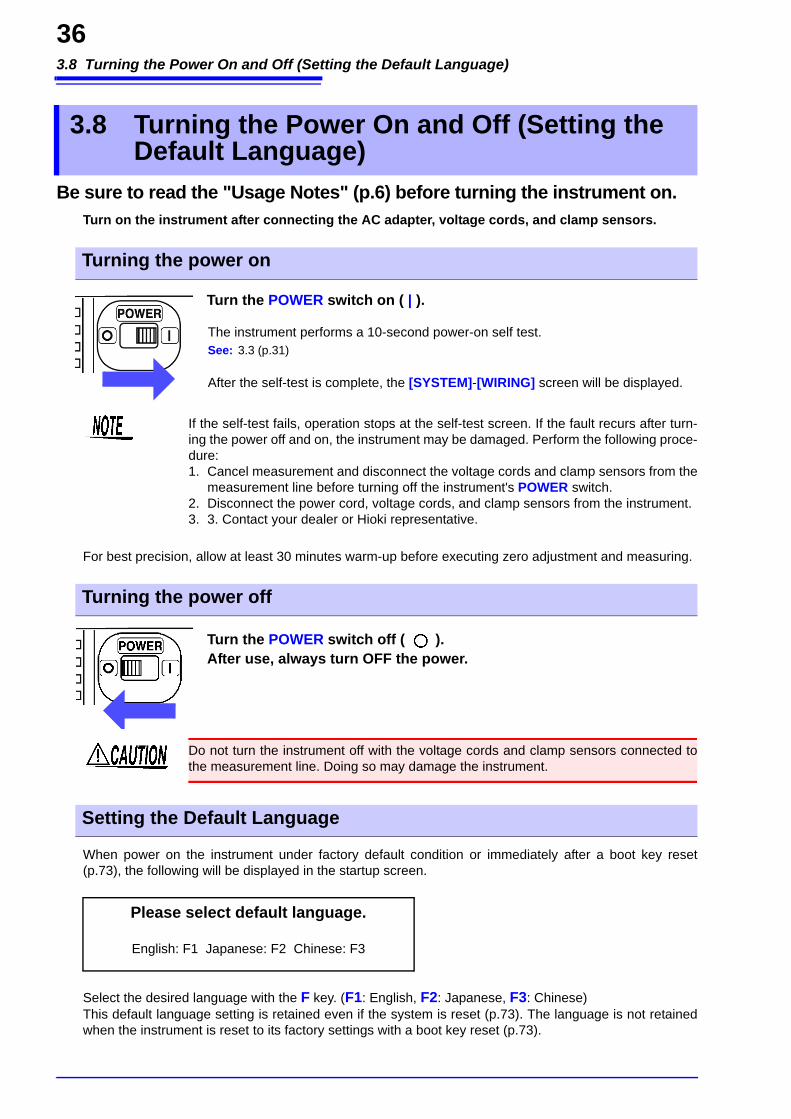
Turn the POWER switch on ( | ).
The instrument performs a 10-second power-on self test. See: 3.3 (p.31)
After the self-test is complete, the [SYSTEM]-[WIRING] screen will be displayed.
If the self-test fails, operation stops at the self-test screen. If the fault recurs after turn-ing the power off and on, the instrument may be damaged. Perform the following proce-dure:1. Cancel measurement and disconnect the voltage cords and clamp sensors from the
measurement line before turning off the instrument's POWER switch.2. Disconnect the power cord, voltage cords, and clamp sensors from the instrument.3. 3. Contact your dealer or Hioki representative.
Turning the power off
Turn the POWER switch off ( ).After use, always turn OFF the power.
Do not turn the instrument off with the voltage cords and clamp sensors connected tothe measurement line. Doing so may damage the instrument.
Setting the Default Language
Please select default language.
English: F1 Japanese: F2 Chinese: F3
4.1 Warm-up and Zero-adjust Operation
37C
hapter 4 Configuring the Instrum
ent before Measurem
ent (SYSTEM - SYSTEM
screen)
4
It is necessary to allow the PW3198 to warm up to ensure its ability to make precise measurements.Allow the instrument to warm up for at least 30 minutes after turning it on. (p.36)
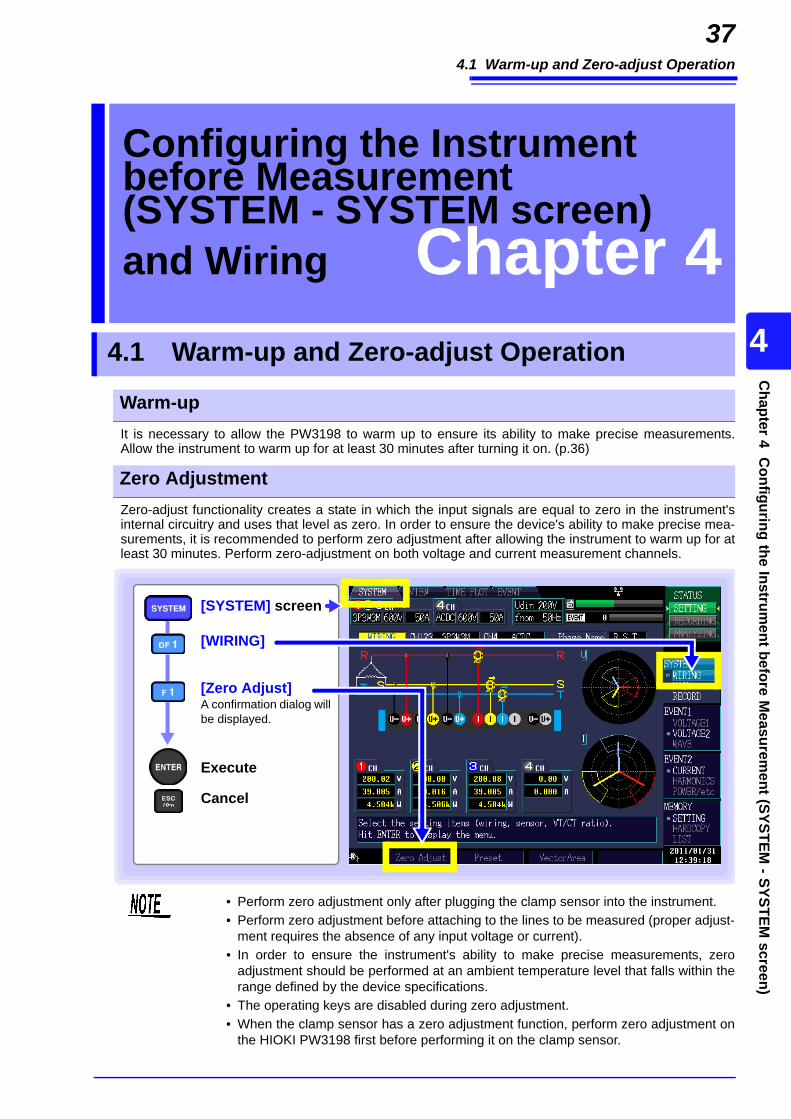
Zero-adjust functionality creates a state in which the input signals are equal to zero in the instrument'sinternal circuitry and uses that level as zero. In order to ensure the device's ability to make precise mea-surements, it is recommended to perform zero adjustment after allowing the instrument to warm up for atleast 30 minutes. Perform zero-adjustment on both voltage and current measurement channels.
Configuring the Instrument before Measurement (SYSTEM - SYSTEM screen) and Wiring Chapter 4
4.1 Warm-up and Zero-adjust Operation
Warm-up
Zero Adjustment
Execute
Cancel
[WIRING]
[SYSTEM] screen
[Zero Adjust]A confirmation dialog will be displayed.
• Perform zero adjustment only after plugging the clamp sensor into the instrument.• Perform zero adjustment before attaching to the lines to be measured (proper adjust-
ment requires the absence of any input voltage or current). • In order to ensure the instrument's ability to make precise measurements, zero
adjustment should be performed at an ambient temperature level that falls within therange defined by the device specifications.
• The operating keys are disabled during zero adjustment.• When the clamp sensor has a zero adjustment function, perform zero adjustment on
the HIOKI PW3198 first before performing it on the clamp sensor.
4.2 Setting the Clock
38
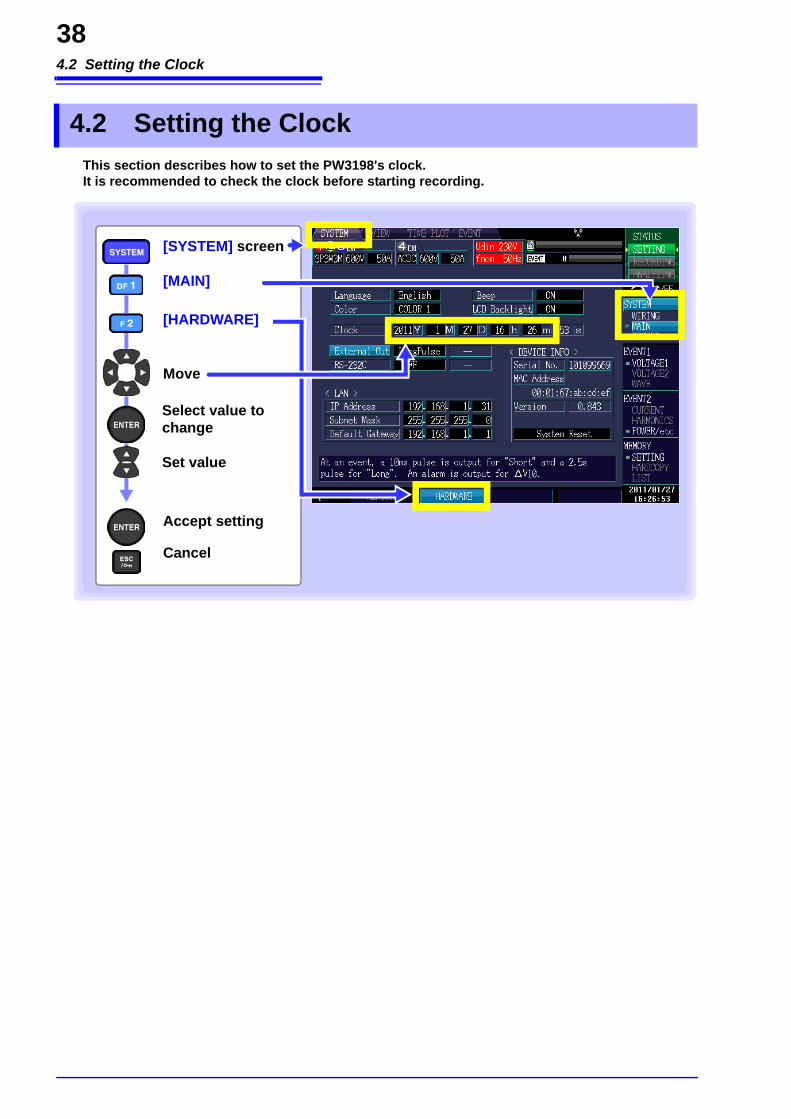
This section describes how to set the PW3198's clock. It is recommended to check the clock before starting recording.
4.2 Setting the Clock
Select value to change
Set value
Accept setting
Cancel
[SYSTEM] screen
Move
[MAIN]
[HARDWARE]
4.3 Configuring the Connection Mode and Clamp Sensors
39C
hapter 4 Configuring the Instrum
ent before Measurem
ent (SYSTEM - SYSTEM
screen)
4
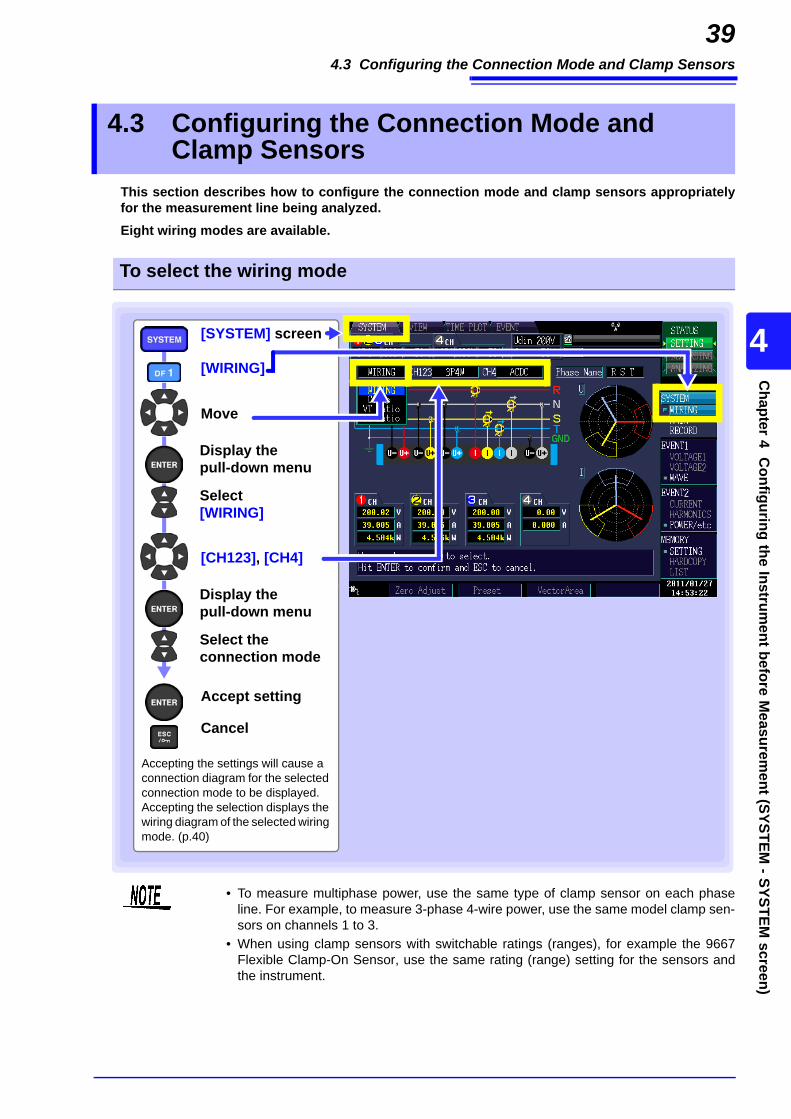
This section describes how to configure the connection mode and clamp sensors appropriatelyfor the measurement line being analyzed.Eight wiring modes are available.
4.3 Configuring the Connection Mode and Clamp Sensors
To select the wiring mode
Display the pull-down menu
Select [WIRING]
Accept setting
Cancel
[SYSTEM] screen
Move
[WIRING]
Accepting the settings will cause a connection diagram for the selected connection mode to be displayed. Accepting the selection displays the wiring diagram of the selected wiring mode. (p.40)
Display the pull-down menu
Select the connection mode
[CH123], [CH4]
• To measure multiphase power, use the same type of clamp sensor on each phaseline. For example, to measure 3-phase 4-wire power, use the same model clamp sen-sors on channels 1 to 3.
• When using clamp sensors with switchable ratings (ranges), for example the 9667Flexible Clamp-On Sensor, use the same rating (range) setting for the sensors andthe instrument.
4.3 Configuring the Connection Mode and Clamp Sensors
40
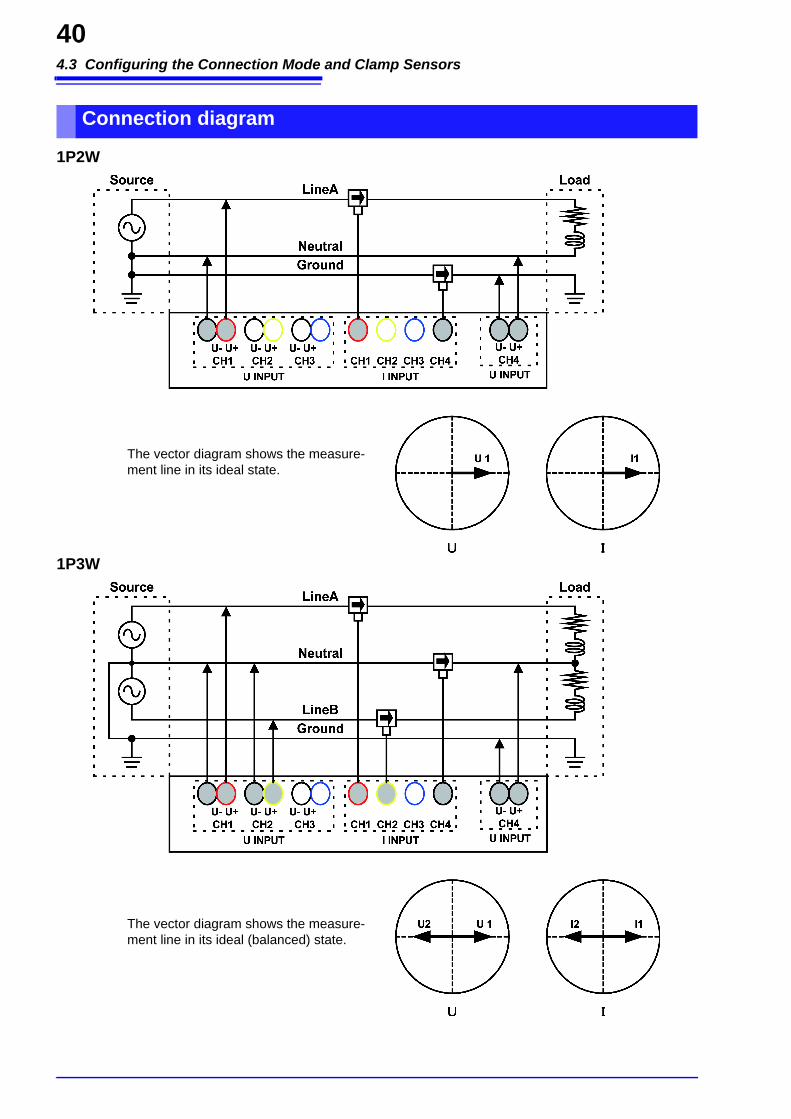
1P2W
1P3W
Connection diagram
The vector diagram shows the measure-ment line in its ideal state.
The vector diagram shows the measure-ment line in its ideal (balanced) state.
4.3 Configuring the Connection Mode and Clamp Sensors
41C
hapter 4 Configuring the Instrum
ent before Measurem
ent (SYSTEM - SYSTEM
screen)
4
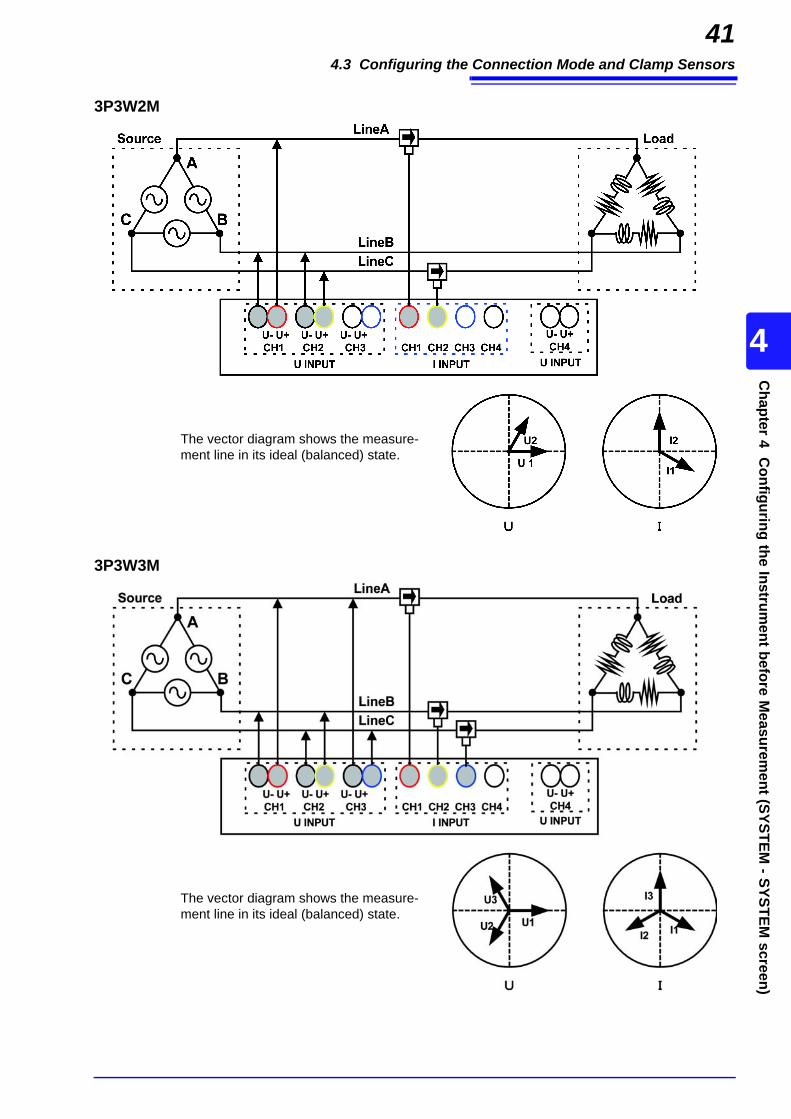
3P3W2M
3P3W3M
The vector diagram shows the measure-ment line in its ideal (balanced) state.
The vector diagram shows the measure-ment line in its ideal (balanced) state.
4.3 Configuring the Connection Mode and Clamp Sensors
42
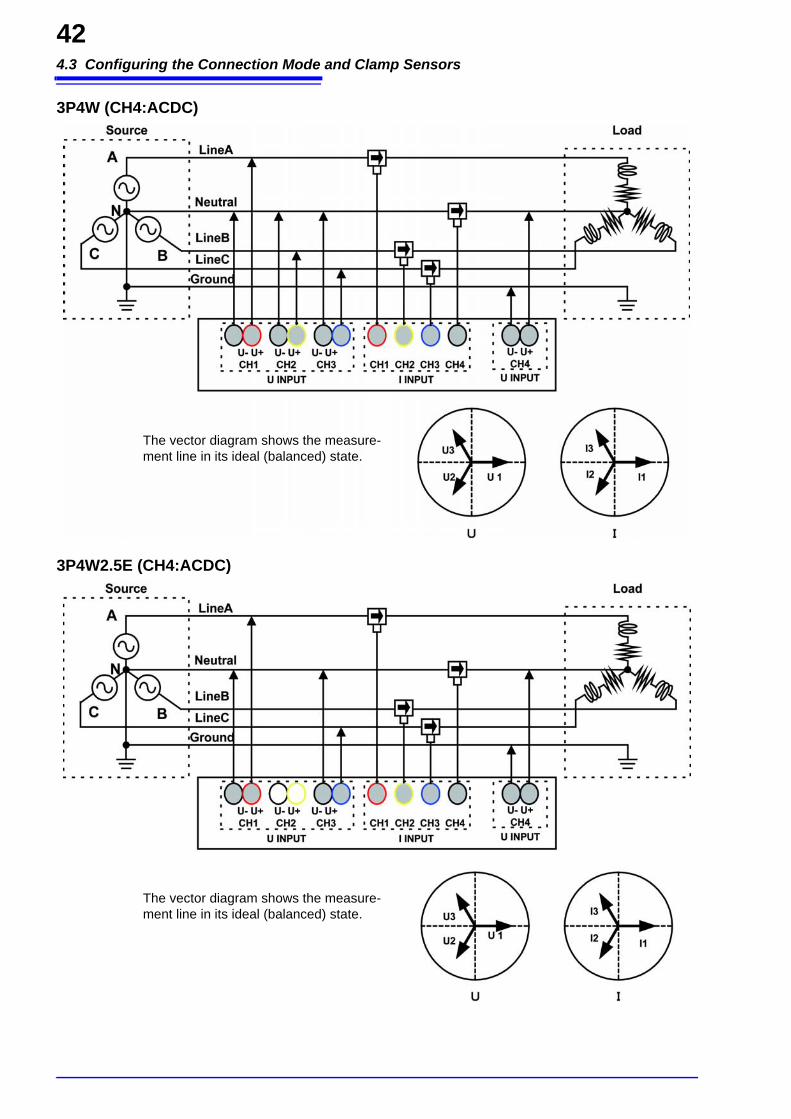
3P4W (CH4:ACDC)
3P4W2.5E (CH4:ACDC)
The vector diagram shows the measure-ment line in its ideal (balanced) state.
The vector diagram shows the measure-ment line in its ideal (balanced) state.
4.3 Configuring the Connection Mode and Clamp Sensors
43C
hapter 4 Configuring the Instrum
ent before Measurem
ent (SYSTEM - SYSTEM
screen)
4
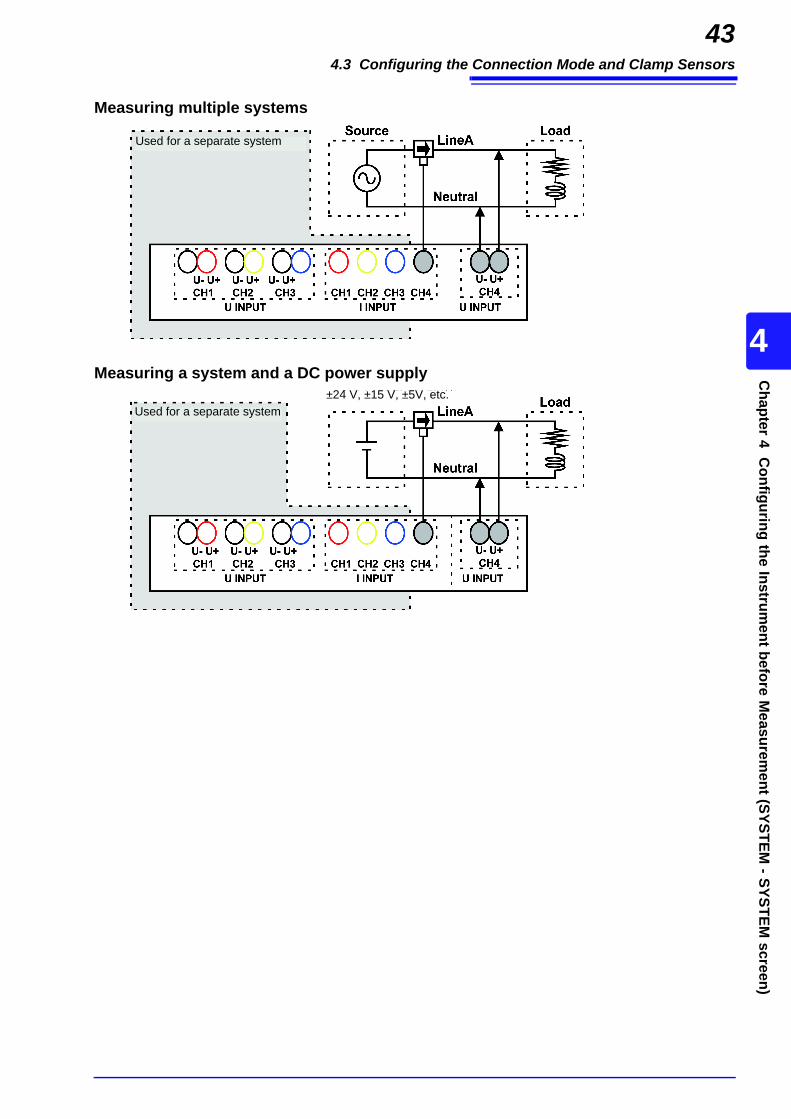
Measuring multiple systems
Measuring a system and a DC power supply
Used for a separate system
Used for a separate system±24 V, ±15 V, ±5V, etc.
4.3 Configuring the Connection Mode and Clamp Sensors
44
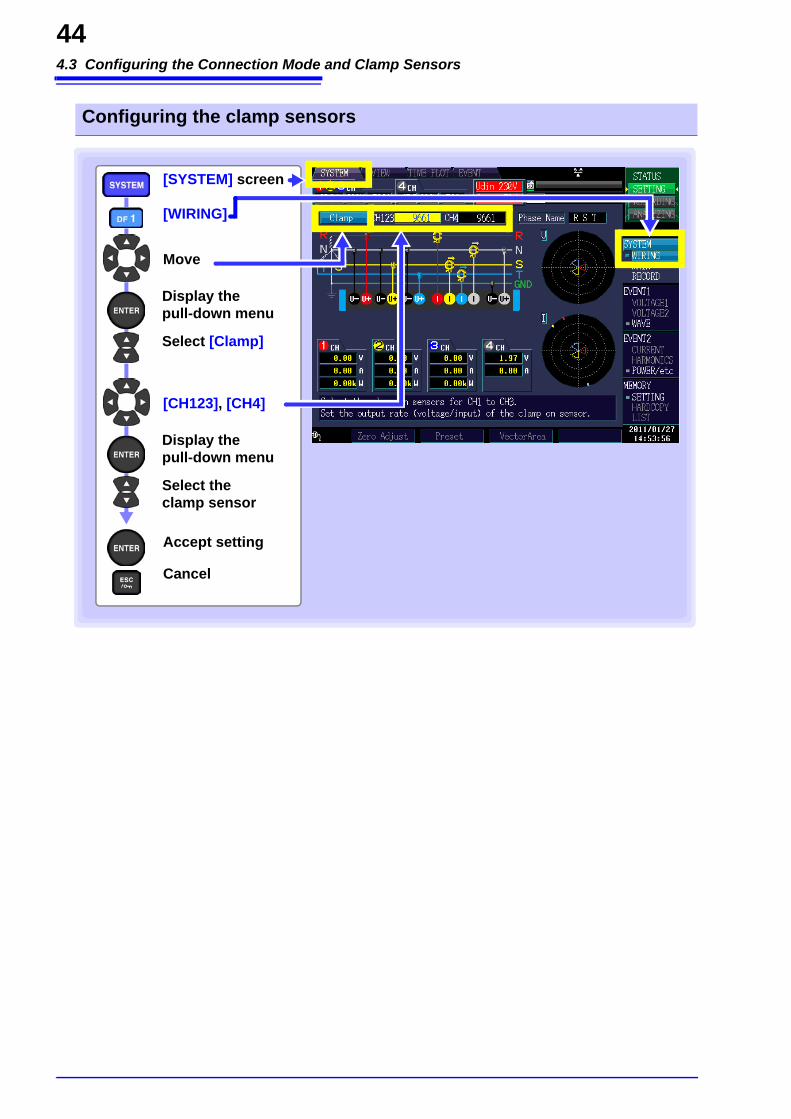
Configuring the clamp sensors
Display the pull-down menu
Select [Clamp]
Accept setting
Cancel
[SYSTEM] screen
Move
[WIRING]
Display the pull-down menu
Select the clamp sensor
[CH123], [CH4]
4.4 Setting the Vector Area (Tolerance Level)
45C
hapter 4 Configuring the Instrum
ent before Measurem
ent (SYSTEM - SYSTEM
screen)
4
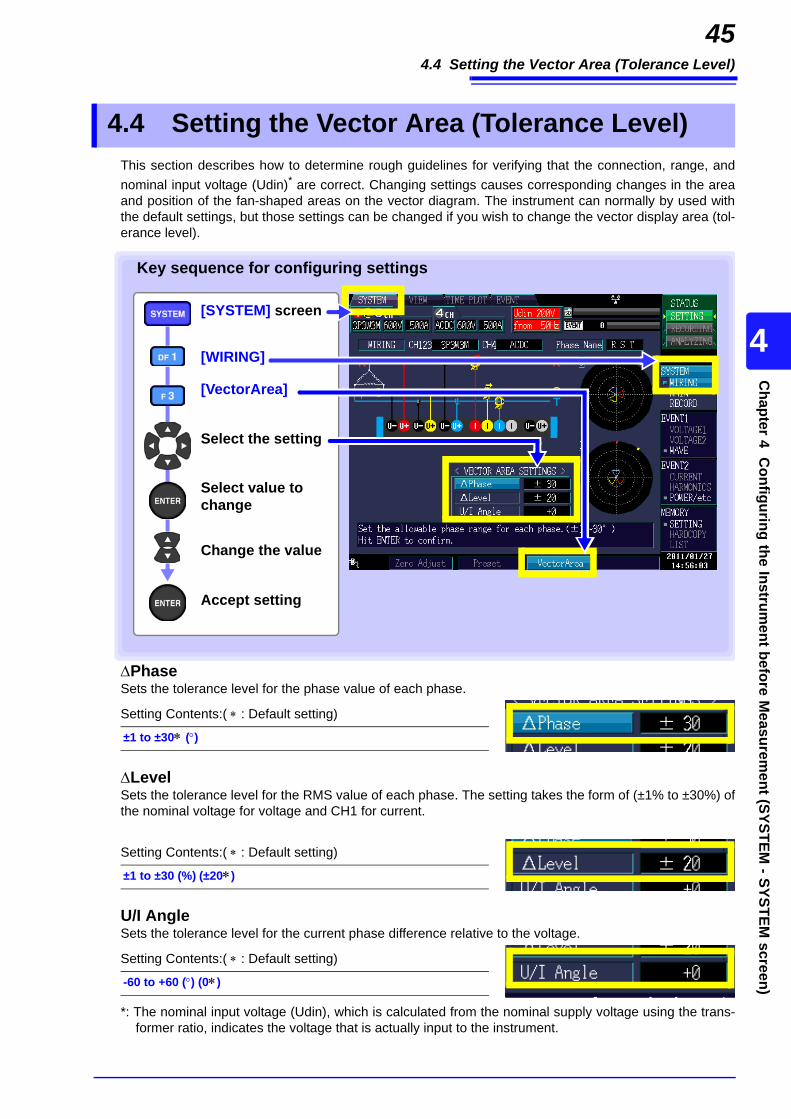
This section describes how to determine rough guidelines for verifying that the connection, range, andnominal input voltage (Udin)* are correct. Changing settings causes corresponding changes in the areaand position of the fan-shaped areas on the vector diagram. The instrument can normally by used withthe default settings, but those settings can be changed if you wish to change the vector display area (tol-erance level).
PhaseSets the tolerance level for the phase value of each phase.
LevelSets the tolerance level for the RMS value of each phase. The setting takes the form of (±1% to ±30%) ofthe nominal voltage for voltage and CH1 for current.
U/I AngleSets the tolerance level for the current phase difference relative to the voltage.
*: The nominal input voltage (Udin), which is calculated from the nominal supply voltage using the trans-former ratio, indicates the voltage that is actually input to the instrument.
4.4 Setting the Vector Area (Tolerance Level)
Setting Contents:( : Default setting)
±1 to ±30 ()
Setting Contents:( : Default setting)
±1 to ±30 (%)(±20)
Setting Contents:( : Default setting)
-60 to +60 () (0)
[WIRING]
[SYSTEM] screen
[VectorArea]
Key sequence for configuring settings
Select value tochange
Change the value
Accept setting
Select the setting
4.5 Connecting to the Lines to be Measured (Preparing for Current Measurement)
46
Be sure to read the "Usage Notes" (p.6) before attaching to the lines.Connect the voltage cords and clamp sensors to the measurement line as shown in the connec-tion diagram on the screen. (To ensure accurate measurement, consult the connection diagram*while making the connections.)*: The diagram appears when the wiring mode is selected. (p.39)
4.5 Connecting to the Lines to be Measured (Preparing for Current Measurement)
To avoid electric shock and short-circuit accidents, do not attach any unneces-sary cables.
To avoid risk of electric shock, turn off the supply of electricity to the measure-ment circuit before making connections.
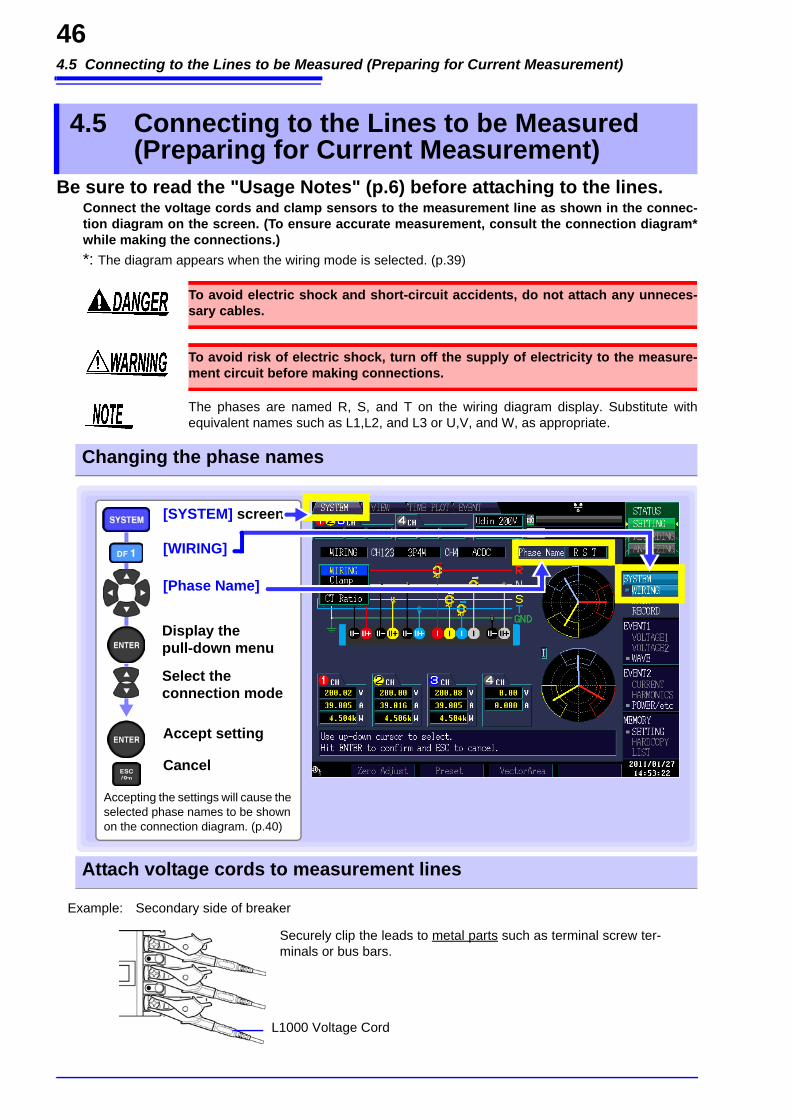
The phases are named R, S, and T on the wiring diagram display. Substitute withequivalent names such as L1,L2, and L3 or U,V, and W, as appropriate.
Changing the phase names
Display the pull-down menu
Select the connection mode
Accept setting
Cancel
[SYSTEM] screen
[Phase Name]
[WIRING]
Accepting the settings will cause the selected phase names to be shown on the connection diagram. (p.40)
Attach voltage cords to measurement lines
Securely clip the leads to metal parts such as terminal screw ter-minals or bus bars.
Example: Secondary side of breaker
L1000 Voltage Cord

4.5 Connecting to the Lines to be Measured (Preparing for Current Measurement)
47C
hapter 4 Configuring the Instrum
ent before Measurem
ent (SYSTEM - SYSTEM
screen)
4
Example: When using Model 9804-01 or 9804-02 Magnetic Adapter (standard screw: M6 pan head screw)
Secondary side of breaker
Model 9804-01, 9804-02 Magnetic Adapter
Model L1000 Voltage Cord
Secondary side of breaker
Model L1000 Voltage Cord
Model 9804-01, 9804-02 Magnetic Adapter
Attach the Model 9804-01 or 9804-02Magnetic Adapter (option) to the ModelL1000 Voltage Cord.
Connect the magnetic part of the 9804-01 or 9804-02 tip to the screws on thesecondary side of the breaker.
The weight of the voltage cords may prevent you from making aperpendicular connection to the Model 9804-01 or 9804-02 Mag-netic Adapter. In this case, connect each cords so that it is hang-ing off the adapter in a manner that balances its weight.
Check the voltage values to verify that the connections have beenmade securely.
Connecting clamp sensors to lines to be measured
OK
(Example: 9661)
Source side
Line
Load side
Current Flow Direction Arrow
Be sure to attach each clamp around only one conductor.Correct measurement cannot be obtained if a clamp is attached around more than one con-ductor.
Make certain that the current flow direction arrow points toward the load.
4.6 Verifying Correct Wiring (Connection Check)
48
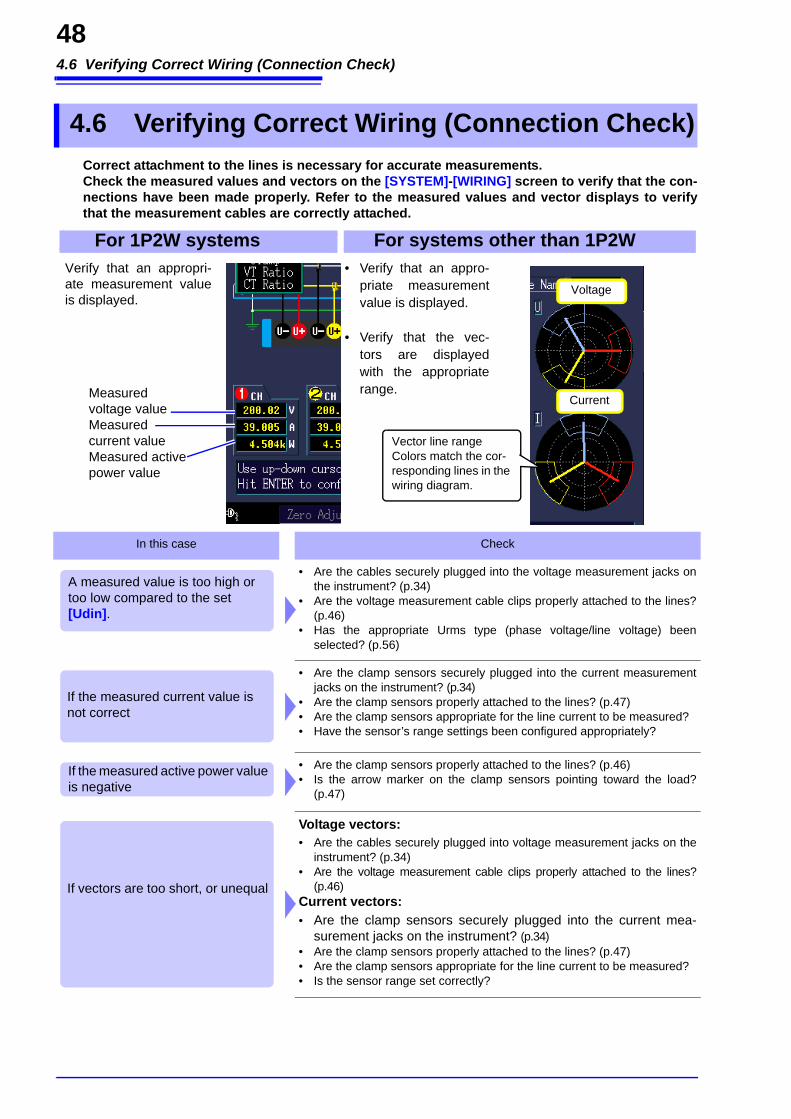
Correct attachment to the lines is necessary for accurate measurements. Check the measured values and vectors on the [SYSTEM]-[WIRING] screen to verify that the con-nections have been made properly. Refer to the measured values and vector displays to verifythat the measurement cables are correctly attached.
4.6 Verifying Correct Wiring (Connection Check)
Voltage
Current
Verify that an appropri-ate measurement valueis displayed.
Measured voltage valueMeasured current valueMeasured active power value
Vector line rangeColors match the cor-responding lines in the wiring diagram.
For 1P2W systems For systems other than 1P2W• Verify that an appro-
priate measurementvalue is displayed.
• Verify that the vec-tors are displayedwith the appropriaterange.
In this case Check
• Are the cables securely plugged into the voltage measurement jacks onthe instrument? (p.34)
• Are the voltage measurement cable clips properly attached to the lines?(p.46)
• Has the appropriate Urms type (phase voltage/line voltage) beenselected? (p.56)
• Are the clamp sensors securely plugged into the current measurementjacks on the instrument? (p.34)
• Are the clamp sensors properly attached to the lines? (p.47)• Are the clamp sensors appropriate for the line current to be measured? • Have the sensor’s range settings been configured appropriately?
• Are the clamp sensors properly attached to the lines? (p.46)• Is the arrow marker on the clamp sensors pointing toward the load?
(p.47)
Voltage vectors:• Are the cables securely plugged into voltage measurement jacks on the
instrument? (p.34)• Are the voltage measurement cable clips properly attached to the lines?
(p.46)Current vectors:• Are the clamp sensors securely plugged into the current mea-
surement jacks on the instrument? (p.34)• Are the clamp sensors properly attached to the lines? (p.47)• Are the clamp sensors appropriate for the line current to be measured?• Is the sensor range set correctly?
A measured value is too high or too low compared to the set [Udin].
If the measured current value is not correct
If the measured active power value is negative
If vectors are too short, or unequal
4.6 Verifying Correct Wiring (Connection Check)
49C
hapter 4 Configuring the Instrum
ent before Measurem
ent (SYSTEM - SYSTEM
screen)
4
Voltage vectors: • Check that the voltage measurement clips are attached to the lines
according to the wiring diagram.Current vectors: • Check that the clamp sensors are attached to the lines according to the
wiring diagram.
In this case Check
If vector direction (phase) or col-or is incorrect
When measuring 3P3W2M systems, the active power (P) measured on each channel may benegative.
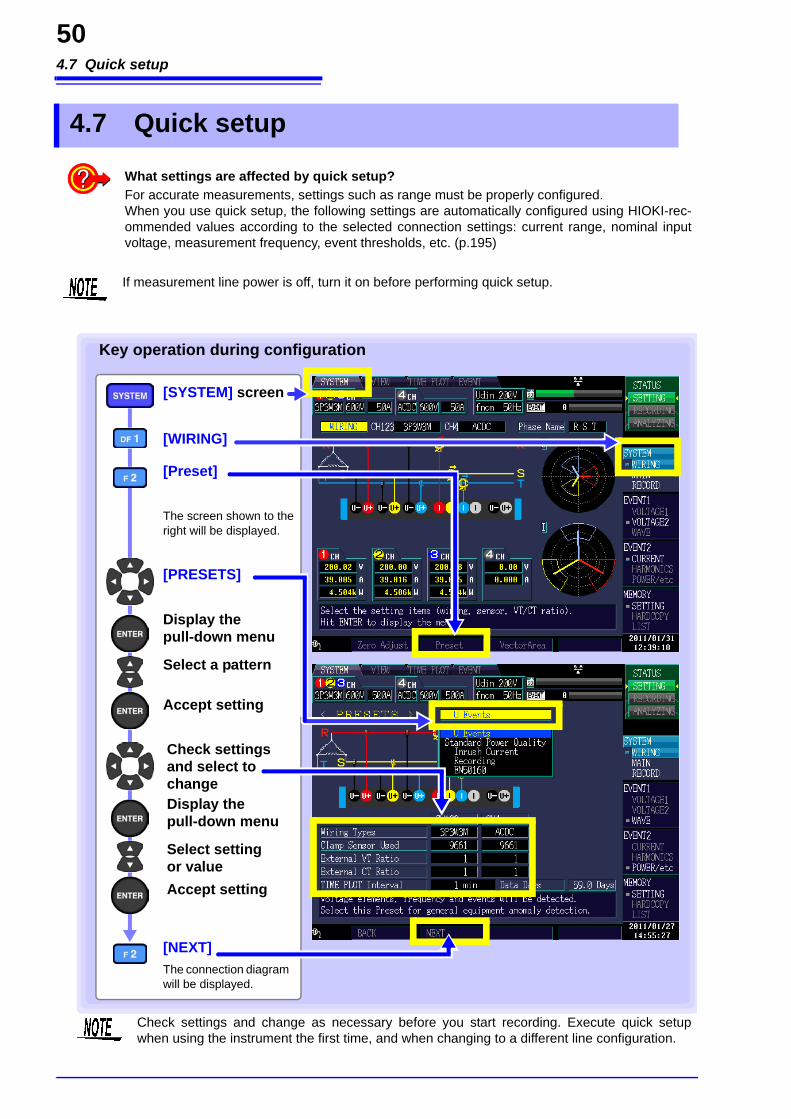
4.7 Quick setup
50
4.7 Quick setup
What settings are affected by quick setup?For accurate measurements, settings such as range must be properly configured.When you use quick setup, the following settings are automatically configured using HIOKI-rec-ommended values according to the selected connection settings: current range, nominal inputvoltage, measurement frequency, event thresholds, etc. (p.195)
If measurement line power is off, turn it on before performing quick setup.
[WIRING]
[SYSTEM] screen
[Preset]
Check settings and change as necessary before you start recording. Execute quick setupwhen using the instrument the first time, and when changing to a different line configuration.
The screen shown to the right will be displayed.
[NEXT]The connection diagram will be displayed.
Key operation during configuration
Display the pull-down menu
Select a pattern
Accept setting
[PRESETS]
Display the pull-down menu
Select setting or valueAccept setting
Check settings and select to change
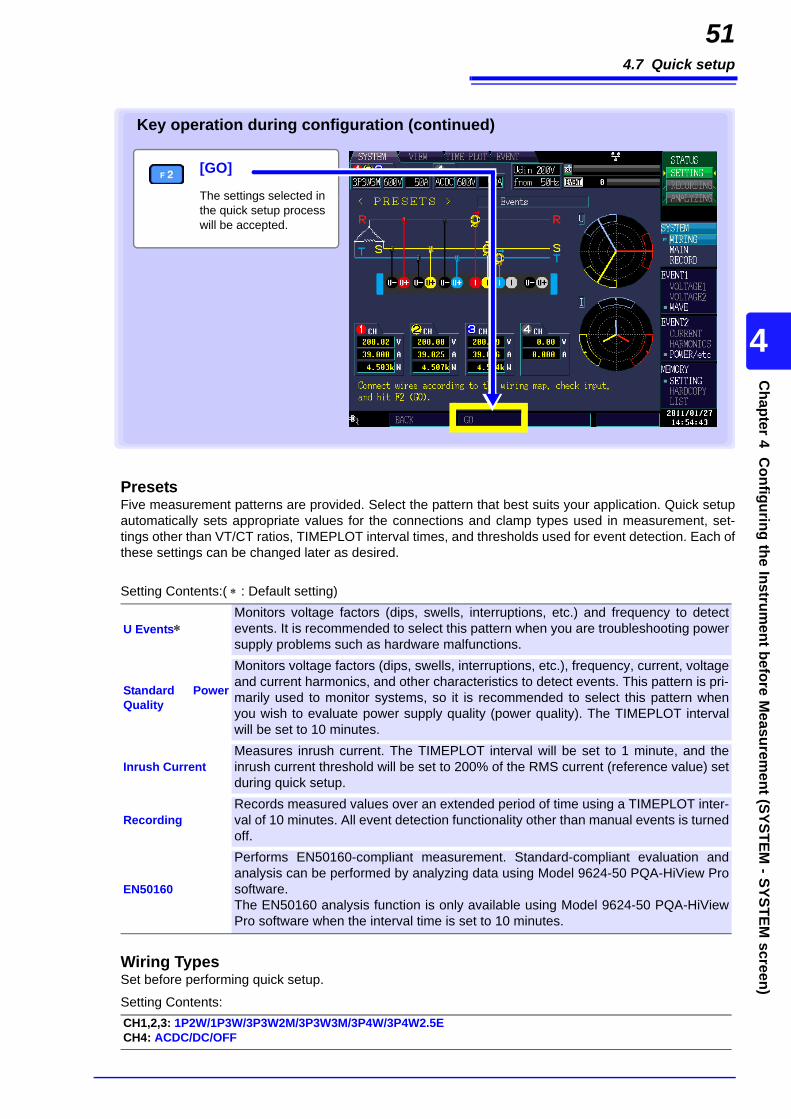
4.7 Quick setup
51C
hapter 4 Configuring the Instrum
ent before Measurem
ent (SYSTEM - SYSTEM
screen)
4
PresetsFive measurement patterns are provided. Select the pattern that best suits your application. Quick setupautomatically sets appropriate values for the connections and clamp types used in measurement, set-tings other than VT/CT ratios, TIMEPLOT interval times, and thresholds used for event detection. Each ofthese settings can be changed later as desired.
Wiring TypesSet before performing quick setup.
[GO]
The settings selected in the quick setup process will be accepted.
Key operation during configuration (continued)
Setting Contents:( : Default setting)
U EventsMonitors voltage factors (dips, swells, interruptions, etc.) and frequency to detectevents. It is recommended to select this pattern when you are troubleshooting powersupply problems such as hardware malfunctions.
Standard PowerQuality
Monitors voltage factors (dips, swells, interruptions, etc.), frequency, current, voltageand current harmonics, and other characteristics to detect events. This pattern is pri-marily used to monitor systems, so it is recommended to select this pattern whenyou wish to evaluate power supply quality (power quality). The TIMEPLOT intervalwill be set to 10 minutes.
Inrush CurrentMeasures inrush current. The TIMEPLOT interval will be set to 1 minute, and theinrush current threshold will be set to 200% of the RMS current (reference value) setduring quick setup.
RecordingRecords measured values over an extended period of time using a TIMEPLOT inter-val of 10 minutes. All event detection functionality other than manual events is turnedoff.
EN50160
Performs EN50160-compliant measurement. Standard-compliant evaluation andanalysis can be performed by analyzing data using Model 9624-50 PQA-HiView Prosoftware.The EN50160 analysis function is only available using Model 9624-50 PQA-HiViewPro software when the interval time is set to 10 minutes.
Setting Contents:CH1,2,3: 1P2W/1P3W/3P3W2M/3P3W3M/3P4W/3P4W2.5ECH4: ACDC/DC/OFF
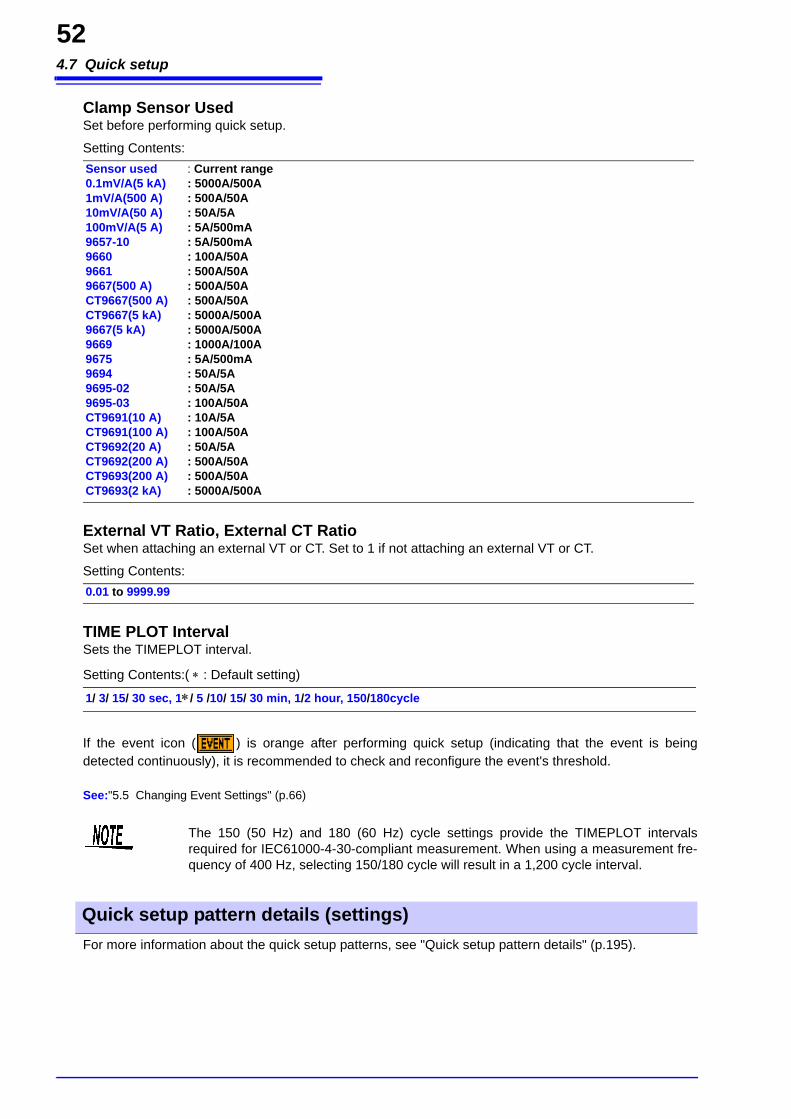
4.7 Quick setup
52
Clamp Sensor UsedSet before performing quick setup.
External VT Ratio, External CT RatioSet when attaching an external VT or CT. Set to 1 if not attaching an external VT or CT.
TIME PLOT IntervalSets the TIMEPLOT interval.
If the event icon ( ) is orange after performing quick setup (indicating that the event is beingdetected continuously), it is recommended to check and reconfigure the event's threshold.
See:"5.5 Changing Event Settings" (p.66)
For more information about the quick setup patterns, see "Quick setup pattern details" (p.195).
Setting Contents:Sensor used : Current range0.1mV/A(5 kA) : 5000A/500A1mV/A(500 A) : 500A/50A10mV/A(50 A) : 50A/5A100mV/A(5 A) : 5A/500mA9657-10 : 5A/500mA9660 : 100A/50A9661 : 500A/50A9667(500 A) : 500A/50ACT9667(500 A) : 500A/50ACT9667(5 kA) : 5000A/500A9667(5 kA) : 5000A/500A9669 : 1000A/100A9675 : 5A/500mA9694 : 50A/5A9695-02 : 50A/5A9695-03 : 100A/50ACT9691(10 A) : 10A/5ACT9691(100 A) : 100A/50ACT9692(20 A) : 50A/5ACT9692(200 A) : 500A/50ACT9693(200 A) : 500A/50ACT9693(2 kA) : 5000A/500A
Setting Contents:0.01 to 9999.99
Setting Contents:( : Default setting)
1/ 3/ 15/ 30 sec, 1/ 5 /10/ 15/ 30 min, 1/2 hour, 150/180cycle
The 150 (50 Hz) and 180 (60 Hz) cycle settings provide the TIMEPLOT intervalsrequired for IEC61000-4-30-compliant measurement. When using a measurement fre-quency of 400 Hz, selecting 150/180 cycle will result in a 1,200 cycle interval.
Quick setup pattern details (settings)
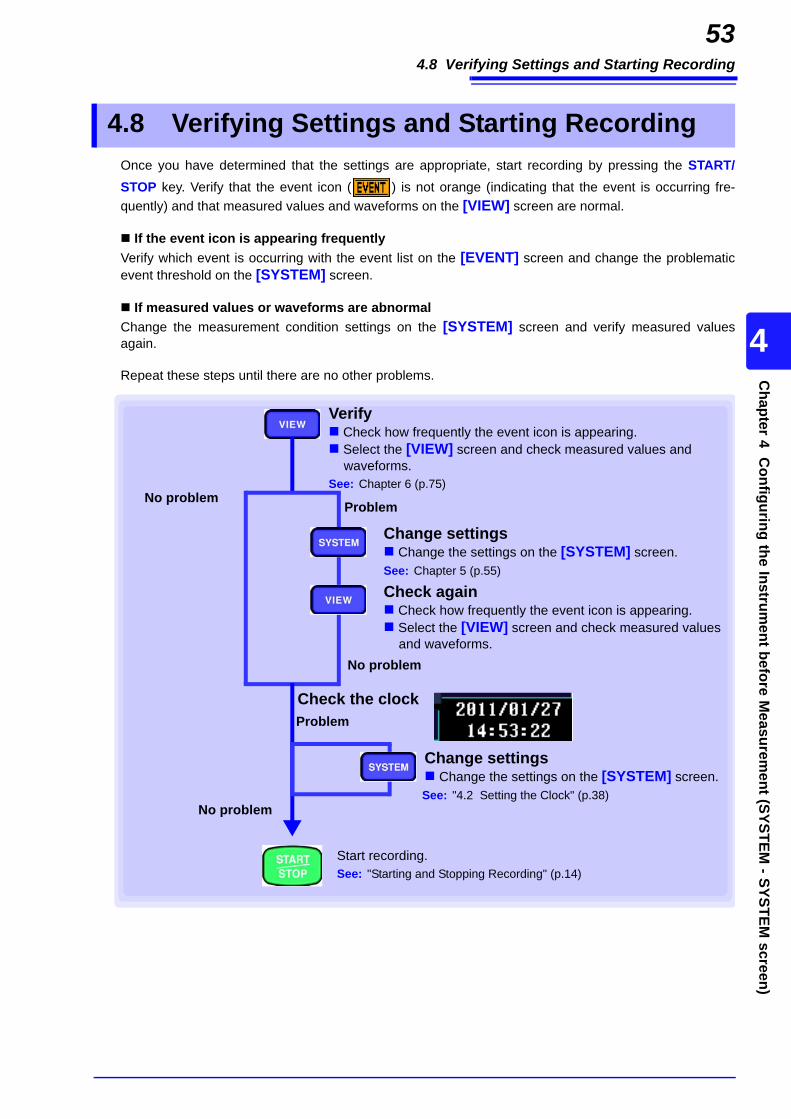
4.8 Verifying Settings and Starting Recording
53C
hapter 4 Configuring the Instrum
ent before Measurem
ent (SYSTEM - SYSTEM
screen)
4
Once you have determined that the settings are appropriate, start recording by pressing the START/STOP key. Verify that the event icon ( ) is not orange (indicating that the event is occurring fre-quently) and that measured values and waveforms on the [VIEW] screen are normal.
If the event icon is appearing frequentlyVerify which event is occurring with the event list on the [EVENT] screen and change the problematicevent threshold on the [SYSTEM] screen.
If measured values or waveforms are abnormalChange the measurement condition settings on the [SYSTEM] screen and verify measured valuesagain.
Repeat these steps until there are no other problems.
4.8 Verifying Settings and Starting Recording
Verify Check how frequently the event icon is appearing. Select the [VIEW] screen and check measured values and
waveforms.See: Chapter 6 (p.75)
No problem
Start recording.See: "Starting and Stopping Recording" (p.14)
Problem
Change settings Change the settings on the [SYSTEM] screen.See: Chapter 5 (p.55)
Check again Check how frequently the event icon is appearing. Select the [VIEW] screen and check measured values
and waveforms. No problem
Change settings Change the settings on the [SYSTEM] screen.See: "4.2 Setting the Clock" (p.38)
ProblemCheck the clock
No problem
4.9 Using the Instrument during a Power Outage
54
If the supply of power to the instrument is interrupted (for example, during a power outage), it will operateusing battery power (a fully charged battery provides enough power to operate for about 180 minutes).However, the instrument will turn off about 180 minutes after the outage occurs. Once the power is backon, the instrument will turn back on and resume recording. Integral values and other data will be reset,and the integration process will resume.
4.9 Using the Instrument during a Power Outage
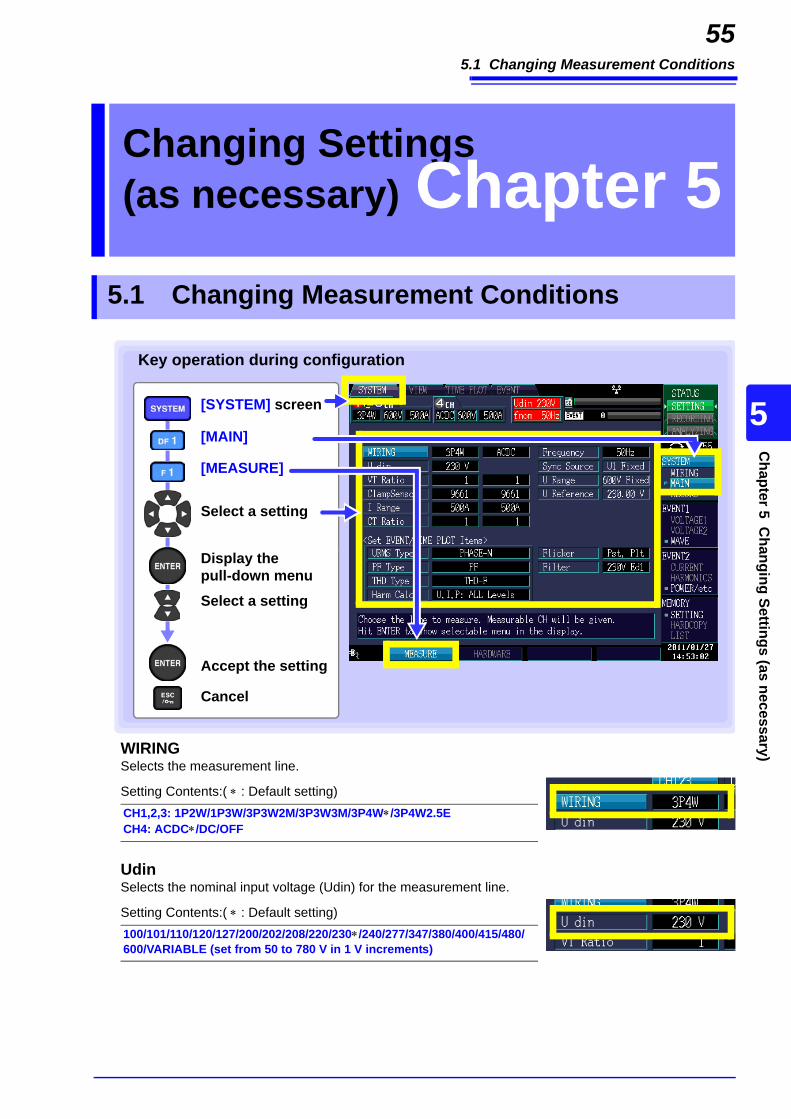
5.1 Changing Measurement Conditions
55C
hapter 5 Changing Settings (as necessary)
5
WIRINGSelects the measurement line.
UdinSelects the nominal input voltage (Udin) for the measurement line.
Changing Settings(as necessary) Chapter 5
5.1 Changing Measurement Conditions
Display the pull-down menuSelect a setting
Accept the setting
Cancel
[MAIN]
[SYSTEM] screen
Select a setting
Key operation during configuration
[MEASURE]
Setting Contents:( : Default setting)CH1,2,3: 1P2W/1P3W/3P3W2M/3P3W3M/3P4W/3P4W2.5ECH4: ACDC/DC/OFF
Setting Contents:( : Default setting)100/101/110/120/127/200/202/208/220/230/240/277/347/380/400/415/480/600/VARIABLE (set from 50 to 780 V in 1 V increments)

5.1 Changing Measurement Conditions
56
VT RatioSets the external VT (PT) being used.
ClampSensor, I RangeSelects the type of clamp sensor being used and current range. You can also set an output rate and usea sensor that has not been registered.
CT RatioSet if using an external CT.
FrequencySelects the nominal frequency (fnom) for the measurement line.
URMS TypeSelects the voltage calculation method to use during 3-phase measurement.
Setting Contents:( : Default setting)1/60/100/200/300/600/700/1000/2000/2500/5000/VARIABLE (0.01 to 9999.99)
Setting Contents:( : Default setting)0.1mV/A(5 kA) : 5000 A/500 A1mV/A(500 A) : 500 A/50 A10mV/A(50 A) : 50 A/5 A100mV/A(5 A) : 5 A/500 mA9657-10 : 5 A/500 mA9660 : 100 A/50 A9661 : 500 A/50 A9667(500 A) : 500 A/50 A9667(5 kA) : 5000 A/500 ACT9667(500 A) : 500 A/50 ACT9667(5 kA) : 5000 A/500 A 9669 : 1000 A/100 A9675 : 5 A/500 mA9694 : 50 A/5 A9695-02 : 50 A/5 A9695-03 : 100 A/50 ACT9691(10 A) : 10 A/5 ACT9691(100 A) : 100 A/50 ACT9692(20 A) : 50 A/5 ACT9692(200 A) : 500 A/50 ACT9693(200 A) : 500 A/50 ACT9693(2 kA) : 5000 A/500 A
Setting Contents:( : Default setting)1/40/60/80/120/160/200/240/300/400/600/800/1200/VARIABLE (0.01 to 9999.99)
Setting Contents:( : Default setting)50 Hz/60 Hz/400 Hz
Setting Contents:( : Default setting)PHASE-N/LINE-LINE
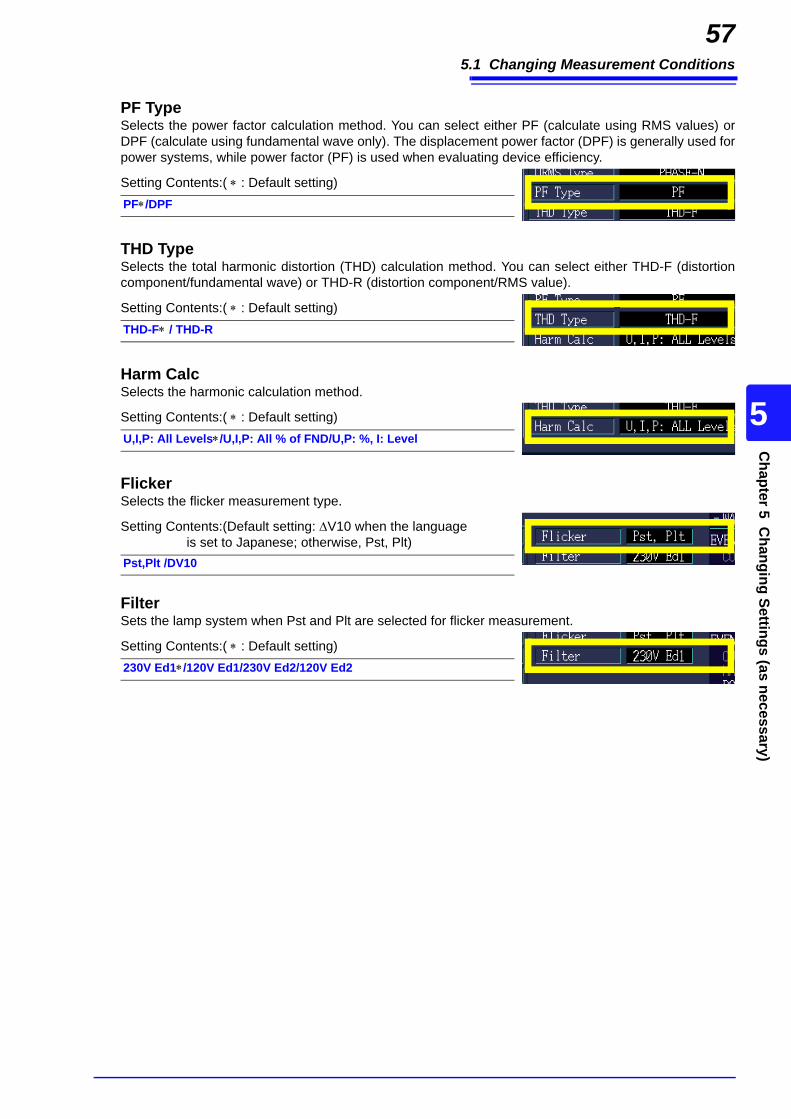
5.1 Changing Measurement Conditions
57C
hapter 5 Changing Settings (as necessary)
5
PF TypeSelects the power factor calculation method. You can select either PF (calculate using RMS values) orDPF (calculate using fundamental wave only). The displacement power factor (DPF) is generally used forpower systems, while power factor (PF) is used when evaluating device efficiency.
THD TypeSelects the total harmonic distortion (THD) calculation method. You can select either THD-F (distortioncomponent/fundamental wave) or THD-R (distortion component/RMS value).
Harm CalcSelects the harmonic calculation method.
FlickerSelects the flicker measurement type.
FilterSets the lamp system when Pst and Plt are selected for flicker measurement.
Setting Contents:( : Default setting)PF/DPF
Setting Contents:( : Default setting)THD-F / THD-R
Setting Contents:( : Default setting)U,I,P: All Levels/U,I,P: All % of FND/U,P: %, I: Level
Setting Contents:(Default setting: V10 when the language is set to Japanese; otherwise, Pst, Plt)
Pst,Plt /DV10
Setting Contents:( : Default setting)230V Ed1/120V Ed1/230V Ed2/120V Ed2
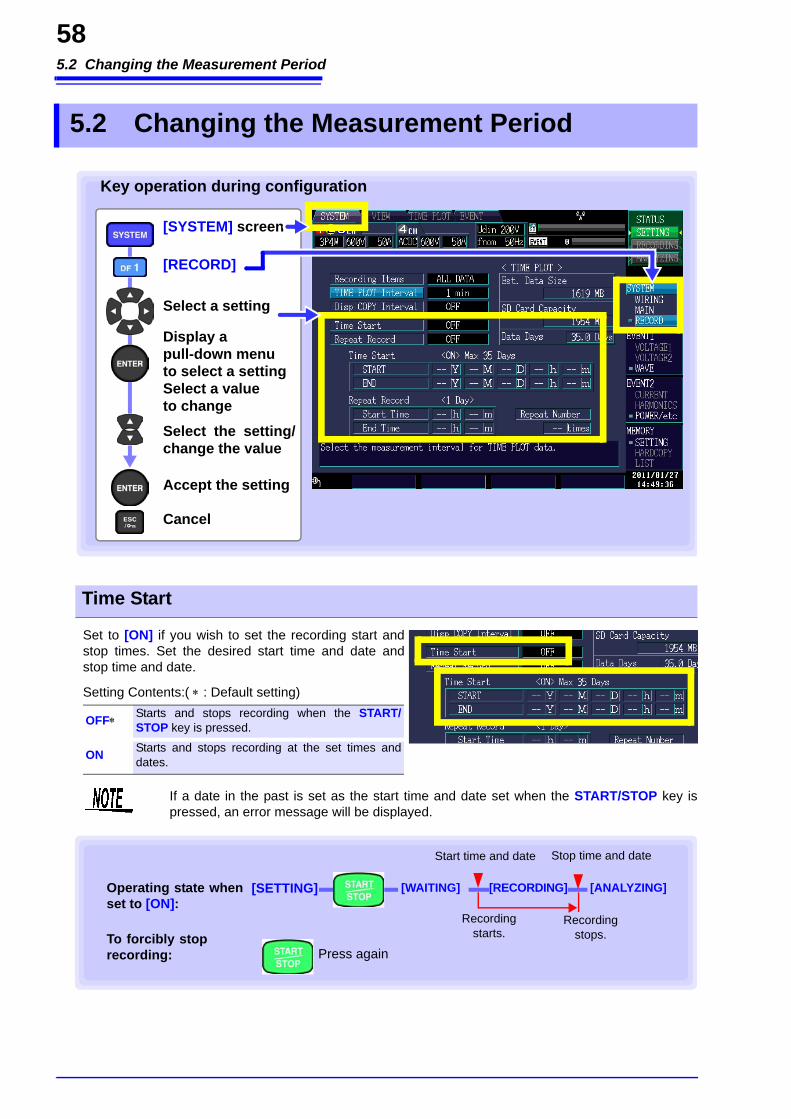
5.2 Changing the Measurement Period
58
Set to [ON] if you wish to set the recording start andstop times. Set the desired start time and date andstop time and date.
5.2 Changing the Measurement Period
Display a pull-down menu to select a settingSelect a value to changeSelect the setting/change the value
Accept the setting
Cancel
[RECORD]
[SYSTEM] screen
Select a setting
Key operation during configuration
Time Start
Setting Contents:( : Default setting)
OFF Starts and stops recording when the START/STOP key is pressed.
ON Starts and stops recording at the set times anddates.
If a date in the past is set as the start time and date set when the START/STOP key ispressed, an error message will be displayed.
Operating state whenset to [ON]:
Recording starts.
Recording stops.
Start time and date Stop time and date
To forcibly stoprecording:
[SETTING] [RECORDING] [ANALYZING]
Press again
[WAITING]
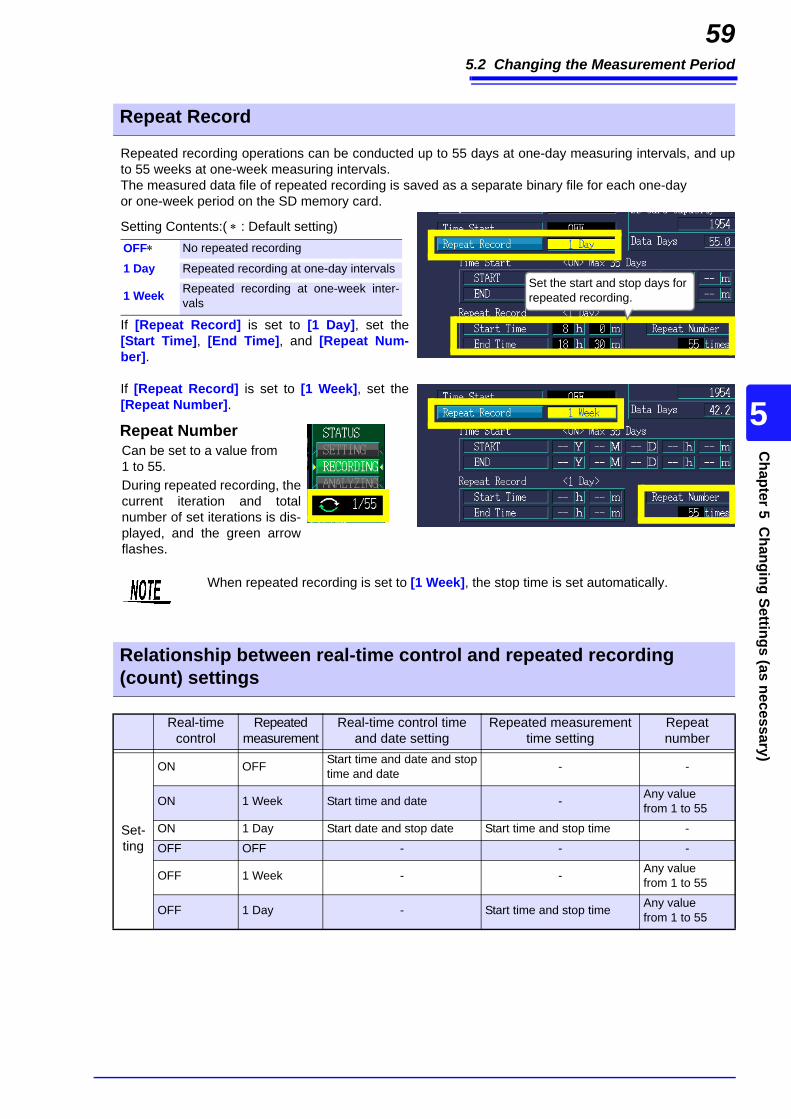
5.2 Changing the Measurement Period
59C
hapter 5 Changing Settings (as necessary)
5
Repeated recording operations can be conducted up to 55 days at one-day measuring intervals, and upto 55 weeks at one-week measuring intervals.The measured data file of repeated recording is saved as a separate binary file for each one-dayor one-week period on the SD memory card.
If [Repeat Record] is set to [1 Day], set the[Start Time], [End Time], and [Repeat Num-ber].
If [Repeat Record] is set to [1 Week], set the[Repeat Number].
Repeat Record
Setting Contents:( : Default setting)OFF No repeated recording
1 Day Repeated recording at one-day intervals
1 Week Repeated recording at one-week inter-vals
Set the start and stop days for repeated recording.
Repeat NumberCan be set to a value from 1 to 55.During repeated recording, thecurrent iteration and totalnumber of set iterations is dis-played, and the green arrowflashes.
When repeated recording is set to [1 Week], the stop time is set automatically.
Relationship between real-time control and repeated recording (count) settings
Real-time control
Repeated measurement
Real-time control time and date setting
Repeated measurement time setting
Repeat number
Set-ting
ON OFF Start time and date and stoptime and date - -
ON 1 Week Start time and date - Any value from 1 to 55
ON 1 Day Start date and stop date Start time and stop time -
OFF OFF - - -
OFF 1 Week - - Any value from 1 to 55
OFF 1 Day - Start time and stop time Any value from 1 to 55

5.2 Changing the Measurement Period
60
Relationship between the repeat setting and the maximum repeat count
When the repeat setting is [OFF]Recording stops when the START/STOP key is pressed, or at the stop time and date set for real-time control.
Max. 35 days
Data storage folder
Measurement data and event data
Standby
When the repeat setting is [1 Day]The START/STOP key is pressed. No gap between the start time and stop time settings, e.g., if the start time
and stop time settings are both set to 0:00 (or any same time).
repeat count
Standby
1 day 1 day 1 day 1 day 1 day
Recording stops.
Recording stops.
Recording starts. Recording
starts.
Max. 55 days
Measurement data and event data
Data storage folder
When the repeat setting is [1 Week]Recording starts when the START/STOP key is pressed.
No gap No gap No gap No gap No gap
1 week 1 week 1 week 1 week 1 week
repeat countMeasurement data and event data
Data storage folder
Recording stops.Recording starts.Start time /
Stop time
Recording starts when the START/STOP key is pressed.
Max. 55 Weeks
Recording starts.Recording stops.
Recording starts.
Recording stops.
• For more information about the data storage folder hierarchy, see "File structure(overall)" (p.140)
• In the event of a power outage (interruption of power to the instrument), the folder willbe segmented.
• Once the data storage files exceed about 100 MB, data will be segmented, regard-less of the repeat count.

5.3 Changing the Recording Settings
61C
hapter 5 Changing Settings (as necessary)
5
Est. Data Size Displays an estimate of the amount of data that will be saved. The estimateddata volume is calculated based on the recording item, TIMEPLOT interval, real-time control, and repeated recording settings. The estimated data volume doesnot include screen copy data or event data.
SD Card Capacity Displays the amount of space remaining on the SD memory card. If the SDmemory card experiences an error, "SD Error" will be shown.
Data Days Displays an estimate of how many days of data can be saved based on the esti-mated data volume and the SD card remaining capacity. The actual number ofdays of data that can be saved may be less than the indicated amount depend-ing on the number of screen copies made and events generated.
5.3 Changing the Recording Settings
Display the pull-down menuSelect a setting
Accept the setting
Cancel
[RECORD]
[SYSTEM] screen
Select a setting
Key operation during configuration
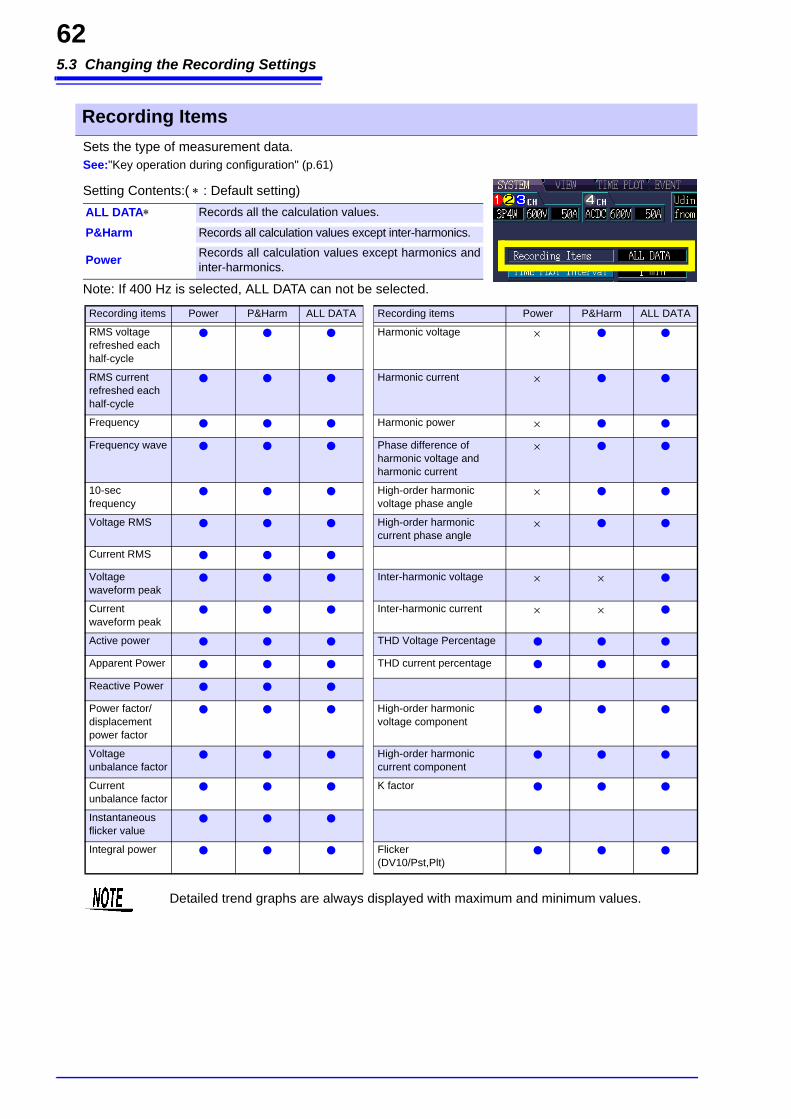
5.3 Changing the Recording Settings
62
Sets the type of measurement data.See:"Key operation during configuration" (p.61)
Note: If 400 Hz is selected, ALL DATA can not be selected.
Recording Items
Setting Contents:( : Default setting)ALL DATA Records all the calculation values.
P&Harm Records all calculation values except inter-harmonics.
Power Records all calculation values except harmonics andinter-harmonics.
Recording items Power P&Harm ALL DATA Recording items Power P&Harm ALL DATA
RMS voltage refreshed each half-cycle
Harmonic voltage
RMS current refreshed each half-cycle
Harmonic current
Frequency Harmonic power Frequency wave Phase difference of
harmonic voltage and harmonic current
10-sec frequency
High-order harmonic voltage phase angle
Voltage RMS High-order harmonic current phase angle
Current RMS Voltage waveform peak
Inter-harmonic voltage
Current waveform peak
Inter-harmonic current
Active power THD Voltage Percentage Apparent Power THD current percentage Reactive Power Power factor/displacement power factor
High-order harmonic voltage component
Voltage unbalance factor
High-order harmonic current component
Current unbalance factor
K factor
Instantaneous flicker value
Integral power Flicker(DV10/Pst,Plt)
Detailed trend graphs are always displayed with maximum and minimum values.
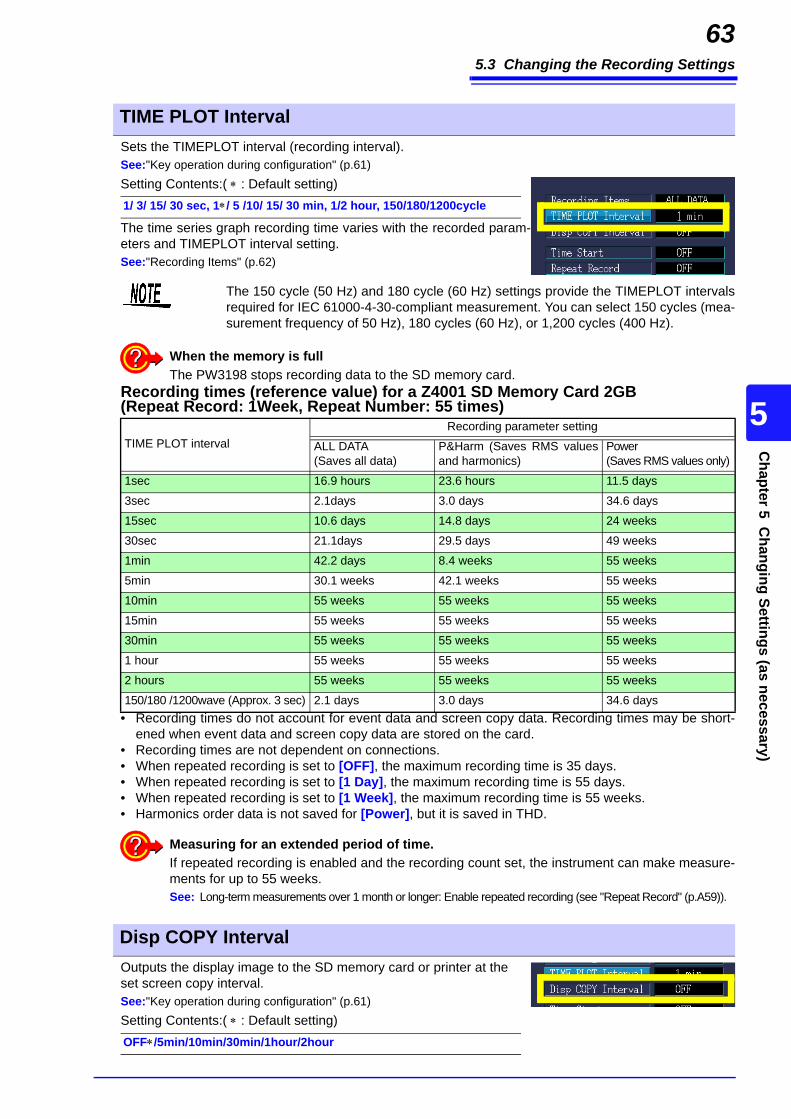
5.3 Changing the Recording Settings
63C
hapter 5 Changing Settings (as necessary)
5
Sets the TIMEPLOT interval (recording interval).See:"Key operation during configuration" (p.61)
The time series graph recording time varies with the recorded param-eters and TIMEPLOT interval setting.See:"Recording Items" (p.62)
Recording times (reference value) for a Z4001 SD Memory Card 2GB (Repeat Record: 1Week, Repeat Number: 55 times)
• Recording times do not account for event data and screen copy data. Recording times may be short-ened when event data and screen copy data are stored on the card.
• Recording times are not dependent on connections.• When repeated recording is set to [OFF], the maximum recording time is 35 days.• When repeated recording is set to [1 Day], the maximum recording time is 55 days.• When repeated recording is set to [1 Week], the maximum recording time is 55 weeks.• Harmonics order data is not saved for [Power], but it is saved in THD.
Outputs the display image to the SD memory card or printer at the set screen copy interval. See:"Key operation during configuration" (p.61)
TIME PLOT Interval
Setting Contents:( : Default setting)1/ 3/ 15/ 30 sec, 1/ 5 /10/ 15/ 30 min, 1/2 hour, 150/180/1200cycle
The 150 cycle (50 Hz) and 180 cycle (60 Hz) settings provide the TIMEPLOT intervalsrequired for IEC 61000-4-30-compliant measurement. You can select 150 cycles (mea-surement frequency of 50 Hz), 180 cycles (60 Hz), or 1,200 cycles (400 Hz).
TIME PLOT intervalRecording parameter setting
ALL DATA(Saves all data)
P&Harm (Saves RMS valuesand harmonics)
Power (Saves RMS values only)
1sec 16.9 hours 23.6 hours 11.5 days
3sec 2.1days 3.0 days 34.6 days
15sec 10.6 days 14.8 days 24 weeks
30sec 21.1days 29.5 days 49 weeks
1min 42.2 days 8.4 weeks 55 weeks
5min 30.1 weeks 42.1 weeks 55 weeks
10min 55 weeks 55 weeks 55 weeks
15min 55 weeks 55 weeks 55 weeks
30min 55 weeks 55 weeks 55 weeks
1 hour 55 weeks 55 weeks 55 weeks
2 hours 55 weeks 55 weeks 55 weeks
150/180 /1200wave (Approx. 3 sec) 2.1 days 3.0 days 34.6 days
When the memory is fullThe PW3198 stops recording data to the SD memory card.
Measuring for an extended period of time.If repeated recording is enabled and the recording count set, the instrument can make measure-ments for up to 55 weeks.See: Long-term measurements over 1 month or longer: Enable repeated recording (see "Repeat Record" (p.A59)).
Disp COPY Interval
Setting Contents:( : Default setting)OFF/5min/10min/30min/1hour/2hour
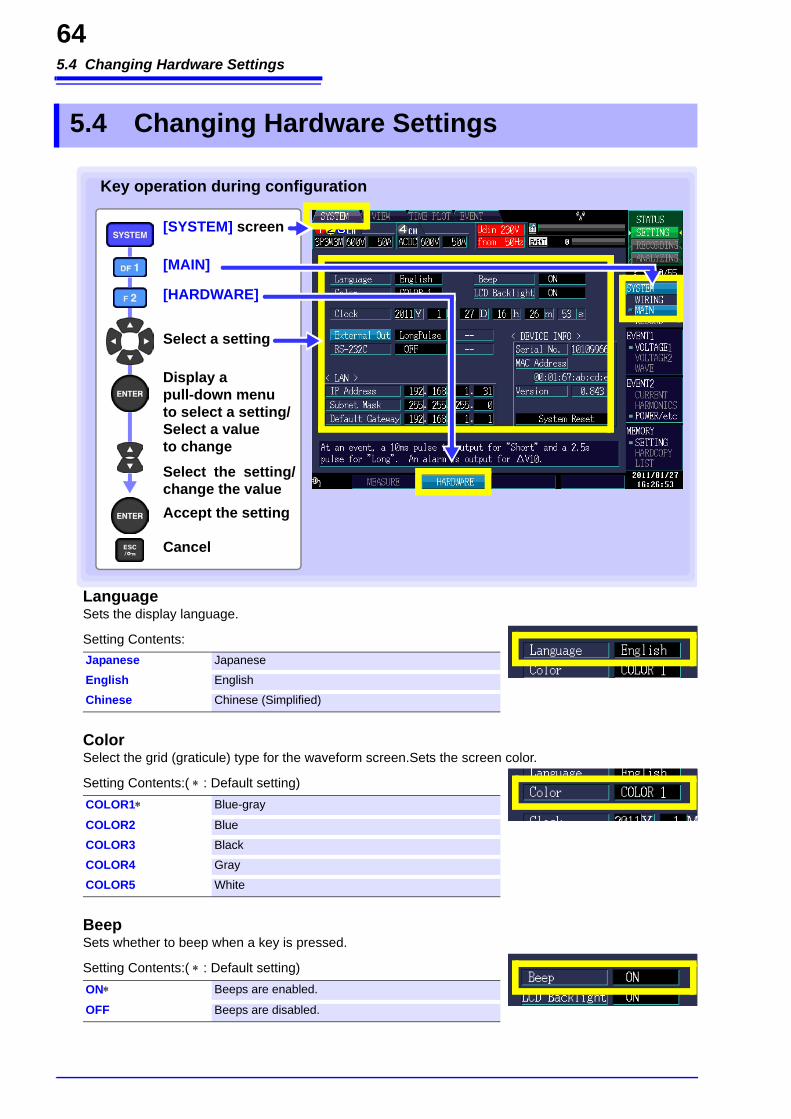
5.4 Changing Hardware Settings
64
LanguageSets the display language.
ColorSelect the grid (graticule) type for the waveform screen.Sets the screen color.
BeepSets whether to beep when a key is pressed.
5.4 Changing Hardware Settings
Setting Contents:Japanese Japanese
English English
Chinese Chinese (Simplified)
Display a pull-down menu to select a setting/Select a value to changeSelect the setting/change the valueAccept the setting
Cancel
[MAIN]
[SYSTEM] screen
Select a setting
Key operation during configuration
[HARDWARE]
Setting Contents:( : Default setting)COLOR1 Blue-gray
COLOR2 Blue
COLOR3 Black
COLOR4 Gray
COLOR5 White
Setting Contents:( : Default setting)ON Beeps are enabled.
OFF Beeps are disabled.
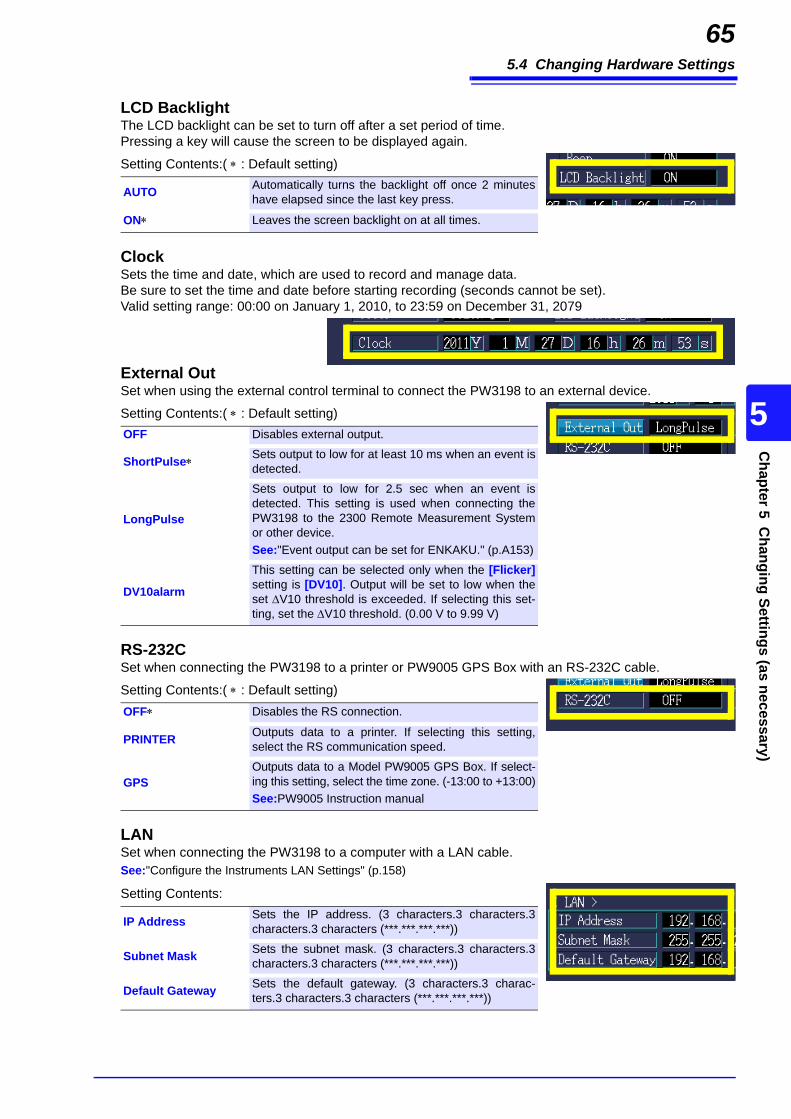
5.4 Changing Hardware Settings
65C
hapter 5 Changing Settings (as necessary)
5
LCD BacklightThe LCD backlight can be set to turn off after a set period of time. Pressing a key will cause the screen to be displayed again.
ClockSets the time and date, which are used to record and manage data. Be sure to set the time and date before starting recording (seconds cannot be set). Valid setting range: 00:00 on January 1, 2010, to 23:59 on December 31, 2079
External OutSet when using the external control terminal to connect the PW3198 to an external device.
RS-232CSet when connecting the PW3198 to a printer or PW9005 GPS Box with an RS-232C cable.
LANSet when connecting the PW3198 to a computer with a LAN cable. See:"Configure the Instruments LAN Settings" (p.158)
Setting Contents:( : Default setting)
AUTO Automatically turns the backlight off once 2 minuteshave elapsed since the last key press.
ON Leaves the screen backlight on at all times.
Setting Contents:( : Default setting)OFF Disables external output.
ShortPulse Sets output to low for at least 10 ms when an event isdetected.
LongPulse
Sets output to low for 2.5 sec when an event isdetected. This setting is used when connecting thePW3198 to the 2300 Remote Measurement Systemor other device.See:"Event output can be set for ENKAKU." (p.A153)
DV10alarm
This setting can be selected only when the [Flicker]setting is [DV10]. Output will be set to low when theset V10 threshold is exceeded. If selecting this set-ting, set the V10 threshold. (0.00 V to 9.99 V)
Setting Contents:( : Default setting)OFF Disables the RS connection.
PRINTER Outputs data to a printer. If selecting this setting,select the RS communication speed.
GPSOutputs data to a Model PW9005 GPS Box. If select-ing this setting, select the time zone. (-13:00 to +13:00)See:PW9005 Instruction manual
Setting Contents:
IP Address Sets the IP address. (3 characters.3 characters.3characters.3 characters (***.***.***.***))
Subnet Mask Sets the subnet mask. (3 characters.3 characters.3characters.3 characters (***.***.***.***))
Default Gateway Sets the default gateway. (3 characters.3 charac-ters.3 characters.3 characters (***.***.***.***))

5.5 Changing Event Settings
66
5.5 Changing Event Settings
What is an event?See: "Appendix 2 Explanation of Power Supply Quality Parameters and Events"
List of event settingsEvent parameter Order
selectionAdditional functionality
Channelselection Threshold (Note 9) Note
Transient overvoltage (1,2,3) (4)(OFF)
0 to 6000 VpkSpecify as absolute value. 1,4
Swell Slide (1,2,3) (-)(OFF) 0 to 200% 1,5
Dip Slide (1,2,3) (-)(OFF) 0 to 100% 1,5
Interruption (1,2,3) (-)(OFF) 0 to 100% 1,5
Inrush current (1,2,3) (4)(OFF) 0 to (varies with range) A 1,4,5
Frequency (U1) (-)(OFF) 0.1 to about 9.9 Hz 5
Frequency cycle (U1) (-)(OFF) 0.1 to about 9.9 Hz 5
Voltage waveform peak
(1,2,3) (4)(OFF) 0 to 1200 Vpk 1,4,7
RMS voltage Phase/linesense
(1,2,3) (4)(OFF)
0 to 780 VSpecify upper and lower limits. 1,3,4,5
DC voltage change (CH4 only)
(-,-,-) (4)(OFF) 0 to 1200 V 1,5
Current waveform peak
(1,2,3) (4)(OFF) 0 to (varies with range) A×4 1,4,7
RMS current Sense (1,2,3) (4)(OFF) 0 to (varies with range) A 1,4,5
DC current change (CH4 only)
(-,-,-) (4)(OFF) 0 to (varies with range) A×4 1,5
Active power (1,2,3)(sum)(OFF)
0 to varies with rangeSpecify as absolute value. 1,4,5,8
Apparent power (1,2,3)(sum)(OFF) 0 to varies with range 1,4,5,8
Reactive power (1,2,3)(sum)(OFF)
0 to varies with rangeSpecify as absolute value. 1,4,5,8
Power factor/displace-ment power factor PF/DPF (1,2,3)(sum)
(OFF) 0 to 1 3,4,5
Negative-phase volt-age unbalance factor
(-,-,-)(sum)(OFF) 0 to 100% 5
Zero-phase voltage unbalance factor
(-,-,-)(sum)(OFF) 0 to 100% 5
Negative-phase cur-rent unbalance factor
(-,-,-)(sum)(OFF) 0 to 100% 5
Zero-phase current unbalance factor
(-,-,-)(sum)(OFF) 0 to 100% 5
Harmonic voltage Orders0 to 50
Level (RMS)/content percentage
(1,2,3) (4)(OFF)
0 to 780V/0 to 100%Specify 0-order as an absolute value.
1,2,3,4,5,6
Harmonic current Orders0 to 50
Level (RMS)/content percentage
(1,2,3) (4)(OFF)
1.3 × (0 to [varies with range]) A /0 to 100%Specify 0-order as an absolute value.
1,2,3,4,5,6
Harmonic power Orders0 to 50
Level/contentpercentage
(1,2,3)(sum)(OFF)
1.3 × (0 to [varies with range]) W Specify as absolute value. /0 to 100%
1,2,3,4,5,6,8
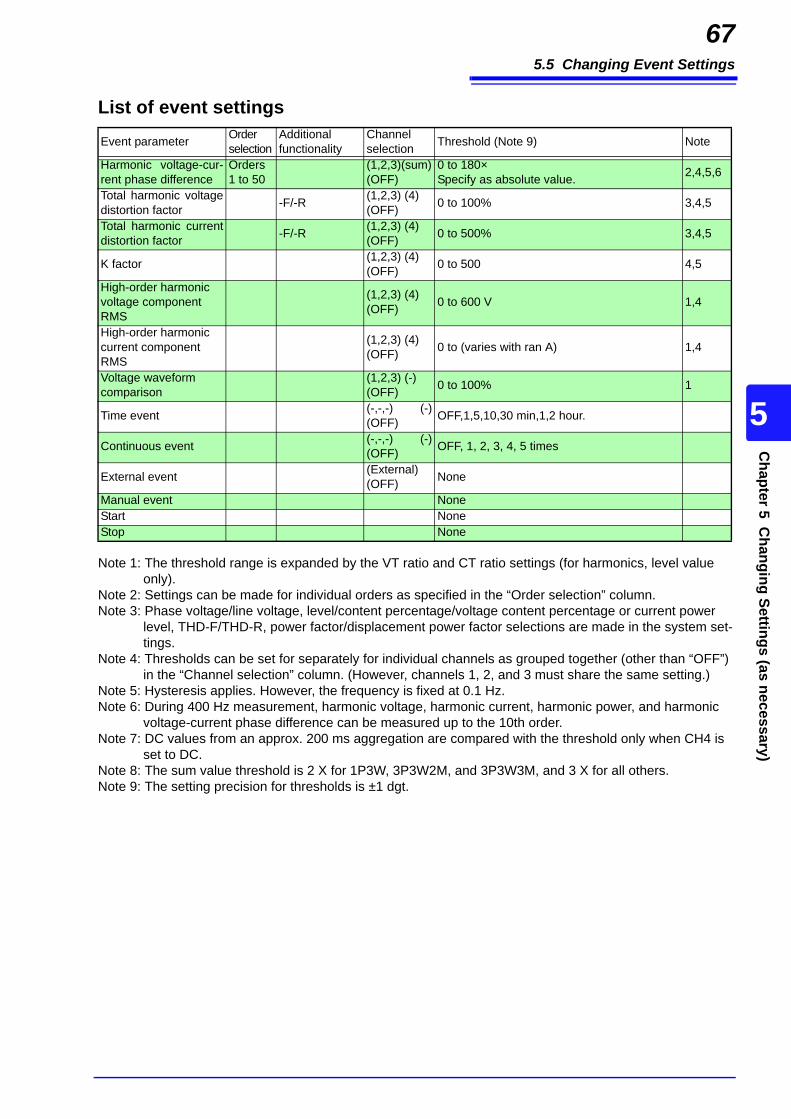
5.5 Changing Event Settings
67C
hapter 5 Changing Settings (as necessary)
5
Note 1: The threshold range is expanded by the VT ratio and CT ratio settings (for harmonics, level value only).
Note 2: Settings can be made for individual orders as specified in the “Order selection” column. Note 3: Phase voltage/line voltage, level/content percentage/voltage content percentage or current power
level, THD-F/THD-R, power factor/displacement power factor selections are made in the system set-tings.
Note 4: Thresholds can be set for separately for individual channels as grouped together (other than “OFF”) in the “Channel selection” column. (However, channels 1, 2, and 3 must share the same setting.)
Note 5: Hysteresis applies. However, the frequency is fixed at 0.1 Hz.Note 6: During 400 Hz measurement, harmonic voltage, harmonic current, harmonic power, and harmonic
voltage-current phase difference can be measured up to the 10th order.Note 7: DC values from an approx. 200 ms aggregation are compared with the threshold only when CH4 is
set to DC.Note 8: The sum value threshold is 2 X for 1P3W, 3P3W2M, and 3P3W3M, and 3 X for all others.Note 9: The setting precision for thresholds is ±1 dgt.
Harmonic voltage-cur-rent phase difference
Orders1 to 50
(1,2,3)(sum)(OFF)
0 to 180×Specify as absolute value. 2,4,5,6
Total harmonic voltagedistortion factor -F/-R (1,2,3) (4)
(OFF) 0 to 100% 3,4,5
Total harmonic currentdistortion factor -F/-R (1,2,3) (4)
(OFF) 0 to 500% 3,4,5
K factor (1,2,3) (4)(OFF) 0 to 500 4,5
High-order harmonic voltage component RMS
(1,2,3) (4)(OFF) 0 to 600 V 1,4
High-order harmonic current component RMS
(1,2,3) (4)(OFF) 0 to (varies with ran A) 1,4
Voltage waveform comparison
(1,2,3) (-)(OFF) 0 to 100% 1
Time event (-,-,-) (-)(OFF) OFF,1,5,10,30 min,1,2 hour.
Continuous event (-,-,-) (-)(OFF) OFF, 1, 2, 3, 4, 5 times
External event (External)(OFF) None
Manual event NoneStart NoneStop None
List of event settingsEvent parameter Order
selectionAdditional functionality
Channelselection Threshold (Note 9) Note
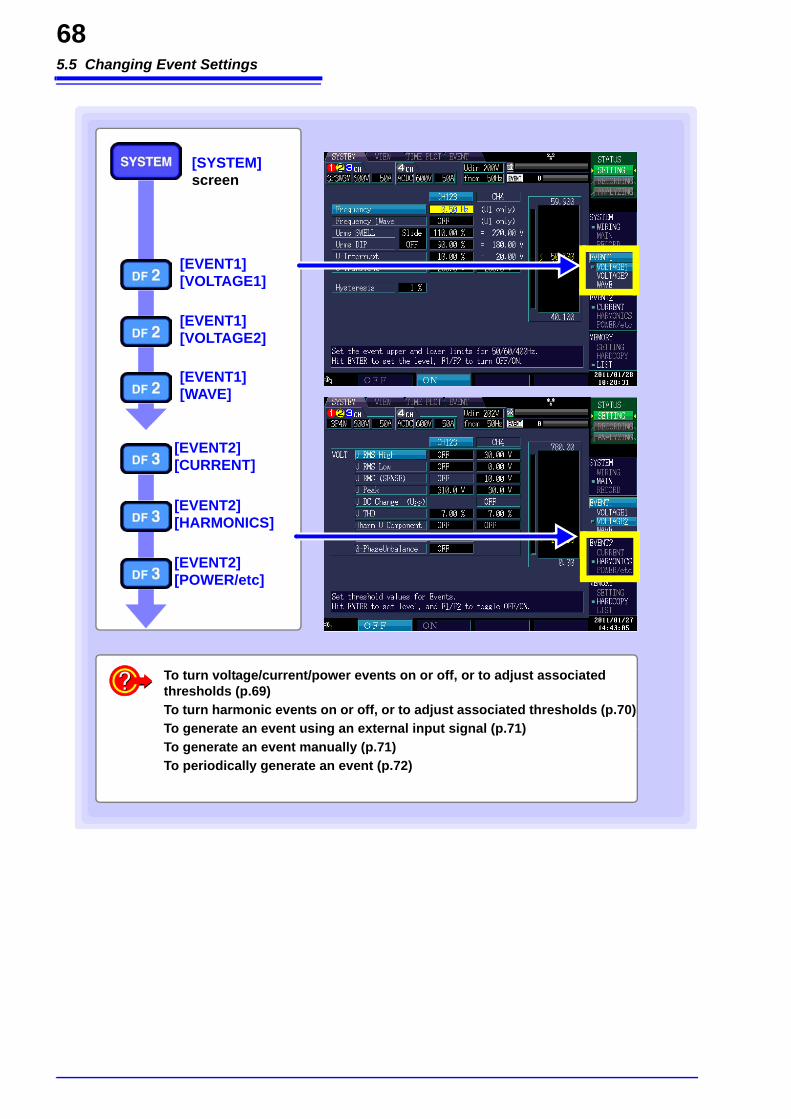
5.5 Changing Event Settings
68
[SYSTEM]screen
[EVENT1][VOLTAGE1]
[EVENT2][CURRENT]
To turn voltage/current/power events on or off, or to adjust associated thresholds (p.69)To turn harmonic events on or off, or to adjust associated thresholds (p.70)To generate an event using an external input signal (p.71)To generate an event manually (p.71)To periodically generate an event (p.72)
[EVENT1][VOLTAGE2]
[EVENT1][WAVE]
[EVENT2][HARMONICS]
[EVENT2][POWER/etc]

5.5 Changing Event Settings
69C
hapter 5 Changing Settings (as necessary)
5
Hysteresis Set as a percentage of the event thresholds for voltage, current, power, andother measured values in order to prevent an excessively large number ofevents from occurring. It is generally recommended to set the hysteresis from1% to 2%.
Slide(slide reference
voltage)
When the voltage value fluctuates gradually, allows dip and swell to be judgedusing the fluctuating voltage values as a reference. (For more information. (Formore information, see "Slide reference voltage" (p.A27))
SENSE(Sense)
When the RMS voltage or RMS current continues to fluctuate in excess of thethreshold, generates an event when the value obtained by adding the set sensevalue and the measured value is exceeded. You can track events to identify thestatus when the RMS voltage or RMS current exceeds the threshold. (For moreinformation, see "Sense" (p.A27))
Turning events on and off and adjusting thresholds(applies to voltage, current, and power)
Setting Contents:( : Default setting)OFF Disables the event function for the selected setting.
ON Sets the threshold at which to enable the event function for theselected setting.
Select a setting
[OFF] [ON]Or
Accept the setting
Cancel
Set the thresholdSee: "Reference graph
for use when set-ting thresholds"
Select the settingto change it
• Sets the voltage swell, voltage dip, and voltage interruption threshold values as percent-ages of nominal voltage (Uref)*. The converted voltage is displayed to the right of thepercentage setting.
• Setting the voltage swell and voltage dip [Slide] settings to [ON] causes the threshold tobe expressed as a percentage of the slide reference voltage.
*: The nominal voltage (Uref) is obtained by multiplying the nominal input voltage (Udin) bythe VT ratio. When the VT ratio is 1, the nominal voltage (Uref) is equal to the nominalinput voltage (Udin).
• If the threshold value falls outside the valid setting range, "-----" will be displayed. Press-ing the ENTER key resets the value to the threshold upper limit.
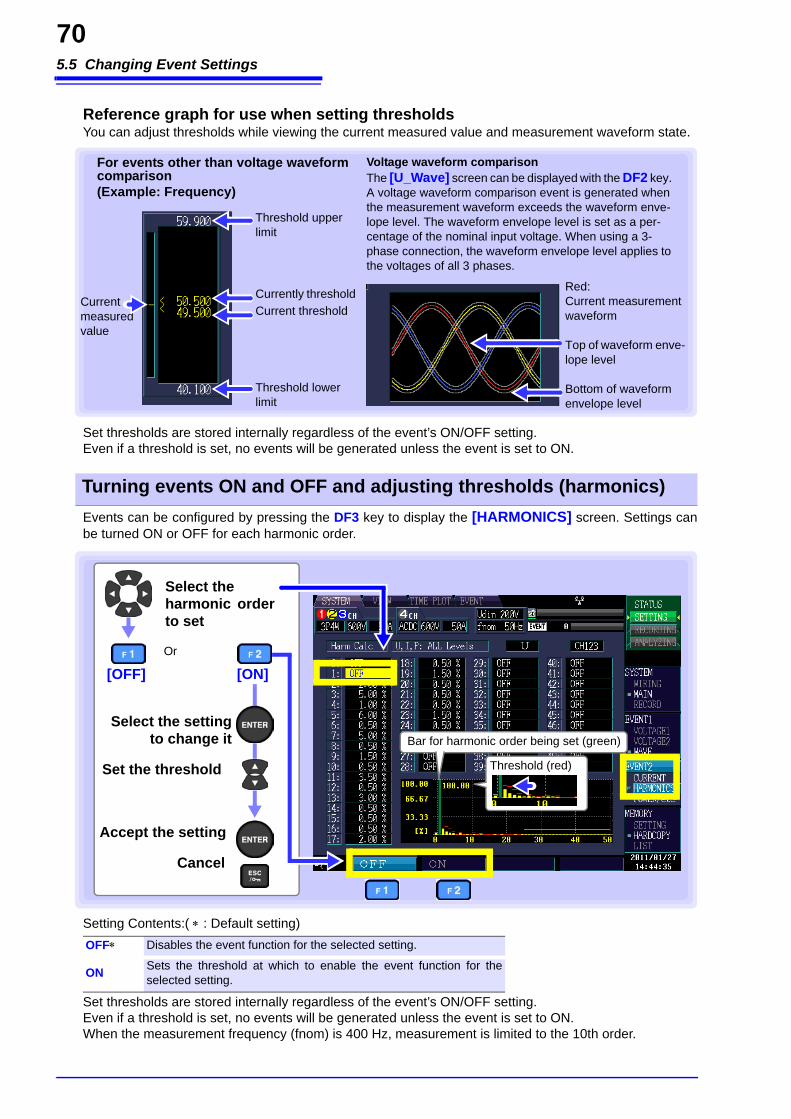
5.5 Changing Event Settings
70
Reference graph for use when setting thresholdsYou can adjust thresholds while viewing the current measured value and measurement waveform state.
Set thresholds are stored internally regardless of the event’s ON/OFF setting. Even if a threshold is set, no events will be generated unless the event is set to ON.
Events can be configured by pressing the DF3 key to display the [HARMONICS] screen. Settings canbe turned ON or OFF for each harmonic order.
Set thresholds are stored internally regardless of the event’s ON/OFF setting. Even if a threshold is set, no events will be generated unless the event is set to ON. When the measurement frequency (fnom) is 400 Hz, measurement is limited to the 10th order.
Threshold upper limit
For events other than voltage waveformcomparison(Example: Frequency)
Red: Current measurement waveform
Top of waveform enve-lope level
Bottom of waveform envelope level
Current measured value
Current threshold
Threshold lower limit
Currently threshold
Voltage waveform comparisonThe [U_Wave] screen can be displayed with the DF2 key. A voltage waveform comparison event is generated when the measurement waveform exceeds the waveform enve-lope level. The waveform envelope level is set as a per-centage of the nominal input voltage. When using a 3-phase connection, the waveform envelope level applies to the voltages of all 3 phases.
Turning events ON and OFF and adjusting thresholds (harmonics)
Setting Contents:( : Default setting)OFF Disables the event function for the selected setting.
ON Sets the threshold at which to enable the event function for theselected setting.
Select the harmonic orderto set
[OFF]Or
Accept the setting
Cancel
Set the threshold
Bar for harmonic order being set (green)
Threshold (red)
Select the settingto change it
[ON]
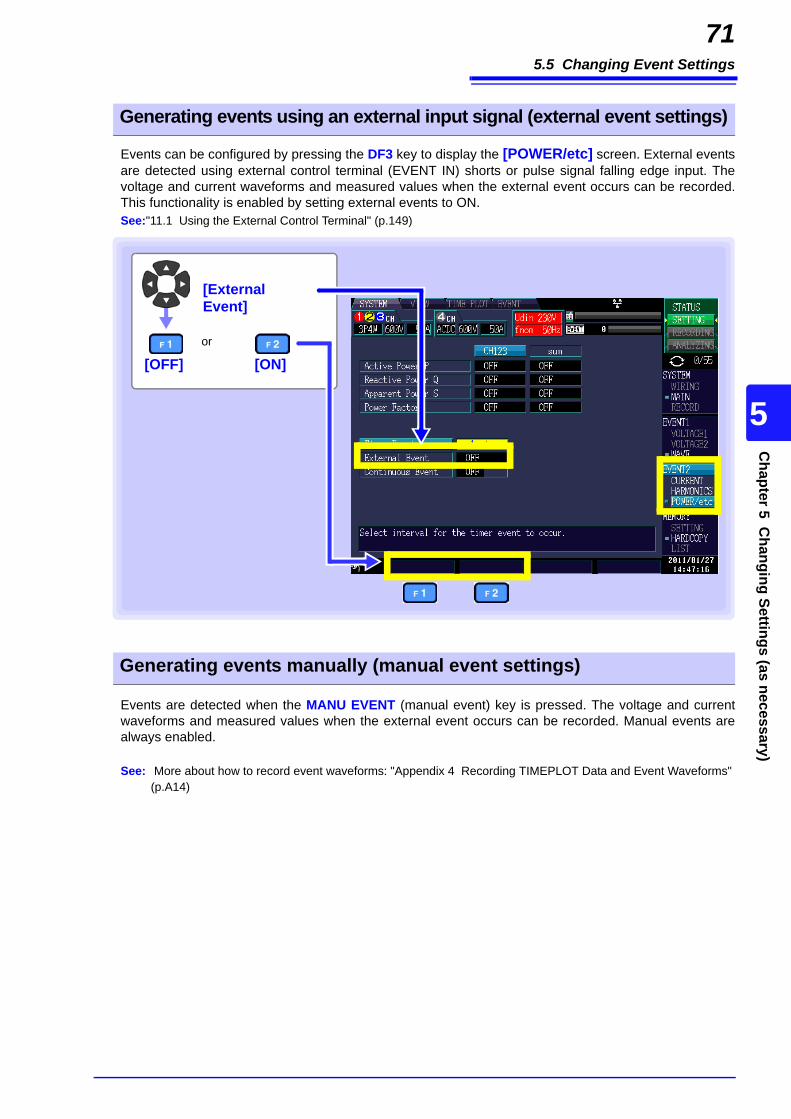
5.5 Changing Event Settings
71C
hapter 5 Changing Settings (as necessary)
5
Events can be configured by pressing the DF3 key to display the [POWER/etc] screen. External eventsare detected using external control terminal (EVENT IN) shorts or pulse signal falling edge input. Thevoltage and current waveforms and measured values when the external event occurs can be recorded.This functionality is enabled by setting external events to ON. See:"11.1 Using the External Control Terminal" (p.149)
Events are detected when the MANU EVENT (manual event) key is pressed. The voltage and currentwaveforms and measured values when the external event occurs can be recorded. Manual events arealways enabled.
See: More about how to record event waveforms: "Appendix 4 Recording TIMEPLOT Data and Event Waveforms" (p.A14)
Generating events using an external input signal (external event settings)
Generating events manually (manual event settings)
[ExternalEvent]
[OFF] [ON]or
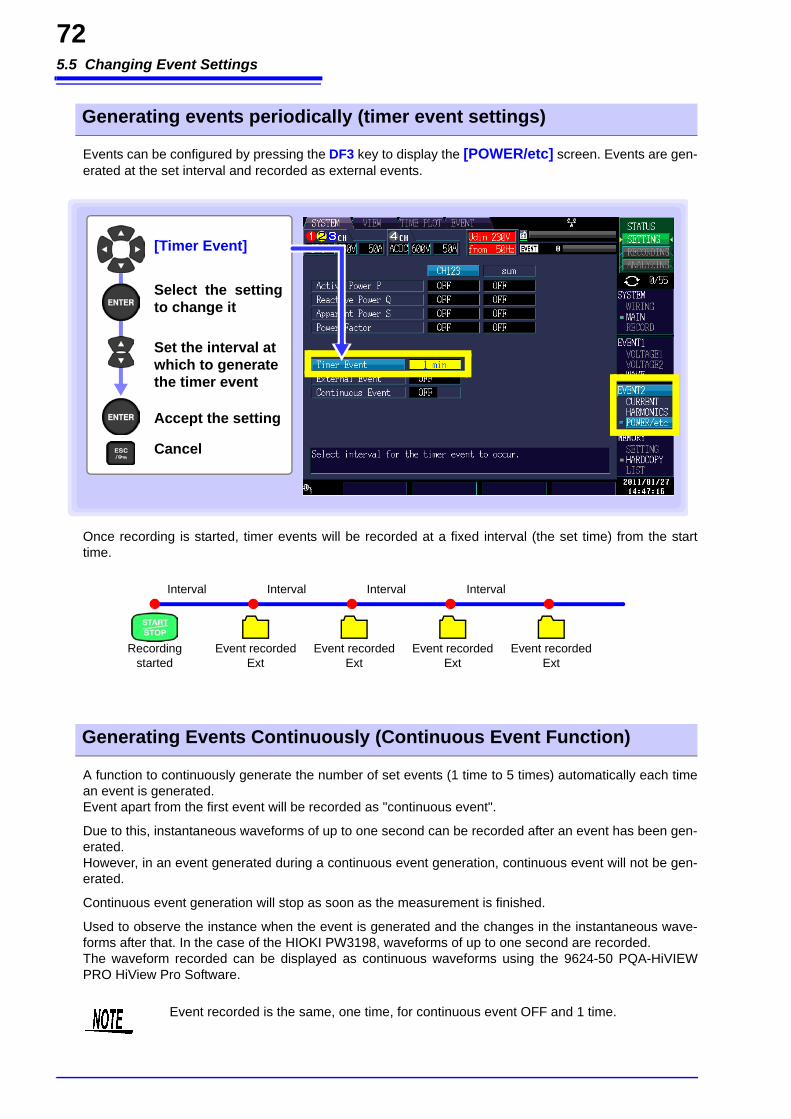
5.5 Changing Event Settings
72
Events can be configured by pressing the DF3 key to display the [POWER/etc] screen. Events are gen-erated at the set interval and recorded as external events.
Once recording is started, timer events will be recorded at a fixed interval (the set time) from the starttime.
A function to continuously generate the number of set events (1 time to 5 times) automatically each timean event is generated.Event apart from the first event will be recorded as "continuous event".
Due to this, instantaneous waveforms of up to one second can be recorded after an event has been gen-erated.However, in an event generated during a continuous event generation, continuous event will not be gen-erated.
Continuous event generation will stop as soon as the measurement is finished.
Used to observe the instance when the event is generated and the changes in the instantaneous wave-forms after that. In the case of the HIOKI PW3198, waveforms of up to one second are recorded. The waveform recorded can be displayed as continuous waveforms using the 9624-50 PQA-HiVIEWPRO HiView Pro Software.
Generating events periodically (timer event settings)
[Timer Event]
Accept the setting
Cancel
Set the interval at which to generate the timer event
Select the settingto change it
Event recordedExt
Event recordedExt
Event recordedExt
Event recordedExt
Recording started
Interval Interval Interval Interval
Generating Events Continuously (Continuous Event Function)
Event recorded is the same, one time, for continuous event OFF and 1 time.
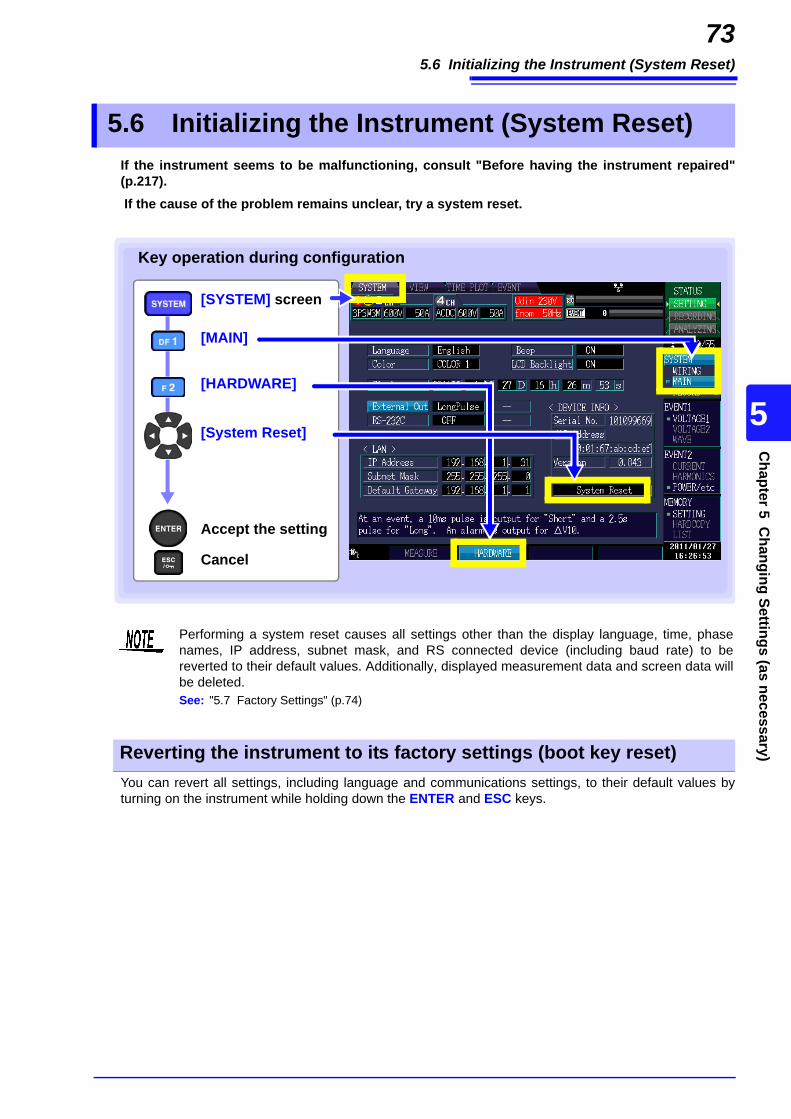
5.6 Initializing the Instrument (System Reset)
73C
hapter 5 Changing Settings (as necessary)
5
If the instrument seems to be malfunctioning, consult "Before having the instrument repaired"(p.217). If the cause of the problem remains unclear, try a system reset.
You can revert all settings, including language and communications settings, to their default values byturning on the instrument while holding down the ENTER and ESC keys.
5.6 Initializing the Instrument (System Reset)
Accept the setting
Cancel
[MAIN]
[SYSTEM] screen
[System Reset]
Key operation during configuration
[HARDWARE]
Performing a system reset causes all settings other than the display language, time, phasenames, IP address, subnet mask, and RS connected device (including baud rate) to bereverted to their default values. Additionally, displayed measurement data and screen data willbe deleted. See: "5.7 Factory Settings" (p.74)
Reverting the instrument to its factory settings (boot key reset)

5.7 Factory Settings
74
All settings’ default values are as follows:
5.7 Factory Settings
Measurement settings
Setting Default value Setting Default value
WIRING CH123: 3P4WCH4: ACDC ClampSensor CH123: 9661
CH4: 9661
Phase Name RST I Range CH123: 500 ACH4: 500 A
PT Ratio CH123: 1CH4: 1 CT Ratio CH123: 1
CH4: 1
Udin 230 V THD Type THD-F
Frequency 50 Hz Harm Calc U,I,P: All Levels
URMS Type PHASE-N Flicker Varies with set displaylanguage.
PF Type PF
Measurement period and recording settings
Setting Default value Setting Default value
Time Start OFF TIME PLOT Interval 1 min
Repeat Record OFF Disp COPY Interval OFF
Recording Items ALL DATA
Hardware settings
Setting Default value Setting Default value
Language Set language LCD Backlight ON
Color COLOR1 External Out ShortPulse
Beep ON RS-232C OFF
Vector area settings
Setting Default value Setting Default value
Phase ±30 U/I Angle 0
Level ±20
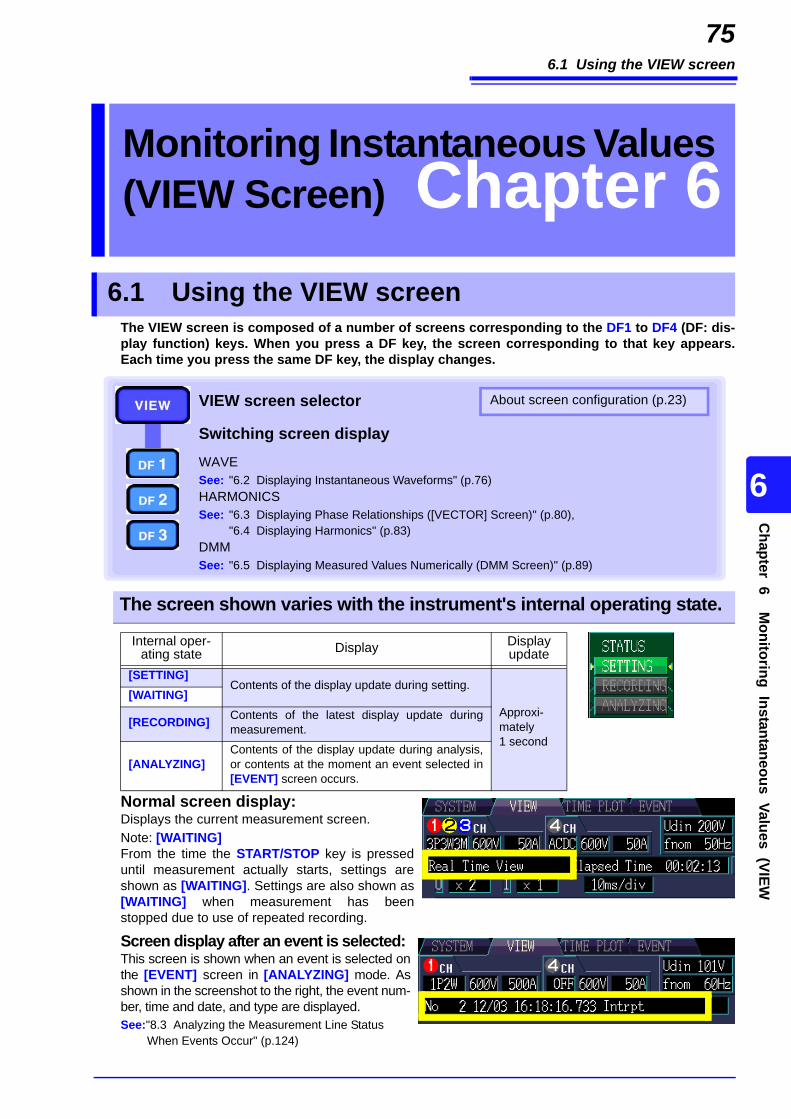
6.1 Using the VIEW screen
75C
hapter 6 Monitoring Instantaneous Values (VIEW
6
The VIEW screen is composed of a number of screens corresponding to the DF1 to DF4 (DF: dis-play function) keys. When you press a DF key, the screen corresponding to that key appears.Each time you press the same DF key, the display changes.
Normal screen display:Displays the current measurement screen.Note: [WAITING]From the time the START/STOP key is presseduntil measurement actually starts, settings areshown as [WAITING]. Settings are also shown as[WAITING] when measurement has beenstopped due to use of repeated recording.
Screen display after an event is selected: This screen is shown when an event is selected onthe [EVENT] screen in [ANALYZING] mode. Asshown in the screenshot to the right, the event num-ber, time and date, and type are displayed. See:"8.3 Analyzing the Measurement Line Status
When Events Occur" (p.124)
Monitoring Instantaneous Values (VIEW Screen) Chapter 6
6.1 Using the VIEW screen
VIEW screen selector
WAVESee: "6.2 Displaying Instantaneous Waveforms" (p.76)HARMONICSSee: "6.3 Displaying Phase Relationships ([VECTOR] Screen)" (p.80),
"6.4 Displaying Harmonics" (p.83)DMMSee: "6.5 Displaying Measured Values Numerically (DMM Screen)" (p.89)
Switching screen display
About screen configuration (p.23)
The screen shown varies with the instrument's internal operating state.
Internal oper-ating state Display Display
update[SETTING]
Contents of the display update during setting.
Approxi-mately1 second
[WAITING]
[RECORDING] Contents of the latest display update duringmeasurement.
[ANALYZING]Contents of the display update during analysis,or contents at the moment an event selected in[EVENT] screen occurs.
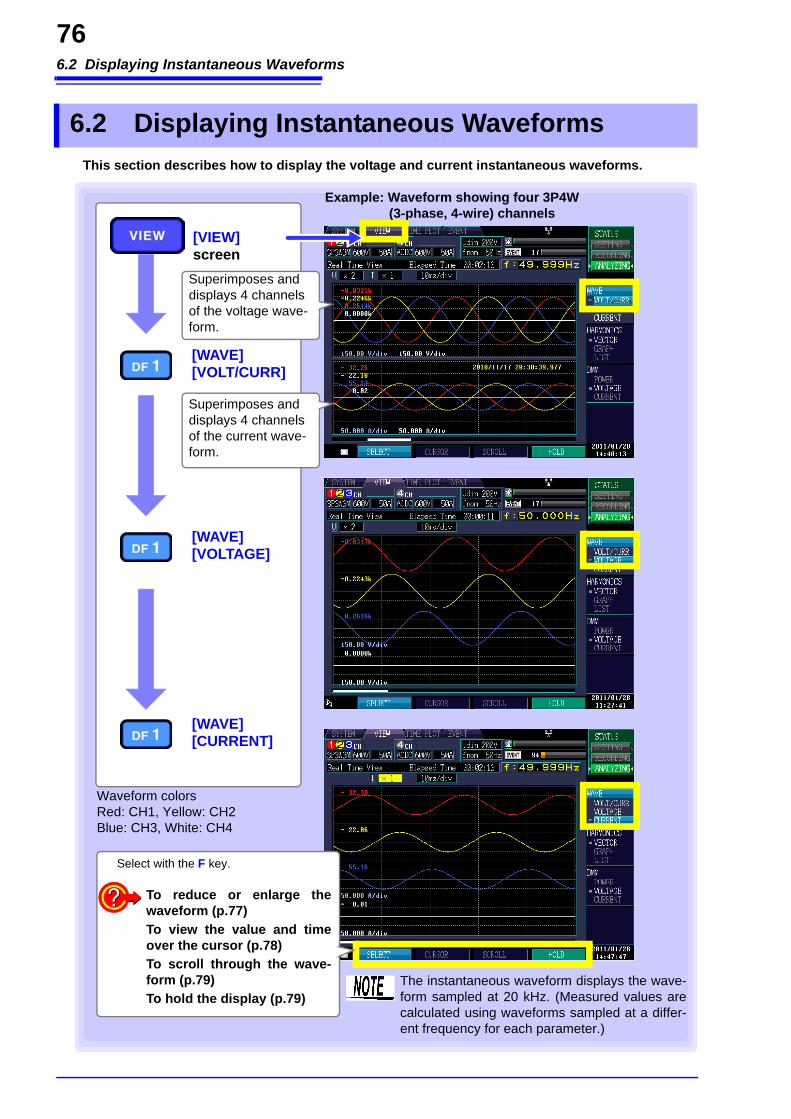
6.2 Displaying Instantaneous Waveforms
76
This section describes how to display the voltage and current instantaneous waveforms.
6.2 Displaying Instantaneous Waveforms
/(p.77)To read the valueabove the cursor (p.78)To scroll waveformdata (p.79)
[VIEW]screen
[WAVE][VOLTAGE]
Waveform colorsRed: CH1, Yellow: CH2Blue: CH3, White: CH4
Example: Waveform showing four 3P4W (3-phase, 4-wire) channels
Select with the F key.
To reduce or enlarge thewaveform (p.77)To view the value and timeover the cursor (p.78)To scroll through the wave-form (p.79)To hold the display (p.79)
Superimposes and displays 4 channels of the voltage wave-form.
Superimposes and displays 4 channels of the current wave-form.
[WAVE][VOLT/CURR]
[WAVE][CURRENT]
The instantaneous waveform displays the wave-form sampled at 20 kHz. (Measured values arecalculated using waveforms sampled at a differ-ent frequency for each parameter.)
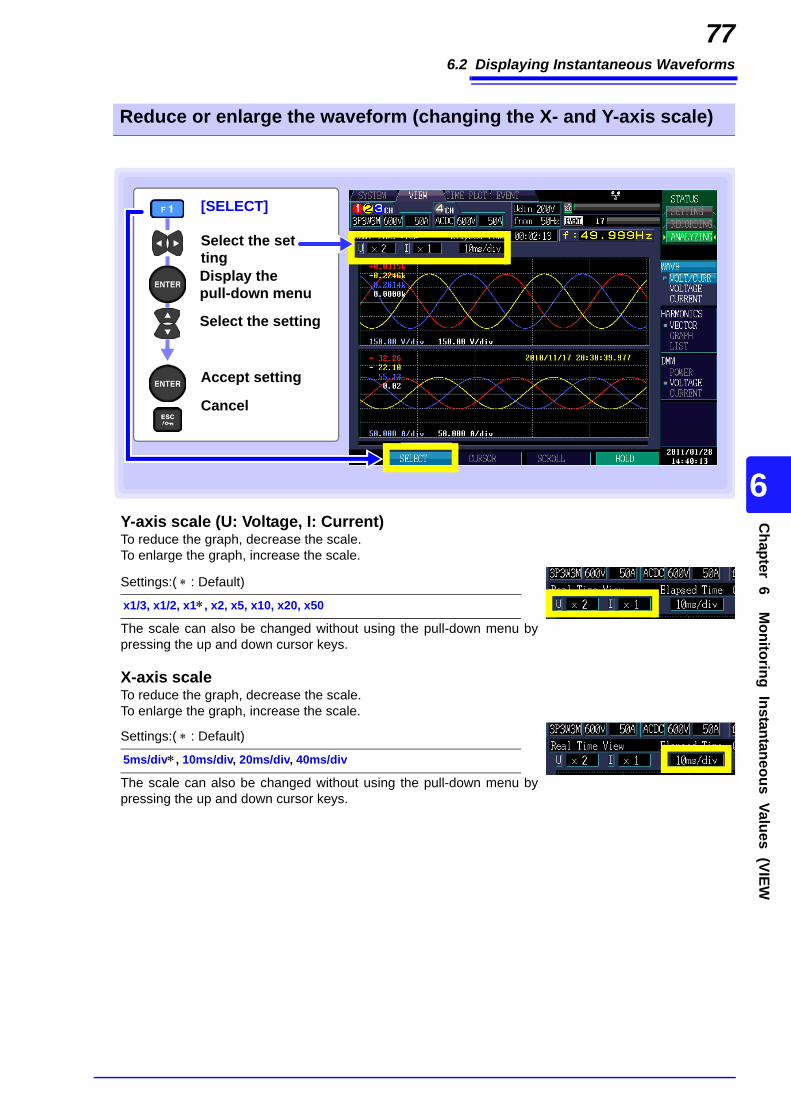
6.2 Displaying Instantaneous Waveforms
77C
hapter 6 Monitoring Instantaneous Values (VIEW
6
Y-axis scale (U: Voltage, I: Current)To reduce the graph, decrease the scale.To enlarge the graph, increase the scale.The scale can also be changed without using the pull-down menu bypressing the up and down cursor keys.
X-axis scale To reduce the graph, decrease the scale.To enlarge the graph, increase the scale.
The scale can also be changed without using the pull-down menu bypressing the up and down cursor keys.
Reduce or enlarge the waveform (changing the X- and Y-axis scale)
Display the pull-down menu
Select the setting
Accept setting
Cancel
[SELECT]
Select the set-ting
Settings:( : Default)
x1/3, x1/2, x1, x2, x5, x10, x20, x50
Settings:( : Default)
5ms/div, 10ms/div, 20ms/div, 40ms/div
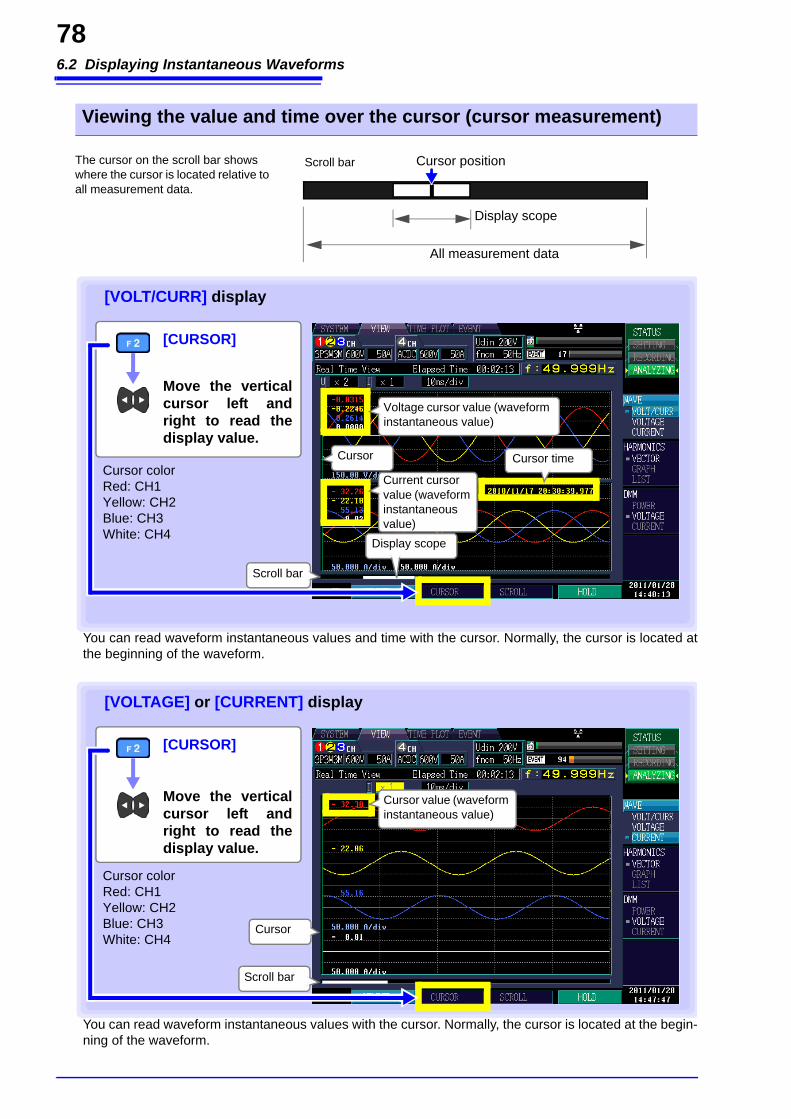
6.2 Displaying Instantaneous Waveforms
78
You can read waveform instantaneous values and time with the cursor. Normally, the cursor is located atthe beginning of the waveform.
You can read waveform instantaneous values with the cursor. Normally, the cursor is located at the begin-ning of the waveform.
Viewing the value and time over the cursor (cursor measurement)
The cursor on the scroll bar shows where the cursor is located relative to all measurement data.
Scroll bar
Display scope
All measurement data
Cursor position
[CURSOR]
Move the verticalcursor left andright to read thedisplay value.
Cursor colorRed: CH1Yellow: CH2Blue: CH3White: CH4
Cursor Cursor time
Voltage cursor value (waveform instantaneous value)
Current cursor value (waveform instantaneous value)
Scroll bar
[VOLT/CURR] display
Display scope
[CURSOR]
Move the verticalcursor left andright to read thedisplay value.
Cursor colorRed: CH1Yellow: CH2Blue: CH3White: CH4
Cursor
Cursor value (waveform instantaneous value)
Scroll bar
[VOLTAGE] or [CURRENT] display
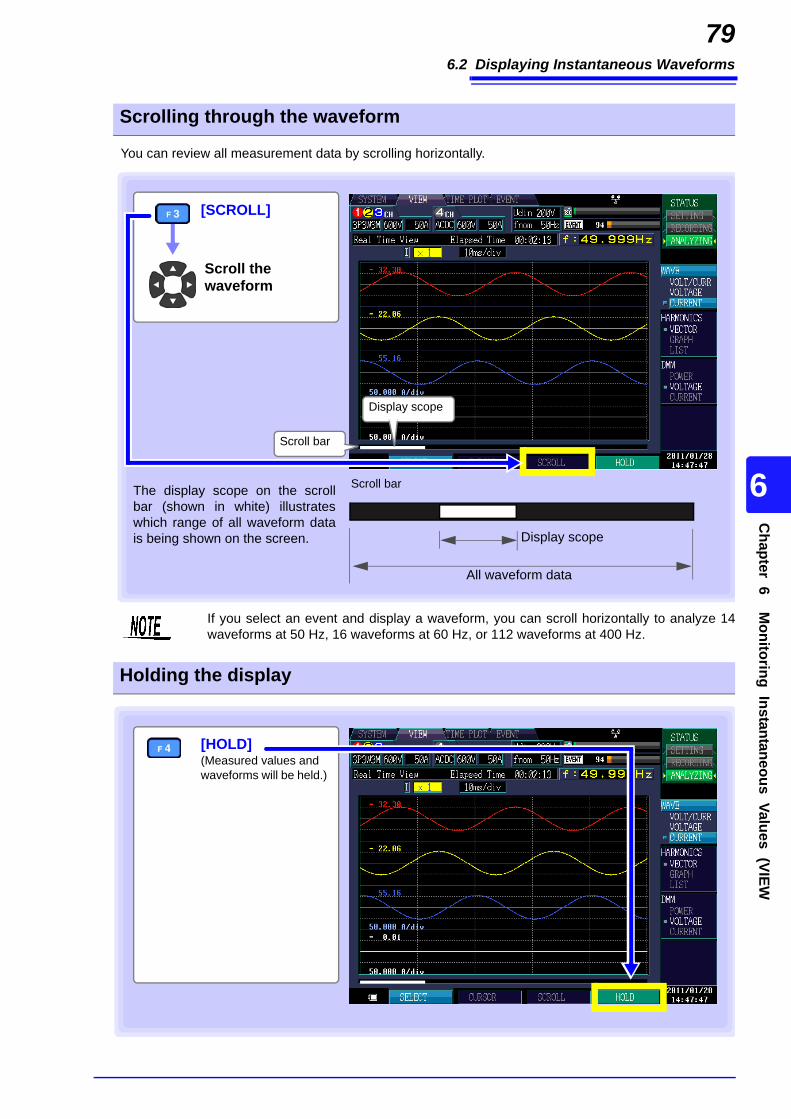
6.2 Displaying Instantaneous Waveforms
79C
hapter 6 Monitoring Instantaneous Values (VIEW
6
You can review all measurement data by scrolling horizontally.
Scrolling through the waveform
[SCROLL]
Scroll the waveform
Scroll bar
Scroll bar
Display scope
All waveform data
The display scope on the scrollbar (shown in white) illustrateswhich range of all waveform datais being shown on the screen.
Display scope
If you select an event and display a waveform, you can scroll horizontally to analyze 14waveforms at 50 Hz, 16 waveforms at 60 Hz, or 112 waveforms at 400 Hz.
Holding the display
[HOLD](Measured values and waveforms will be held.)
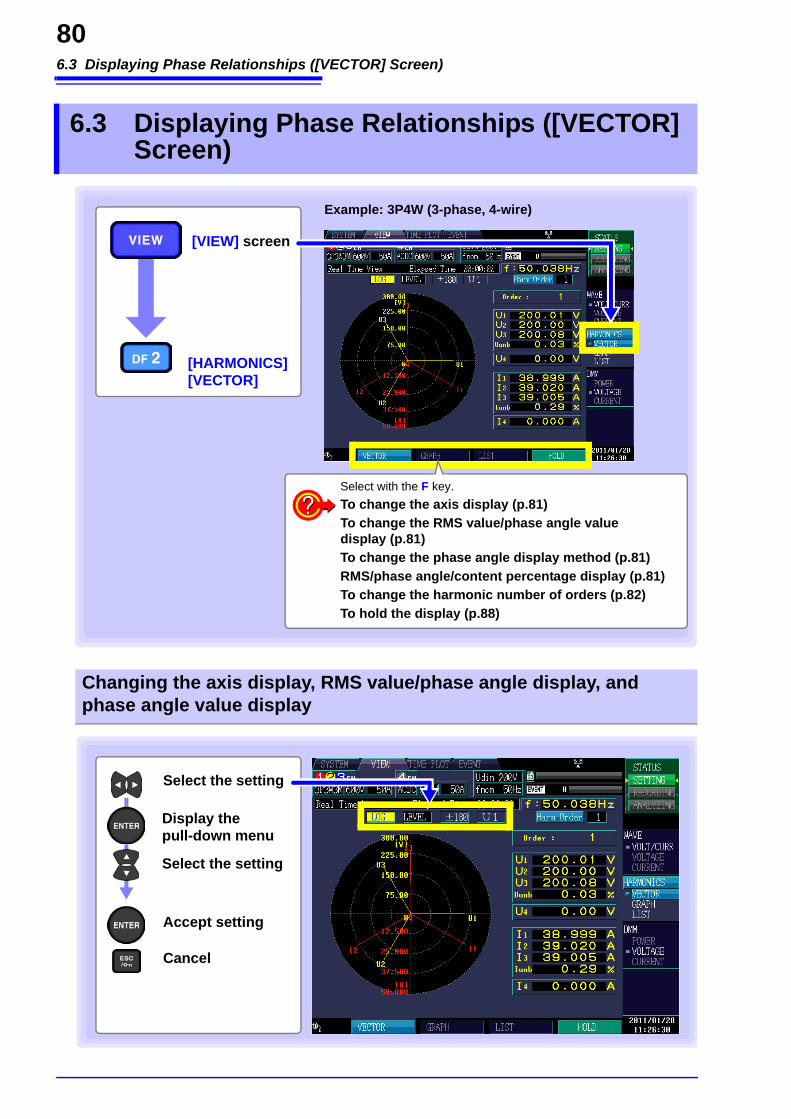
6.3 Displaying Phase Relationships ([VECTOR] Screen)
80
6.3 Displaying Phase Relationships ([VECTOR] Screen)
[VIEW] screen
[HARMONICS][VECTOR]
Select with the F key.To change the axis display (p.81)To change the RMS value/phase angle value display (p.81)To change the phase angle display method (p.81)RMS/phase angle/content percentage display (p.81)To change the harmonic number of orders (p.82)To hold the display (p.88)
Example: 3P4W (3-phase, 4-wire)
Changing the axis display, RMS value/phase angle display, and phase angle value display
Display the pull-down menu
Select the setting
Accept setting
Cancel
Select the setting
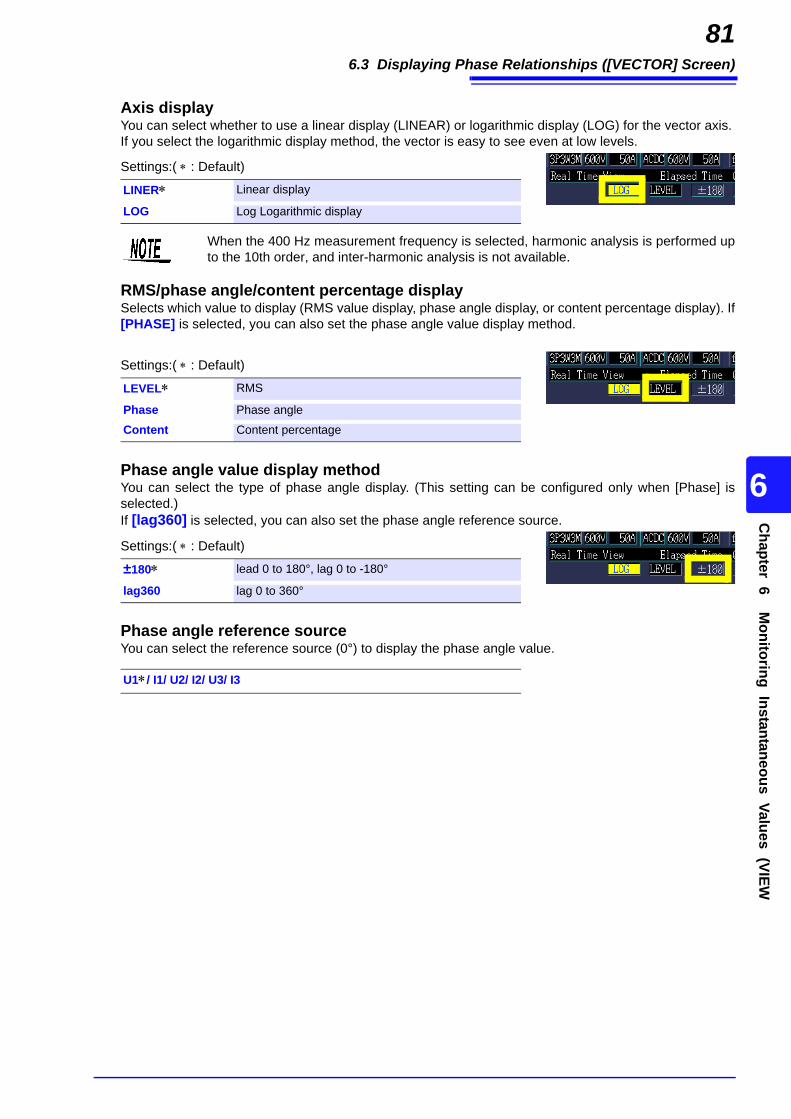
6.3 Displaying Phase Relationships ([VECTOR] Screen)
81C
hapter 6 Monitoring Instantaneous Values (VIEW
6
Axis displayYou can select whether to use a linear display (LINEAR) or logarithmic display (LOG) for the vector axis.If you select the logarithmic display method, the vector is easy to see even at low levels.
RMS/phase angle/content percentage displaySelects which value to display (RMS value display, phase angle display, or content percentage display). If[PHASE] is selected, you can also set the phase angle value display method.
Phase angle value display methodYou can select the type of phase angle display. (This setting can be configured only when [Phase] isselected.)If [lag360] is selected, you can also set the phase angle reference source.
Phase angle reference sourceYou can select the reference source (0°) to display the phase angle value.
Settings:( : Default)
LINER Linear display
LOG Log Logarithmic display
When the 400 Hz measurement frequency is selected, harmonic analysis is performed upto the 10th order, and inter-harmonic analysis is not available.
Settings:( : Default)
LEVEL RMS
Phase Phase angle
Content Content percentage
Settings:( : Default)
±180 lead 0 to 180°, lag 0 to -180°
lag360 lag 0 to 360°
U1/ I1/ U2/ I2/ U3/ I3

6.3 Displaying Phase Relationships ([VECTOR] Screen)
82
You can select what value to display.When you change the number of orders, the values change along with the vector.In this case, the voltage and current unbalance factors remain the same as the values calculated usingthe fundamental wave (1st order).
Changing the harmonic number of orders
Display the pull-down menu
Change the number of order(Up to the 50th order can be set)Accept setting
Cancel
[Harm Order]
The harmonic number of orderscan also be changed without usingthe pull-down menu by pressing theup and down cursor keys.
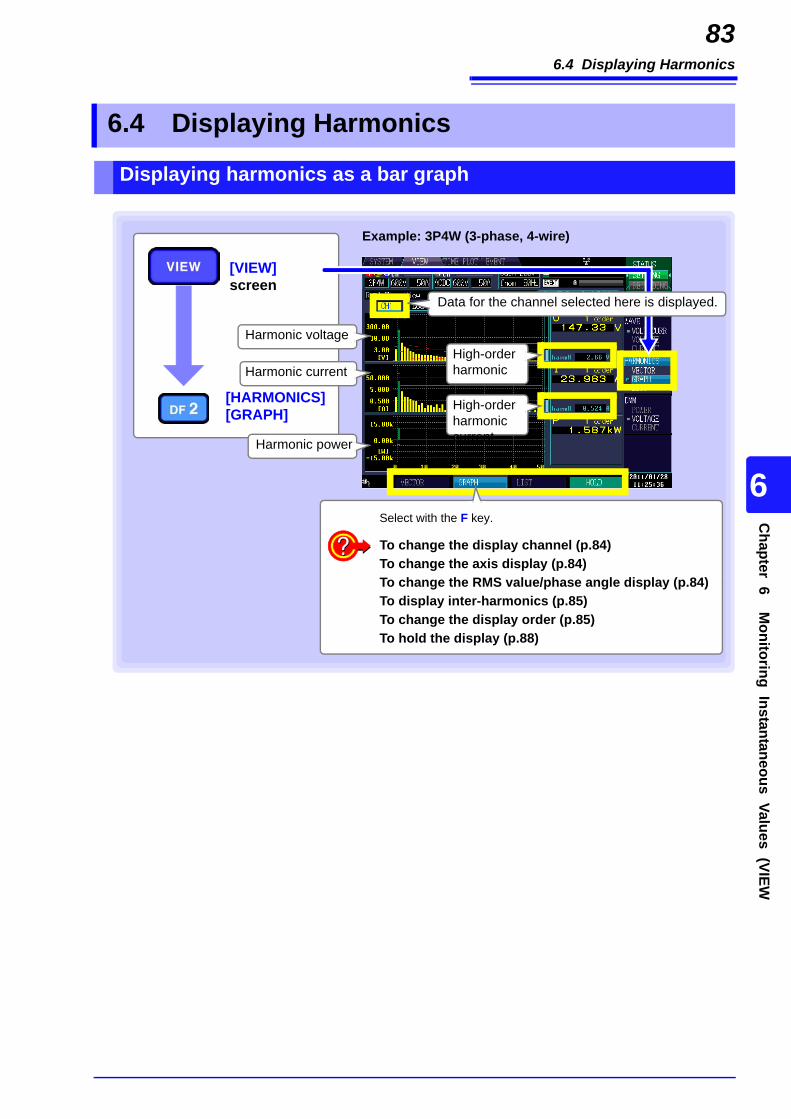
6.4 Displaying Harmonics
83C
hapter 6 Monitoring Instantaneous Values (VIEW
6
6.4 Displaying Harmonics
Displaying harmonics as a bar graph
[VIEW]screen
[HARMONICS][GRAPH]
Select with the F key.
To change the display channel (p.84)To change the axis display (p.84)To change the RMS value/phase angle display (p.84)To display inter-harmonics (p.85)To change the display order (p.85)To hold the display (p.88)
Example: 3P4W (3-phase, 4-wire)
Harmonic voltage
Harmonic current
Harmonic power
Data for the channel selected here is displayed.
High-order harmonic
High-order harmonic current

6.4 Displaying Harmonics
84
Displayed channel
Axis displayIf you select the logarithmic display method, the vector iseasy to see even at low levels.
RMS/phase angle/content percentage displaySelect the harmonic bar graph display (RMS value display, phase angle display, or content percentage). The harmonic power phase angle indicates the harmonic voltage-current phase difference.
In the level display, the high-order harmonic component bar graph and measured value (harmH) are dis-played next to the U and I bar graphs.
Changing the display channel, axis display, RMS/phase angle dis-play, and inter-harmonics
Settings:( : Default)
CH1/ CH2/ CH3/ CH4/sum
Display the pull-down menu
Select the setting
Accept setting
Cancel
Select the setting
When the 400 Hz measurement frequency is selected, harmonicanalysis is performed up to the 10th order, and inter-harmonic analysisis not available.
Settings:( : Default)
LINER Linear display
LOG Log Logarithmic display
Settings:( : Default)
LEVEL RMS
Phase Phase angle
Content Content percentage

6.4 Displaying Harmonics
85C
hapter 6 Monitoring Instantaneous Values (VIEW
6
Inter-harmonics
The setting can also be changed without using the pull-down menu bypressing the up and down cursor keys.
When the inter-harmonics display is enabled(iharmON), the screen changes as shown tothe right.
Turquoise: inter-harmonics components
The selected order number becomes green on the bar graph.If you change the order number, the values change along with the bar graph.You can also change the displayed order without displaying the pull-down menu by using the up anddown cursor keys.
Settings:( : Default)
iharmOFF, iharmON
Changing the Displayed Order
Display the pull-down menu
Change the number of order(Up to the 50th order can be set)
Accept setting
Cancel
[Harm Order]

6.4 Displaying Harmonics
86
The 1st to 50th harmonic orders and 0.5 to 49.5 inter-harmonicorders are displayed in a list for the selected item.
Displaying harmonics as a list
[VIEW]screen
[HARMONICS][LIST]
To change the displayed channels (p.84)To change the displayed items (p.84)To change the RMS value/phase angle display(p.84)To display inter-harmonics (p.85)
Example: 3P3W3M Wiring
When the 400 Hz measurement frequency is selected, harmonic analysis is performed upto the 10th order, and inter-harmonic analysis is not available.
Changing the display channels, items, RMS value, phase angle, inter-harmonics
Display the pull-down menu
Select the setting
Accept setting
Cancel
Select the setting
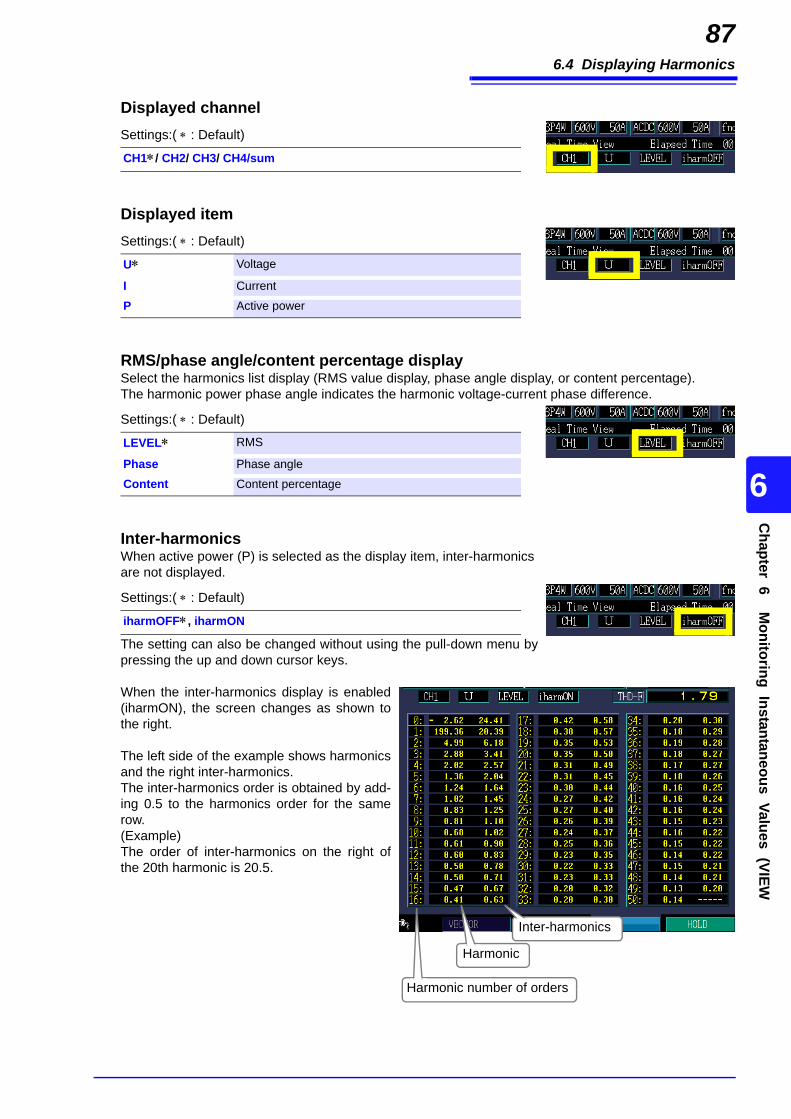
6.4 Displaying Harmonics
87C
hapter 6 Monitoring Instantaneous Values (VIEW
6
Displayed channel
Displayed item
RMS/phase angle/content percentage displaySelect the harmonics list display (RMS value display, phase angle display, or content percentage). The harmonic power phase angle indicates the harmonic voltage-current phase difference.
Inter-harmonicsWhen active power (P) is selected as the display item, inter-harmonicsare not displayed.
The setting can also be changed without using the pull-down menu bypressing the up and down cursor keys.
When the inter-harmonics display is enabled(iharmON), the screen changes as shown tothe right.
The left side of the example shows harmonicsand the right inter-harmonics.The inter-harmonics order is obtained by add-ing 0.5 to the harmonics order for the samerow.(Example)The order of inter-harmonics on the right ofthe 20th harmonic is 20.5.
Settings:( : Default)
CH1/ CH2/ CH3/ CH4/sum
Settings:( : Default)
U Voltage
I Current
P Active power
Settings:( : Default)
LEVEL RMS
Phase Phase angle
Content Content percentage
Settings:( : Default)
iharmOFF, iharmON
Harmonic number of orders
Harmonic
Inter-harmonics
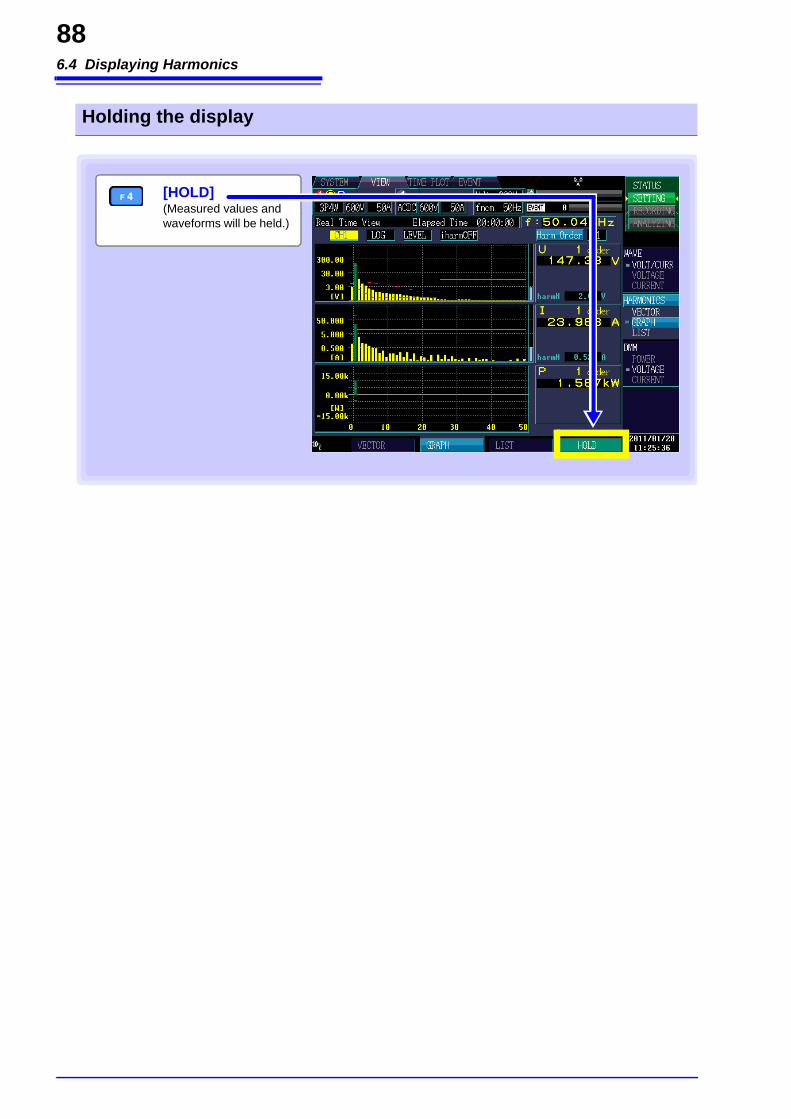
6.4 Displaying Harmonics
88
Holding the display
[HOLD](Measured values and waveforms will be held.)
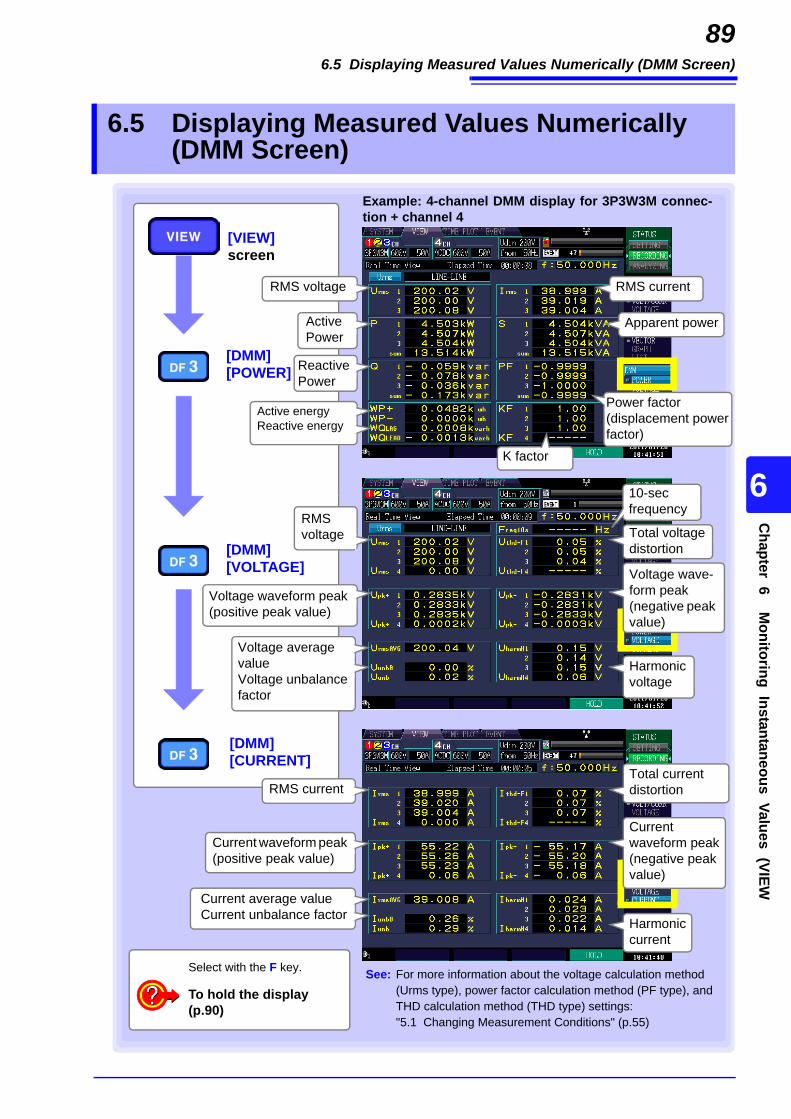
6.5 Displaying Measured Values Numerically (DMM Screen)
89C
hapter 6 Monitoring Instantaneous Values (VIEW
6
6.5 Displaying Measured Values Numerically (DMM Screen)
Select with the F key.
To hold the display(p.90)
[VIEW]screen
[DMM][VOLTAGE]
Example: 4-channel DMM display for 3P3W3M connec-tion + channel 4
RMS voltage
[DMM][POWER]
[DMM][CURRENT]
Active Power
RMS current
Apparent power
Reactive Power
Power factor (displacement power factor)
RMS voltage Total voltage
distortion
Voltage waveform peak (positive peak value)
Voltage wave-form peak (negative peak value)
Voltage average valueVoltage unbalance factor
RMS currentTotal current distortion
Current waveform peak (positive peak value)
Current waveform peak (negative peak value)
Current average valueCurrent unbalance factor
See: For more information about the voltage calculation method (Urms type), power factor calculation method (PF type), and THD calculation method (THD type) settings:"5.1 Changing Measurement Conditions" (p.55)
K factor
Active energyReactive energy
Harmonic voltage
Harmonic current
10-sec frequency
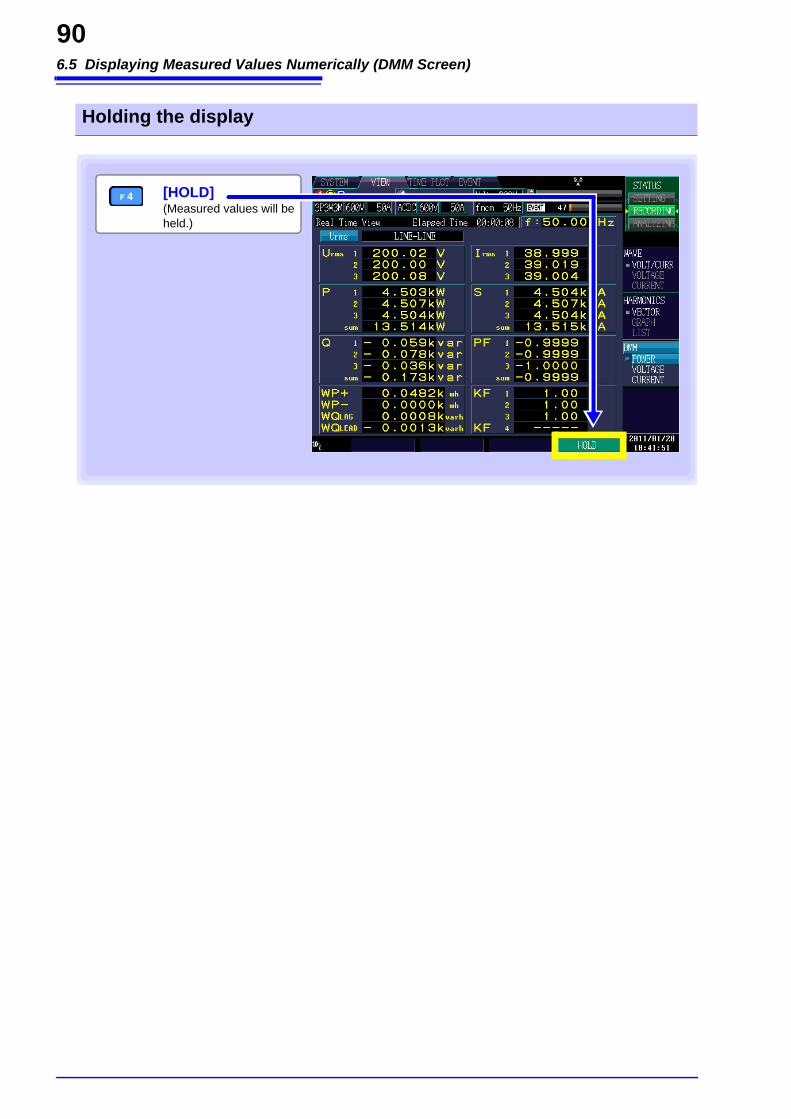
6.5 Displaying Measured Values Numerically (DMM Screen)
90
Holding the display
[HOLD](Measured values will be held.)
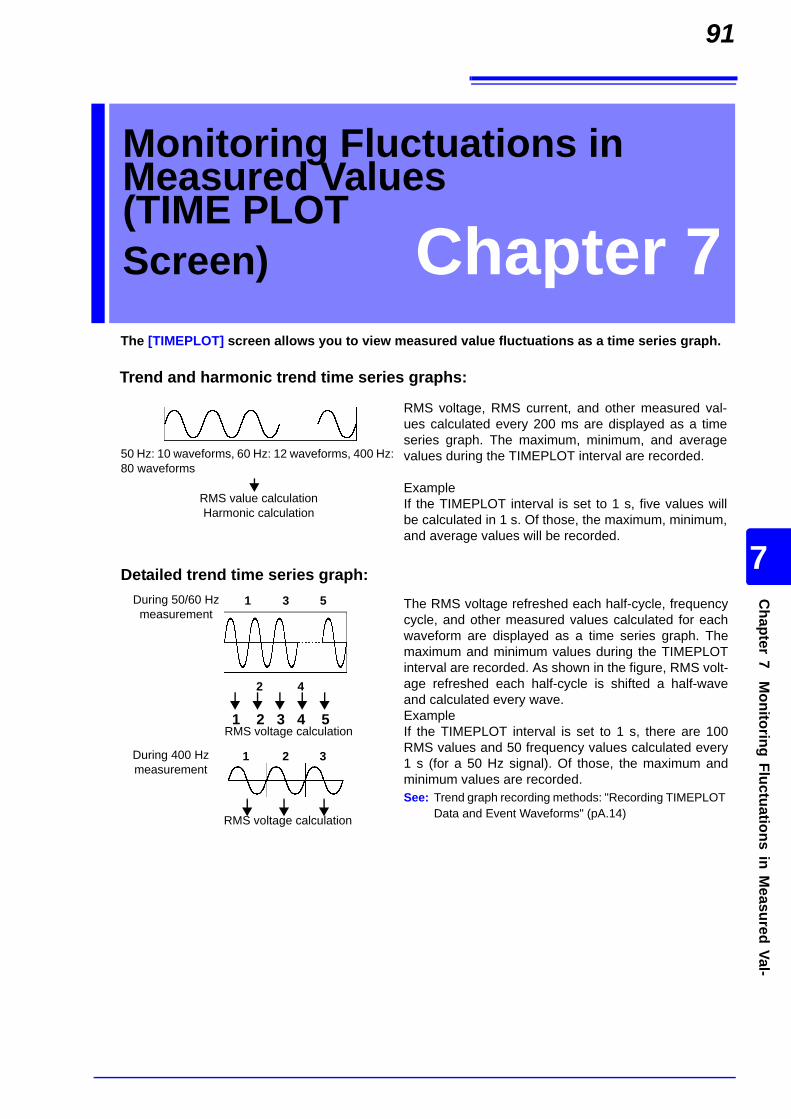
91C
hapter 7 Monitoring Fluctuations in M
easured Val-
7
The [TIMEPLOT] screen allows you to view measured value fluctuations as a time series graph.
Monitoring Fluctuations in Measured Values (TIME PLOT Screen) Chapter 7
RMS voltage, RMS current, and other measured val-ues calculated every 200 ms are displayed as a timeseries graph. The maximum, minimum, and averagevalues during the TIMEPLOT interval are recorded.
ExampleIf the TIMEPLOT interval is set to 1 s, five values willbe calculated in 1 s. Of those, the maximum, minimum,and average values will be recorded.
1 3 5
50 Hz: 10 waveforms, 60 Hz: 12 waveforms, 400 Hz: 80 waveforms
RMS value calculationHarmonic calculation
RMS voltage calculation
Trend and harmonic trend time series graphs:
Detailed trend time series graph:
The RMS voltage refreshed each half-cycle, frequencycycle, and other measured values calculated for eachwaveform are displayed as a time series graph. Themaximum and minimum values during the TIMEPLOTinterval are recorded. As shown in the figure, RMS volt-age refreshed each half-cycle is shifted a half-waveand calculated every wave.ExampleIf the TIMEPLOT interval is set to 1 s, there are 100RMS values and 50 frequency values calculated every1 s (for a 50 Hz signal). Of those, the maximum andminimum values are recorded. See: Trend graph recording methods: "Recording TIMEPLOT
Data and Event Waveforms" (pA.14)
1 2 3 4 5
2 4
During 50/60 Hz measurement
During 400 Hz measurement
1 2 3
RMS voltage calculation
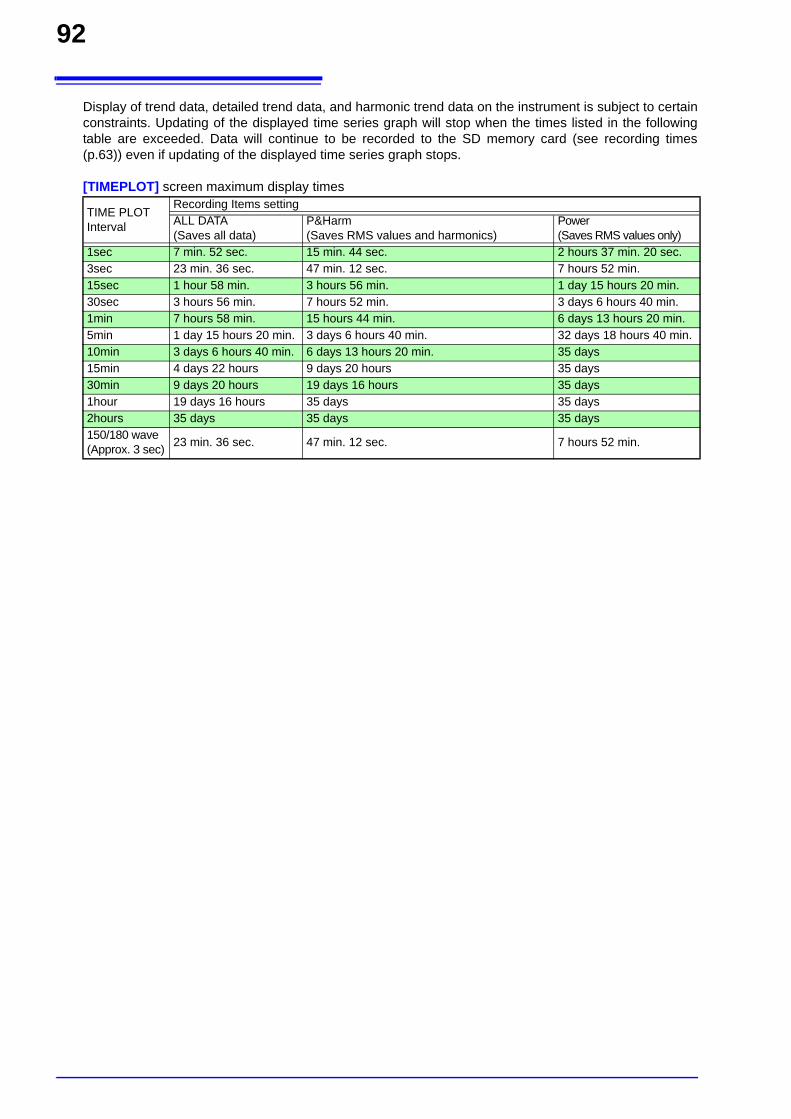
92
Display of trend data, detailed trend data, and harmonic trend data on the instrument is subject to certainconstraints. Updating of the displayed time series graph will stop when the times listed in the followingtable are exceeded. Data will continue to be recorded to the SD memory card (see recording times(p.63)) even if updating of the displayed time series graph stops.
[TIMEPLOT] screen maximum display times
TIME PLOT Interval
Recording Items settingALL DATA(Saves all data)
P&Harm (Saves RMS values and harmonics)
Power (Saves RMS values only)
1sec 7 min. 52 sec. 15 min. 44 sec. 2 hours 37 min. 20 sec.3sec 23 min. 36 sec. 47 min. 12 sec. 7 hours 52 min. 15sec 1 hour 58 min. 3 hours 56 min. 1 day 15 hours 20 min. 30sec 3 hours 56 min. 7 hours 52 min. 3 days 6 hours 40 min. 1min 7 hours 58 min. 15 hours 44 min. 6 days 13 hours 20 min. 5min 1 day 15 hours 20 min. 3 days 6 hours 40 min. 32 days 18 hours 40 min. 10min 3 days 6 hours 40 min. 6 days 13 hours 20 min. 35 days 15min 4 days 22 hours 9 days 20 hours 35 days 30min 9 days 20 hours 19 days 16 hours 35 days 1hour 19 days 16 hours 35 days 35 days 2hours 35 days 35 days 35 days 150/180 wave (Approx. 3 sec) 23 min. 36 sec. 47 min. 12 sec. 7 hours 52 min.
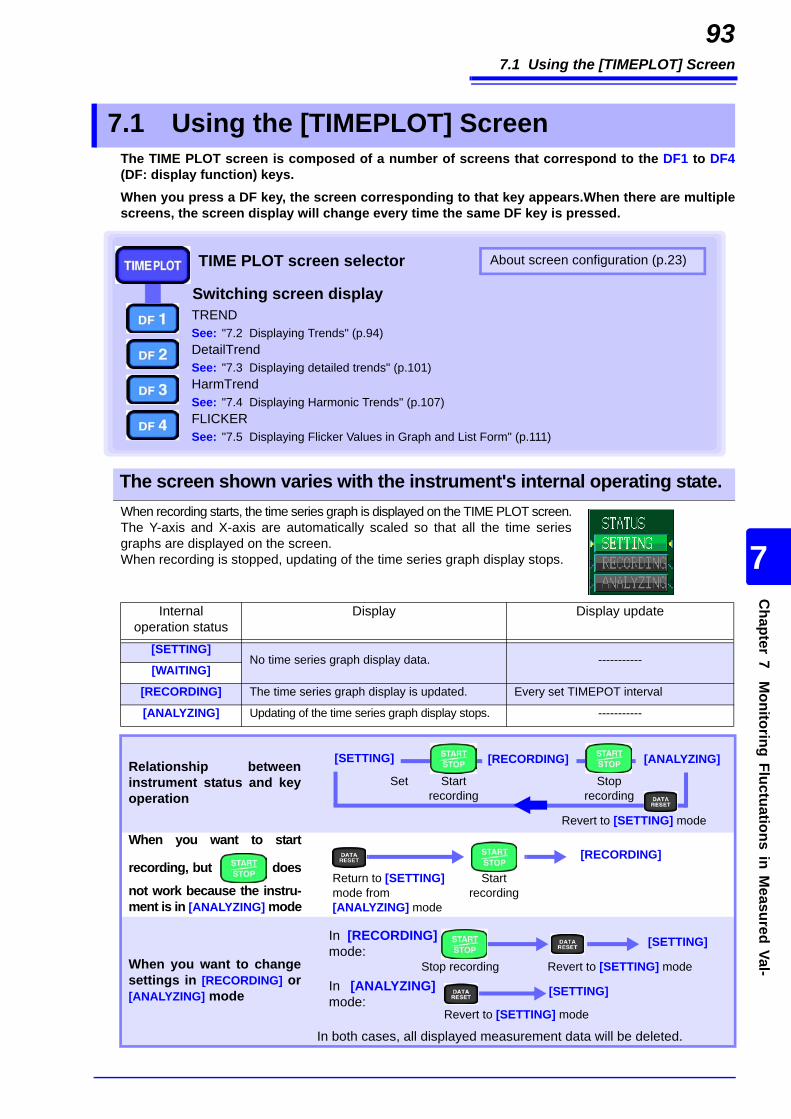
7.1 Using the [TIMEPLOT] Screen
93C
hapter 7 Monitoring Fluctuations in M
easured Val-
7
The TIME PLOT screen is composed of a number of screens that correspond to the DF1 to DF4(DF: display function) keys.When you press a DF key, the screen corresponding to that key appears.When there are multiplescreens, the screen display will change every time the same DF key is pressed.
When recording starts, the time series graph is displayed on the TIME PLOT screen.The Y-axis and X-axis are automatically scaled so that all the time seriesgraphs are displayed on the screen.When recording is stopped, updating of the time series graph display stops.
7.1 Using the [TIMEPLOT] Screen
TIME PLOT screen selector
TRENDSee: "7.2 Displaying Trends" (p.94)DetailTrendSee: "7.3 Displaying detailed trends" (p.101)HarmTrendSee: "7.4 Displaying Harmonic Trends" (p.107)FLICKERSee: "7.5 Displaying Flicker Values in Graph and List Form" (p.111)
Switching screen display
About screen configuration (p.23)
The screen shown varies with the instrument's internal operating state.
Internal operation status
Display Display update
[SETTING]No time series graph display data. -----------
[WAITING]
[RECORDING] The time series graph display is updated. Every set TIMEPOT interval
[ANALYZING] Updating of the time series graph display stops. -----------
Relationship betweeninstrument status and keyoperation
When you want to start
recording, but does
not work because the instru-ment is in [ANALYZING] mode
When you want to changesettings in [RECORDING] or[ANALYZING] mode
In both cases, all displayed measurement data will be deleted.
[SETTING] [RECORDING] [ANALYZING]
Start recording
Stop recording
Revert to [SETTING] mode
Set
Return to [SETTING] mode from [ANALYZING] mode
[RECORDING]
Start recording
[SETTING]In [RECORDING]mode:
Stop recording Revert to [SETTING] mode
[SETTING]In [ANALYZING]mode:
Revert to [SETTING] mode
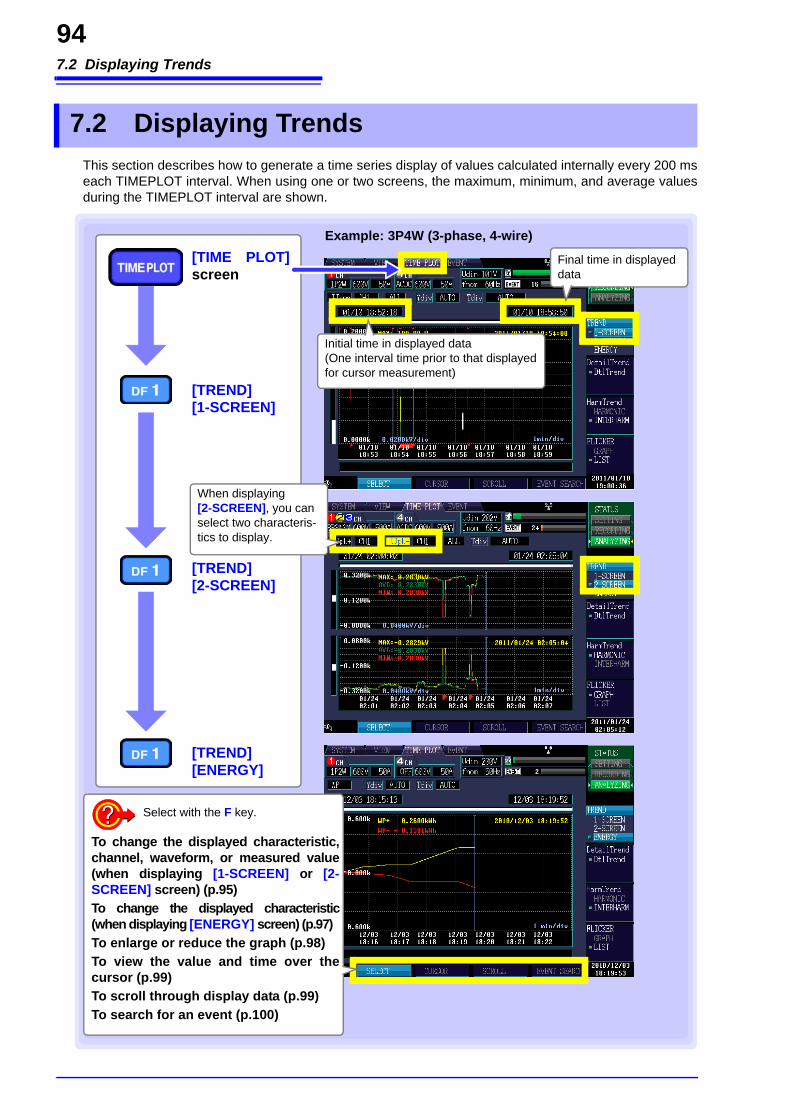
7.2 Displaying Trends
94
This section describes how to generate a time series display of values calculated internally every 200 mseach TIMEPLOT interval. When using one or two screens, the maximum, minimum, and average valuesduring the TIMEPLOT interval are shown.
7.2 Displaying Trends
Select with the F key.
To change the displayed characteristic,channel, waveform, or measured value(when displaying [1-SCREEN] or [2-SCREEN] screen) (p.95)To change the displayed characteristic(when displaying [ENERGY] screen) (p.97)To enlarge or reduce the graph (p.98)To view the value and time over thecursor (p.99)To scroll through display data (p.99)To search for an event (p.100)
[TIME PLOT]screen
[TREND][1-SCREEN]
Example: 3P4W (3-phase, 4-wire)
When displaying [2-SCREEN], you can select two characteris-tics to display.
[TREND][2-SCREEN]
[TREND][ENERGY]
Initial time in displayed data (One interval time prior to that displayed for cursor measurement)
Final time in displayed data
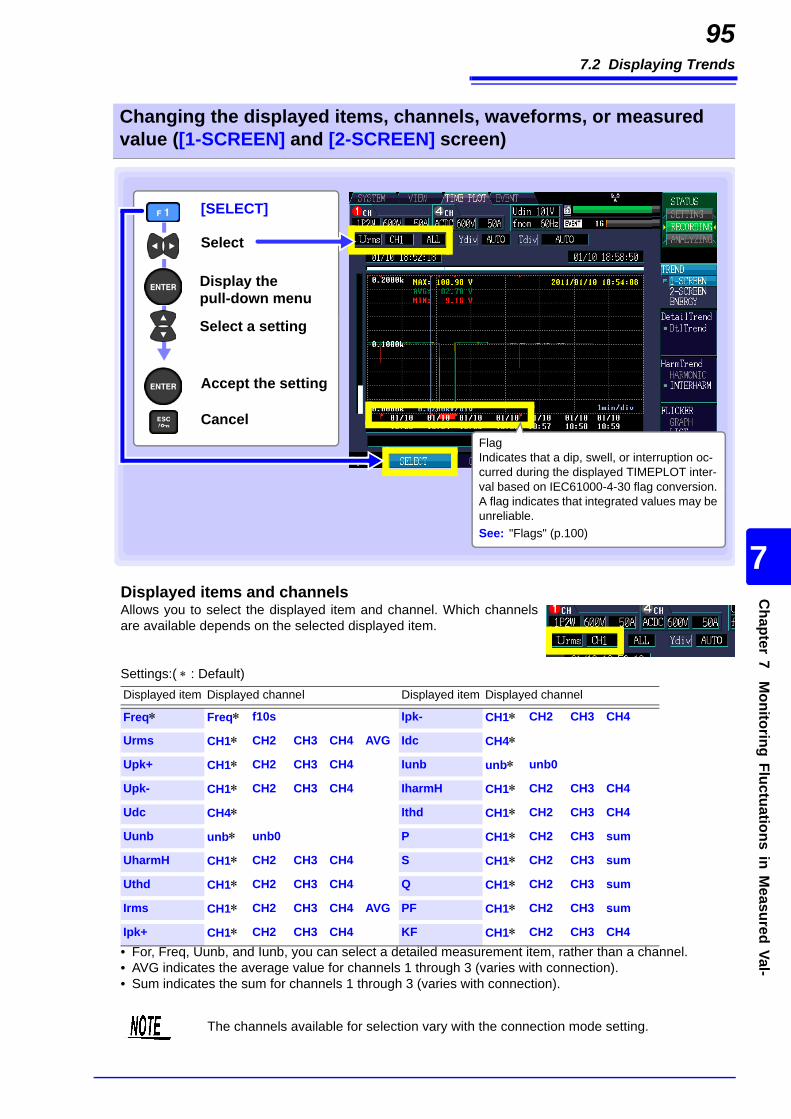
7.2 Displaying Trends
95C
hapter 7 Monitoring Fluctuations in M
easured Val-
7
Displayed items and channelsAllows you to select the displayed item and channel. Which channelsare available depends on the selected displayed item.• For, Freq, Uunb, and Iunb, you can select a detailed measurement item, rather than a channel.• AVG indicates the average value for channels 1 through 3 (varies with connection).• Sum indicates the sum for channels 1 through 3 (varies with connection).
Changing the displayed items, channels, waveforms, or measured value ([1-SCREEN] and [2-SCREEN] screen)
Display the pull-down menu
Select a setting
Accept the setting
Cancel
[SELECT]
Select
FlagIndicates that a dip, swell, or interruption oc-curred during the displayed TIMEPLOT inter-val based on IEC61000-4-30 flag conversion. A flag indicates that integrated values may be unreliable. See: "Flags" (p.100)
Settings:( : Default)Displayed item Displayed channel Displayed item Displayed channel
Freq Freq f10s Ipk- CH1 CH2 CH3 CH4
Urms CH1 CH2 CH3 CH4 AVG Idc CH4Upk+ CH1 CH2 CH3 CH4 Iunb unb unb0
Upk- CH1 CH2 CH3 CH4 IharmH CH1 CH2 CH3 CH4
Udc CH4 Ithd CH1 CH2 CH3 CH4
Uunb unb unb0 P CH1 CH2 CH3 sum
UharmH CH1 CH2 CH3 CH4 S CH1 CH2 CH3 sum
Uthd CH1 CH2 CH3 CH4 Q CH1 CH2 CH3 sum
Irms CH1 CH2 CH3 CH4 AVG PF CH1 CH2 CH3 sum
Ipk+ CH1 CH2 CH3 CH4 KF CH1 CH2 CH3 CH4
The channels available for selection vary with the connection mode setting.

7.2 Displaying Trends
96
Displayed waveform and measured value
Notation meaningSymbol Measurement Items Symbol Measurement Items Symbol Measurement Items
Freq Frequency Irms RMS current Uunb0Uunb
Voltage zero-phase unbalance factor currentNegative-phase unbalance factor
f10s Frequency 10 sec(Freq10s) IrmsAVG Average RMS current
(when avg is selected)Iunb0Iunb
Current zero-phase unbalance factor currentNegative-phase unbalance factor
Upk+Upk-
Voltage waveform peak+Voltage waveform peak-
Idc Current DC UharmHHigh-order harmonic voltage com-ponent
Ipk+Ipk-
Current waveform peak+Current waveform peak-
P Active power IharmHHigh-order harmonic current com-ponent
Urms RMS voltage (phase/line) S Apparent power Uthd-F
Uthd-RTotal harmonic voltage distortion factor
UrmsAVG Average RMS voltage (when avg is selected) Q Reactive power Ithd-F
Ithd-RTotal harmonic current distortion factor
Udc Voltage DC PF Power factor KF K factor
Settings:( : Default)
MAX Displays the maximum value during the TIME-PLOT interval.
MIN Displays the minimum value during the TIME-PLOT interval.
AVG Displays the average value during the TIME-PLOT interval.
ALL Displays the maximum, minimum, and averagevalues during the TIMEPLOT interval.
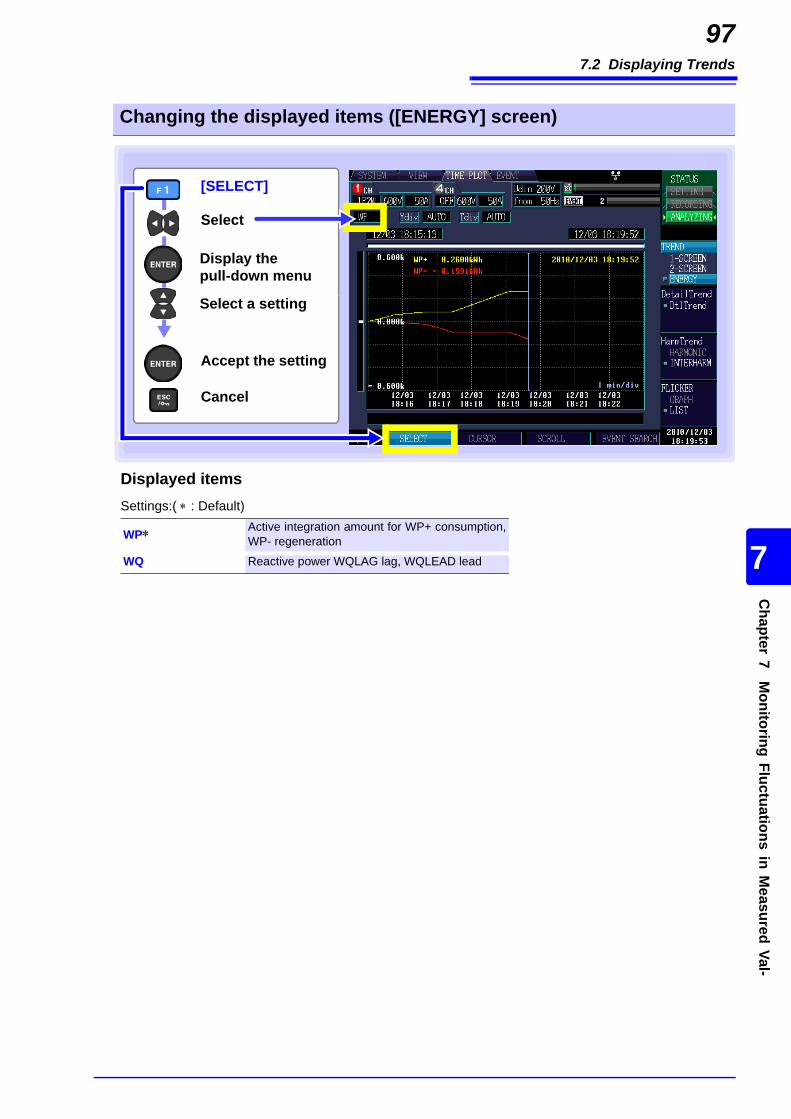
7.2 Displaying Trends
97C
hapter 7 Monitoring Fluctuations in M
easured Val-
7
Displayed items
Changing the displayed items ([ENERGY] screen)
Settings:( : Default)
WP Active integration amount for WP+ consumption,WP- regeneration
WQ Reactive power WQLAG lag, WQLEAD lead
Display the pull-down menu
Select a setting
Accept the setting
Cancel
[SELECT]
Select

7.2 Displaying Trends
98
Y-axis scale (Ydiv)To reduce the graph, decrease the scale.To enlarge the graph, increase the scale.
X-axis scale (Tdiv)Selects the X-axis scale.
When recording, use AUTO.
Enlarging or reducing the graph (changing the X- and Y-axis scale)
Display the pull-down menu
Select a setting
Accept the setting
Cancel
[SELECT]
Select a setting
Settings:( : Default)
AUTO, x1, x2, x5, x10, x25, x50
Settings:
AUTO, From 1min/div

7.2 Displaying Trends
99C
hapter 7 Monitoring Fluctuations in M
easured Val-
7
You can read the value above the cursor and the time on the time series graph
During recording, the X- and Y-axis are automatically scaled so that the full time series graph fits on thescreen. Once recording has stopped and the X- and Y-axis scale has been changed so that the waveforms donot fit on the screen, you can scroll through the time series graph by moving left, right, up, and down.
Viewing the value and time over the cursor (Cursor measurements)
[CURSOR]
Move the verticalcursor left andright to read thedisplay value.
Cursor
Cursor time
Cursor valueWhen using one or two screens:MAX (maximum value), AVG (average value), MIN (minimum value)
When using the [ENERGY] screen:WP+ (consumption), WP- (regen-eration), LAG (lag), LEAD (lead)
Scrolling through display data
[SCROLL]
Scroll through thegraph
Scroll bar
Scroll bar
Display scope
Display scope
• The display scope on the scroll bar (shown inwhite) illustrates which range of all measurementdata is being shown on the screen.
• The cursor on the scroll bar shows where the cur-sor is located relative to all measurement data.
Scroll bar
Display scope
All measurement data
Cursor position
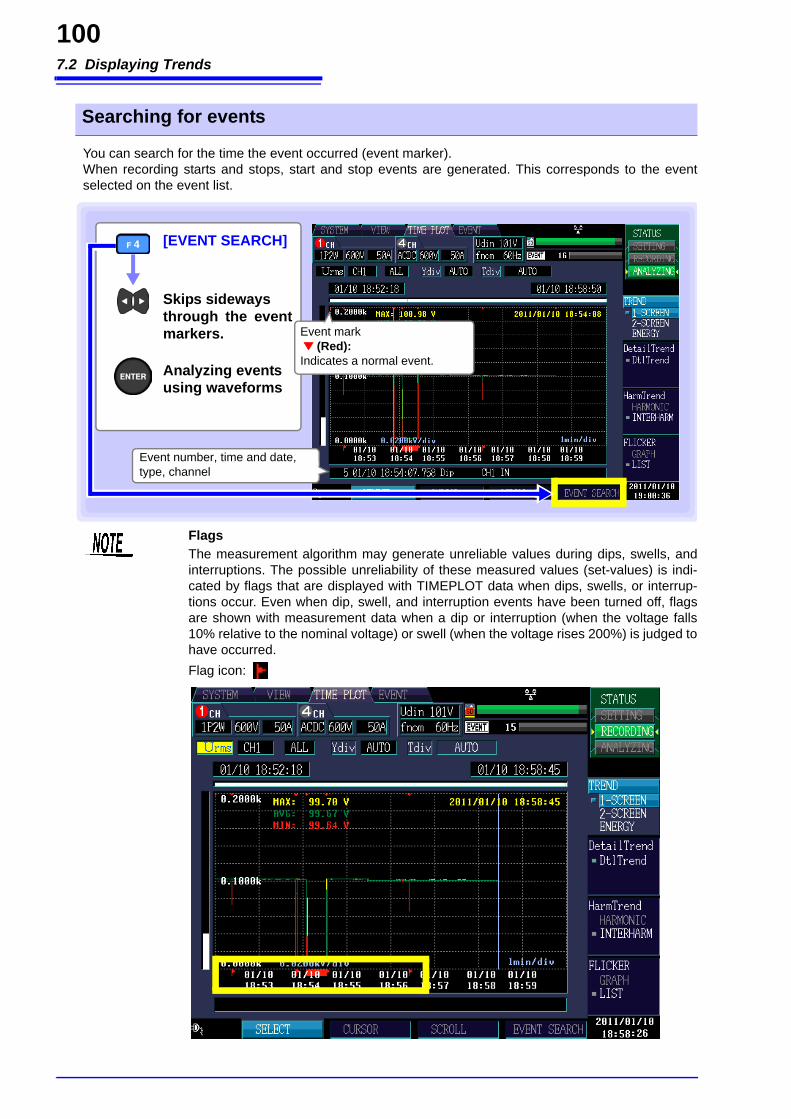
7.2 Displaying Trends
100
You can search for the time the event occurred (event marker).When recording starts and stops, start and stop events are generated. This corresponds to the eventselected on the event list.
Searching for events
[EVENT SEARCH]
Skips sideways through the eventmarkers. Event mark
(Red):Indicates a normal event.
Event number, time and date, type, channel
Analyzing events using waveforms
FlagsThe measurement algorithm may generate unreliable values during dips, swells, andinterruptions. The possible unreliability of these measured values (set-values) is indi-cated by flags that are displayed with TIMEPLOT data when dips, swells, or interrup-tions occur. Even when dip, swell, and interruption events have been turned off, flagsare shown with measurement data when a dip or interruption (when the voltage falls10% relative to the nominal voltage) or swell (when the voltage rises 200%) is judged tohave occurred.Flag icon:
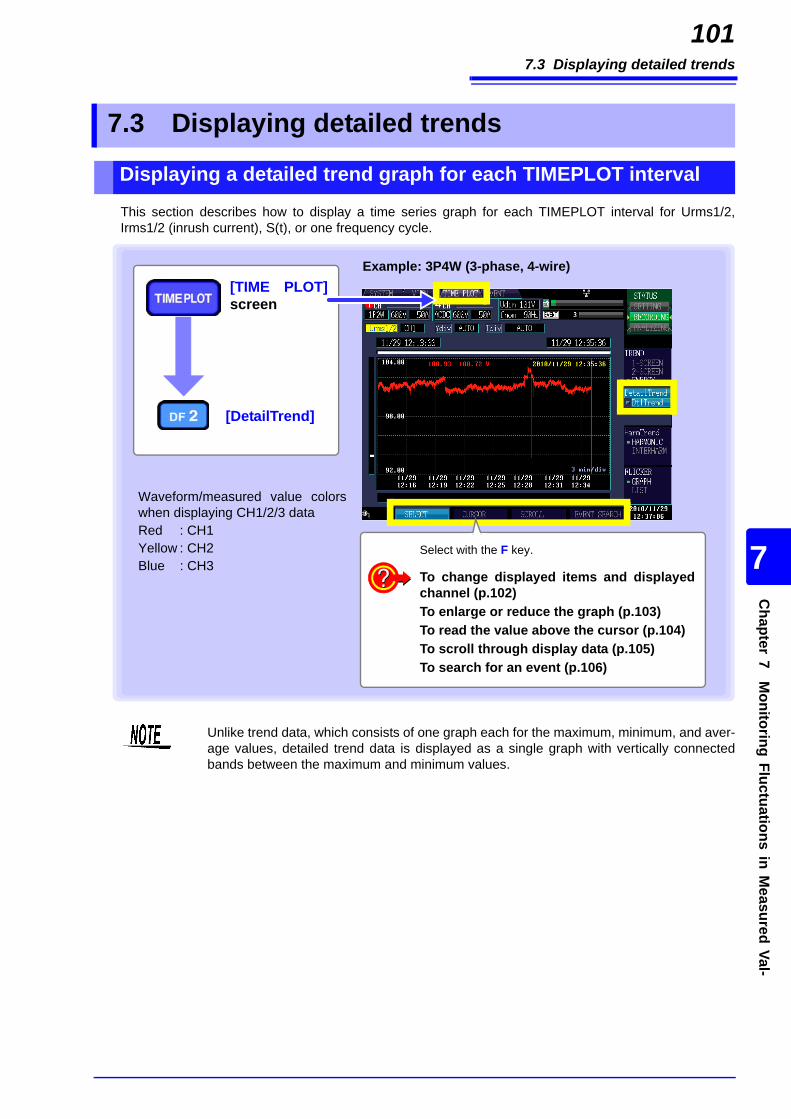
7.3 Displaying detailed trends
101C
hapter 7 Monitoring Fluctuations in M
easured Val-
7
This section describes how to display a time series graph for each TIMEPLOT interval for Urms1/2,Irms1/2 (inrush current), S(t), or one frequency cycle.
7.3 Displaying detailed trends
Displaying a detailed trend graph for each TIMEPLOT interval
[DetailTrend]
Example: 3P4W (3-phase, 4-wire)
Select with the F key.
To change displayed items and displayedchannel (p.102)To enlarge or reduce the graph (p.103)To read the value above the cursor (p.104)To scroll through display data (p.105)To search for an event (p.106)
Waveform/measured value colorswhen displaying CH1/2/3 dataRed : CH1Yellow : CH2Blue : CH3
[TIME PLOT]screen
Unlike trend data, which consists of one graph each for the maximum, minimum, and aver-age values, detailed trend data is displayed as a single graph with vertically connectedbands between the maximum and minimum values.
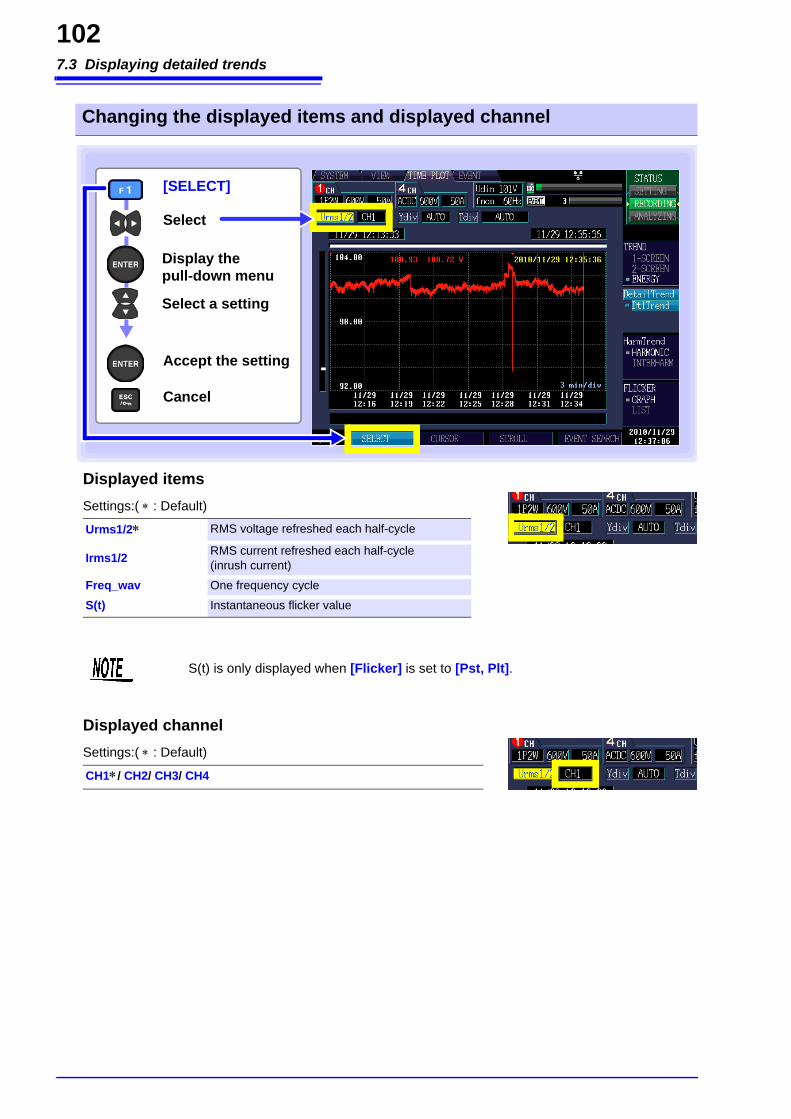
7.3 Displaying detailed trends
102
Displayed items
Displayed channel
Changing the displayed items and displayed channel
Settings:( : Default)
Urms1/2 RMS voltage refreshed each half-cycle
Irms1/2 RMS current refreshed each half-cycle(inrush current)
Freq_wav One frequency cycle
S(t) Instantaneous flicker value
Display the pull-down menu
Select a setting
Accept the setting
Cancel
[SELECT]
Select
S(t) is only displayed when [Flicker] is set to [Pst, Plt].
Settings:( : Default)
CH1/ CH2/ CH3/ CH4

7.3 Displaying detailed trends
103C
hapter 7 Monitoring Fluctuations in M
easured Val-
7
Y-axis scale (Ydiv)When you want to reduce the graph, make the scale smaller.When you want to enlarge the graph, make the scale larger.X-axis scale (Tdiv)When you want to reduce the graph, make the scale smaller.When you want to enlarge the graph, make the scale larger.
Enlarging or reducing the graph (changing the X- and Y-axis scale)
Display the pull-down menu
Select a setting
Accept the setting
Cancel
[SELECT]
Select a setting
Settings:( : Default)
AUTO, x1, x2, x5, x10, x25, x50
Settings:( : Default)
AUTO, From 1min/div (varies with TIME PLOT interval)
AUTO scaling is used during recording. This cannot be changed.
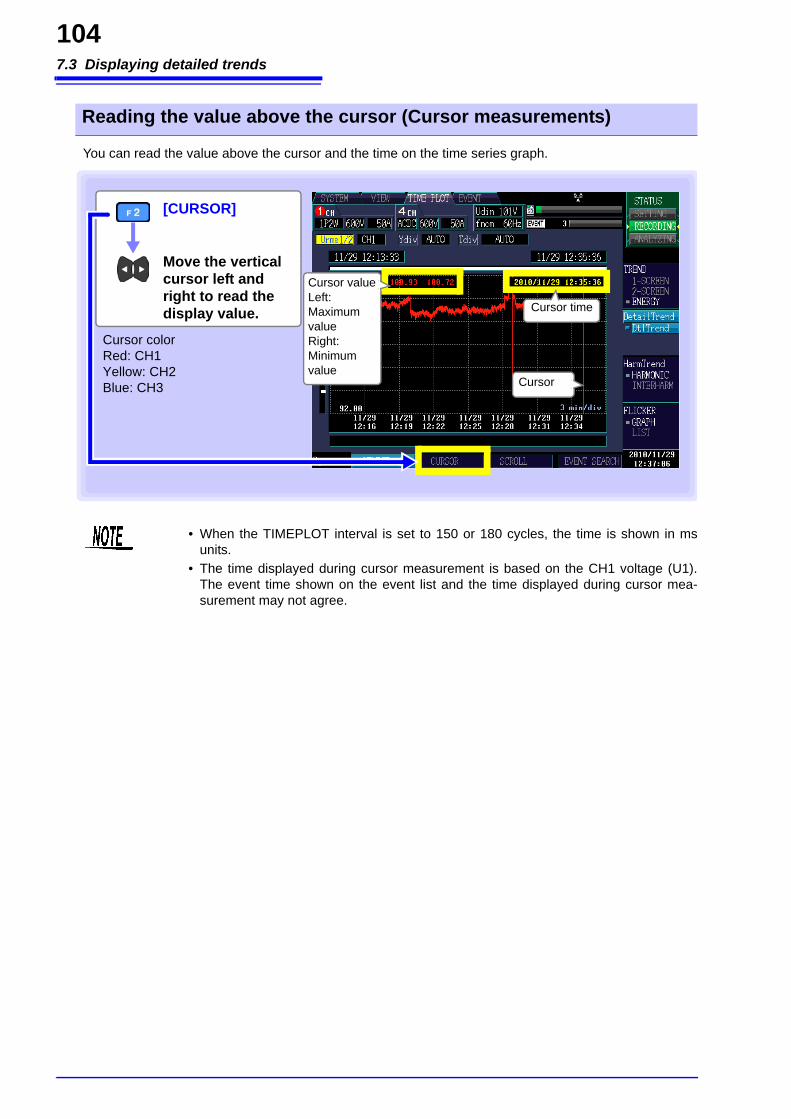
7.3 Displaying detailed trends
104
You can read the value above the cursor and the time on the time series graph.
Reading the value above the cursor (Cursor measurements)
[CURSOR]
Move the vertical cursor left and right to read the display value.
Cursor colorRed: CH1Yellow: CH2Blue: CH3 Cursor
Cursor time
Cursor valueLeft: Maximum valueRight:Minimum value
• When the TIMEPLOT interval is set to 150 or 180 cycles, the time is shown in msunits.
• The time displayed during cursor measurement is based on the CH1 voltage (U1).The event time shown on the event list and the time displayed during cursor mea-surement may not agree.
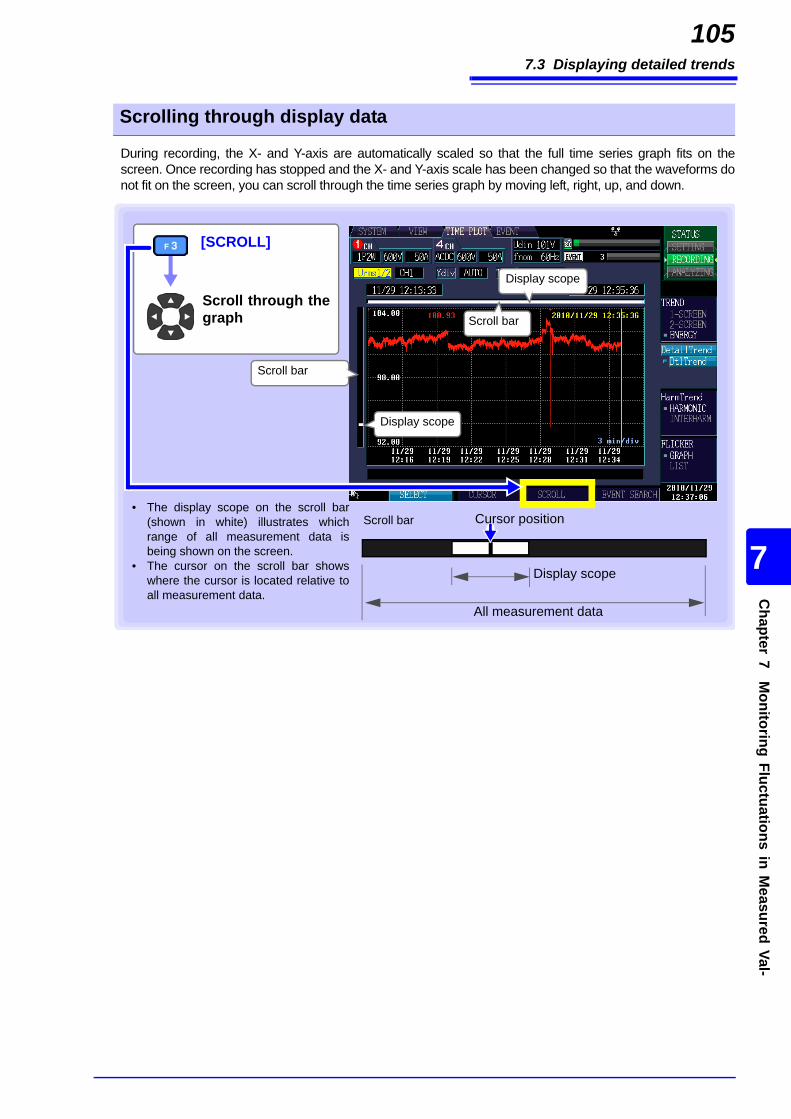
7.3 Displaying detailed trends
105C
hapter 7 Monitoring Fluctuations in M
easured Val-
7
During recording, the X- and Y-axis are automatically scaled so that the full time series graph fits on thescreen. Once recording has stopped and the X- and Y-axis scale has been changed so that the waveforms donot fit on the screen, you can scroll through the time series graph by moving left, right, up, and down.
Scrolling through display data
[SCROLL]
Scroll through thegraph
Scroll bar
Scroll bar
Scroll bar
Display scope
All measurement data
Display scope
Display scope
Cursor position• The display scope on the scroll bar
(shown in white) illustrates whichrange of all measurement data isbeing shown on the screen.
• The cursor on the scroll bar showswhere the cursor is located relative toall measurement data.
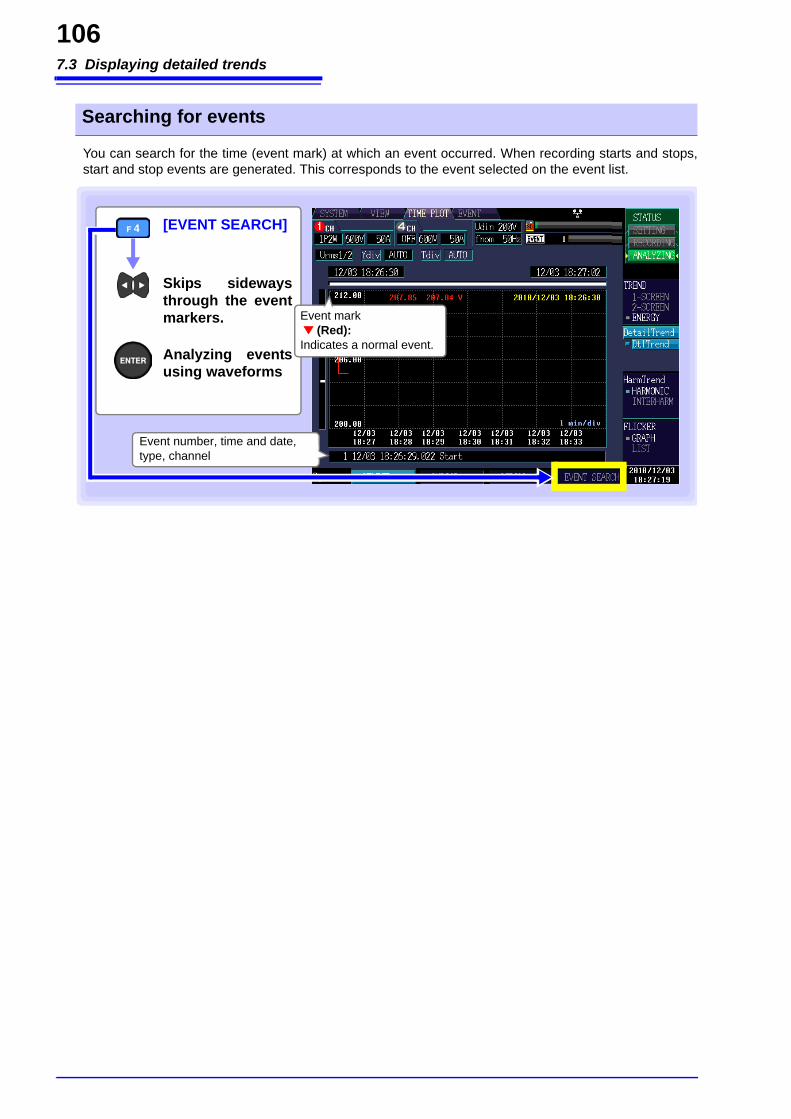
7.3 Displaying detailed trends
106
You can search for the time (event mark) at which an event occurred. When recording starts and stops,start and stop events are generated. This corresponds to the event selected on the event list.
Searching for events
[EVENT SEARCH]
Skips sidewaysthrough the eventmarkers. Event mark
(Red):Indicates a normal event.
Event number, time and date, type, channel
Analyzing eventsusing waveforms

7.4 Displaying Harmonic Trends
107C
hapter 7 Monitoring Fluctuations in M
easured Val-
7
This section descries how to select six orders and display their harmonic time series graphs. The maxi-mum, minimum, or average value during the TIMEPLOT interval can be displayed.
7.4 Displaying Harmonic Trends
[TIME PLOT]screen
[HarmTrend][HARMONIC]
Example: 3P4W (3-phase, 4-wire)
Select with the F key.
To change displayed items/waveform/measurementvalue (p.108)To enlarge or reduce the graph (p.108)To change display number of order (p.108)To read the value above the cursor (p.109)To scroll waveform data (p.110)To search for an event (p.110)
[HarmTrend][INTERHARM]
• When [Power] is selected under the [Recording Items] settings (see SYSTEM-DF1[RECORD] (p.62)), harmonic trends (the harmonic trend graph and inter-harmonic trendgraphs) will not be displayed. Additionally, inter-harmonic trend data will not be displayedif [P&Harm] is selected.
• During 400 Hz measurement, harmonic analysis is performed up to the 10th order, andinter-harmonic analysis is not available.
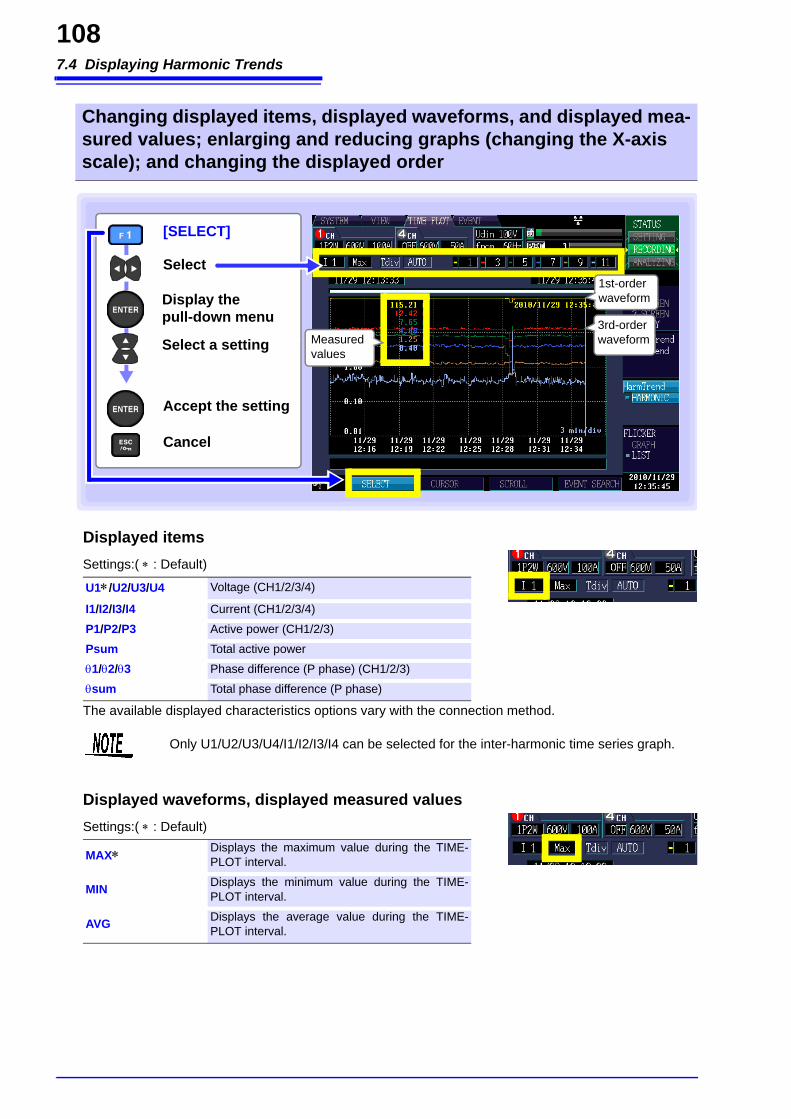
7.4 Displaying Harmonic Trends
108
Displayed items
The available displayed characteristics options vary with the connection method.
Displayed waveforms, displayed measured values
Changing displayed items, displayed waveforms, and displayed mea-sured values; enlarging and reducing graphs (changing the X-axis scale); and changing the displayed order
Display the pull-down menu
Select a setting
Accept the setting
Cancel
[SELECT]
Select
Measured values
1st-order waveform
3rd-order waveform
Settings:( : Default)
U1/U2/U3/U4 Voltage (CH1/2/3/4)
I1/I2/I3/I4 Current (CH1/2/3/4)
P1/P2/P3 Active power (CH1/2/3)
Psum Total active power
1/2/3 Phase difference (P phase) (CH1/2/3)
sum Total phase difference (P phase)
Only U1/U2/U3/U4/I1/I2/I3/I4 can be selected for the inter-harmonic time series graph.
Settings:( : Default)
MAX Displays the maximum value during the TIME-PLOT interval.
MIN Displays the minimum value during the TIME-PLOT interval.
AVG Displays the average value during the TIME-PLOT interval.
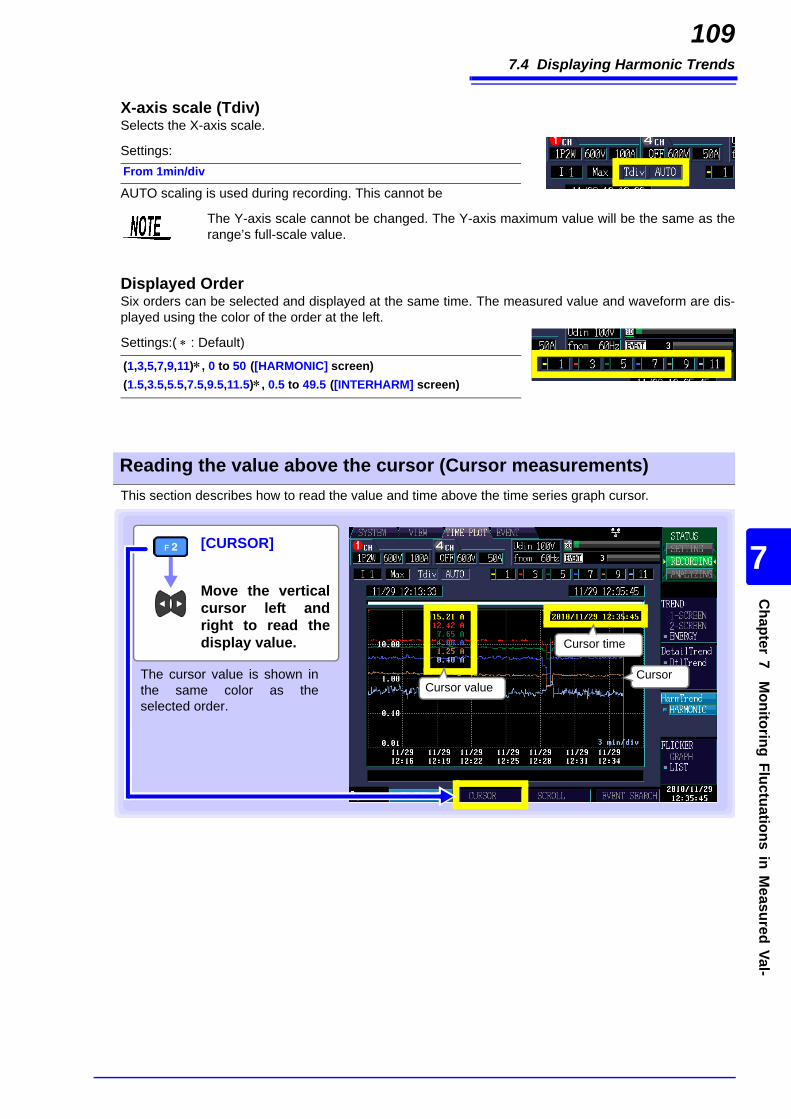
7.4 Displaying Harmonic Trends
109C
hapter 7 Monitoring Fluctuations in M
easured Val-
7
X-axis scale (Tdiv)Selects the X-axis scale.
AUTO scaling is used during recording. This cannot be
Displayed OrderSix orders can be selected and displayed at the same time. The measured value and waveform are dis-played using the color of the order at the left.
This section describes how to read the value and time above the time series graph cursor.
Settings:From 1min/div
The Y-axis scale cannot be changed. The Y-axis maximum value will be the same as therange’s full-scale value.
Settings:( : Default)
(1,3,5,7,9,11), 0 to 50 ([HARMONIC] screen)(1.5,3.5,5.5,7.5,9.5,11.5), 0.5 to 49.5 ([INTERHARM] screen)
Reading the value above the cursor (Cursor measurements)
[CURSOR]
Move the verticalcursor left andright to read thedisplay value.
The cursor value is shown inthe same color as theselected order.
Cursor
Cursor time
Cursor value

7.4 Displaying Harmonic Trends
110
During recording, the X-axis is automatically scaled so that the full time series graph fits on the screen.Once recording has stopped and the X-axis scale has been changed so that the waveforms do not fit onthe screen, you can scroll through the time series graph by moving left and right.
You can search for the time the event occurred (event marker).The start time and stop time event markers are always displayed.Synchronization is achieved with an event selected from the event list.
Scrolling through waveforms
[SCROLL]
Scroll through thegraph Scroll bar
Scroll bar
Display scope
All measurement data
• The white band on the scroll bar indicatesthe range of measured values that can bedisplayed. When this band does not includethe cursor position, the cursor and cursorvalue are not displayed.
• The cursor on the scroll bar shows wherethe cursor is located relative to all measure-ment data.
Display scope
Cursor position
Searching for events
[EVENT SEARCH]
Skips sidewaysthrough the eventmarkers. Event mark
(Red):Indicates a normal event.Analyzing events
using waveforms
Event number, time and date, type, channel
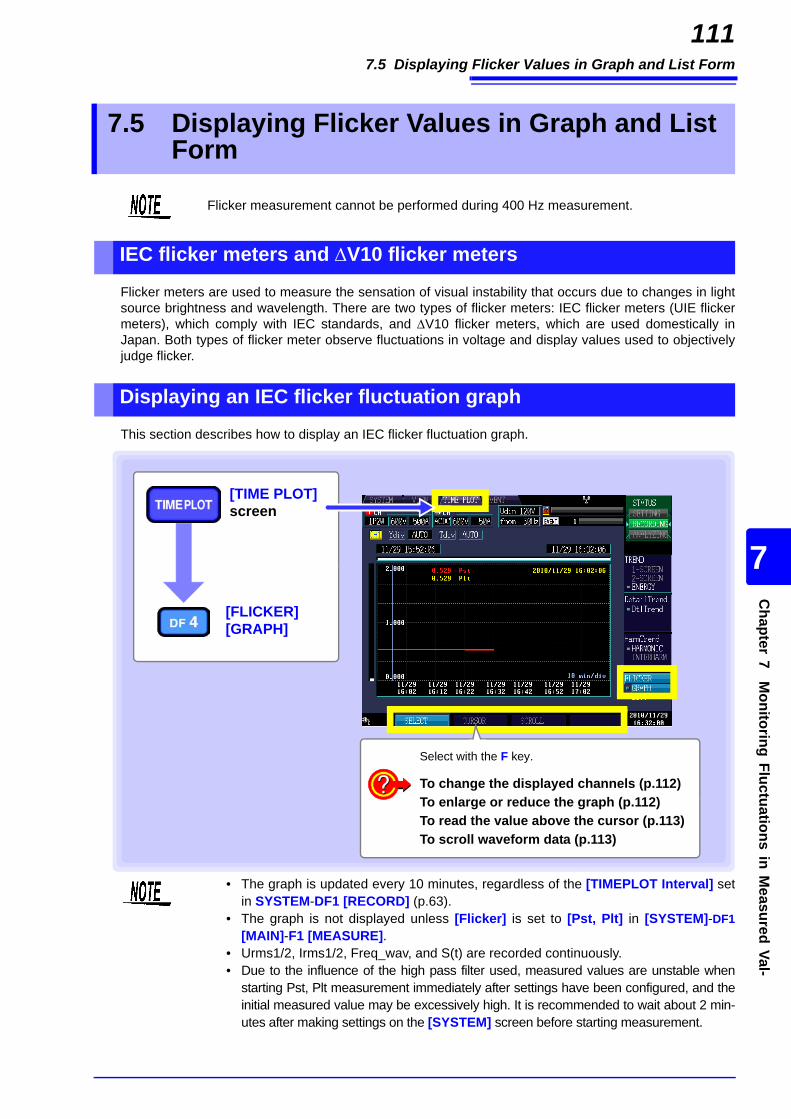
7.5 Displaying Flicker Values in Graph and List Form
111C
hapter 7 Monitoring Fluctuations in M
easured Val-
7
Flicker meters are used to measure the sensation of visual instability that occurs due to changes in lightsource brightness and wavelength. There are two types of flicker meters: IEC flicker meters (UIE flickermeters), which comply with IEC standards, and V10 flicker meters, which are used domestically inJapan. Both types of flicker meter observe fluctuations in voltage and display values used to objectivelyjudge flicker.
This section describes how to display an IEC flicker fluctuation graph.
7.5 Displaying Flicker Values in Graph and List Form
Flicker measurement cannot be performed during 400 Hz measurement.
IEC flicker meters and V10 flicker meters
Displaying an IEC flicker fluctuation graph
[TIME PLOT] screen
[FLICKER][GRAPH]
Select with the F key.
To change the displayed channels (p.112)To enlarge or reduce the graph (p.112)To read the value above the cursor (p.113)To scroll waveform data (p.113)
• The graph is updated every 10 minutes, regardless of the [TIMEPLOT Interval] setin SYSTEM-DF1 [RECORD] (p.63).
• The graph is not displayed unless [Flicker] is set to [Pst, Plt] in [SYSTEM]-DF1[MAIN]-F1 [MEASURE].
• Urms1/2, Irms1/2, Freq_wav, and S(t) are recorded continuously.• Due to the influence of the high pass filter used, measured values are unstable when
starting Pst, Plt measurement immediately after settings have been configured, and theinitial measured value may be excessively high. It is recommended to wait about 2 min-utes after making settings on the [SYSTEM] screen before starting measurement.
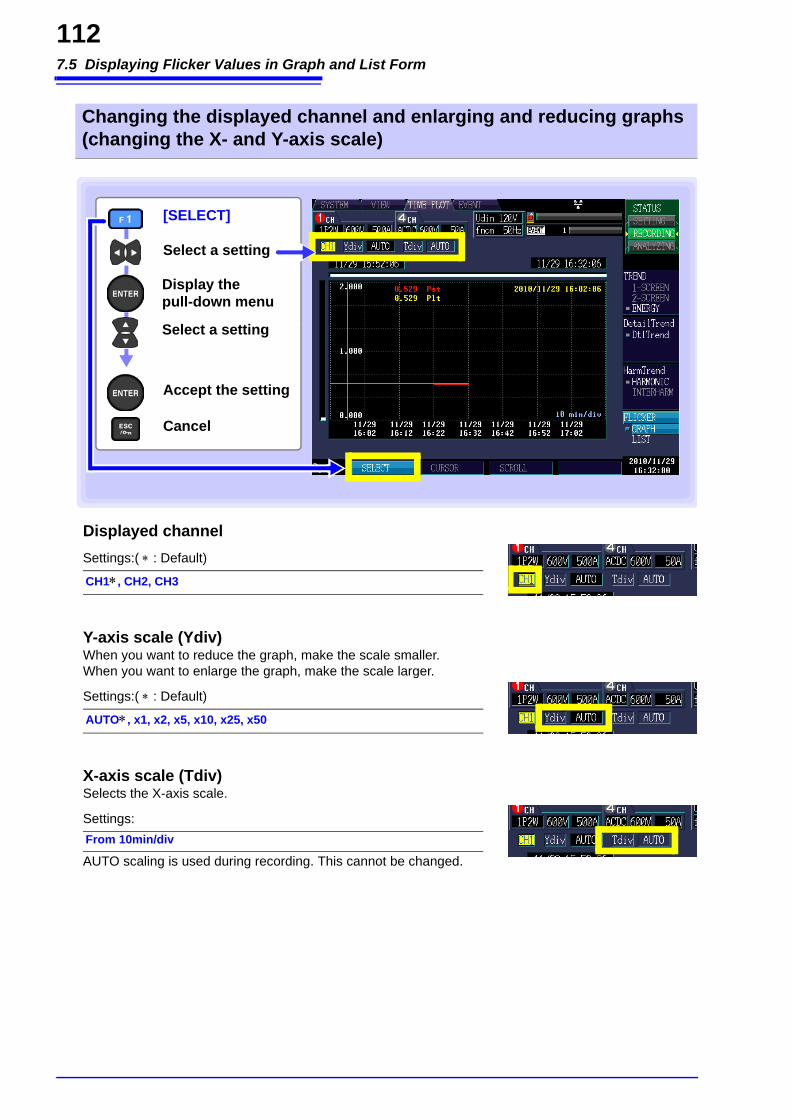
7.5 Displaying Flicker Values in Graph and List Form
112
Displayed channel
Y-axis scale (Ydiv)When you want to reduce the graph, make the scale smaller.When you want to enlarge the graph, make the scale larger.
X-axis scale (Tdiv)Selects the X-axis scale.
AUTO scaling is used during recording. This cannot be changed.
Changing the displayed channel and enlarging and reducing graphs (changing the X- and Y-axis scale)
Display the pull-down menu
Select a setting
Accept the setting
Cancel
[SELECT]
Select a setting
Settings:( : Default)
CH1, CH2, CH3
Settings:( : Default)
AUTO, x1, x2, x5, x10, x25, x50
Settings:From 10min/div
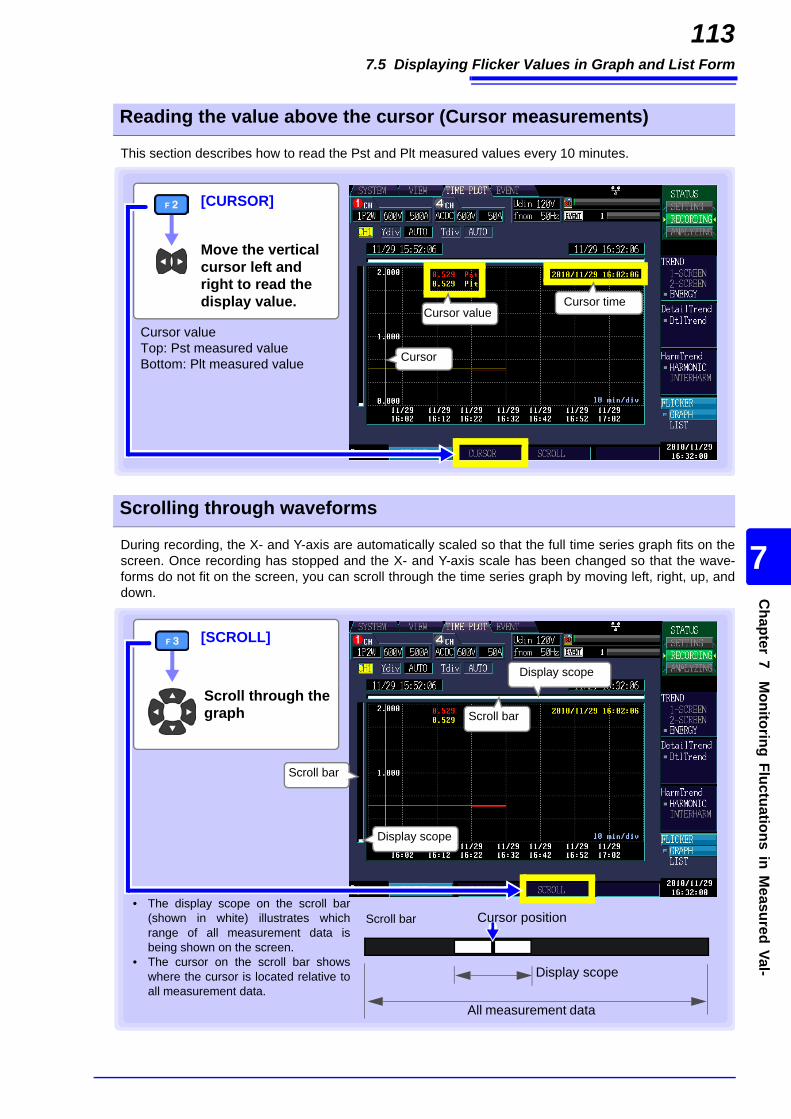
7.5 Displaying Flicker Values in Graph and List Form
113C
hapter 7 Monitoring Fluctuations in M
easured Val-
7
This section describes how to read the Pst and Plt measured values every 10 minutes.
During recording, the X- and Y-axis are automatically scaled so that the full time series graph fits on thescreen. Once recording has stopped and the X- and Y-axis scale has been changed so that the wave-forms do not fit on the screen, you can scroll through the time series graph by moving left, right, up, anddown.
Reading the value above the cursor (Cursor measurements)
[CURSOR]
Move the vertical cursor left and right to read the display value.
Cursor valueTop: Pst measured valueBottom: Plt measured value Cursor
Cursor timeCursor value
Scrolling through waveforms
[SCROLL]
Scroll through thegraph Scroll bar
Display scope
Scroll bar
Display scope
Scroll bar
Display scope
All measurement data
Cursor position• The display scope on the scroll bar
(shown in white) illustrates whichrange of all measurement data isbeing shown on the screen.
• The cursor on the scroll bar showswhere the cursor is located relative toall measurement data.
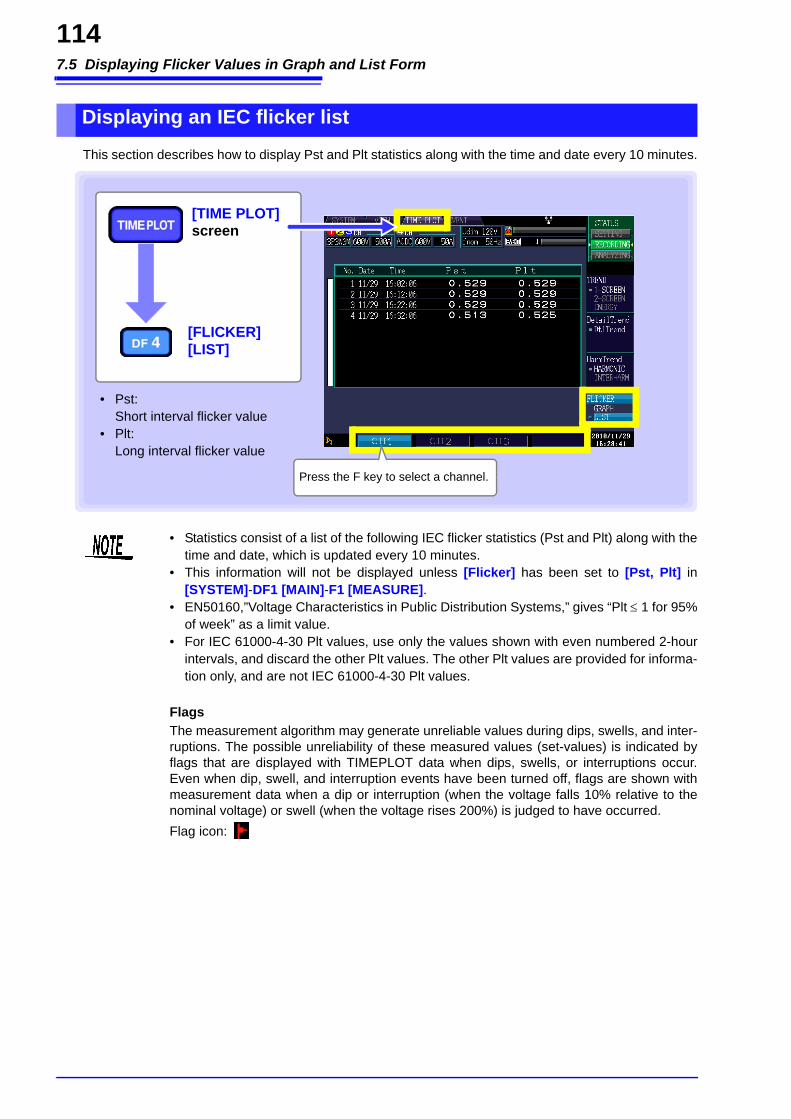
7.5 Displaying Flicker Values in Graph and List Form
114
This section describes how to display Pst and Plt statistics along with the time and date every 10 minutes.
Displaying an IEC flicker list
[TIME PLOT] screen
[FLICKER][LIST]
Press the F key to select a channel.
• Pst:Short interval flicker value
• Plt:Long interval flicker value
• Statistics consist of a list of the following IEC flicker statistics (Pst and Plt) along with thetime and date, which is updated every 10 minutes.
• This information will not be displayed unless [Flicker] has been set to [Pst, Plt] in[SYSTEM]-DF1 [MAIN]-F1 [MEASURE].
• EN50160,”Voltage Characteristics in Public Distribution Systems,” gives “Plt 1 for 95%of week” as a limit value.
• For IEC 61000-4-30 Plt values, use only the values shown with even numbered 2-hourintervals, and discard the other Plt values. The other Plt values are provided for informa-tion only, and are not IEC 61000-4-30 Plt values.
FlagsThe measurement algorithm may generate unreliable values during dips, swells, and inter-ruptions. The possible unreliability of these measured values (set-values) is indicated byflags that are displayed with TIMEPLOT data when dips, swells, or interruptions occur.Even when dip, swell, and interruption events have been turned off, flags are shown withmeasurement data when a dip or interruption (when the voltage falls 10% relative to thenominal voltage) or swell (when the voltage rises 200%) is judged to have occurred.Flag icon:

7.5 Displaying Flicker Values in Graph and List Form
115C
hapter 7 Monitoring Fluctuations in M
easured Val-
7
This section describes how to display a V10 flicker fluctuation graph.
V10 flicker reference voltage
In V10 flicker measurement, the reference voltage is automatically set internally using AGC (automaticgain control).
Once the fluctuating voltage value has stabilized, the reference voltage is automatically changed to thatvalue. Consequently, there is no need to switch supply voltage settings as with conventional V10 flickermeters. (Example)Fluctuating voltage: Stabilizes at 96 Vrms The reference voltage is automatically changed to 96 V rms.Fluctuating voltage: Stabilizes at 102 Vrms The reference voltage is automatically changed to 102 V rms.
Due to the influence of the high pass filter used in V10 flicker measurement, measured values areunstable when starting V10 measurement immediately after settings have been configured, and the firstand second V10 measured values may be excessively high. It is recommended to wait about 5 minutesafter making settings on the [SYSTEM] screen before starting measurement.
Displaying a V10 flicker fluctuation graph
[TIME PLOT] screen
[FLICKER][GRAPH]
Select with the F key.
To enlarge or reduce the graph (p.116)To read the value above the cursor (p.117)To scroll waveform data (p.117)
1
• The graph is updated once a minute, regardless of the TIMEPLOT interval set in [SYS-TEM]-DF1 [RECORD].
• The graph is not displayed unless [Flicker] is set to [DV10] in [SYSTEM]-DF1 [MAIN]-F1 [MEASURE].
• V10 flicker can be measured simultaneously for the voltage channels U1, U2, and U3(depends on connection).

7.5 Displaying Flicker Values in Graph and List Form
116
Y-axis scale (Ydiv)When you want to reduce the graph, make the scale smaller.When you want to enlarge the graph, make the scale larger.
X-axis scale (Tdiv)Selects the X-axis scale.
AUTO scaling is used during recording. This cannot be changed.
Enlarging or reducing the graph (changing the X- and Y-axis scale)
Display the pull-down menu
Select a setting
Accept the setting
Cancel
[SELECT]
Select a setting
Settings:( : Default)
AUTO, x1, x2, x5, x10, x25, x50
Settings:From 1min/div
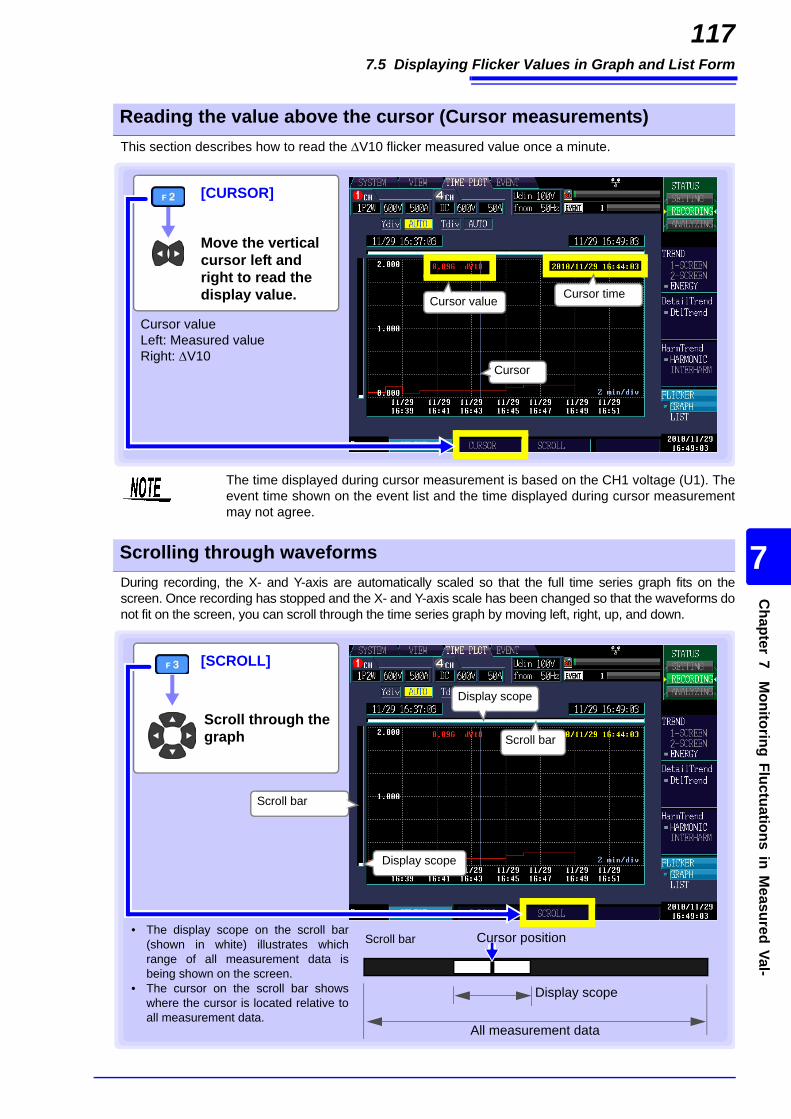
7.5 Displaying Flicker Values in Graph and List Form
117C
hapter 7 Monitoring Fluctuations in M
easured Val-
7
This section describes how to read the V10 flicker measured value once a minute.
During recording, the X- and Y-axis are automatically scaled so that the full time series graph fits on thescreen. Once recording has stopped and the X- and Y-axis scale has been changed so that the waveforms donot fit on the screen, you can scroll through the time series graph by moving left, right, up, and down.
Reading the value above the cursor (Cursor measurements)
[CURSOR]
Move the vertical cursor left and right to read the display value.
Cursor valueLeft: Measured valueRight: V10
Cursor
Cursor timeCursor value
The time displayed during cursor measurement is based on the CH1 voltage (U1). Theevent time shown on the event list and the time displayed during cursor measurementmay not agree.
Scrolling through waveforms
[SCROLL]
Scroll through thegraph
Scroll bar
Scroll bar
Display scope
Display scope
Scroll bar
Display scope
All measurement data
Cursor position• The display scope on the scroll bar(shown in white) illustrates whichrange of all measurement data isbeing shown on the screen.
• The cursor on the scroll bar showswhere the cursor is located relative toall measurement data.
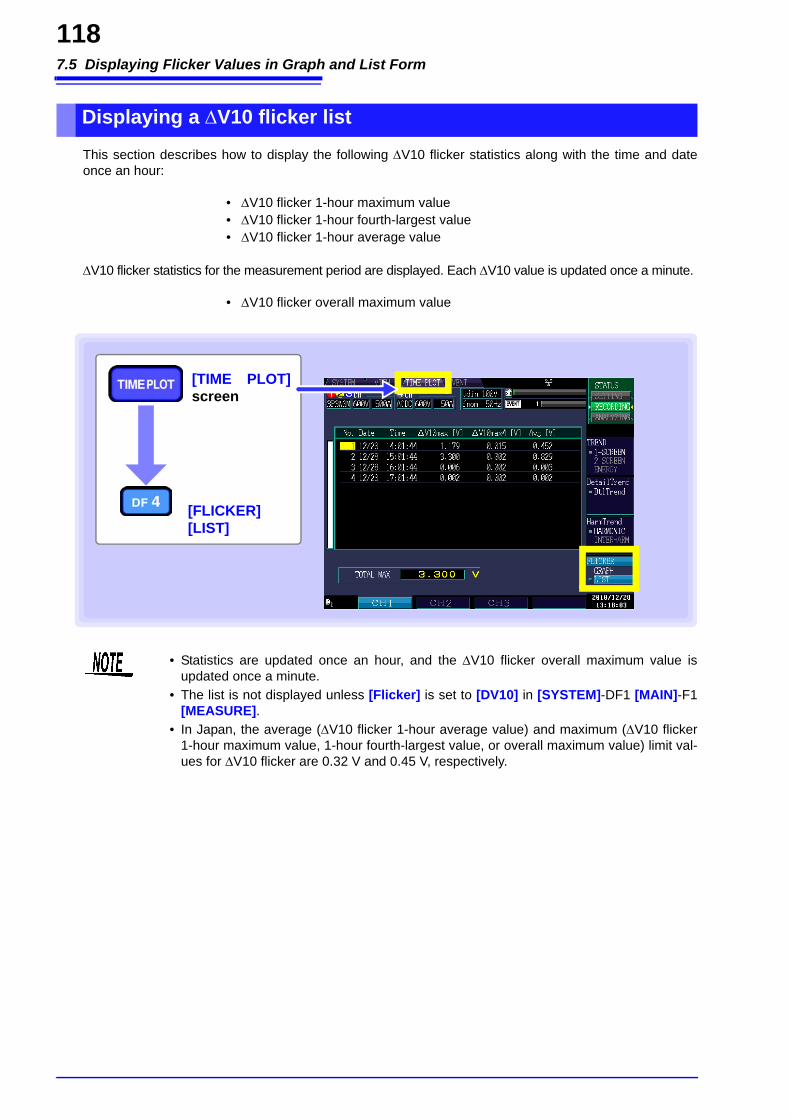
7.5 Displaying Flicker Values in Graph and List Form
118
This section describes how to display the following V10 flicker statistics along with the time and dateonce an hour:
• V10 flicker 1-hour maximum value• V10 flicker 1-hour fourth-largest value• V10 flicker 1-hour average value
V10 flicker statistics for the measurement period are displayed. Each V10 value is updated once a minute.
• V10 flicker overall maximum value
Displaying a V10 flicker list
[TIME PLOT]screen
[FLICKER][LIST]
• Statistics are updated once an hour, and the V10 flicker overall maximum value isupdated once a minute.
• The list is not displayed unless [Flicker] is set to [DV10] in [SYSTEM]-DF1 [MAIN]-F1[MEASURE].
• In Japan, the average (V10 flicker 1-hour average value) and maximum (V10 flicker1-hour maximum value, 1-hour fourth-largest value, or overall maximum value) limit val-ues for V10 flicker are 0.32 V and 0.45 V, respectively.

119C
hapter 8 Checking Events (EVEN
T screen)
8
Data is analyzed on the [EVENT] screen. For more information about events, see "Appendix 2 Explana-tion of Power Supply Quality Parameters and Events" (p.A4).
Checking Events (EVENT screen) Chapter 8
Display the event list. (p.121)You can check events that have occurred on the [EVENT LIST] screen.
Analyze events. (p.124 to p.132)You can display the screen at the time the selected event occurred.
Events displayed by the PW3198• Start recording events• Stop recording events• Calculation events (events for which one or more thresholds can be set)• Event waveforms (transient waveforms, high-order harmonic data, fluctua-
tion data)
Event occurrence
Each time an event occurs, an event isadded to the [EVENT LIST] screen.
• When making measurements using events, be sure to set the event setting on the [SYS-TEM] screen to ON.
See: "5.5 Changing Event Settings" (p.66)• The maximum number of events that can be displayed is 1,000. Depending on the
repeated recording and repeat count settings, up to 55,000 events can be recorded.(Event data should be analyzed using the 9624-50 PQA Hi-View Pro software.)
[EVENT1] [EVENT2]
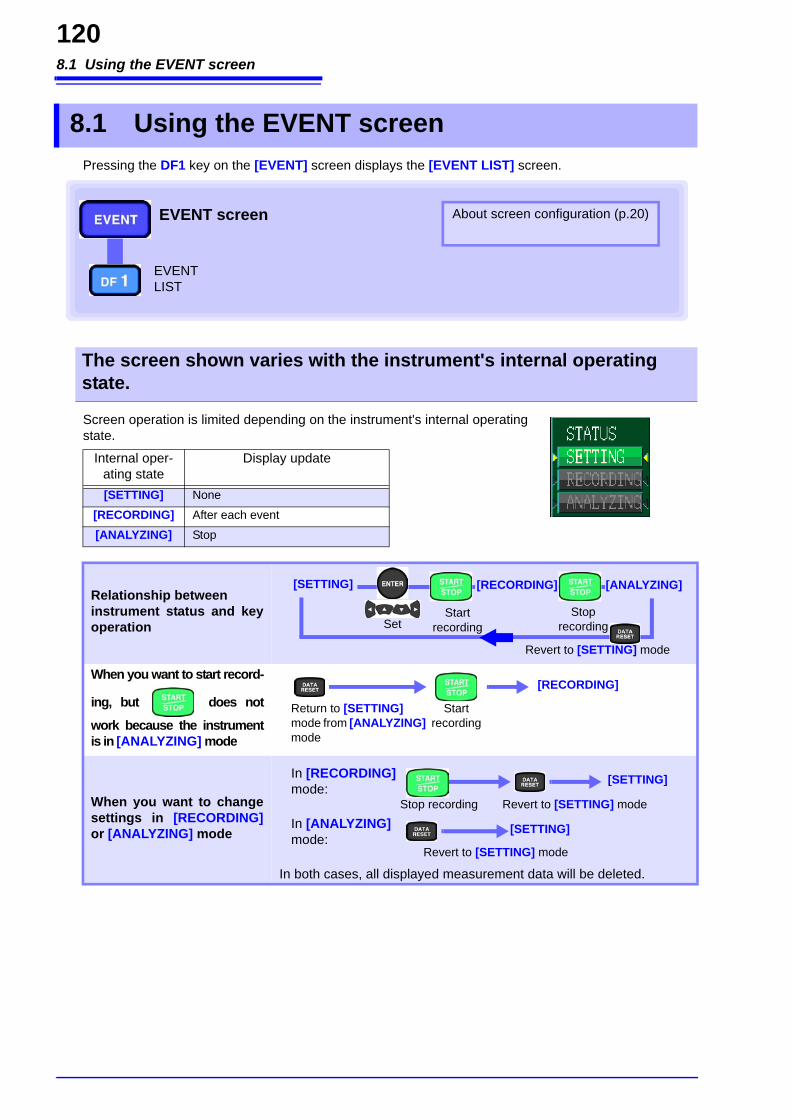
8.1 Using the EVENT screen
120
Pressing the DF1 key on the [EVENT] screen displays the [EVENT LIST] screen.
Screen operation is limited depending on the instrument's internal operatingstate.
8.1 Using the EVENT screen
EVENT screen
EVENTLIST
About screen configuration (p.20)
The screen shown varies with the instrument's internal operating state.
Internal oper-ating state
Display update
[SETTING] None
[RECORDING] After each event
[ANALYZING] Stop
Relationship between instrument status and keyoperation
When you want to start record-
ing, but does not
work because the instrumentis in [ANALYZING] mode
When you want to changesettings in [RECORDING]or [ANALYZING] mode
In both cases, all displayed measurement data will be deleted.
[SETTING] [RECORDING] [ANALYZING]
Start recording
Stop recording
Revert to [SETTING] mode
Set
Return to [SETTING] mode from [ANALYZING] mode
[RECORDING]
Start recording
[SETTING]In [RECORDING] mode:
Stop recording Revert to [SETTING] mode
[SETTING]In [ANALYZING] mode:
Revert to [SETTING] mode
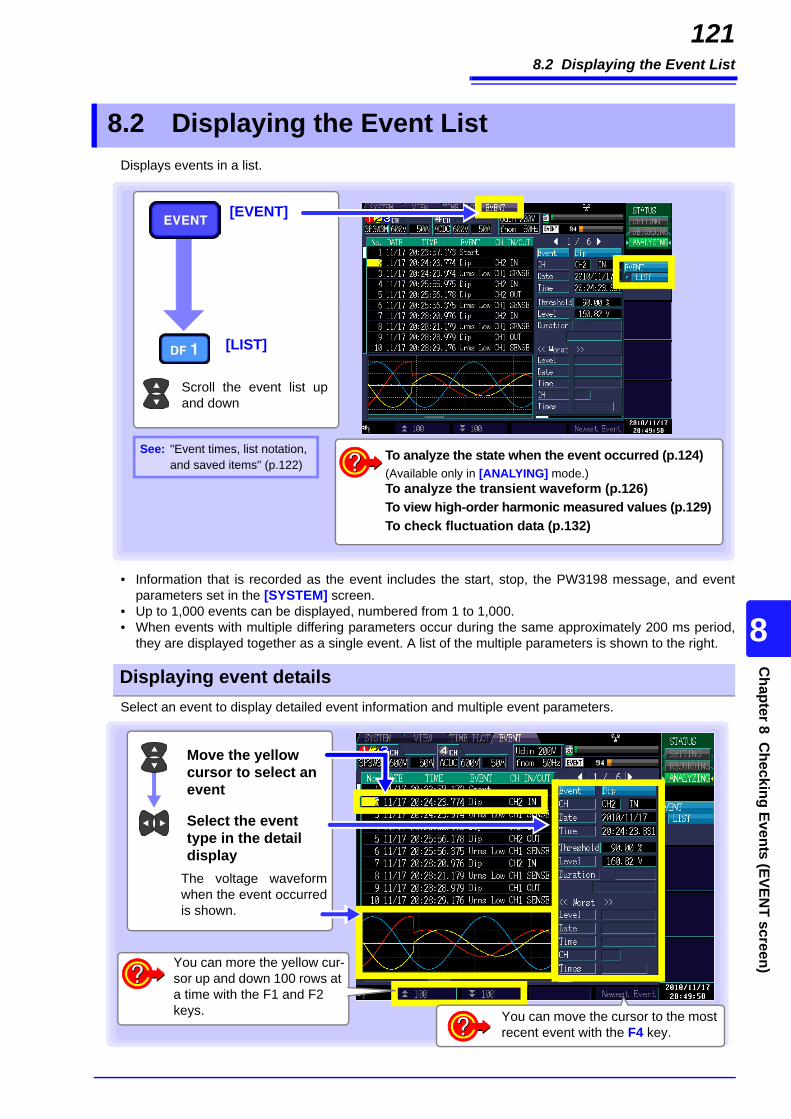
8.2 Displaying the Event List
121C
hapter 8 Checking Events (EVEN
T screen)
8
Displays events in a list.
• Information that is recorded as the event includes the start, stop, the PW3198 message, and eventparameters set in the [SYSTEM] screen.
• Up to 1,000 events can be displayed, numbered from 1 to 1,000.• When events with multiple differing parameters occur during the same approximately 200 ms period,
they are displayed together as a single event. A list of the multiple parameters is shown to the right.
Select an event to display detailed event information and multiple event parameters.
8.2 Displaying the Event List
[EVENT]
[LIST]
To analyze the state when the event occurred (p.124)(Available only in [ANALYING] mode.)To analyze the transient waveform (p.126)To view high-order harmonic measured values (p.129)To check fluctuation data (p.132)
Scroll the event list upand down
See: "Event times, list notation, and saved items" (p.122)
Displaying event details
Select the event type in the detail display
Move the yellow cursor to select an event
The voltage waveformwhen the event occurredis shown.
You can more the yellow cur-sor up and down 100 rows at a time with the F1 and F2 keys. You can move the cursor to the most
recent event with the F4 key.
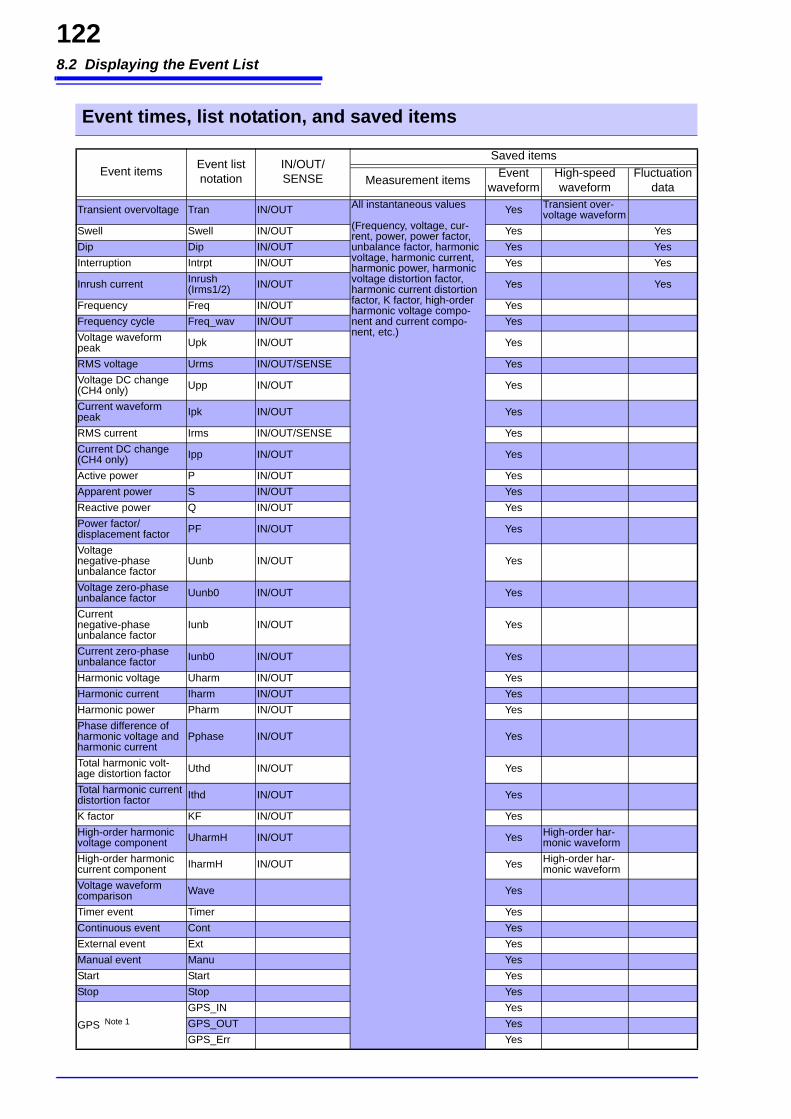
8.2 Displaying the Event List
122
Event times, list notation, and saved items
Event items Event list notation
IN/OUT/SENSE
Saved items
Measurement items Event waveform
High-speed waveform
Fluctuation data
Transient overvoltage Tran IN/OUT All instantaneous values
(Frequency, voltage, cur-rent, power, power factor, unbalance factor, harmonic voltage, harmonic current, harmonic power, harmonic voltage distortion factor, harmonic current distortion factor, K factor, high-order harmonic voltage compo-nent and current compo-nent, etc.)
Yes Transient over-voltage waveform
Swell Swell IN/OUT Yes YesDip Dip IN/OUT Yes YesInterruption Intrpt IN/OUT Yes Yes
Inrush current Inrush (Irms1/2) IN/OUT Yes Yes
Frequency Freq IN/OUT YesFrequency cycle Freq_wav IN/OUT YesVoltage waveform peak Upk IN/OUT Yes
RMS voltage Urms IN/OUT/SENSE YesVoltage DC change (CH4 only) Upp IN/OUT Yes
Current waveform peak Ipk IN/OUT Yes
RMS current Irms IN/OUT/SENSE YesCurrent DC change (CH4 only) Ipp IN/OUT Yes
Active power P IN/OUT YesApparent power S IN/OUT YesReactive power Q IN/OUT YesPower factor/displacement factor PF IN/OUT Yes
Voltage negative-phase unbalance factor
Uunb IN/OUT Yes
Voltage zero-phase unbalance factor Uunb0 IN/OUT Yes
Current negative-phase unbalance factor
Iunb IN/OUT Yes
Current zero-phase unbalance factor Iunb0 IN/OUT Yes
Harmonic voltage Uharm IN/OUT YesHarmonic current Iharm IN/OUT YesHarmonic power Pharm IN/OUT YesPhase difference of harmonic voltage and harmonic current
Pphase IN/OUT Yes
Total harmonic volt-age distortion factor Uthd IN/OUT Yes
Total harmonic current distortion factor Ithd IN/OUT Yes
K factor KF IN/OUT YesHigh-order harmonic voltage component UharmH IN/OUT Yes High-order har-
monic waveformHigh-order harmonic current component IharmH IN/OUT Yes High-order har-
monic waveformVoltage waveform comparison Wave Yes
Timer event Timer YesContinuous event Cont YesExternal event Ext YesManual event Manu YesStart Start YesStop Stop Yes
GPS Note 1GPS_IN YesGPS_OUT YesGPS_Err Yes
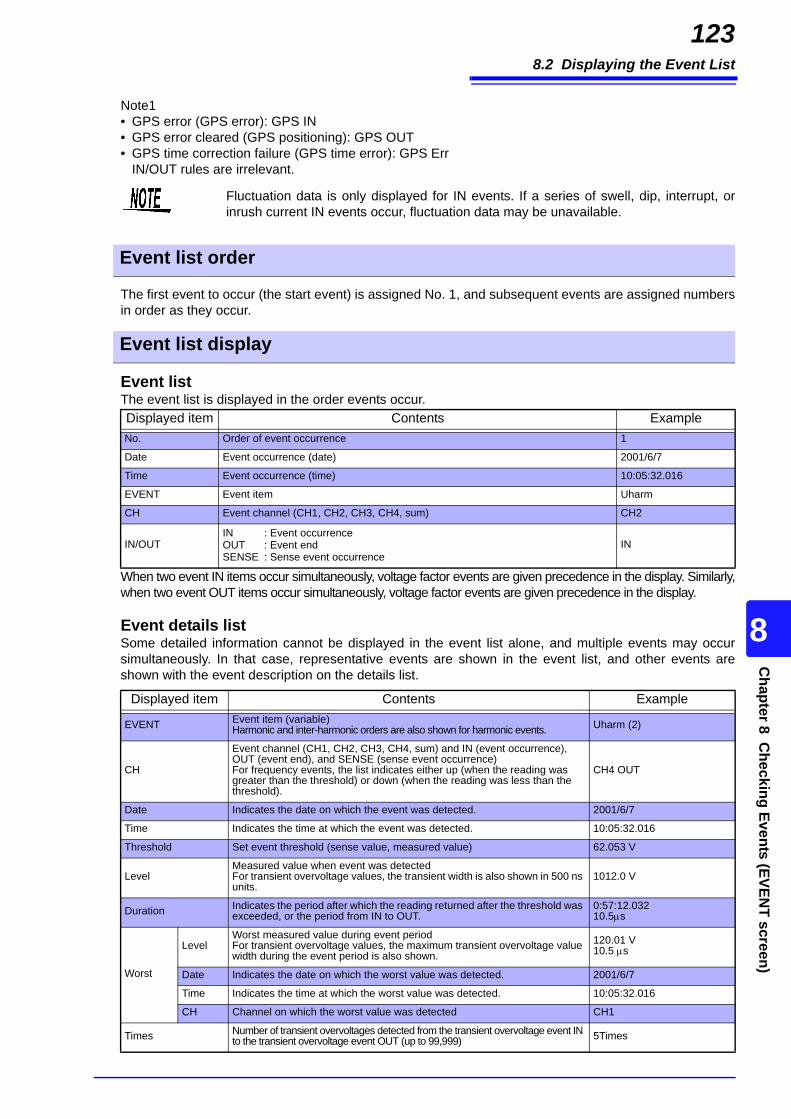
8.2 Displaying the Event List
123C
hapter 8 Checking Events (EVEN
T screen)
8
Note1• GPS error (GPS error): GPS IN• GPS error cleared (GPS positioning): GPS OUT• GPS time correction failure (GPS time error): GPS Err
IN/OUT rules are irrelevant.
The first event to occur (the start event) is assigned No. 1, and subsequent events are assigned numbersin order as they occur.
Event listThe event list is displayed in the order events occur.
When two event IN items occur simultaneously, voltage factor events are given precedence in the display. Similarly,when two event OUT items occur simultaneously, voltage factor events are given precedence in the display.
Event details listSome detailed information cannot be displayed in the event list alone, and multiple events may occursimultaneously. In that case, representative events are shown in the event list, and other events areshown with the event description on the details list.
Fluctuation data is only displayed for IN events. If a series of swell, dip, interrupt, orinrush current IN events occur, fluctuation data may be unavailable.
Event list order
Event list display
Displayed item Contents ExampleNo. Order of event occurrence 1
Date Event occurrence (date) 2001/6/7
Time Event occurrence (time) 10:05:32.016
EVENT Event item Uharm
CH Event channel (CH1, CH2, CH3, CH4, sum) CH2
IN/OUTIN : Event occurrenceOUT : Event endSENSE : Sense event occurrence
IN
Displayed item Contents Example
EVENT Event item (variable)Harmonic and inter-harmonic orders are also shown for harmonic events. Uharm (2)
CH
Event channel (CH1, CH2, CH3, CH4, sum) and IN (event occurrence), OUT (event end), and SENSE (sense event occurrence)For frequency events, the list indicates either up (when the reading was greater than the threshold) or down (when the reading was less than the threshold).
CH4 OUT
Date Indicates the date on which the event was detected. 2001/6/7
Time Indicates the time at which the event was detected. 10:05:32.016
Threshold Set event threshold (sense value, measured value) 62.053 V
LevelMeasured value when event was detectedFor transient overvoltage values, the transient width is also shown in 500 ns units.
1012.0 V
Duration Indicates the period after which the reading returned after the threshold was exceeded, or the period from IN to OUT.
0:57:12.03210.5s
Worst
LevelWorst measured value during event periodFor transient overvoltage values, the maximum transient overvoltage value width during the event period is also shown.
120.01 V10.5 s
Date Indicates the date on which the worst value was detected. 2001/6/7
Time Indicates the time at which the worst value was detected. 10:05:32.016
CH Channel on which the worst value was detected CH1
Times Number of transient overvoltages detected from the transient overvoltage event IN to the transient overvoltage event OUT (up to 99,999) 5Times
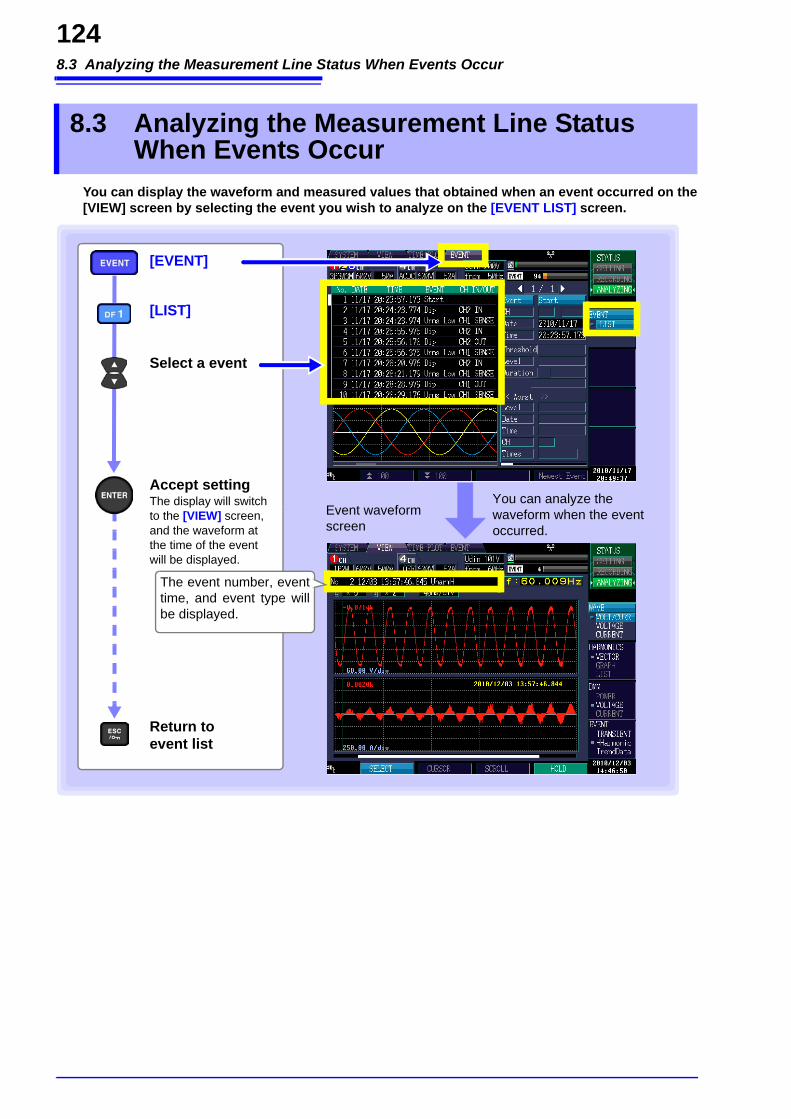
8.3 Analyzing the Measurement Line Status When Events Occur
124
You can display the waveform and measured values that obtained when an event occurred on the[VIEW] screen by selecting the event you wish to analyze on the [EVENT LIST] screen.
8.3 Analyzing the Measurement Line Status When Events Occur
Accept settingThe display will switch to the [VIEW] screen, and the waveform at the time of the event will be displayed.
Select a event
Return to event list
You can analyze the waveform when the event occurred.
Event waveform screen
[EVENT]
[LIST]
The event number, eventtime, and event type willbe displayed.
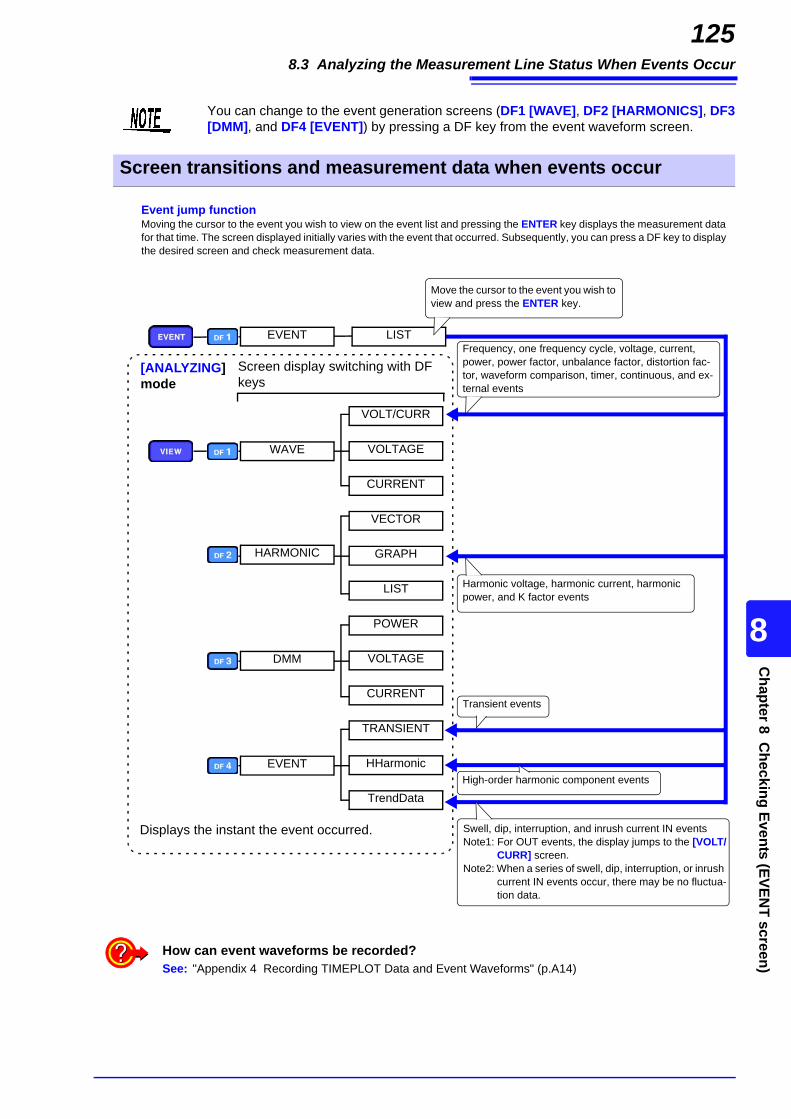
8.3 Analyzing the Measurement Line Status When Events Occur
125C
hapter 8 Checking Events (EVEN
T screen)
8
You can change to the event generation screens (DF1 [WAVE], DF2 [HARMONICS], DF3[DMM], and DF4 [EVENT]) by pressing a DF key from the event waveform screen.
Screen transitions and measurement data when events occur
[ANALYZING]mode
Screen display switching with DF keys
Displays the instant the event occurred.
TRANSIENT
HARMONIC
DMM
EVENT
TrendData
HHarmonic
CURRENT
VOLTAGE
POWER
LIST
GRAPH
VECTOR
WAVE VOLTAGE
CURRENT
VOLT/CURR
EVENT LIST
Event jump functionMoving the cursor to the event you wish to view on the event list and pressing the ENTER key displays the measurement data for that time. The screen displayed initially varies with the event that occurred. Subsequently, you can press a DF key to display the desired screen and check measurement data.
Frequency, one frequency cycle, voltage, current, power, power factor, unbalance factor, distortion fac-tor, waveform comparison, timer, continuous, and ex-ternal events
Harmonic voltage, harmonic current, harmonic power, and K factor events
Transient events
Swell, dip, interruption, and inrush current IN eventsNote1: For OUT events, the display jumps to the [VOLT/
CURR] screen. Note2: When a series of swell, dip, interruption, or inrush
current IN events occur, there may be no fluctua-tion data.
High-order harmonic component events
Move the cursor to the event you wish to view and press the ENTER key.
How can event waveforms be recorded?See: "Appendix 4 Recording TIMEPLOT Data and Event Waveforms" (p.A14)

8.4 Analyzing Transient Waveforms
126
8.4 Analyzing Transient Waveforms
Displaying transients
Accept settingThe display will switch to the [VIEW] screen, and the waveform at the time of the event will be displayed.
Select an event for which “Tran” is shown on the event list or event details list
Return to event list
[EVENT]
[LIST]
Year, month, day; time; ris-ing peak value; and dura-tion of transient
[TRANSIENT]
Voltage/Transient waveforms display
VoltageWaveform
Transient waveform
To enlarge or reduce the transient waveform (p.127)To scroll transient waveform data (p.128)
Select with the F key.
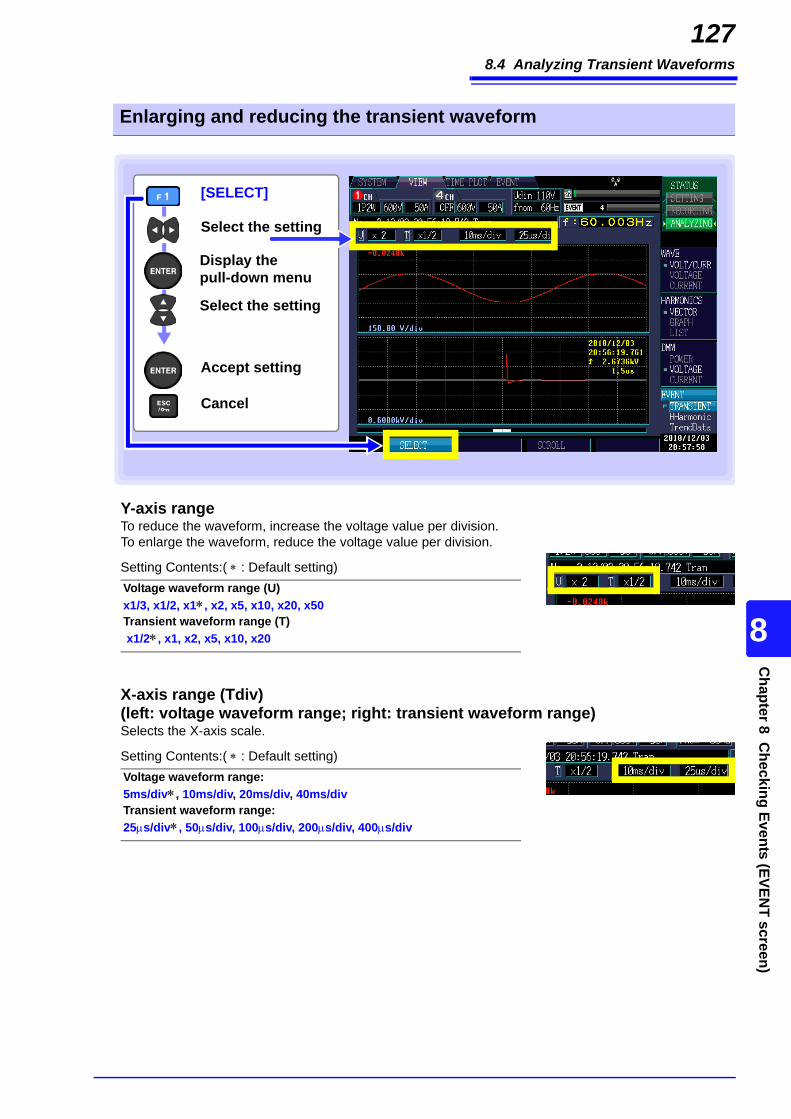
8.4 Analyzing Transient Waveforms
127C
hapter 8 Checking Events (EVEN
T screen)
8
Y-axis rangeTo reduce the waveform, increase the voltage value per division.To enlarge the waveform, reduce the voltage value per division.
X-axis range (Tdiv) (left: voltage waveform range; right: transient waveform range)Selects the X-axis scale.
Enlarging and reducing the transient waveform
Display the pull-down menu
Select the setting
Accept setting
Cancel
[SELECT]
Select the setting
Setting Contents:( : Default setting)Voltage waveform range (U)x1/3, x1/2, x1, x2, x5, x10, x20, x50Transient waveform range (T) x1/2, x1, x2, x5, x10, x20
Setting Contents:( : Default setting)Voltage waveform range:5ms/div, 10ms/div, 20ms/div, 40ms/divTransient waveform range:25s/div, 50s/div, 100s/div, 200s/div, 400s/div
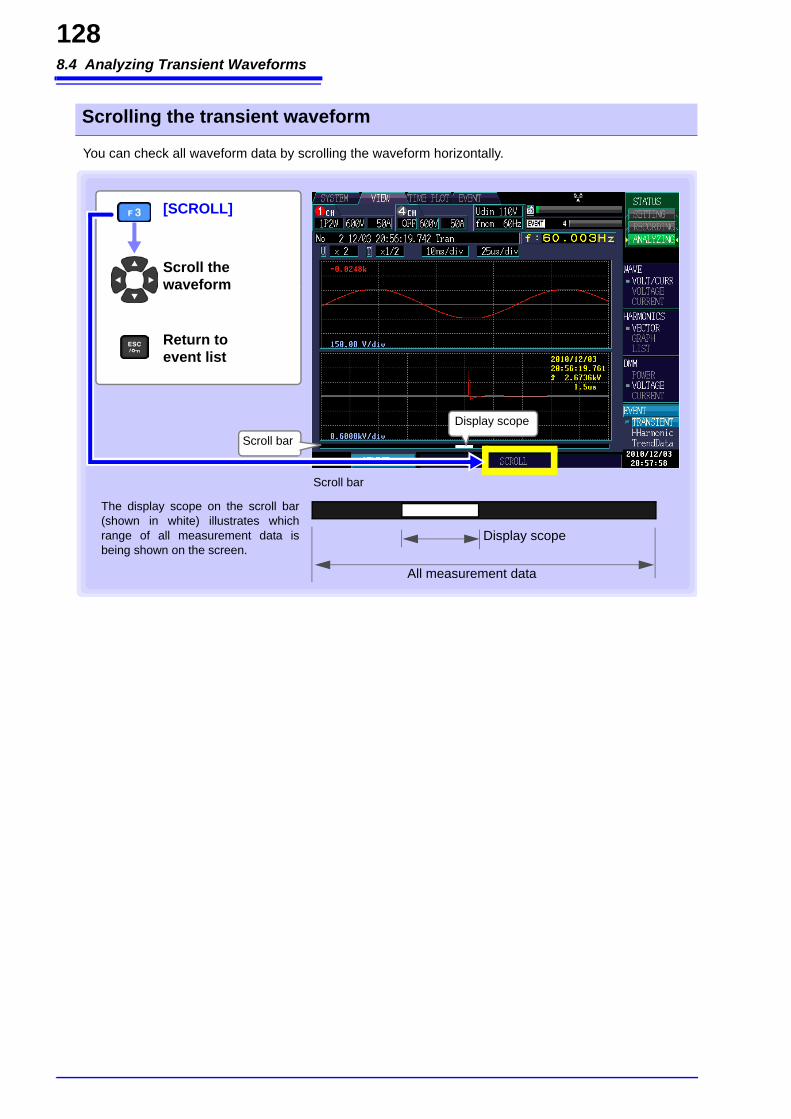
8.4 Analyzing Transient Waveforms
128
You can check all waveform data by scrolling the waveform horizontally.
Scrolling the transient waveform
[SCROLL]
Scroll the waveform
Scroll bar
Scroll bar
Display scope
All measurement data
The display scope on the scroll bar(shown in white) illustrates whichrange of all measurement data isbeing shown on the screen.
Display scope
Return to event list
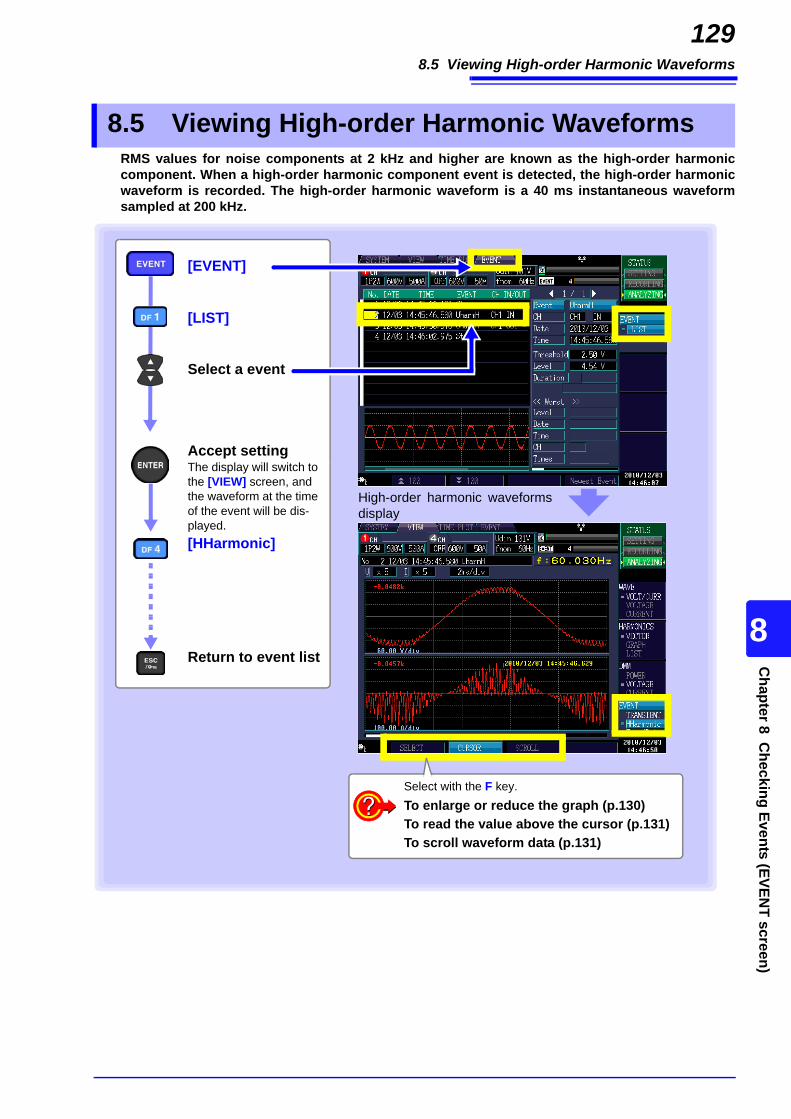
8.5 Viewing High-order Harmonic Waveforms
129C
hapter 8 Checking Events (EVEN
T screen)
8
RMS values for noise components at 2 kHz and higher are known as the high-order harmoniccomponent. When a high-order harmonic component event is detected, the high-order harmonicwaveform is recorded. The high-order harmonic waveform is a 40 ms instantaneous waveformsampled at 200 kHz.
8.5 Viewing High-order Harmonic Waveforms
Accept settingThe display will switch to the [VIEW] screen, and the waveform at the time of the event will be dis-played.
Select a event
Return to event list
[EVENT]
[LIST]
[HHarmonic]
High-order harmonic waveformsdisplay
To enlarge or reduce the graph (p.130)To read the value above the cursor (p.131)To scroll waveform data (p.131)
Select with the F key.
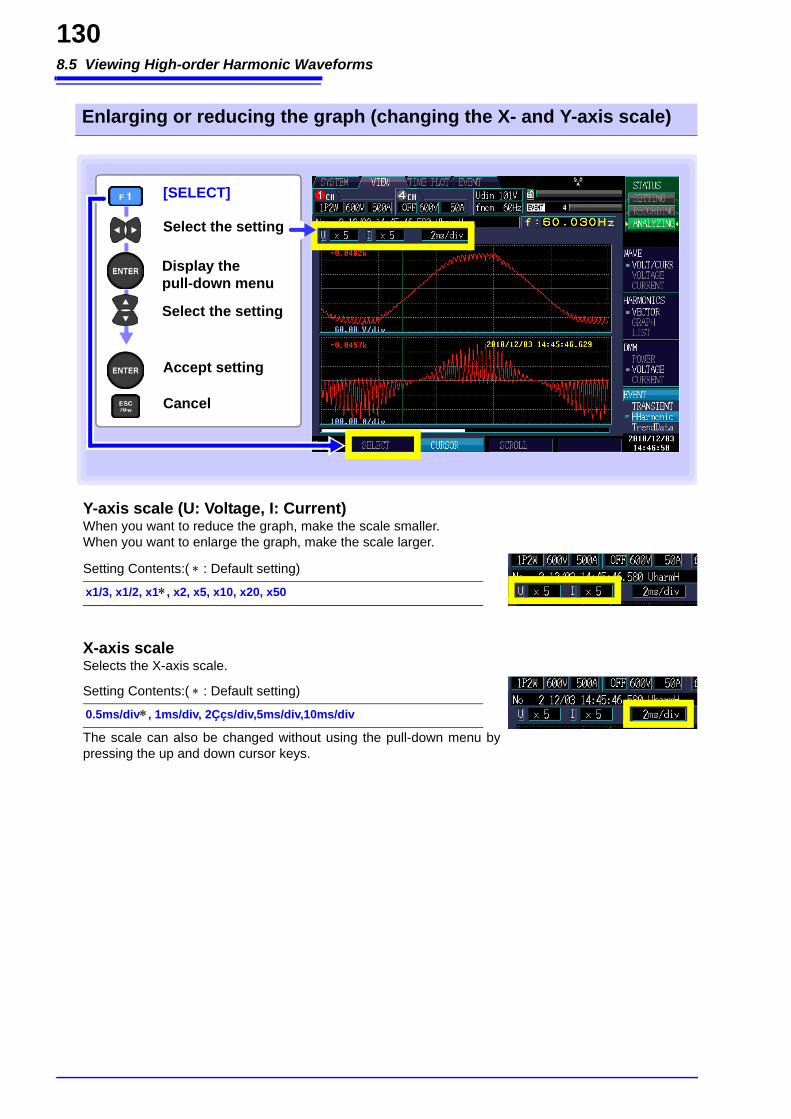
8.5 Viewing High-order Harmonic Waveforms
130
Y-axis scale (U: Voltage, I: Current)When you want to reduce the graph, make the scale smaller.When you want to enlarge the graph, make the scale larger.
X-axis scale Selects the X-axis scale.
The scale can also be changed without using the pull-down menu bypressing the up and down cursor keys.
Enlarging or reducing the graph (changing the X- and Y-axis scale)
Display the pull-down menu
Select the setting
Accept setting
Cancel
[SELECT]
Select the setting
Setting Contents:( : Default setting)
x1/3, x1/2, x1, x2, x5, x10, x20, x50
Setting Contents:( : Default setting)
0.5ms/div, 1ms/div, 2Ççs/div,5ms/div,10ms/div
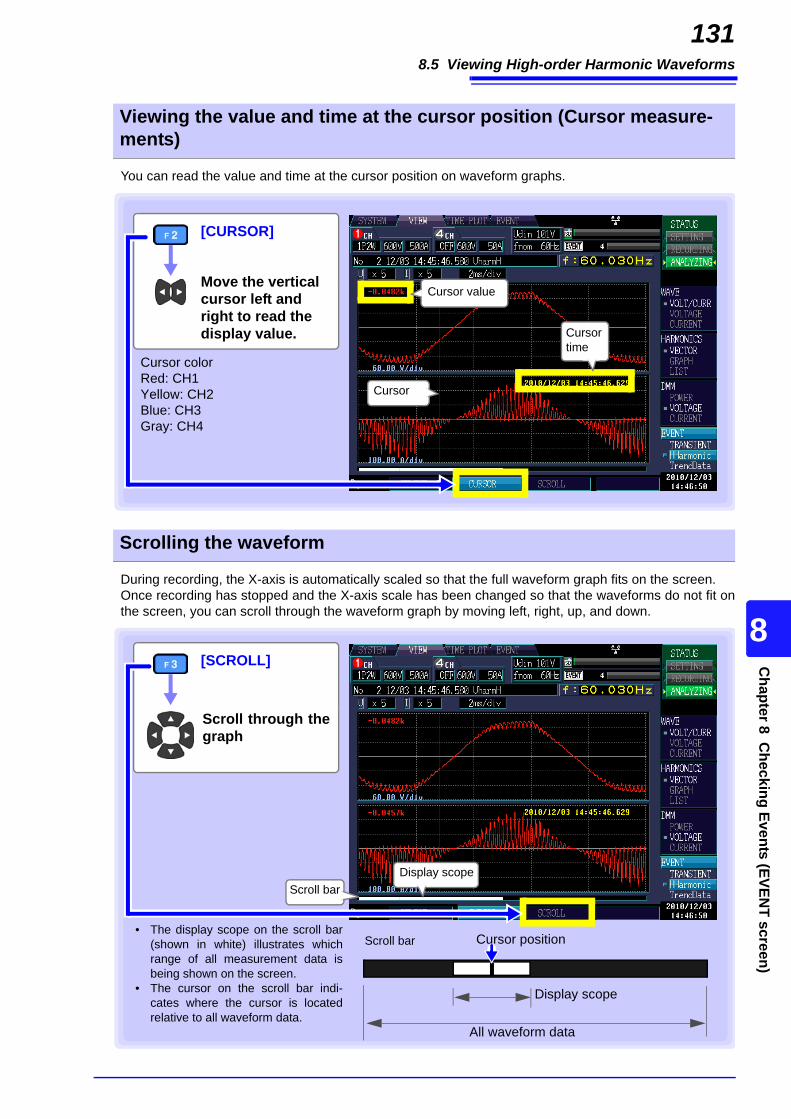
8.5 Viewing High-order Harmonic Waveforms
131C
hapter 8 Checking Events (EVEN
T screen)
8
You can read the value and time at the cursor position on waveform graphs.
During recording, the X-axis is automatically scaled so that the full waveform graph fits on the screen.Once recording has stopped and the X-axis scale has been changed so that the waveforms do not fit onthe screen, you can scroll through the waveform graph by moving left, right, up, and down.
Viewing the value and time at the cursor position (Cursor measure-ments)
[CURSOR]
Move the vertical cursor left and right to read the display value.
Cursor colorRed: CH1Yellow: CH2Blue: CH3Gray: CH4
Cursor
Cursor time
Cursor value
Scrolling the waveform
[SCROLL]
Scroll through thegraph
Scroll barDisplay scope
• The display scope on the scroll bar(shown in white) illustrates whichrange of all measurement data isbeing shown on the screen.
• The cursor on the scroll bar indi-cates where the cursor is locatedrelative to all waveform data.
Scroll bar
Display scope
All waveform data
Cursor position
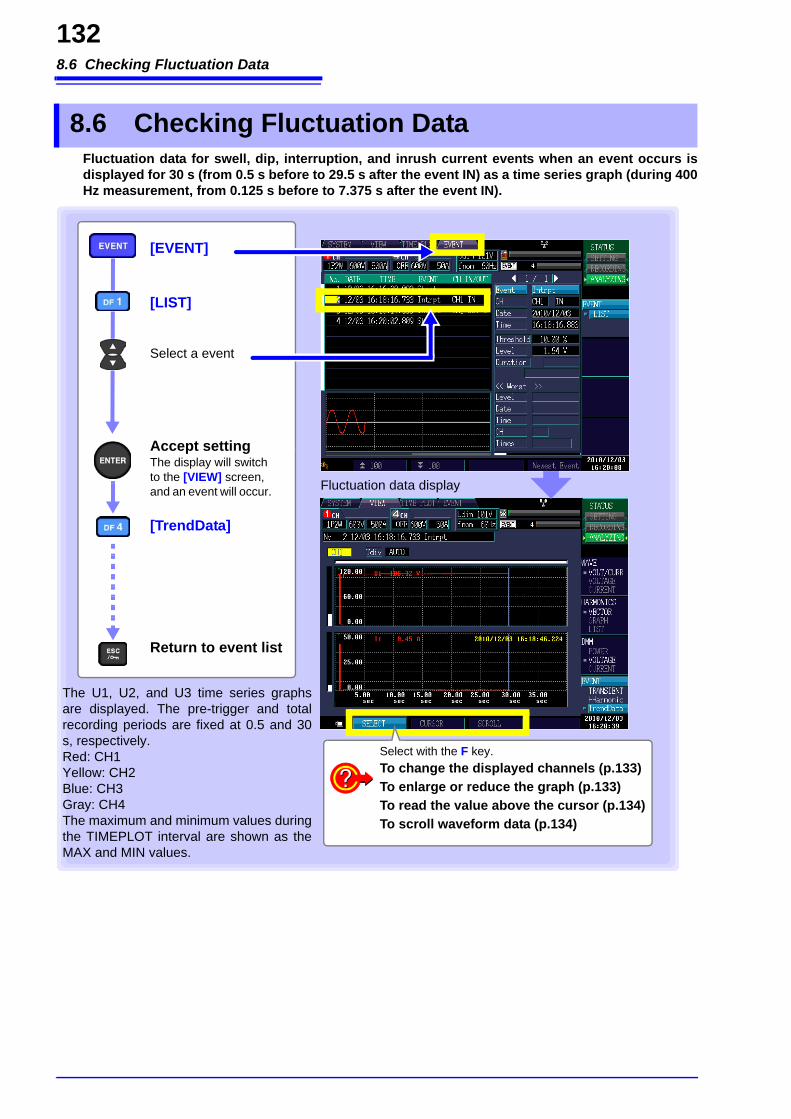
8.6 Checking Fluctuation Data
132
Fluctuation data for swell, dip, interruption, and inrush current events when an event occurs isdisplayed for 30 s (from 0.5 s before to 29.5 s after the event IN) as a time series graph (during 400Hz measurement, from 0.125 s before to 7.375 s after the event IN).
8.6 Checking Fluctuation Data
Accept settingThe display will switch to the [VIEW] screen, and an event will occur.
Select a event
Return to event list
[EVENT]
[LIST]
[TrendData]
Fluctuation data display
The U1, U2, and U3 time series graphsare displayed. The pre-trigger and totalrecording periods are fixed at 0.5 and 30s, respectively. Red: CH1Yellow: CH2Blue: CH3Gray: CH4The maximum and minimum values duringthe TIMEPLOT interval are shown as theMAX and MIN values.
To change the displayed channels (p.133)To enlarge or reduce the graph (p.133)To read the value above the cursor (p.134)To scroll waveform data (p.134)
Select with the F key.

8.6 Checking Fluctuation Data
133C
hapter 8 Checking Events (EVEN
T screen)
8
Displayed channelX-axis scale (Tdiv)When you want to reduce the graph, make the scale smaller.When you want to enlarge the graph, make the scale larger.
• Data can be recorded regardless of the recording item settings (p.62) and the TIME-PLOT interval settings (p.63) (SYSTEM-DF1 [RECORDING]).
• When an event occurs while 30 s of fluctuation data is being recorded, fluctuation data isonly recorded for the first event.
• Ultimately, data can be analyzed in detail and reports generated using the 9624-50 PQAHi-View Pro software.
Changing the displayed channel and enlarging or reducing the graph (changing the X-axis scale)
Display the pull-down menu
Select the setting
Accept setting
Cancel
[SELECT]
Select the setting
Setting Contents:( : Default setting)
CH1/ CH2/ CH3/ CH4 (varies with connection)
Setting Contents:( : Default setting)
AUTO, x5, x2, x1, x1/2, x1/5, x1/10
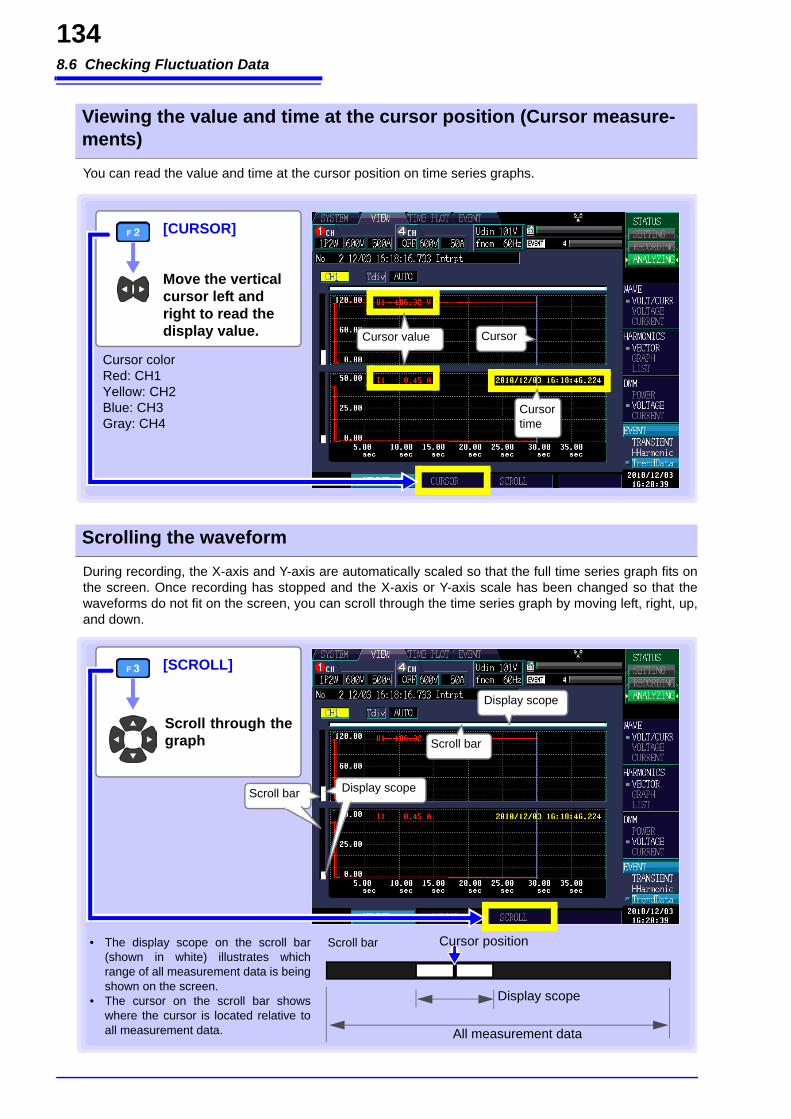
8.6 Checking Fluctuation Data
134
You can read the value and time at the cursor position on time series graphs.
During recording, the X-axis and Y-axis are automatically scaled so that the full time series graph fits onthe screen. Once recording has stopped and the X-axis or Y-axis scale has been changed so that thewaveforms do not fit on the screen, you can scroll through the time series graph by moving left, right, up,and down.
Viewing the value and time at the cursor position (Cursor measure-ments)
[CURSOR]
Move the vertical cursor left and right to read the display value.
Cursor colorRed: CH1Yellow: CH2Blue: CH3Gray: CH4
Cursor
Cursor time
Cursor value
Scrolling the waveform
[SCROLL]
Scroll through thegraph
Scroll bar
Scroll bar
Display scope
Display scope
• The display scope on the scroll bar(shown in white) illustrates whichrange of all measurement data is beingshown on the screen.
• The cursor on the scroll bar showswhere the cursor is located relative toall measurement data.
Scroll bar
Display scope
All measurement data
Cursor position
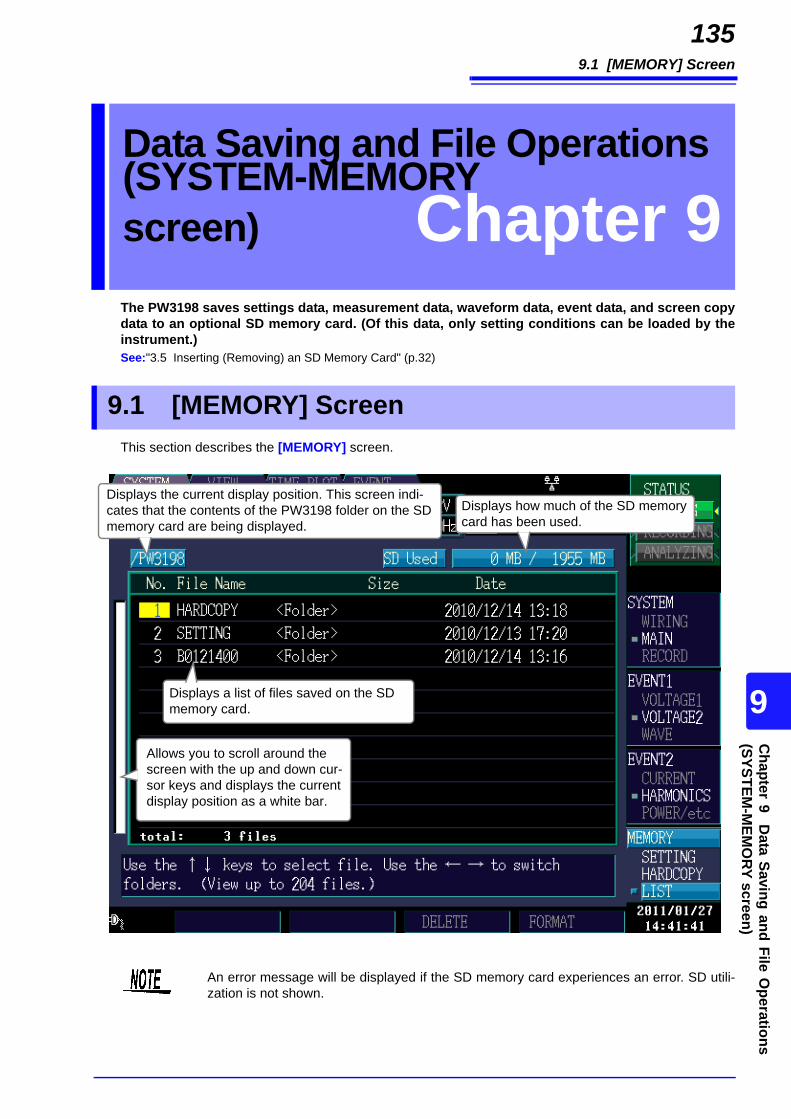
9.1 [MEMORY] Screen
135
89
Chapter 9 D
ata Saving and File Operations
9
(SYSTEM-M
EMO
RY screen)
The PW3198 saves settings data, measurement data, waveform data, event data, and screen copydata to an optional SD memory card. (Of this data, only setting conditions can be loaded by theinstrument.)See:"3.5 Inserting (Removing) an SD Memory Card" (p.32)
This section describes the [MEMORY] screen.
Data Saving and File Operations (SYSTEM-MEMORY screen) Chapter 9
9.1 [MEMORY] Screen
Displays the current display position. This screen indi-cates that the contents of the PW3198 folder on the SD memory card are being displayed.
Displays a list of files saved on the SD memory card.
Allows you to scroll around the screen with the up and down cur-sor keys and displays the current display position as a white bar.
Displays how much of the SD memory card has been used.
An error message will be displayed if the SD memory card experiences an error. SD utili-zation is not shown.

9.1 [MEMORY] Screen
136
The following file data types may be stored.
• Files are numbered consecutively inside each folder.• The first letter of the folder for saving data indicates the data type, while Y represents the last digit of
the year, MM the month, DD the day, and NN the consecutive number for that day.
About File Types
Name Type Description
00000001.SET SET Settings file
00000001.BMP BMP Screen copy data file
EV000001.EVT EVT Event data file
TR000001.TRN TRN Transient waveform file
HH000001.HHC HHC High-order harmonic waveform file
000001.WDU WDU Fluctuation data file
AT000000.BMP BMP Screen data file saved once each screen copy interval
PW3198.SET SET Settings data file at start of time series measurement
TP0000.ITV ITV Time series measurement normal binary file
FL0000.FLC FLC Time series measurement flicker data
HARDCOPY <Folder> Folder for saving screen copy data files
SETTING <Folder> Folder for saving settings
BYMMDDNN <Folder> Folder for saving data (name varies with folder type, date, andnumber of folder)(p.140))
EVENT <Folder> Folder for saving events
AUTOCOPY <Folder> Folder for automatically saving screen data (folder for savingAT*******.BMP files)
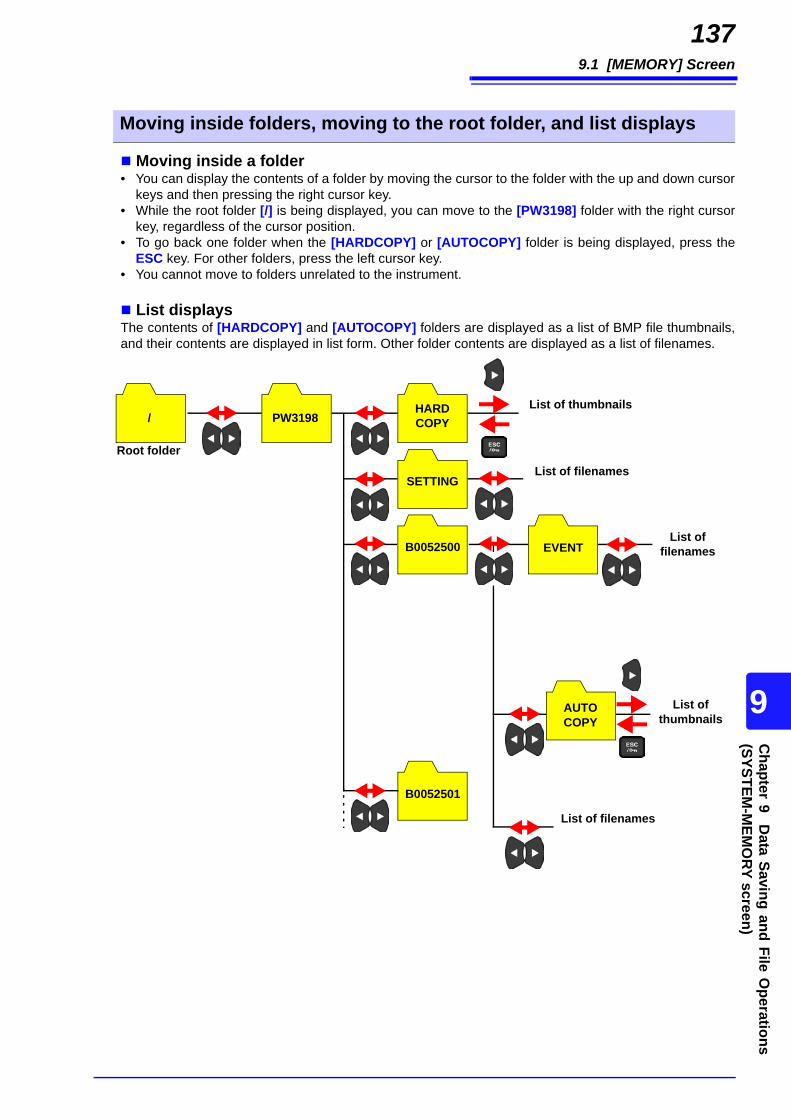
9.1 [MEMORY] Screen
137
89
Chapter 9 D
ata Saving and File Operations
9
(SYSTEM-M
EMO
RY screen)
Moving inside a folder• You can display the contents of a folder by moving the cursor to the folder with the up and down cursor
keys and then pressing the right cursor key. • While the root folder [/] is being displayed, you can move to the [PW3198] folder with the right cursor
key, regardless of the cursor position.• To go back one folder when the [HARDCOPY] or [AUTOCOPY] folder is being displayed, press the
ESC key. For other folders, press the left cursor key.• You cannot move to folders unrelated to the instrument.
List displaysThe contents of [HARDCOPY] and [AUTOCOPY] folders are displayed as a list of BMP file thumbnails,and their contents are displayed in list form. Other folder contents are displayed as a list of filenames.
Moving inside folders, moving to the root folder, and list displays
PW3198HARDCOPY
B0052500
B0052501
EVENT
AUTOCOPY
/
Root folder
List of thumbnails
List of filenames
List of filenames
List of thumbnails
SETTINGList of filenames
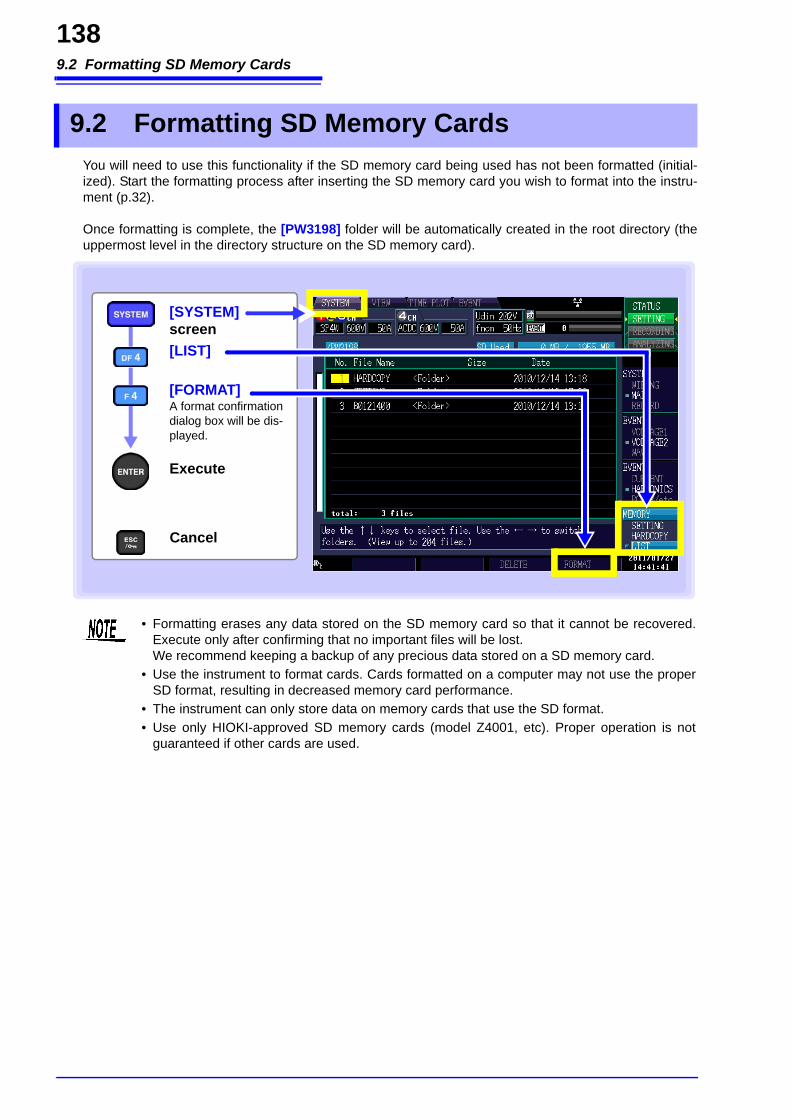
9.2 Formatting SD Memory Cards
138
You will need to use this functionality if the SD memory card being used has not been formatted (initial-ized). Start the formatting process after inserting the SD memory card you wish to format into the instru-ment (p.32).
Once formatting is complete, the [PW3198] folder will be automatically created in the root directory (theuppermost level in the directory structure on the SD memory card).
9.2 Formatting SD Memory Cards
[LIST]
[SYSTEM]screen
[FORMAT]A format confirmation dialog box will be dis-played.
Execute
Cancel
• Formatting erases any data stored on the SD memory card so that it cannot be recovered.Execute only after confirming that no important files will be lost. We recommend keeping a backup of any precious data stored on a SD memory card.
• Use the instrument to format cards. Cards formatted on a computer may not use the properSD format, resulting in decreased memory card performance.
• The instrument can only store data on memory cards that use the SD format. • Use only HIOKI-approved SD memory cards (model Z4001, etc). Proper operation is not
guaranteed if other cards are used.
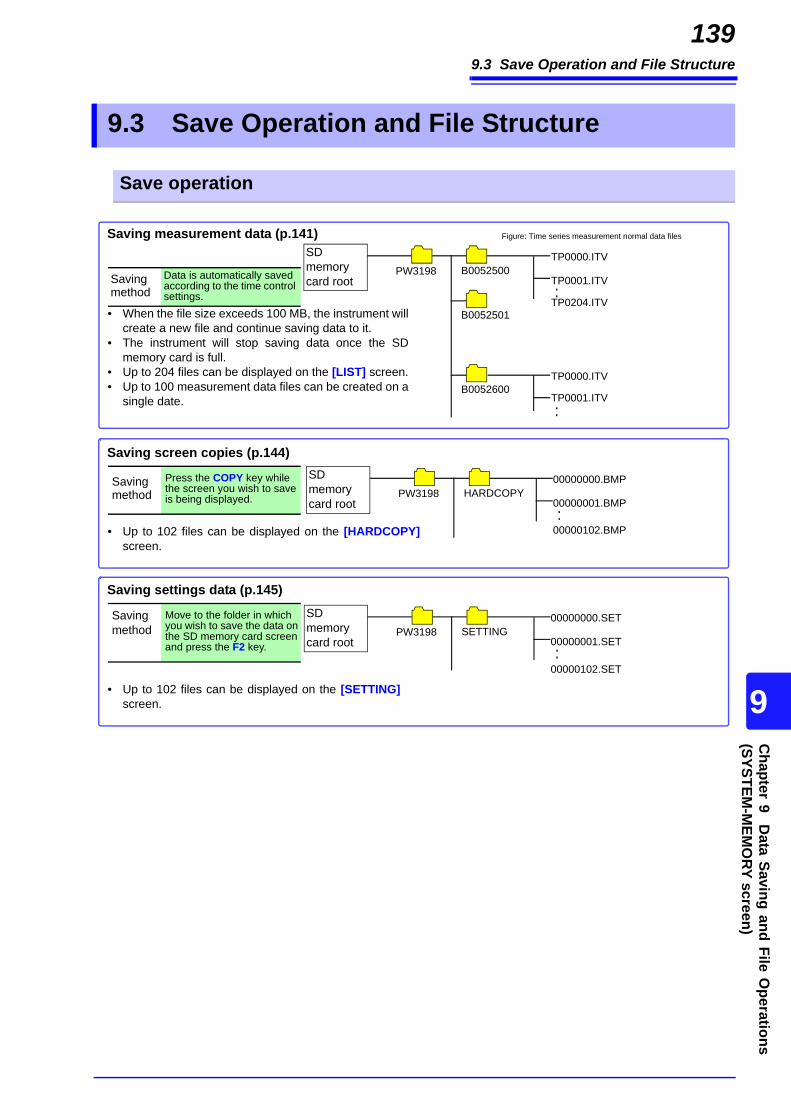
9.3 Save Operation and File Structure
139
89
Chapter 9 D
ata Saving and File Operations
9
(SYSTEM-M
EMO
RY screen)
9.3 Save Operation and File Structure
Save operation
Saving measurement data (p.141)
Saving method
Data is automatically saved according to the time control settings.
PW3198TP0000.ITV
TP0001.ITV
• When the file size exceeds 100 MB, the instrument willcreate a new file and continue saving data to it.
• The instrument will stop saving data once the SDmemory card is full.
• Up to 204 files can be displayed on the [LIST] screen.• Up to 100 measurement data files can be created on a
single date.
SD memory card root
B0052500
B0052501
TP0000.ITVB0052600
TP0001.ITV
Figure: Time series measurement normal data files
TP0204.ITV
Saving method
Press the COPY key while the screen you wish to save is being displayed.
Saving screen copies (p.144)
• Up to 102 files can be displayed on the [HARDCOPY]screen.
PW319800000000.BMP
00000001.BMP
SD memory card root
HARDCOPY
00000102.BMP
Saving method
Move to the folder in which you wish to save the data on the SD memory card screen and press the F2 key.
Saving settings data (p.145)
• Up to 102 files can be displayed on the [SETTING]screen.
PW319800000000.SET
00000001.SET
00000102.SET
SD memory card root
SETTING
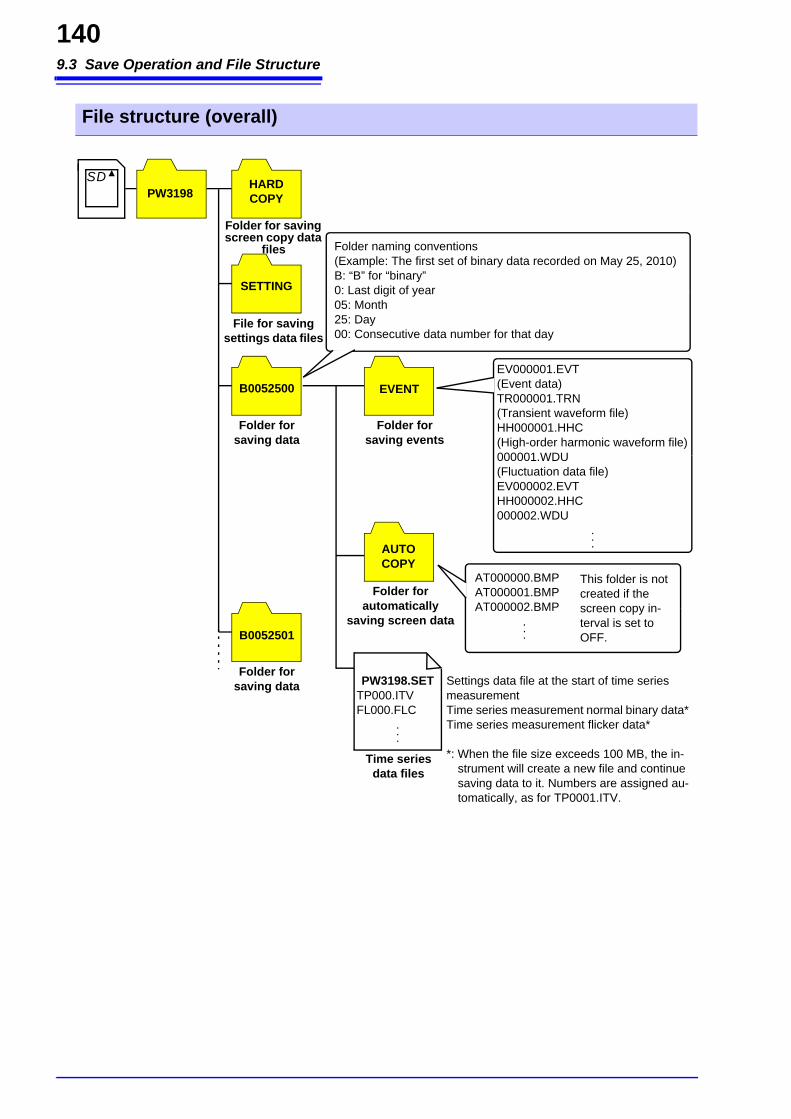
9.3 Save Operation and File Structure
140
File structure (overall)
PW3198HARDCOPY
SETTING
B0052500
B0052501
Folder for saving data
Folder for saving events
Folder for automatically
saving screen data
Folder naming conventions(Example: The first set of binary data recorded on May 25, 2010)B: “B” for “binary”0: Last digit of year05: Month25: Day00: Consecutive data number for that day
EV000001.EVT(Event data)TR000001.TRN(Transient waveform file)HH000001.HHC(High-order harmonic waveform file)000001.WDU(Fluctuation data file)EV000002.EVTHH000002.HHC000002.WDU
...
AT000000.BMPAT000001.BMPAT000002.BMP
...
EVENT
AUTOCOPY
PW3198.SETTP000.ITVFL000.FLC
...
Settings data file at the start of time series measurementTime series measurement normal binary data*Time series measurement flicker data*
*: When the file size exceeds 100 MB, the in-strument will create a new file and continue saving data to it. Numbers are assigned au-tomatically, as for TP0001.ITV.
Time series data files
This folder is not created if the screen copy in-terval is set to OFF.
File for saving settings data files
Folder for saving screen copy data
files
Folder for saving data
SD
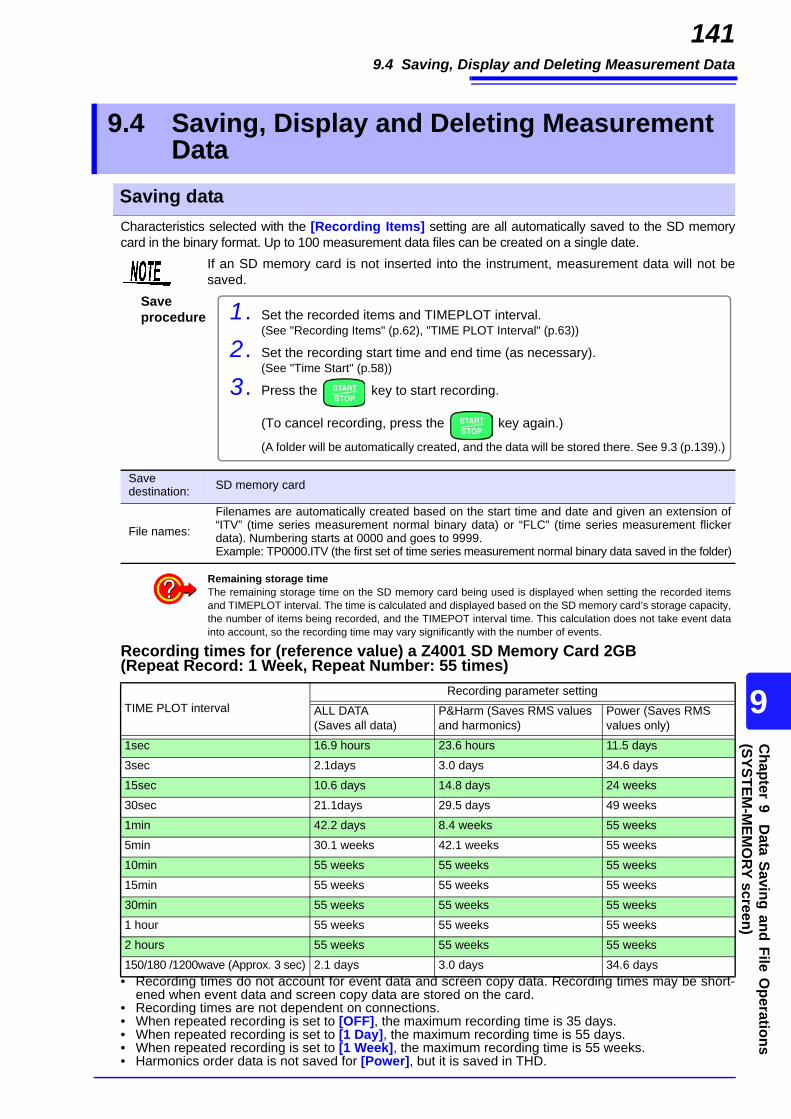
9.4 Saving, Display and Deleting Measurement Data
141
89
Chapter 9 D
ata Saving and File Operations
9
(SYSTEM-M
EMO
RY screen)
Characteristics selected with the [Recording Items] setting are all automatically saved to the SD memorycard in the binary format. Up to 100 measurement data files can be created on a single date.
Recording times for (reference value) a Z4001 SD Memory Card 2GB (Repeat Record: 1 Week, Repeat Number: 55 times)
• Recording times do not account for event data and screen copy data. Recording times may be short-ened when event data and screen copy data are stored on the card.
• Recording times are not dependent on connections.• When repeated recording is set to [OFF], the maximum recording time is 35 days.• When repeated recording is set to [1 Day], the maximum recording time is 55 days.• When repeated recording is set to [1 Week], the maximum recording time is 55 weeks.• Harmonics order data is not saved for [Power], but it is saved in THD.
9.4 Saving, Display and Deleting Measurement Data
Saving data
If an SD memory card is not inserted into the instrument, measurement data will not besaved.
Save procedure 1. Set the recorded items and TIMEPLOT interval.
(See "Recording Items" (p.62), "TIME PLOT Interval" (p.63))
2. Set the recording start time and end time (as necessary).(See "Time Start" (p.58))
3. Press the key to start recording.
(To cancel recording, press the key again.)
(A folder will be automatically created, and the data will be stored there. See 9.3 (p.139).)
Save destination: SD memory card
File names:
Filenames are automatically created based on the start time and date and given an extension of“ITV” (time series measurement normal binary data) or “FLC” (time series measurement flickerdata). Numbering starts at 0000 and goes to 9999. Example: TP0000.ITV (the first set of time series measurement normal binary data saved in the folder)
TIME PLOT intervalRecording parameter setting
ALL DATA(Saves all data)
P&Harm (Saves RMS values and harmonics)
Power (Saves RMS values only)
1sec 16.9 hours 23.6 hours 11.5 days
3sec 2.1days 3.0 days 34.6 days
15sec 10.6 days 14.8 days 24 weeks
30sec 21.1days 29.5 days 49 weeks
1min 42.2 days 8.4 weeks 55 weeks
5min 30.1 weeks 42.1 weeks 55 weeks
10min 55 weeks 55 weeks 55 weeks
15min 55 weeks 55 weeks 55 weeks
30min 55 weeks 55 weeks 55 weeks
1 hour 55 weeks 55 weeks 55 weeks
2 hours 55 weeks 55 weeks 55 weeks
150/180 /1200wave (Approx. 3 sec) 2.1 days 3.0 days 34.6 days
Remaining storage timeThe remaining storage time on the SD memory card being used is displayed when setting the recorded itemsand TIMEPLOT interval. The time is calculated and displayed based on the SD memory card’s storage capacity,the number of items being recorded, and the TIMEPOT interval time. This calculation does not take event datainto account, so the recording time may vary significantly with the number of events.
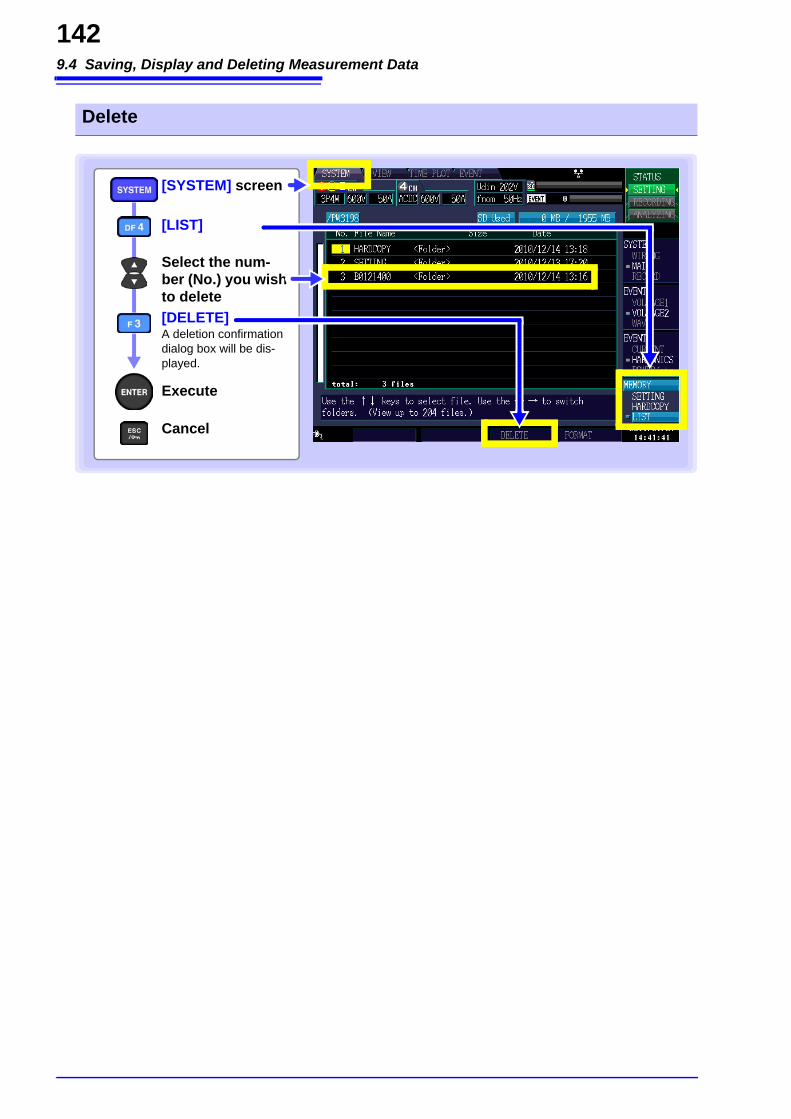
9.4 Saving, Display and Deleting Measurement Data
142
Delete
[LIST]
Select the num-ber (No.) you wish to delete[DELETE]A deletion confirmation dialog box will be dis-played.
[SYSTEM] screen
Execute
Cancel

9.4 Saving, Display and Deleting Measurement Data
143
89
Chapter 9 D
ata Saving and File Operations
9
(SYSTEM-M
EMO
RY screen)
In the [SYSTEM]-[MEMORY]-[LIST] screen, when the cursor is moved to the stored data folder to be dis-played and the F1 [Load] key is pressed, [Analyze] will be activated and the event list, trend data, detailedtrend data in the specified folder will be displayed. Event, trend data and detailed trend data can be checked.Refer to "Chapter 8 Checking Events (EVENT screen)" (p.119) for the Event Confirmation Method.Return to [Settings] with the DATARESET key.
[TIMEPLOT] screen maximum display times
Display Measurement Data (Load)
• lThe maximum displayed times of the trend data, detailed trend data, and har-monic trend data in the [TIME PLOT] screen of the HIOKI PW3198 is subject tocertain constraints. To confirm all measured trend data, use the 9624-50 PQA-HiView Pro Software.
• lMeasurement data can only be loaded on the instrument which measures.Data measured in different versions will not load even if the instrument is thesame.
• The F1 [Load] key will appear when the cursor is in the stored data folder.(B*******).
TIME PLOT Interval
Recording Items settingALL DATA(Saves all data)
P&Harm (Saves RMS values and harmonics)
Power (Saves RMS values only)
1sec 7 min. 52 sec. 15 min. 44 sec. 2 hours 37 min. 20 sec.3sec 23 min. 36 sec. 47 min. 12 sec. 7 hours 52 min. 15sec 1 hour 58 min. 3 hours 56 min. 1 day 15 hours 20 min. 30sec 3 hours 56 min. 7 hours 52 min. 3 days 6 hours 40 min. 1min 7 hours 58 min. 15 hours 44 min. 6 days 13 hours 20 min. 5min 1 day 15 hours 20 min. 3 days 6 hours 40 min. 32 days 18 hours 40 min. 10min 3 days 6 hours 40 min. 6 days 13 hours 20 min. 35 days 15min 4 days 22 hours 9 days 20 hours 35 days 30min 9 days 20 hours 19 days 16 hours 35 days 1hour 19 days 16 hours 35 days 35 days 2hours 35 days 35 days 35 days 150/180 wave (Approx. 3 sec) 23 min. 36 sec. 47 min. 12 sec. 7 hours 52 min.

9.5 Saving, Displaying, and Deleting Screen Copies
144
You can save the currently displayed screen as a BMP (256-color) file. The file extension is “.bmp.” If theinstrument is connected to a printer, you can also print screens (in monochrome).
You can save (output) the screen at a given instant to the set SD memory card by pressing the keywhile the screen you wish to save is displayed.
9.5 Saving, Displaying, and Deleting Screen Copies
Save
RS Connection: SD memory card or printer
File names:Auto generated, extension of “.bmp”00000000.BMP (consecutive numbering in the folder ranges from 00000000 to 99999999)Example: 00000001.BMP
• When saving screen copies to the SD memory card, verify that the [RS-232C] setting onthe [SYSTEM]-DF1 [MAIN]-F2 [HARDWARE] screen is set to [OFF]. (If this parameteris set to [PRINTER], data will be output to the printer instead of the SD memory card.)
• Up to 102 files can be displayed on the [HARDCOPY] screen.
Displaying and deleting files
Return to the list.(You can also return with any other key.)
[HARDCOPY]
[SYSTEM] screen
Select the file youwish to display
[VIEW]The file will be displayed.
To delete a file:Select the file youwish to delete[DELETE]A deletion confirmation dialog box will be dis-played. Execute
Cancel
To view hard copies of screens for which a screencopy interval was setUse the cursor keys on the [LIST] screen to move thecursor to an [AUTO COPY] file to display a thumbnail.Select the thumbnail whose screen you wish to viewwith the cursor keys and press the [VIEW] key to viewhard copies of screens for which a screen copy intervalwas set.
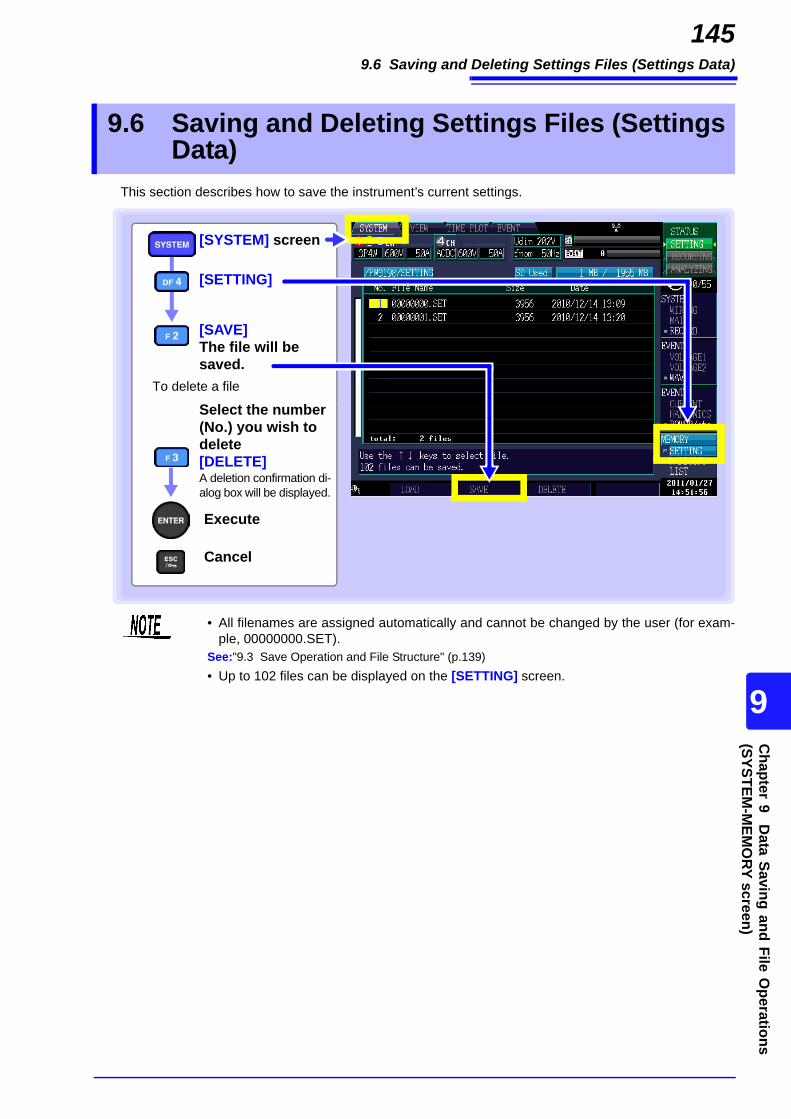
9.6 Saving and Deleting Settings Files (Settings Data)
145
89
Chapter 9 D
ata Saving and File Operations
9
(SYSTEM-M
EMO
RY screen)
This section describes how to save the instrument’s current settings.
9.6 Saving and Deleting Settings Files (Settings Data)
[SETTING]
[SAVE]The file will be saved.
To delete a file
Select the number (No.) you wish to delete[DELETE]A deletion confirmation di-alog box will be displayed.
[SYSTEM] screen
Execute
Cancel
• All filenames are assigned automatically and cannot be changed by the user (for exam-ple, 00000000.SET).
See:"9.3 Save Operation and File Structure" (p.139)• Up to 102 files can be displayed on the [SETTING] screen.
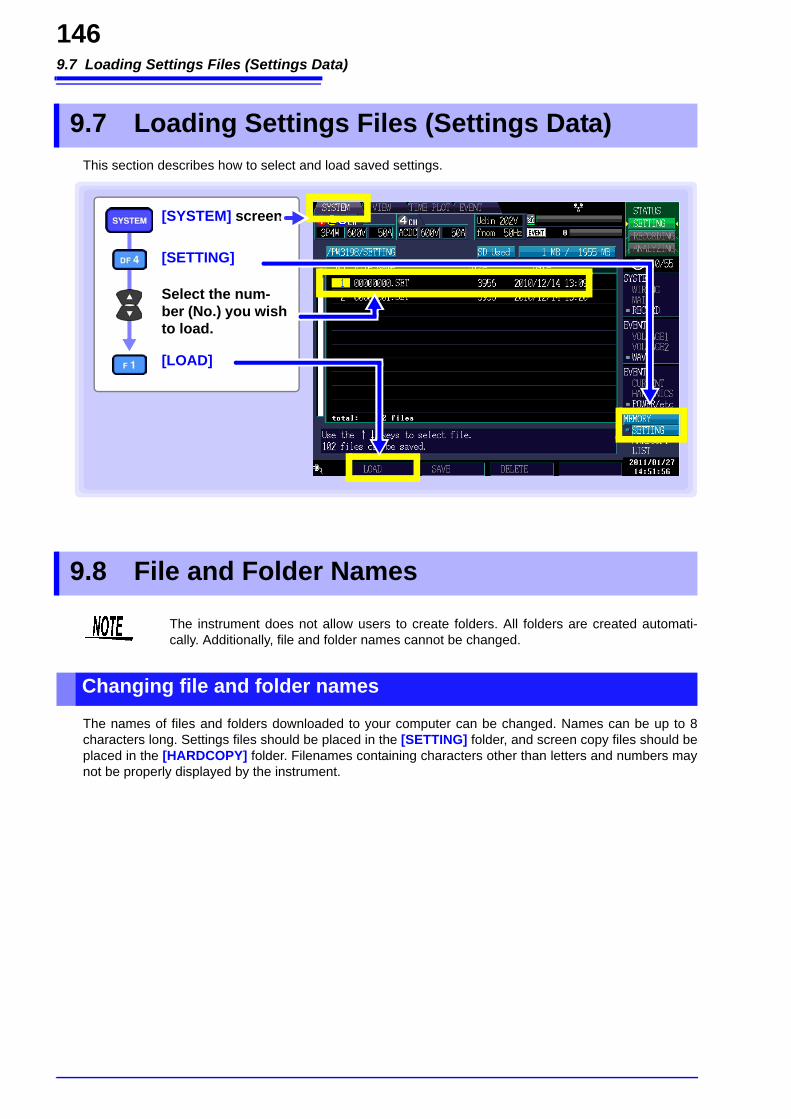
9.7 Loading Settings Files (Settings Data)
146
This section describes how to select and load saved settings.
The names of files and folders downloaded to your computer can be changed. Names can be up to 8characters long. Settings files should be placed in the [SETTING] folder, and screen copy files should beplaced in the [HARDCOPY] folder. Filenames containing characters other than letters and numbers maynot be properly displayed by the instrument.
9.7 Loading Settings Files (Settings Data)
[SETTING]
Select the num-ber (No.) you wish to load.
[LOAD]
[SYSTEM] screen
9.8 File and Folder Names
The instrument does not allow users to create folders. All folders are created automati-cally. Additionally, file and folder names cannot be changed.
Changing file and folder names
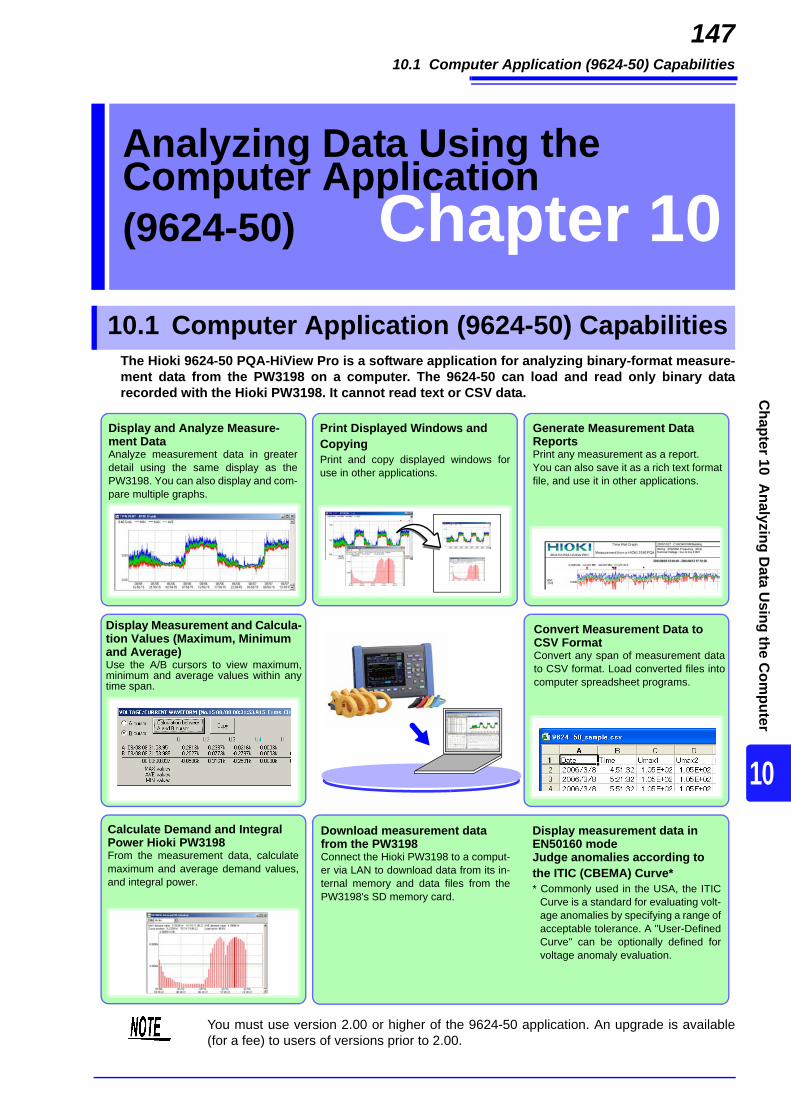
10.1 Computer Application (9624-50) Capabilities
147
10
Chapter 10 A
nalyzing Data U
sing the Com
puter
The Hioki 9624-50 PQA-HiView Pro is a software application for analyzing binary-format measure-ment data from the PW3198 on a computer. The 9624-50 can load and read only binary datarecorded with the Hioki PW3198. It cannot read text or CSV data.
Analyzing Data Using the Computer Application (9624-50) Chapter 10
10.1 Computer Application (9624-50) Capabilities
Download measurement data from the PW3198Connect the Hioki PW3198 to a comput-er via LAN to download data from its in-ternal memory and data files from thePW3198's SD memory card.
Display and Analyze Measure-ment Data Analyze measurement data in greaterdetail using the same display as thePW3198. You can also display and com-pare multiple graphs.
Print Displayed Windows and Copying Print and copy displayed windows foruse in other applications.
Convert Measurement Data to CSV Format Convert any span of measurement datato CSV format. Load converted files intocomputer spreadsheet programs.
Display Measurement and Calcula-tion Values (Maximum, Minimum and Average) Use the A/B cursors to view maximum,minimum and average values within anytime span.
Display measurement data in EN50160 mode Judge anomalies according to the ITIC (CBEMA) Curve* * Commonly used in the USA, the ITIC
Curve is a standard for evaluating volt-age anomalies by specifying a range ofacceptable tolerance. A "User-DefinedCurve" can be optionally defined forvoltage anomaly evaluation.
Generate Measurement DataReports Print any measurement as a report. You can also save it as a rich text formatfile, and use it in other applications.
Calculate Demand and Integral Power Hioki PW3198From the measurement data, calculatemaximum and average demand values,and integral power.
You must use version 2.00 or higher of the 9624-50 application. An upgrade is available(for a fee) to users of versions prior to 2.00.

10.2 Downloading Data from the SD Memory Card
148
Measurement data saved on the SD memory card can be downloaded to a computer using an SD mem-ory card reader or via the instrument’s LAN and USB functions.See: Connection method: "12.1 Downloading Measurement Data Using the USB Interface" (p.156),
"Connecting the Instrument to a Computer with an Ethernet ("LAN") Cable" (p.161)
See: More detailed information: See the 9624-50 PQA-HiView Pro Instruction Manual.
10.2 Downloading Data from the SD Memory Card
Data cannot be written from a connected computer to the SD memory card via a USB con-nection.
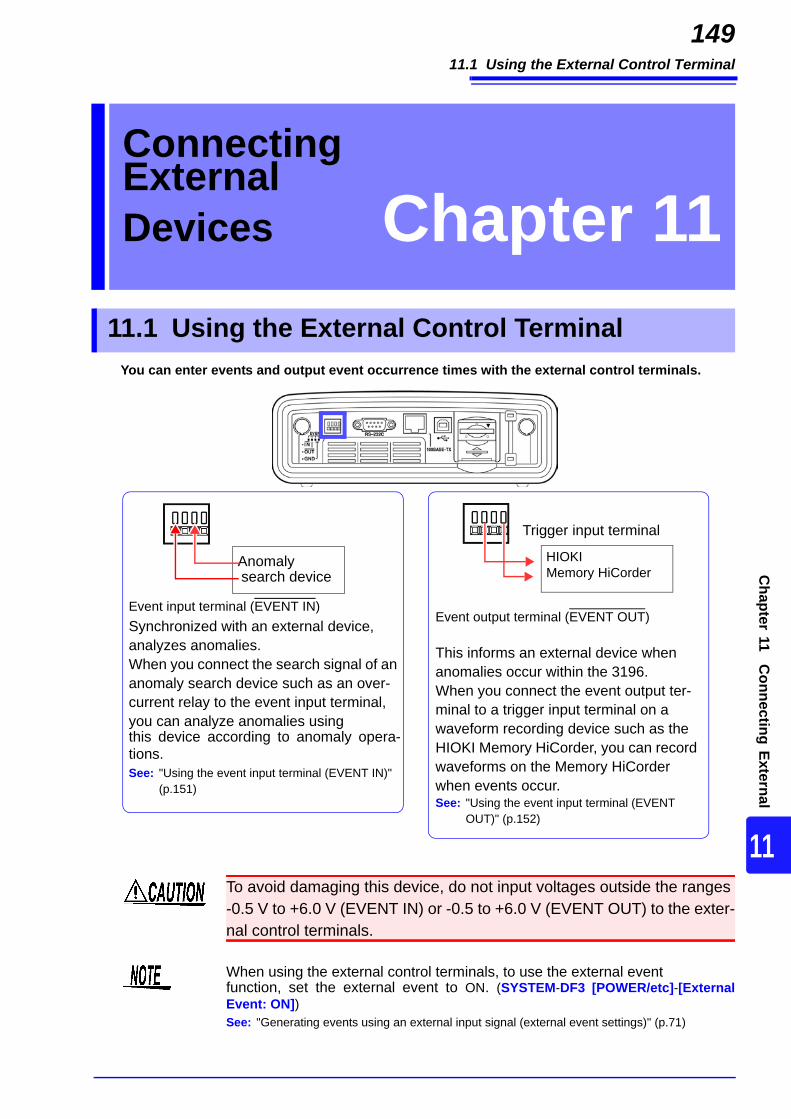
11.1 Using the External Control Terminal
149C
hapter 11 Connecting External
11
You can enter events and output event occurrence times with the external control terminals.
Connecting External Devices Chapter 11
11.1 Using the External Control Terminal
Event output terminal (EVENT OUT)
This informs an external device when anomalies occur within the 3196.When you connect the event output ter-minal to a trigger input terminal on a waveform recording device such as the HIOKI Memory HiCorder, you can record waveforms on the Memory HiCorder when events occur.See: "Using the event input terminal (EVENT
OUT)" (p.152)
Event input terminal (EVENT IN)Synchronized with an external device,analyzes anomalies.When you connect the search signal of an anomaly search device such as an over-current relay to the event input terminal, you can analyze anomalies usingthis device according to anomaly opera-tions.See: "Using the event input terminal (EVENT IN)"
(p.151)
HIOKIMemory HiCorder
Trigger input terminal
Anomalysearch device
To avoid damaging this device, do not input voltages outside the ranges -0.5 V to +6.0 V (EVENT IN) or -0.5 to +6.0 V (EVENT OUT) to the exter-nal control terminals.
When using the external control terminals, to use the external eventfunction, set the external event to ON. (SYSTEM-DF3 [POWER/etc]-[ExternalEvent: ON])See: "Generating events using an external input signal (external event settings)" (p.71)
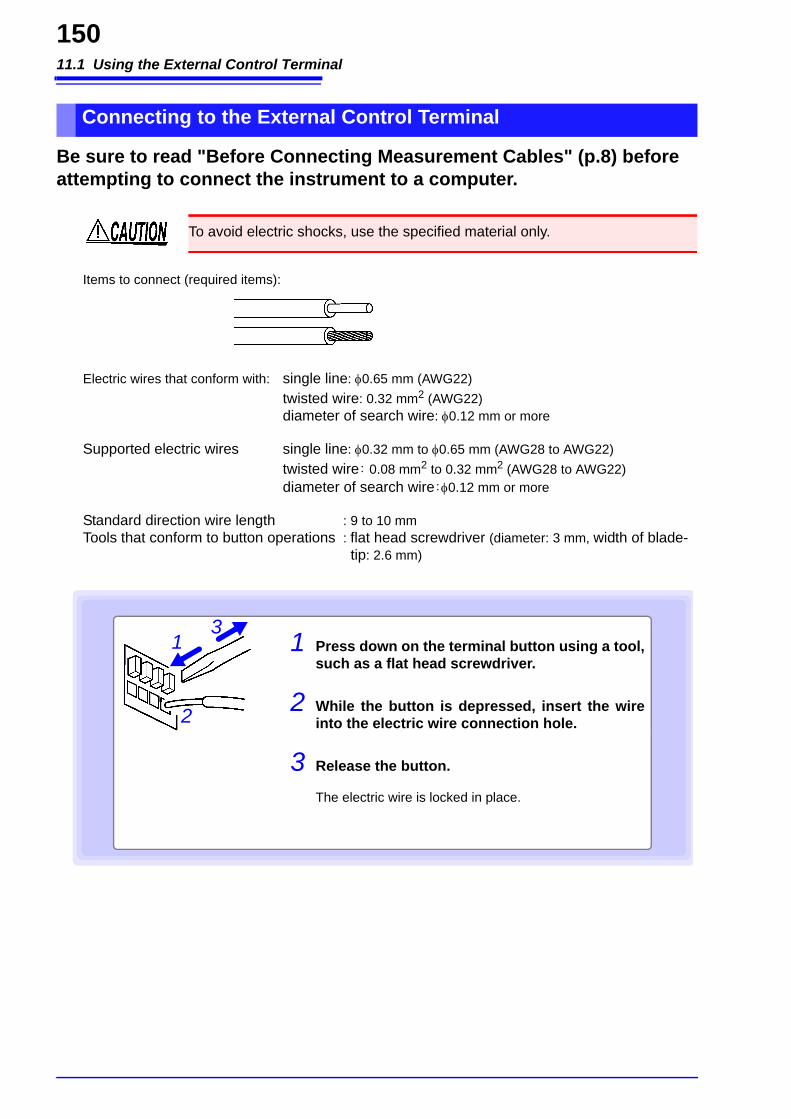
11.1 Using the External Control Terminal
150
Be sure to read "Before Connecting Measurement Cables" (p.8) before attempting to connect the instrument to a computer.
Items to connect (required items):
Electric wires that conform with: single line: 0.65 mm (AWG22)twisted wire: 0.32 mm2 (AWG22)diameter of search wire: 0.12 mm or more
Supported electric wires single line: 0.32 mm to 0.65 mm (AWG28 to AWG22)twisted wire: 0.08 mm2 to 0.32 mm2 (AWG28 to AWG22)diameter of search wire:0.12 mm or more
Standard direction wire length : 9 to 10 mmTools that conform to button operations : flat head screwdriver (diameter: 3 mm, width of blade-
tip: 2.6 mm)
Connecting to the External Control Terminal
To avoid electric shocks, use the specified material only.
1 Press down on the terminal button using a tool,such as a flat head screwdriver.
2 While the button is depressed, insert the wireinto the electric wire connection hole.
3 Release the button.
The electric wire is locked in place.
1
2
3

11.1 Using the External Control Terminal
151C
hapter 11 Connecting External
11
By inputting a signal to the event input terminal externally, you can make the PW3198 determine that anexternal event has occurred when that event was input. Similar to other events, you can record the volt-age and current waveforms, and the measurement values of external events.Using this device, you can analyze power anomalies that occur in other electrical equipment.
Short-circuit the terminal or input a pulse signal.Use the event input terminal (EVENT IN) and the ground terminal (GND).You can control the event input terminal by short-circuiting the terminal (active LOW) or dropping thepulse signal (1.0 V).
Using the event input terminal (EVENT IN)
To avoid damaging this device, do not input voltages outside the range -0.5 V to +6.0 V to the external control terminals.
Signal input methods
Input voltage range HIGH level : 3.0 to 5.0 VLOW level : 0 to 0.8 V
Maximum input voltage -0.5 to +6.0 V
30ms or more
170 ms or more

11.1 Using the External Control Terminal
152
This indicates events occurring externally that were synchronized with events occurring internally for thisdevice.
Usage method 1. Connect a warning device.This is a good way to output warnings when events such an interruptions occur.
Usage method 2. Connect to the trigger input terminal of a Memory HiCorder.This allows you to record waveforms on the Memory HiCorder when events occur on the PW3198.You can record between 14 and 16 waveforms on the 3196 when events occur. When you want to recordwaveforms for a longer period of time, use the 3196 in parallel with a Memory HiCorder.
If an event occurs in the PW3198, a pulse signal is output.Use the event output terminal (EVENT OUT) and the ground terminal (GND).
Using the event input terminal (EVENT OUT)
To avoid damaging this device, do not input voltages outside the -0.5 V to +6.0 Vrange to the external control terminal.
Signal output method
Output signal Open collector output (includes voltage output)Active LOW
Output voltage range
HIGH level: 4.5 to 5.0 VLOW level: 0 to 0.5 V
Pulse width LOW level: longer than 10 ms
Maximum input voltage
-0.5 V to +6.0 V
10ms or more(with the short pulse setting)

11.1 Using the External Control Terminal
153C
hapter 11 Connecting External
11
By setting the [External Out] setting to [Long Pulse], the instrument can be configured to generateevent output for the 2300 ENKAKU and similar hardware.
Event output can be set for ENKAKU.
Accept thesetting
[HARDWARE]
[External Out]
[MAIN]
[SYSTEM]screen
Display the pull-down menu
Select [LongPulse]
Cancel
• When the START event occurs, no pulse signal (Low pulse) is output from the event out-put terminal.
• The pulse signal from the event output terminal is held Low for about 2.5 seconds. Whenevents occur continuously (but for not more than 2.5 seconds each), the signal goes Lowat the first event, and remains Low until about 1.5 seconds after the last event occurs.

11.1 Using the External Control Terminal
154
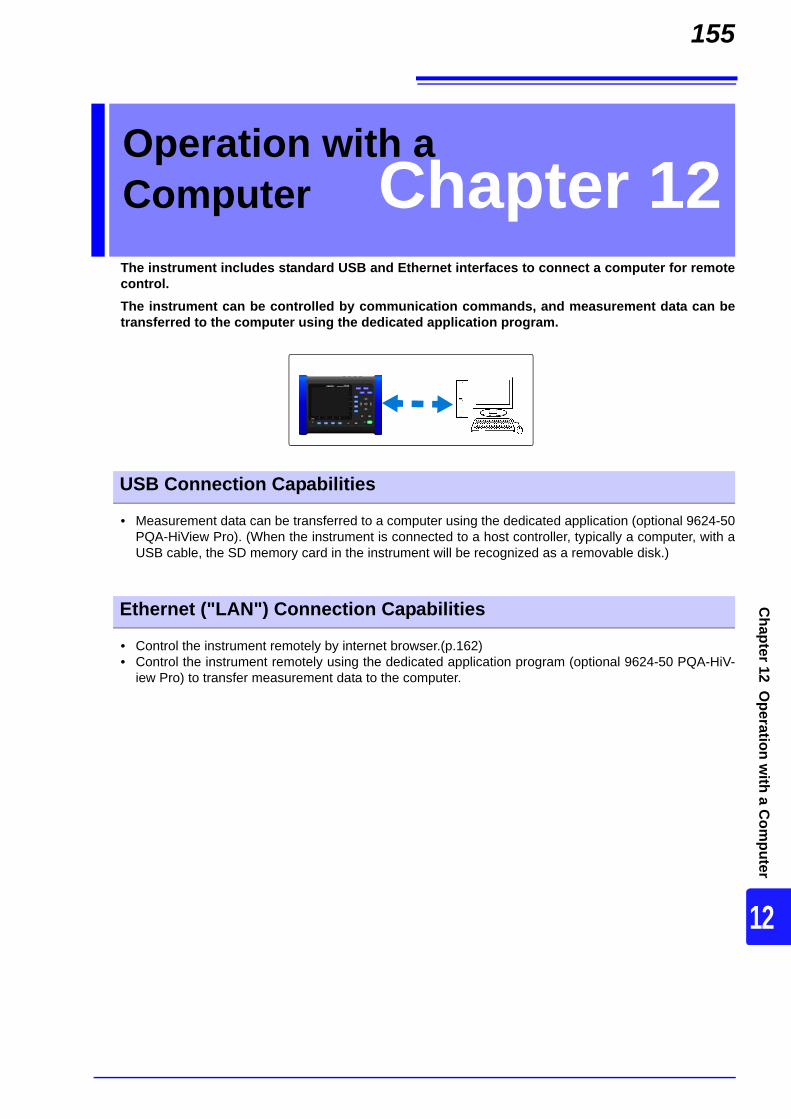
155
8
Chapter 12 O
peration with a C
omputer
12
The instrument includes standard USB and Ethernet interfaces to connect a computer for remotecontrol.The instrument can be controlled by communication commands, and measurement data can betransferred to the computer using the dedicated application program.
• Measurement data can be transferred to a computer using the dedicated application (optional 9624-50PQA-HiView Pro). (When the instrument is connected to a host controller, typically a computer, with aUSB cable, the SD memory card in the instrument will be recognized as a removable disk.)
• Control the instrument remotely by internet browser.(p.162)• Control the instrument remotely using the dedicated application program (optional 9624-50 PQA-HiV-
iew Pro) to transfer measurement data to the computer.
Operation with a Computer Chapter 12
USB Connection Capabilities
Ethernet ("LAN") Connection Capabilities
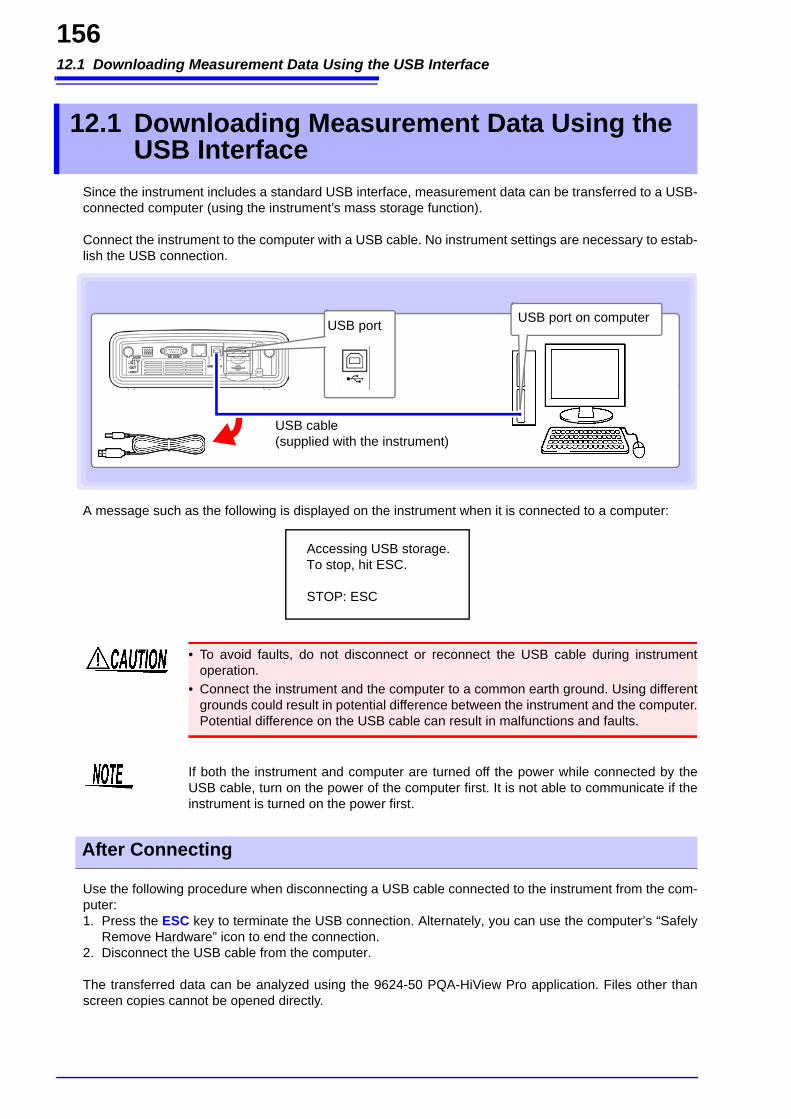
12.1 Downloading Measurement Data Using the USB Interface
156
Since the instrument includes a standard USB interface, measurement data can be transferred to a USB-connected computer (using the instrument’s mass storage function).
Connect the instrument to the computer with a USB cable. No instrument settings are necessary to estab-lish the USB connection.
A message such as the following is displayed on the instrument when it is connected to a computer:
Use the following procedure when disconnecting a USB cable connected to the instrument from the com-puter:1. Press the ESC key to terminate the USB connection. Alternately, you can use the computer’s “Safely
Remove Hardware” icon to end the connection. 2. Disconnect the USB cable from the computer.
The transferred data can be analyzed using the 9624-50 PQA-HiView Pro application. Files other thanscreen copies cannot be opened directly.
12.1 Downloading Measurement Data Using the USB Interface
• To avoid faults, do not disconnect or reconnect the USB cable during instrumentoperation.
• Connect the instrument and the computer to a common earth ground. Using differentgrounds could result in potential difference between the instrument and the computer.Potential difference on the USB cable can result in malfunctions and faults.
If both the instrument and computer are turned off the power while connected by theUSB cable, turn on the power of the computer first. It is not able to communicate if theinstrument is turned on the power first.
After Connecting
USB port USB port on computer
USB cable (supplied with the instrument)
Accessing USB storage.To stop, hit ESC.
STOP: ESC
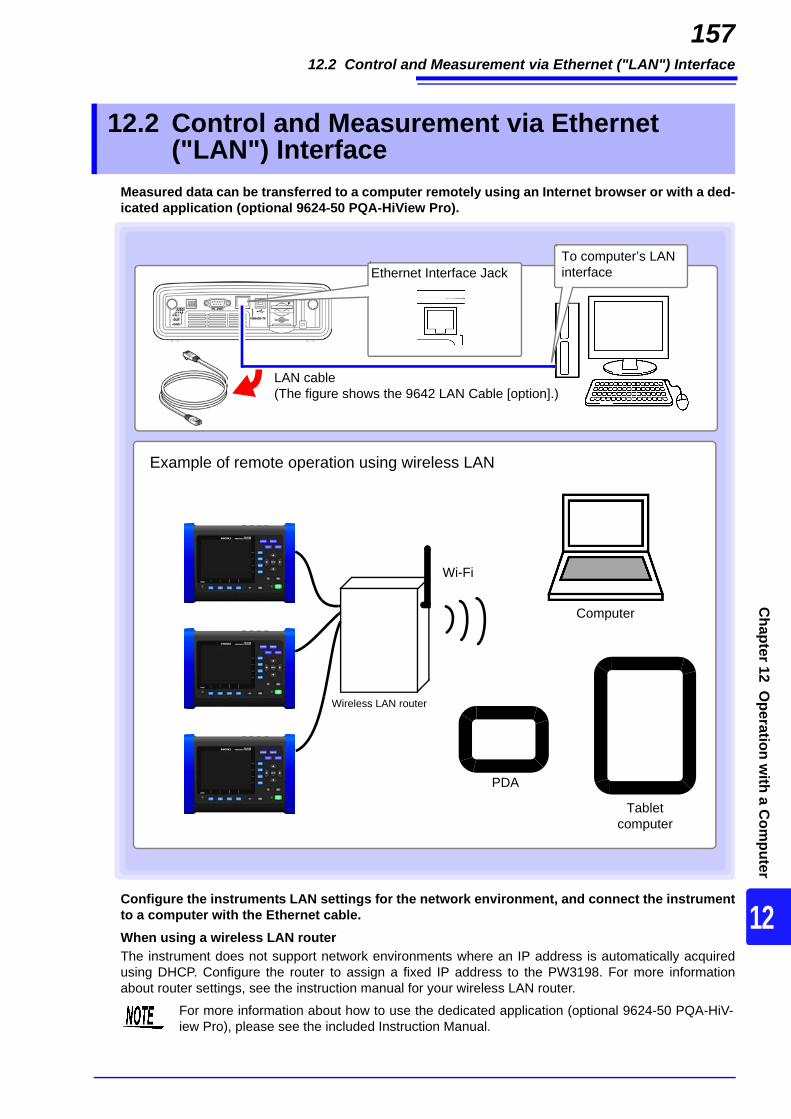
12.2 Control and Measurement via Ethernet ("LAN") Interface
157
8
Chapter 12 O
peration with a C
omputer
12
Measured data can be transferred to a computer remotely using an Internet browser or with a ded-icated application (optional 9624-50 PQA-HiView Pro).
Configure the instruments LAN settings for the network environment, and connect the instrumentto a computer with the Ethernet cable.When using a wireless LAN routerThe instrument does not support network environments where an IP address is automatically acquiredusing DHCP. Configure the router to assign a fixed IP address to the PW3198. For more informationabout router settings, see the instruction manual for your wireless LAN router.
12.2 Control and Measurement via Ethernet ("LAN") Interface
Ethernet Interface JackTo computer’s LAN interface
LAN cable(The figure shows the 9642 LAN Cable [option].)
Example of remote operation using wireless LAN
Wireless LAN router
Computer
PDA
Tablet computer
Wi-Fi
For more information about how to use the dedicated application (optional 9624-50 PQA-HiV-iew Pro), please see the included Instruction Manual.

12.2 Control and Measurement via Ethernet ("LAN") Interface
158
IP Address Identifies each device connected on a network.Each network device must be set to a unique address.The instrument supports IP version 4, with IP addresses indicated as four deci-mal octets, e.g., "192.168.0.1".
Subnet Mask This setting is used to distinguish the address of the network from the addressesof individual network devices.The normal value for this setting is the four decimal octets "255.255.255.0".
Default Gateway
When the computer and instrument are on different but overlapping networks(subnets), this IP address specifies the device to serve as the gateway betweenthe networks.If the computer and instrument are connected one-to-one, no gateway is used,and the instrument's default setting "0.0.0.0" can be kept as is.
LAN Settings and Network Environment Configuration
Configure the Instruments LAN Settings
• Make these settings before connecting to a network. Changing settings while connectedcan duplicate IP addresses of other network devices, and incorrect address informationmay otherwise be presented to the network.
• The instrument does not support DHCP (automatic IP address assignment) on a net-work.
[MAIN]
[SYSTEM]screen
Select a setting
Reboot the instrument when changing the networksettings.
[HARDWARE]
Select value to change
Select field
Increase or decrease value
Accept the setting
Cancel
Setting Items
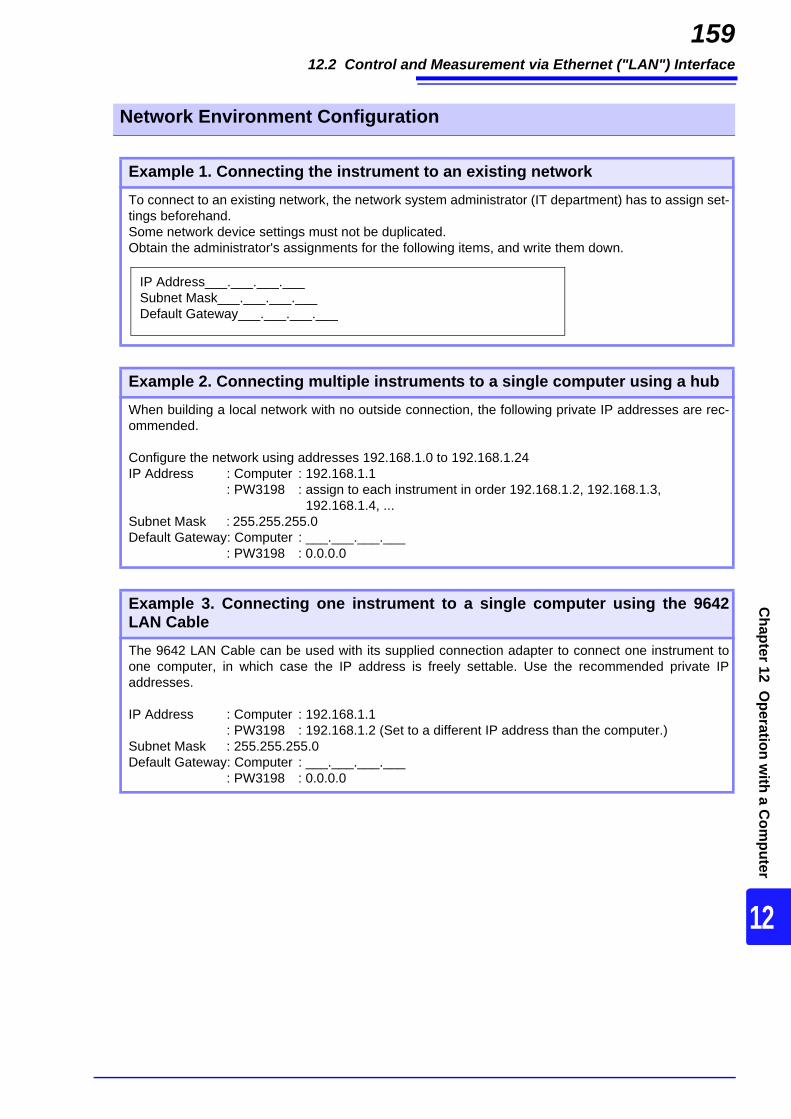
12.2 Control and Measurement via Ethernet ("LAN") Interface
159
8
Chapter 12 O
peration with a C
omputer
12
Network Environment Configuration
Example 1. Connecting the instrument to an existing networkTo connect to an existing network, the network system administrator (IT department) has to assign set-tings beforehand.Some network device settings must not be duplicated.Obtain the administrator's assignments for the following items, and write them down.
IP Address___.___.___.___Subnet Mask___.___.___.___Default Gateway___.___.___.___
Example 2. Connecting multiple instruments to a single computer using a hubWhen building a local network with no outside connection, the following private IP addresses are rec-ommended.
Configure the network using addresses 192.168.1.0 to 192.168.1.24IP Address : Computer : 192.168.1.1
: PW3198 : assign to each instrument in order 192.168.1.2, 192.168.1.3, 192.168.1.4, ...
Subnet Mask : 255.255.255.0Default Gateway: Computer : ___.___.___.___
: PW3198 : 0.0.0.0
Example 3. Connecting one instrument to a single computer using the 9642LAN CableThe 9642 LAN Cable can be used with its supplied connection adapter to connect one instrument toone computer, in which case the IP address is freely settable. Use the recommended private IPaddresses.
IP Address : Computer : 192.168.1.1: PW3198 : 192.168.1.2 (Set to a different IP address than the computer.)
Subnet Mask : 255.255.255.0Default Gateway: Computer : ___.___.___.___
: PW3198 : 0.0.0.0
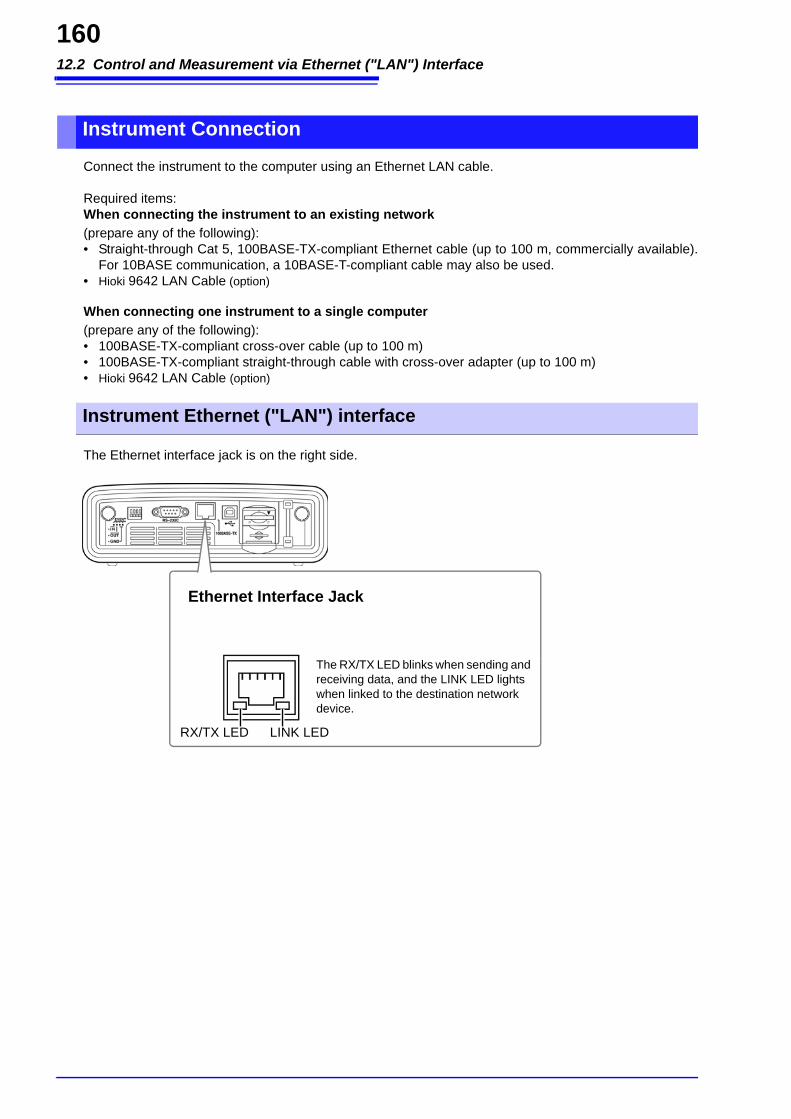
12.2 Control and Measurement via Ethernet ("LAN") Interface
160
Connect the instrument to the computer using an Ethernet LAN cable.
Required items:When connecting the instrument to an existing network(prepare any of the following):• Straight-through Cat 5, 100BASE-TX-compliant Ethernet cable (up to 100 m, commercially available).
For 10BASE communication, a 10BASE-T-compliant cable may also be used.• Hioki 9642 LAN Cable (option)
When connecting one instrument to a single computer(prepare any of the following):• 100BASE-TX-compliant cross-over cable (up to 100 m)• 100BASE-TX-compliant straight-through cable with cross-over adapter (up to 100 m)• Hioki 9642 LAN Cable (option)
The Ethernet interface jack is on the right side.
Instrument Connection
Instrument Ethernet ("LAN") interface
RX/TX LED LINK LED
The RX/TX LED blinks when sending and receiving data, and the LINK LED lights when linked to the destination network device.
Ethernet Interface Jack
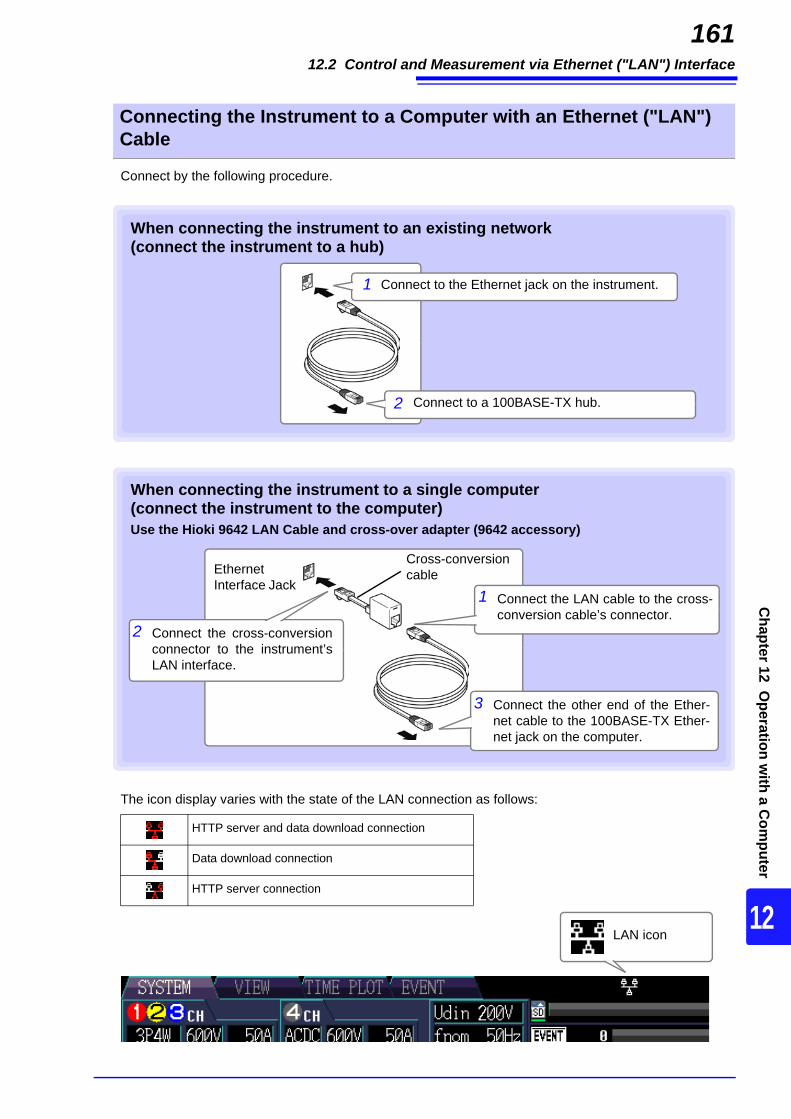
12.2 Control and Measurement via Ethernet ("LAN") Interface
161
8
Chapter 12 O
peration with a C
omputer
12
Connect by the following procedure.
The icon display varies with the state of the LAN connection as follows:
Connecting the Instrument to a Computer with an Ethernet ("LAN") Cable
Connect to the Ethernet jack on the instrument.
Connect to a 100BASE-TX hub.
1
2
When connecting the instrument to an existing network (connect the instrument to a hub)
When connecting the instrument to a single computer (connect the instrument to the computer)
Ethernet Interface Jack
Cross-conversion cable
Use the Hioki 9642 LAN Cable and cross-over adapter (9642 accessory)
1 Connect the LAN cable to the cross-conversion cable’s connector.
Connect the cross-conversionconnector to the instrument’sLAN interface.
2
Connect the other end of the Ether-net cable to the 100BASE-TX Ether-net jack on the computer.
3
HTTP server and data download connection
Data download connection
HTTP server connection
LAN icon
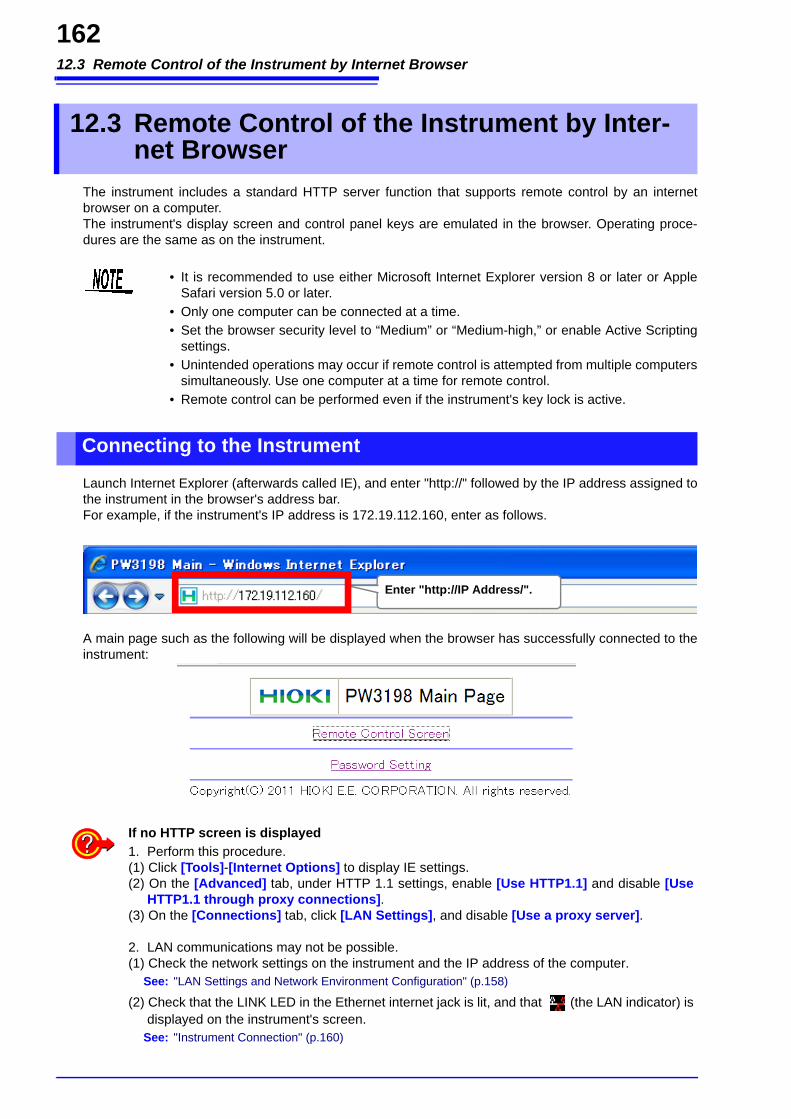
12.3 Remote Control of the Instrument by Internet Browser
162
The instrument includes a standard HTTP server function that supports remote control by an internetbrowser on a computer. The instrument's display screen and control panel keys are emulated in the browser. Operating proce-dures are the same as on the instrument.
Launch Internet Explorer (afterwards called IE), and enter "http://" followed by the IP address assigned tothe instrument in the browser's address bar.For example, if the instrument's IP address is 172.19.112.160, enter as follows.
A main page such as the following will be displayed when the browser has successfully connected to theinstrument:
12.3 Remote Control of the Instrument by Inter-net Browser
• It is recommended to use either Microsoft Internet Explorer version 8 or later or AppleSafari version 5.0 or later.
• Only one computer can be connected at a time.• Set the browser security level to “Medium” or “Medium-high,” or enable Active Scripting
settings. • Unintended operations may occur if remote control is attempted from multiple computers
simultaneously. Use one computer at a time for remote control.• Remote control can be performed even if the instrument's key lock is active.
Connecting to the Instrument
Enter "http://IP Address/".
If no HTTP screen is displayed1. Perform this procedure.(1) Click [Tools]-[Internet Options] to display IE settings.(2) On the [Advanced] tab, under HTTP 1.1 settings, enable [Use HTTP1.1] and disable [Use
HTTP1.1 through proxy connections].(3) On the [Connections] tab, click [LAN Settings], and disable [Use a proxy server].
2. LAN communications may not be possible.(1) Check the network settings on the instrument and the IP address of the computer.
See: "LAN Settings and Network Environment Configuration" (p.158)
(2) Check that the LINK LED in the Ethernet internet jack is lit, and that (the LAN indicator) isdisplayed on the instrument's screen.
See: "Instrument Connection" (p.160)
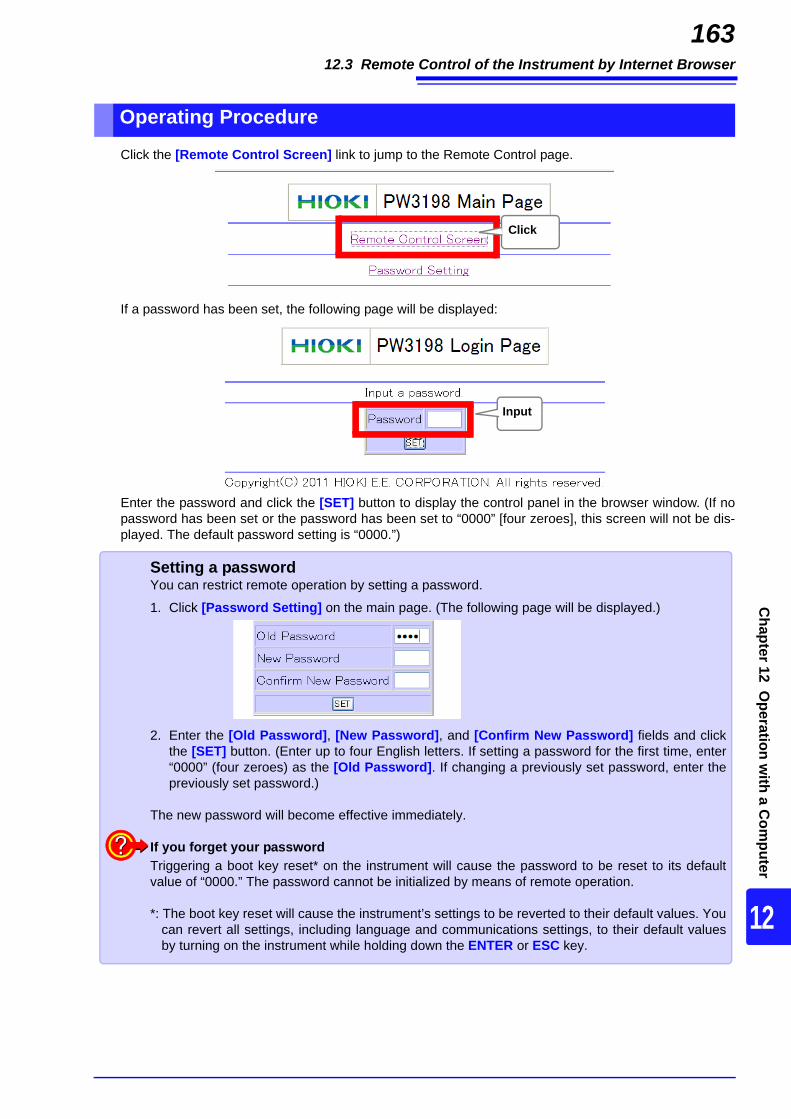
12.3 Remote Control of the Instrument by Internet Browser
163
8
Chapter 12 O
peration with a C
omputer
12
Click the [Remote Control Screen] link to jump to the Remote Control page.
If a password has been set, the following page will be displayed:
Enter the password and click the [SET] button to display the control panel in the browser window. (If nopassword has been set or the password has been set to “0000” [four zeroes], this screen will not be dis-played. The default password setting is “0000.”)
Operating Procedure
Click
Input
Setting a passwordYou can restrict remote operation by setting a password.
1. Click [Password Setting] on the main page. (The following page will be displayed.)
2. Enter the [Old Password], [New Password], and [Confirm New Password] fields and clickthe [SET] button. (Enter up to four English letters. If setting a password for the first time, enter“0000” (four zeroes) as the [Old Password]. If changing a previously set password, enter thepreviously set password.)
The new password will become effective immediately.
If you forget your passwordTriggering a boot key reset* on the instrument will cause the password to be reset to its defaultvalue of “0000.” The password cannot be initialized by means of remote operation.
*: The boot key reset will cause the instrument’s settings to be reverted to their default values. Youcan revert all settings, including language and communications settings, to their default valuesby turning on the instrument while holding down the ENTER or ESC key.

12.4 Converting Binary Data to Text Data
164
Click on the control panel keys to perform the same operations as the instrument keys.To enable automatic browser screen updating, set the Update Time in the Auto Update menu
Auto display update
The instrument screen emulation updates at the specified interval.
The optional 9624-50 PQA-HiView Pro application can be used to convert binary data to text data.For more information, see the 9624-50 instruction manual.
Auto display update
Control panel emulationInstrument screen emulation
Setting Contents:( : Default setting)
OFF, 0.5/ 1/ 2/ 5/ 10 sec
The displayed information may vary with the browser being used.
If the instrument does not accept key inputIs the browser's security level set to “High”, or has JavaScript been disabled?Change the browser's security setting to Medium or Medium-high.
12.4 Converting Binary Data to Text Data

13.1 Environmental Safety Specifications
165
10
13
Chapter 13 Specifications
SpecificationsChapter 1313.1 Environmental Safety Specifications
Operating environment Indoors, altitude up to 3,000 m (measurement category is lowered to 600 V Cat III when above 2,000 m), Pollution degree 2
Storage temperature and humidity -20 to 50°C (-4 to 122°F) 80% RH or less (non-condensating)(If the instrument will not be used for an extended period of time, remove the battery pack and store in a cool location [from -20 to 30°C (-4 to 86°F)].)
Operating temperature and humidity 0 to 50°C (32 to 122°F) 80% RH or less (non-condensating)Dust and water resistance IP30 (EN60529)Applicable standards Safety EN61010
EMC EN61326 Class A, EN61000-3-2, EN61000-3-3Maximum input voltage Voltage input section 1000 VAC, DC±600 V, max. peak voltage ±6000 Vpk
Current input section 3 VAC, DC±4.24 VMaximum rated voltage to earth Voltage input terminal 600 V (Measurement Categories IV, anticipated transient overvoltage 8000 V)Dielectric strength 6.88 kVrms (@50/60 Hz, 1 mA sense current)
Between voltage measurement jacks (U1 to U3) and voltage measurement jacks (U4)4.30 kVrms (1 mA@50/60 Hz, 1 mA sense current)Between voltage input terminal (U1 to U3) and current input terminals/interfacesBetween voltage (U4) and current measurement jacks, and interface jacks
13.2 General SpecificationsInput SpecificationsMeasurement line type One single-phase 2-wire (1P2W), single-phase 3-wire (1P3W), three-phase 3-wire
(3P3W2M,3P4W2.5E) or three-phase 4-wire (3P4W) plus one extra input channel(must be synchronized to reference channel during AC/DC measurement)
Number of input channels Voltage: 4 channels U1 to U4Current: 4 channels I1 to I4
Input methods Voltage: Isolated and differential inputs (Between U1,U2 and U3: channels not isolated, Between U1 to U3 and U4: channels isolated)
Current: Insulated clamp sensors (voltage output)Input resistance Voltage: 4 M80 k (differential inputs)
Current: 100 kΩ 10 kMeasurement ranges Voltage measurement: 600.00 V; transient measurement: 6000 Vpk
Current measurement: Using clamp sensors (×10, ×5, ×1 range, max. 2 ranges)Note: Only CH4 can be configured separately.
Crest factor Voltage measurement: 2 (in 600 V range); transient overvoltage measurement: 1 (in 6,000 Vpk range); current measurement: 4 (with f.s. input)
Measurement method Simultaneous digital sampling of voltage and current,Sampling frequency RMS voltage and current, active power, etc. : 200 kHz
Transient overvoltage measurement : 2 MHzHarmonic/inter-harmonic analysis : 4,096 points, 10/12 cycles (50/60 Hz) or 4096 points,
80 cycles (400 Hz)A/D converter resolution RMS voltage and current: 16bit; transient overvoltage measurement: 12bitCompatible clamp sensors Units with f.s. = 0.5 V output at rated current input (f.s.=0.5 V recommended)
Units with rate of 0.1 mV/A, 1 mV/A, 10 mV/A, or 100 mV/A

13.2 General Specifications
166
Basic SpecificationsBackup lithium battery life Clock and settings (Lithium battery), Approx. 10 years @23°C (@73.4°F)Real-Time Clock function Auto-calendar, leap-year correcting 24-hour clockReal-time clock accuracy ±0.3 s per day (instrument on, 23°C±5°C (73°F±9°F)
±1 s per day (instrument on, within operating temperature and humidity range)±3 s per day (instrument off, @23°C (@73.4°F))
Memory data capacity SD memory card/ SDHC memory card 2G to 32GBMaximum recording period 55 weeks (with repeated recording settings of [1 Week], 55 iterations)
55 days (with repeated recording settings of [1 Day], 55 iterations)35 days (with repeated recording settings of [OFF])
Maximum recordable events 55000 events (with repeated recording on)1000 events (with repeated recording off)
Power supply Z1002 AC Adapter (12 VDC)Rated supply voltage : 100 VAC to 240 VAC (Voltage fluctuations of 10% from the rated
supply voltage are taken into account.)Rated power supply frequency : 50/60 Hz, maximum rated current:1.7 A, anticipated transient
overvoltage 2500 VAnticipated transient overvoltage: 2500 VZ1003 Battery Pack (Ni-MH 7.2VDC 4500 mAh)
Recharge function The battery pack charges regardless of whether the instrument is on or off.Charge time: Max. 5 hr. 30 min. @23°C (@73.4°F)Charging temperature range: 10°C to 35°C (50°F to 95°F)
Maximum rated power 35 VA (when charging)15 VA (when not charging)
Continuous battery operation time Approx. 180 min. (@23°C (@73.4°F), when using Z1003 Battery Pack)Dimensions Approx. 300 W× 211 H × 68 D mm (11.81" W × 8.31" H × 2.68" D) (excluding protrusions)Mass Approx. 2.2 kg (77.6 oz.) (excluding battery pack)
Mass of battery pack: Approx. 365 g (12.9 oz.)Power supply quality measurement method
IEEE1159, IEC61000-4-30Ed2:2008
Display specificationsDisplay 6.5-inch TFT color LCD (640×480 dots)
Display defects: 5 or fewer dead pixels, 1 or fewer bright pixels
External Interface Specifications(1) SD card InterfaceSlot SD standard compliant × 1Compatible card SD memory card/ SDHC memory card (Use only HIOKI-approved SD memory cards)Supported memory capacity SD memory card: Up to 2GB, SDHC memory card: Up to 32GBFunctions Saving of binary data (settings data) (up to 9,999 files)
Up to 100 files of measurement data can be saved on the same date.Saving of settings files (up to 102 files)Loading of settings files (up to 102 files)Saving of screen copies (up to 99,999,999 files)Loading of screen copiesFormatting of SD memory cardsDeleting of files
Media full processing Saving of data to SD memory card is stopped (time series data is stored on a first-in, first-out basis.)
(2) RS-232C InterfaceConnector D-sub9 pin ×1Method RS-232C “EIA RS-232D”, “CCITT V.24”, “JIS XS101” compliantConnection destination Printer, GPS box (cannot be connected to computer)Functions Printer : Printing of screen copies
GPS : Measurement and control using GPS-synchronized time
(3) LAN InterfaceConnector RJ-45 × 1Electrical specifications IEEE 802.3-compliant EthernetTransmission method 10BASE-T/ 100BASE-TXProtocol TCP/IP
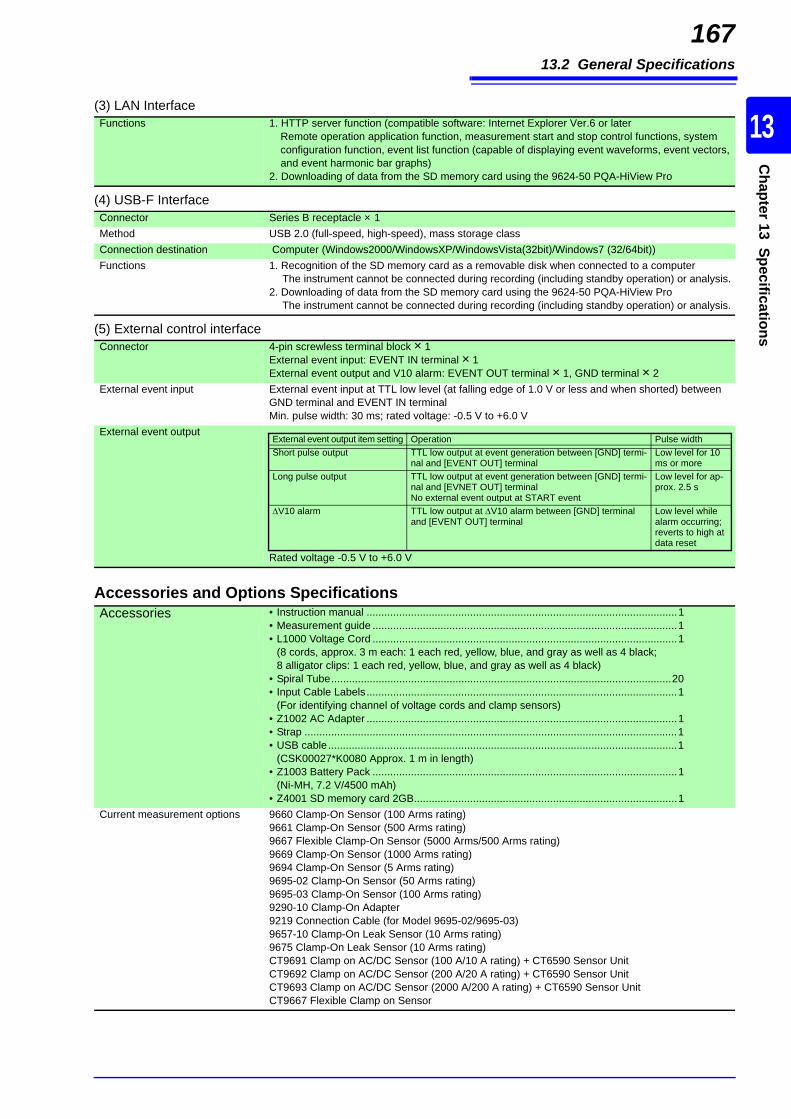
13.2 General Specifications
167
10
13
Chapter 13 Specifications
Functions 1. HTTP server function (compatible software: Internet Explorer Ver.6 or laterRemote operation application function, measurement start and stop control functions, system configuration function, event list function (capable of displaying event waveforms, event vectors, and event harmonic bar graphs)
2. Downloading of data from the SD memory card using the 9624-50 PQA-HiView Pro
(3) LAN Interface
(4) USB-F InterfaceConnector Series B receptacle × 1Method USB 2.0 (full-speed, high-speed), mass storage classConnection destination Computer (Windows2000/WindowsXP/WindowsVista(32bit)/Windows7 (32/64bit))Functions 1. Recognition of the SD memory card as a removable disk when connected to a computer
The instrument cannot be connected during recording (including standby operation) or analysis.2. Downloading of data from the SD memory card using the 9624-50 PQA-HiView Pro
The instrument cannot be connected during recording (including standby operation) or analysis.
(5) External control interfaceConnector 4-pin screwless terminal block × 1
External event input: EVENT IN terminal × 1External event output and V10 alarm: EVENT OUT terminal × 1, GND terminal × 2
External event input External event input at TTL low level (at falling edge of 1.0 V or less and when shorted) between GND terminal and EVENT IN terminalMin. pulse width: 30 ms; rated voltage: -0.5 V to +6.0 V
External event output
Rated voltage -0.5 V to +6.0 V
External event output item setting Operation Pulse widthShort pulse output TTL low output at event generation between [GND] termi-
nal and [EVENT OUT] terminalLow level for 10 ms or more
Long pulse output TTL low output at event generation between [GND] termi-nal and [EVNET OUT] terminalNo external event output at START event
Low level for ap-prox. 2.5 s
V10 alarm TTL low output at V10 alarm between [GND] terminal and [EVENT OUT] terminal
Low level while alarm occurring; reverts to high at data reset
Accessories and Options SpecificationsAccessories • Instruction manual .........................................................................................................1
• Measurement guide .......................................................................................................1• L1000 Voltage Cord .......................................................................................................1
(8 cords, approx. 3 m each: 1 each red, yellow, blue, and gray as well as 4 black; 8 alligator clips: 1 each red, yellow, blue, and gray as well as 4 black)
• Spiral Tube...................................................................................................................20• Input Cable Labels.........................................................................................................1
(For identifying channel of voltage cords and clamp sensors)• Z1002 AC Adapter .........................................................................................................1• Strap ..............................................................................................................................1 • USB cable......................................................................................................................1
(CSK00027*K0080 Approx. 1 m in length)• Z1003 Battery Pack .......................................................................................................1
(Ni-MH, 7.2 V/4500 mAh)• Z4001 SD memory card 2GB.........................................................................................1
Current measurement options 9660 Clamp-On Sensor (100 Arms rating)9661 Clamp-On Sensor (500 Arms rating)9667 Flexible Clamp-On Sensor (5000 Arms/500 Arms rating)9669 Clamp-On Sensor (1000 Arms rating)9694 Clamp-On Sensor (5 Arms rating)9695-02 Clamp-On Sensor (50 Arms rating)9695-03 Clamp-On Sensor (100 Arms rating)9290-10 Clamp-On Adapter9219 Connection Cable (for Model 9695-02/9695-03)9657-10 Clamp-On Leak Sensor (10 Arms rating)9675 Clamp-On Leak Sensor (10 Arms rating)CT9691 Clamp on AC/DC Sensor (100 A/10 A rating) + CT6590 Sensor UnitCT9692 Clamp on AC/DC Sensor (200 A/20 A rating) + CT6590 Sensor UnitCT9693 Clamp on AC/DC Sensor (2000 A/200 A rating) + CT6590 Sensor UnitCT9667 Flexible Clamp on Sensor
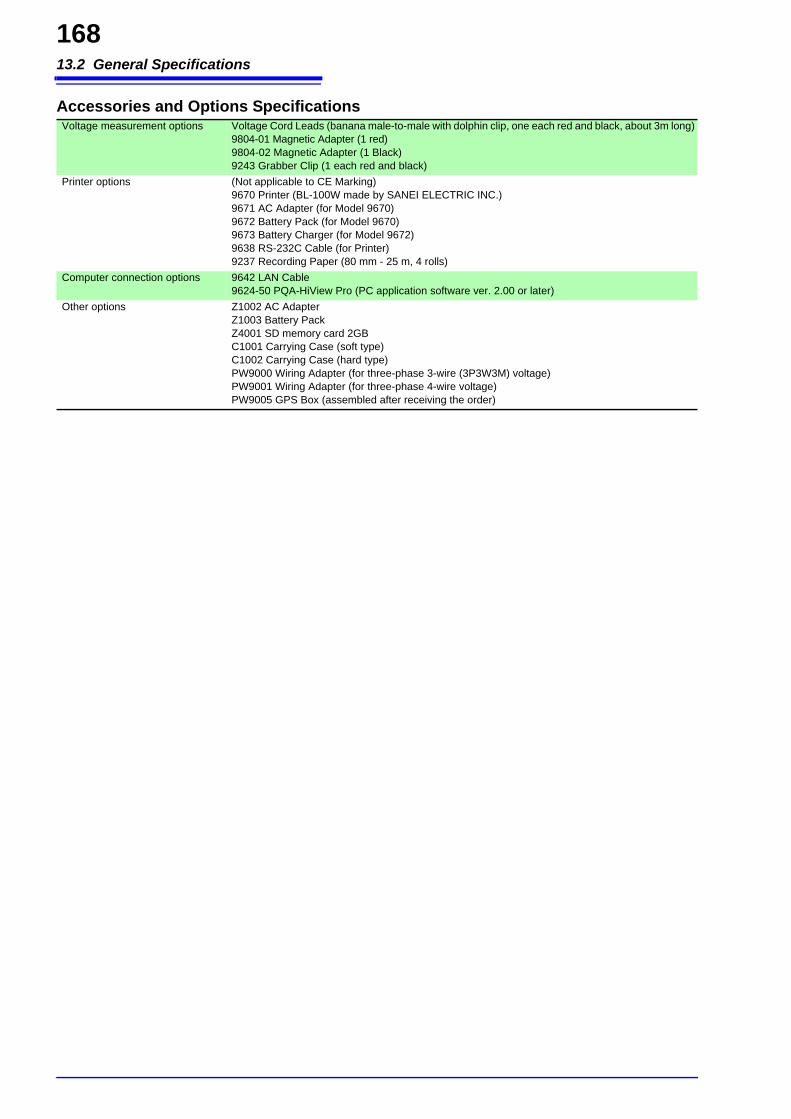
13.2 General Specifications
168
Voltage measurement options Voltage Cord Leads (banana male-to-male with dolphin clip, one each red and black, about 3m long)9804-01 Magnetic Adapter (1 red)9804-02 Magnetic Adapter (1 Black)9243 Grabber Clip (1 each red and black)
Printer options (Not applicable to CE Marking)9670 Printer (BL-100W made by SANEI ELECTRIC INC.)9671 AC Adapter (for Model 9670)9672 Battery Pack (for Model 9670)9673 Battery Charger (for Model 9672)9638 RS-232C Cable (for Printer) 9237 Recording Paper (80 mm - 25 m, 4 rolls)
Computer connection options 9642 LAN Cable9624-50 PQA-HiView Pro (PC application software ver. 2.00 or later)
Other options Z1002 AC AdapterZ1003 Battery PackZ4001 SD memory card 2GBC1001 Carrying Case (soft type)C1002 Carrying Case (hard type)PW9000 Wiring Adapter (for three-phase 3-wire (3P3W3M) voltage)PW9001 Wiring Adapter (for three-phase 4-wire voltage)PW9005 GPS Box (assembled after receiving the order)
Accessories and Options Specifications
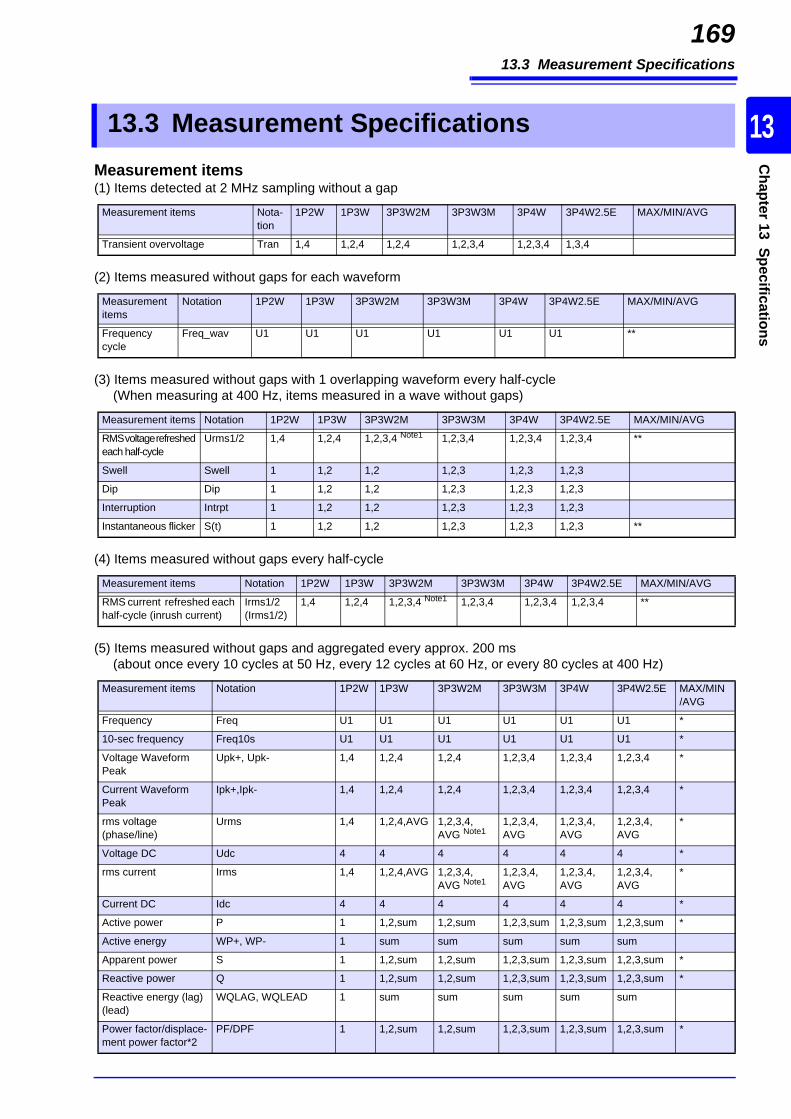
13.3 Measurement Specifications
169
10
13
Chapter 13 Specifications
13.3 Measurement SpecificationsMeasurement items(1) Items detected at 2 MHz sampling without a gap
Measurement items Nota-tion
1P2W 1P3W 3P3W2M 3P3W3M 3P4W 3P4W2.5E MAX/MIN/AVG
Transient overvoltage Tran 1,4 1,2,4 1,2,4 1,2,3,4 1,2,3,4 1,3,4
(2) Items measured without gaps for each waveform
Measurement items
Notation 1P2W 1P3W 3P3W2M 3P3W3M 3P4W 3P4W2.5E MAX/MIN/AVG
Frequency cycle
Freq_wav U1 U1 U1 U1 U1 U1 **
(3) Items measured without gaps with 1 overlapping waveform every half-cycle(When measuring at 400 Hz, items measured in a wave without gaps)
Measurement items Notation 1P2W 1P3W 3P3W2M 3P3W3M 3P4W 3P4W2.5E MAX/MIN/AVG
RMS voltage refreshed each half-cycle
Urms1/2 1,4 1,2,4 1,2,3,4 Note1 1,2,3,4 1,2,3,4 1,2,3,4 **
Swell Swell 1 1,2 1,2 1,2,3 1,2,3 1,2,3
Dip Dip 1 1,2 1,2 1,2,3 1,2,3 1,2,3
Interruption Intrpt 1 1,2 1,2 1,2,3 1,2,3 1,2,3
Instantaneous flicker S(t) 1 1,2 1,2 1,2,3 1,2,3 1,2,3 **
(4) Items measured without gaps every half-cycle
Measurement items Notation 1P2W 1P3W 3P3W2M 3P3W3M 3P4W 3P4W2.5E MAX/MIN/AVG
RMS current refreshed each half-cycle (inrush current)
Irms1/2 (Irms1/2)
1,4 1,2,4 1,2,3,4 Note1 1,2,3,4 1,2,3,4 1,2,3,4 **
(5) Items measured without gaps and aggregated every approx. 200 ms (about once every 10 cycles at 50 Hz, every 12 cycles at 60 Hz, or every 80 cycles at 400 Hz)
Measurement items Notation 1P2W 1P3W 3P3W2M 3P3W3M 3P4W 3P4W2.5E MAX/MIN/AVG
Frequency Freq U1 U1 U1 U1 U1 U1 *
10-sec frequency Freq10s U1 U1 U1 U1 U1 U1 *
Voltage Waveform Peak
Upk+, Upk- 1,4 1,2,4 1,2,4 1,2,3,4 1,2,3,4 1,2,3,4 *
Current Waveform Peak
Ipk+,Ipk- 1,4 1,2,4 1,2,4 1,2,3,4 1,2,3,4 1,2,3,4 *
rms voltage(phase/line)
Urms 1,4 1,2,4,AVG 1,2,3,4,AVG Note1
1,2,3,4,AVG
1,2,3,4,AVG
1,2,3,4,AVG
*
Voltage DC Udc 4 4 4 4 4 4 *
rms current Irms 1,4 1,2,4,AVG 1,2,3,4,AVG Note1
1,2,3,4,AVG
1,2,3,4,AVG
1,2,3,4,AVG
*
Current DC Idc 4 4 4 4 4 4 *
Active power P 1 1,2,sum 1,2,sum 1,2,3,sum 1,2,3,sum 1,2,3,sum *
Active energy WP+, WP- 1 sum sum sum sum sum
Apparent power S 1 1,2,sum 1,2,sum 1,2,3,sum 1,2,3,sum 1,2,3,sum *
Reactive power Q 1 1,2,sum 1,2,sum 1,2,3,sum 1,2,3,sum 1,2,3,sum *
Reactive energy (lag) (lead)
WQLAG, WQLEAD 1 sum sum sum sum sum
Power factor/displace-ment power factor*2
PF/DPF 1 1,2,sum 1,2,sum 1,2,3,sum 1,2,3,sum 1,2,3,sum *
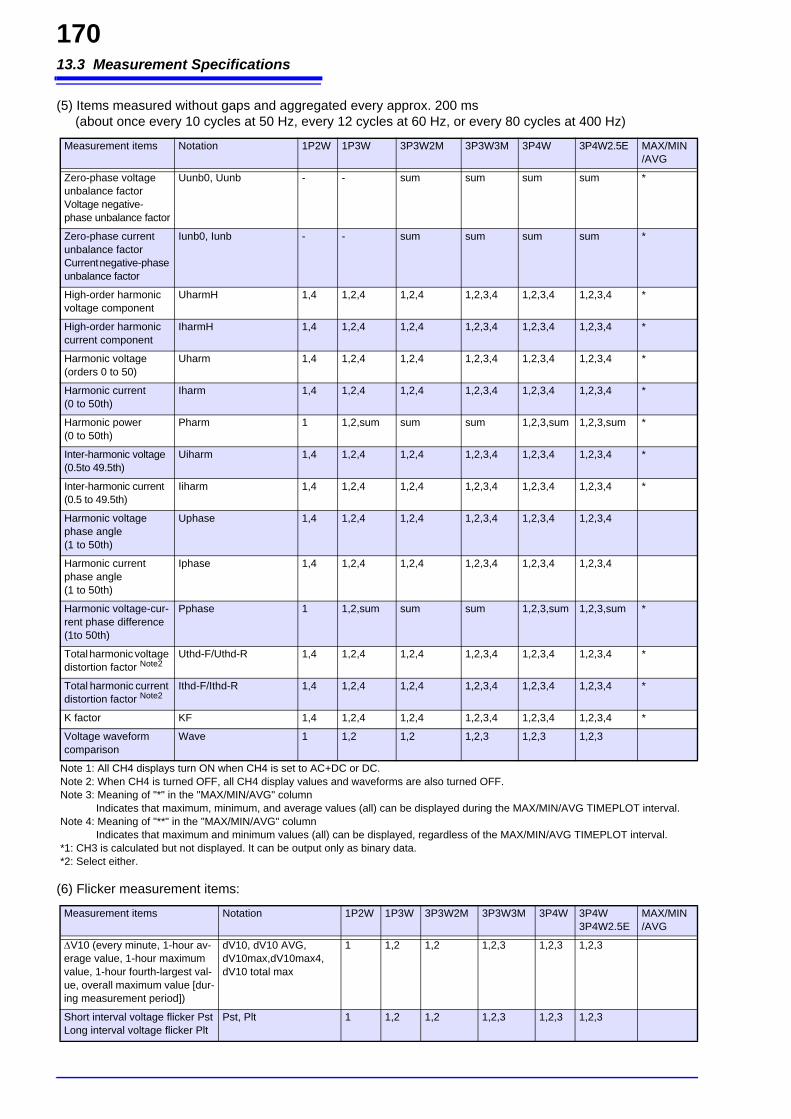
13.3 Measurement Specifications
170
Note 1: All CH4 displays turn ON when CH4 is set to AC+DC or DC.Note 2: When CH4 is turned OFF, all CH4 display values and waveforms are also turned OFF.Note 3: Meaning of "*" in the "MAX/MIN/AVG" column
Indicates that maximum, minimum, and average values (all) can be displayed during the MAX/MIN/AVG TIMEPLOT interval.Note 4: Meaning of "**" in the "MAX/MIN/AVG" column
Indicates that maximum and minimum values (all) can be displayed, regardless of the MAX/MIN/AVG TIMEPLOT interval. *1: CH3 is calculated but not displayed. It can be output only as binary data.*2: Select either.
Zero-phase voltage unbalance factorVoltage negative-phase unbalance factor
Uunb0, Uunb - - sum sum sum sum *
Zero-phase current unbalance factorCurrent negative-phase unbalance factor
Iunb0, Iunb - - sum sum sum sum *
High-order harmonic voltage component
UharmH 1,4 1,2,4 1,2,4 1,2,3,4 1,2,3,4 1,2,3,4 *
High-order harmonic current component
IharmH 1,4 1,2,4 1,2,4 1,2,3,4 1,2,3,4 1,2,3,4 *
Harmonic voltage (orders 0 to 50)
Uharm 1,4 1,2,4 1,2,4 1,2,3,4 1,2,3,4 1,2,3,4 *
Harmonic current(0 to 50th)
Iharm 1,4 1,2,4 1,2,4 1,2,3,4 1,2,3,4 1,2,3,4 *
Harmonic power(0 to 50th)
Pharm 1 1,2,sum sum sum 1,2,3,sum 1,2,3,sum *
Inter-harmonic voltage (0.5to 49.5th)
Uiharm 1,4 1,2,4 1,2,4 1,2,3,4 1,2,3,4 1,2,3,4 *
Inter-harmonic current (0.5 to 49.5th)
Iiharm 1,4 1,2,4 1,2,4 1,2,3,4 1,2,3,4 1,2,3,4 *
Harmonic voltage phase angle(1 to 50th)
Uphase 1,4 1,2,4 1,2,4 1,2,3,4 1,2,3,4 1,2,3,4
Harmonic current phase angle(1 to 50th)
Iphase 1,4 1,2,4 1,2,4 1,2,3,4 1,2,3,4 1,2,3,4
Harmonic voltage-cur-rent phase difference (1to 50th)
Pphase 1 1,2,sum sum sum 1,2,3,sum 1,2,3,sum *
Total harmonic voltage distortion factor Note2
Uthd-F/Uthd-R 1,4 1,2,4 1,2,4 1,2,3,4 1,2,3,4 1,2,3,4 *
Total harmonic current distortion factor Note2
Ithd-F/Ithd-R 1,4 1,2,4 1,2,4 1,2,3,4 1,2,3,4 1,2,3,4 *
K factor KF 1,4 1,2,4 1,2,4 1,2,3,4 1,2,3,4 1,2,3,4 *
Voltage waveform comparison
Wave 1 1,2 1,2 1,2,3 1,2,3 1,2,3
(5) Items measured without gaps and aggregated every approx. 200 ms (about once every 10 cycles at 50 Hz, every 12 cycles at 60 Hz, or every 80 cycles at 400 Hz)
Measurement items Notation 1P2W 1P3W 3P3W2M 3P3W3M 3P4W 3P4W2.5E MAX/MIN/AVG
(6) Flicker measurement items:
Measurement items Notation 1P2W 1P3W 3P3W2M 3P3W3M 3P4W 3P4W3P4W2.5E
MAX/MIN/AVG
V10 (every minute, 1-hour av-erage value, 1-hour maximum value, 1-hour fourth-largest val-ue, overall maximum value [dur-ing measurement period])
dV10, dV10 AVG, dV10max,dV10max4,dV10 total max
1 1,2 1,2 1,2,3 1,2,3 1,2,3
Short interval voltage flicker PstLong interval voltage flicker Plt
Pst, Plt 1 1,2 1,2 1,2,3 1,2,3 1,2,3
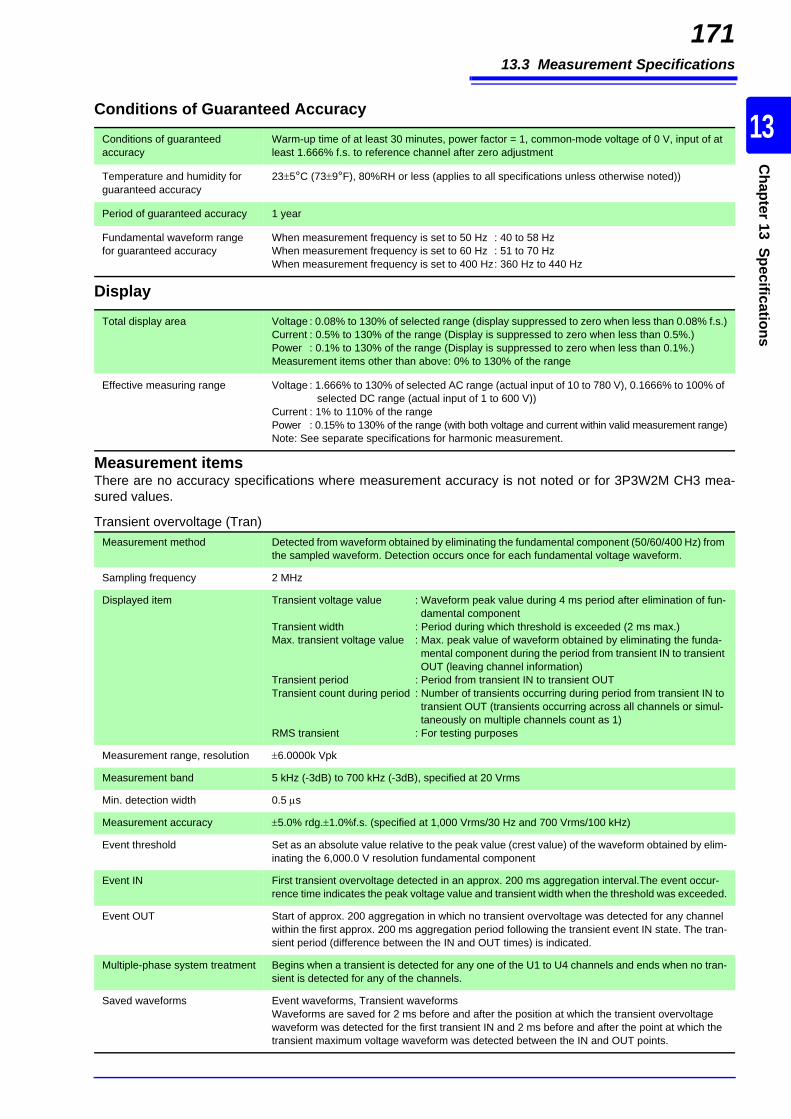
13.3 Measurement Specifications
171
10
13
Chapter 13 Specifications
Measurement itemsThere are no accuracy specifications where measurement accuracy is not noted or for 3P3W2M CH3 mea-sured values.
Conditions of Guaranteed Accuracy
Conditions of guaranteed accuracy
Warm-up time of at least 30 minutes, power factor = 1, common-mode voltage of 0 V, input of at least 1.666% f.s. to reference channel after zero adjustment
Temperature and humidity for guaranteed accuracy
235°C (739°F), 80%RH or less (applies to all specifications unless otherwise noted))
Period of guaranteed accuracy 1 year
Fundamental waveform range for guaranteed accuracy
When measurement frequency is set to 50 Hz : 40 to 58 HzWhen measurement frequency is set to 60 Hz : 51 to 70 HzWhen measurement frequency is set to 400 Hz: 360 Hz to 440 Hz
Display
Total display area Voltage : 0.08% to 130% of selected range (display suppressed to zero when less than 0.08% f.s.)Current : 0.5% to 130% of the range (Display is suppressed to zero when less than 0.5%.)Power : 0.1% to 130% of the range (Display is suppressed to zero when less than 0.1%.)Measurement items other than above: 0% to 130% of the range
Effective measuring range Voltage : 1.666% to 130% of selected AC range (actual input of 10 to 780 V), 0.1666% to 100% of selected DC range (actual input of 1 to 600 V))
Current : 1% to 110% of the rangePower : 0.15% to 130% of the range (with both voltage and current within valid measurement range)Note: See separate specifications for harmonic measurement.
Transient overvoltage (Tran)Measurement method Detected from waveform obtained by eliminating the fundamental component (50/60/400 Hz) from
the sampled waveform. Detection occurs once for each fundamental voltage waveform.
Sampling frequency 2 MHz
Displayed item Transient voltage value : Waveform peak value during 4 ms period after elimination of fun-damental component
Transient width : Period during which threshold is exceeded (2 ms max.)Max. transient voltage value : Max. peak value of waveform obtained by eliminating the funda-
mental component during the period from transient IN to transient OUT (leaving channel information)
Transient period : Period from transient IN to transient OUTTransient count during period : Number of transients occurring during period from transient IN to
transient OUT (transients occurring across all channels or simul-taneously on multiple channels count as 1)
RMS transient : For testing purposes
Measurement range, resolution 6.0000k Vpk
Measurement band 5 kHz (-3dB) to 700 kHz (-3dB), specified at 20 Vrms
Min. detection width 0.5 s
Measurement accuracy 5.0% rdg.1.0%f.s. (specified at 1,000 Vrms/30 Hz and 700 Vrms/100 kHz)
Event threshold Set as an absolute value relative to the peak value (crest value) of the waveform obtained by elim-inating the 6,000.0 V resolution fundamental component
Event IN First transient overvoltage detected in an approx. 200 ms aggregation interval.The event occur-rence time indicates the peak voltage value and transient width when the threshold was exceeded.
Event OUT Start of approx. 200 aggregation in which no transient overvoltage was detected for any channel within the first approx. 200 ms aggregation period following the transient event IN state. The tran-sient period (difference between the IN and OUT times) is indicated.
Multiple-phase system treatment Begins when a transient is detected for any one of the U1 to U4 channels and ends when no tran-sient is detected for any of the channels.
Saved waveforms Event waveforms, Transient waveformsWaveforms are saved for 2 ms before and after the position at which the transient overvoltage waveform was detected for the first transient IN and 2 ms before and after the point at which the transient maximum voltage waveform was detected between the IN and OUT points.
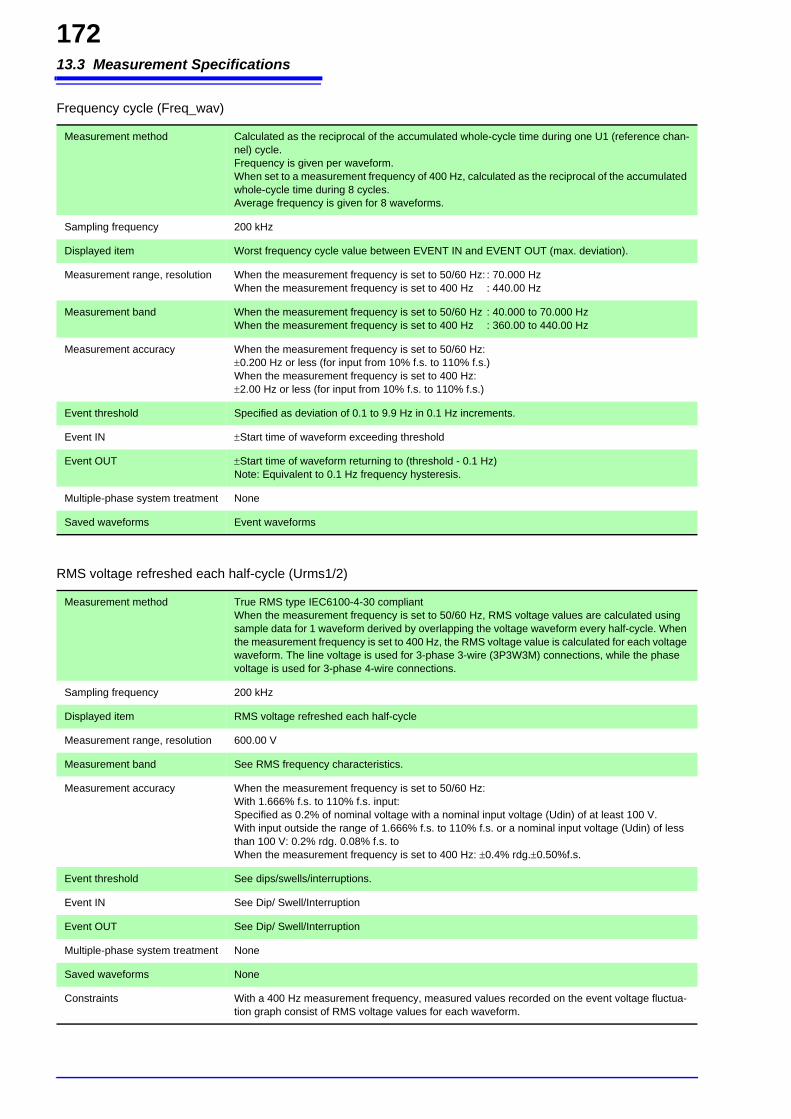
13.3 Measurement Specifications
172
Frequency cycle (Freq_wav)
Measurement method Calculated as the reciprocal of the accumulated whole-cycle time during one U1 (reference chan-nel) cycle. Frequency is given per waveform.When set to a measurement frequency of 400 Hz, calculated as the reciprocal of the accumulated whole-cycle time during 8 cycles.Average frequency is given for 8 waveforms.
Sampling frequency 200 kHz
Displayed item Worst frequency cycle value between EVENT IN and EVENT OUT (max. deviation).
Measurement range, resolution When the measurement frequency is set to 50/60 Hz: : 70.000 HzWhen the measurement frequency is set to 400 Hz : 440.00 Hz
Measurement band When the measurement frequency is set to 50/60 Hz : 40.000 to 70.000 HzWhen the measurement frequency is set to 400 Hz : 360.00 to 440.00 Hz
Measurement accuracy When the measurement frequency is set to 50/60 Hz:0.200 Hz or less (for input from 10% f.s. to 110% f.s.)When the measurement frequency is set to 400 Hz:2.00 Hz or less (for input from 10% f.s. to 110% f.s.)
Event threshold Specified as deviation of 0.1 to 9.9 Hz in 0.1 Hz increments.
Event IN Start time of waveform exceeding threshold
Event OUT Start time of waveform returning to (threshold - 0.1 Hz)Note: Equivalent to 0.1 Hz frequency hysteresis.
Multiple-phase system treatment None
Saved waveforms Event waveforms
RMS voltage refreshed each half-cycle (Urms1/2)
Measurement method True RMS type IEC6100-4-30 compliantWhen the measurement frequency is set to 50/60 Hz, RMS voltage values are calculated using sample data for 1 waveform derived by overlapping the voltage waveform every half-cycle. When the measurement frequency is set to 400 Hz, the RMS voltage value is calculated for each voltage waveform. The line voltage is used for 3-phase 3-wire (3P3W3M) connections, while the phase voltage is used for 3-phase 4-wire connections.
Sampling frequency 200 kHz
Displayed item RMS voltage refreshed each half-cycle
Measurement range, resolution 600.00 V
Measurement band See RMS frequency characteristics.
Measurement accuracy When the measurement frequency is set to 50/60 Hz: With 1.666% f.s. to 110% f.s. input: Specified as 0.2% of nominal voltage with a nominal input voltage (Udin) of at least 100 V.With input outside the range of 1.666% f.s. to 110% f.s. or a nominal input voltage (Udin) of less than 100 V: 0.2% rdg. 0.08% f.s. toWhen the measurement frequency is set to 400 Hz: 0.4% rdg.0.50%f.s.
Event threshold See dips/swells/interruptions.
Event IN See Dip/ Swell/Interruption
Event OUT See Dip/ Swell/Interruption
Multiple-phase system treatment None
Saved waveforms None
Constraints With a 400 Hz measurement frequency, measured values recorded on the event voltage fluctua-tion graph consist of RMS voltage values for each waveform.
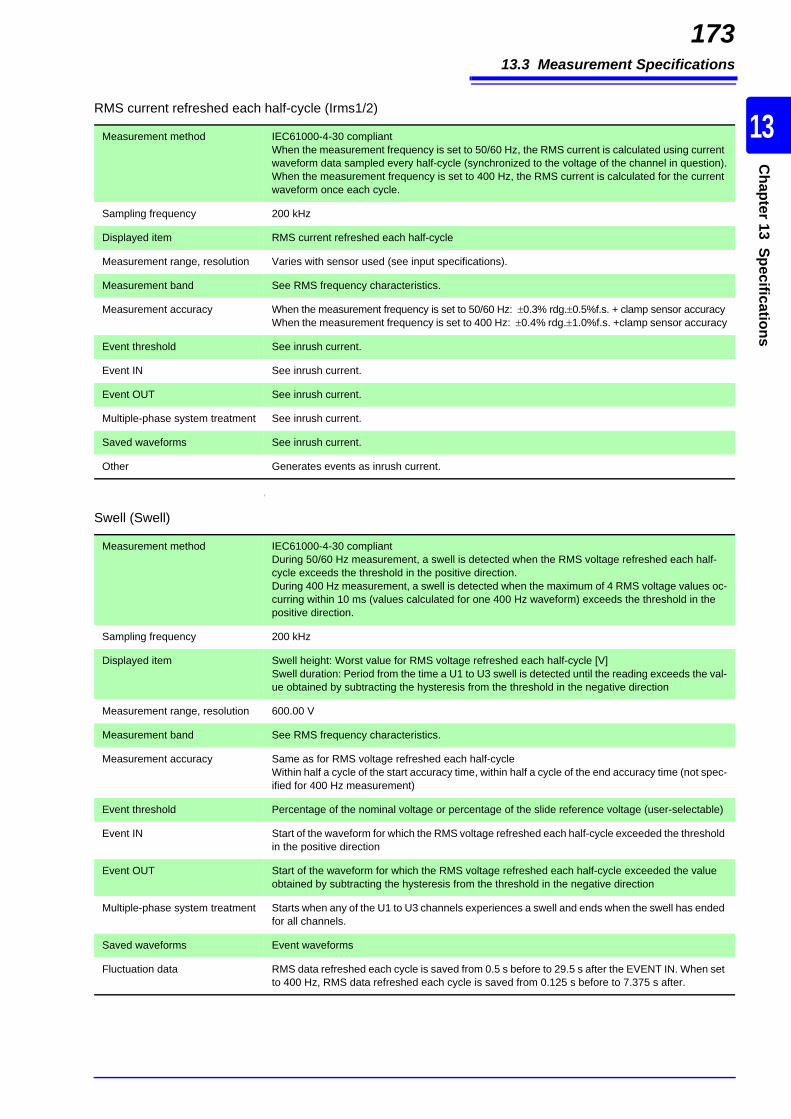
13.3 Measurement Specifications
173
10
13
Chapter 13 Specifications
l
RMS current refreshed each half-cycle (Irms1/2)
Measurement method IEC61000-4-30 compliantWhen the measurement frequency is set to 50/60 Hz, the RMS current is calculated using current waveform data sampled every half-cycle (synchronized to the voltage of the channel in question).When the measurement frequency is set to 400 Hz, the RMS current is calculated for the current waveform once each cycle.
Sampling frequency 200 kHz
Displayed item RMS current refreshed each half-cycle
Measurement range, resolution Varies with sensor used (see input specifications).
Measurement band See RMS frequency characteristics.
Measurement accuracy When the measurement frequency is set to 50/60 Hz: 0.3% rdg.0.5%f.s. + clamp sensor accuracyWhen the measurement frequency is set to 400 Hz: 0.4% rdg.1.0%f.s. +clamp sensor accuracy
Event threshold See inrush current.
Event IN See inrush current.
Event OUT See inrush current.
Multiple-phase system treatment See inrush current.
Saved waveforms See inrush current.
Other Generates events as inrush current.
Swell (Swell)
Measurement method IEC61000-4-30 compliantDuring 50/60 Hz measurement, a swell is detected when the RMS voltage refreshed each half-cycle exceeds the threshold in the positive direction. During 400 Hz measurement, a swell is detected when the maximum of 4 RMS voltage values oc-curring within 10 ms (values calculated for one 400 Hz waveform) exceeds the threshold in the positive direction.
Sampling frequency 200 kHz
Displayed item Swell height: Worst value for RMS voltage refreshed each half-cycle [V]Swell duration: Period from the time a U1 to U3 swell is detected until the reading exceeds the val-ue obtained by subtracting the hysteresis from the threshold in the negative direction
Measurement range, resolution 600.00 V
Measurement band See RMS frequency characteristics.
Measurement accuracy Same as for RMS voltage refreshed each half-cycleWithin half a cycle of the start accuracy time, within half a cycle of the end accuracy time (not spec-ified for 400 Hz measurement)
Event threshold Percentage of the nominal voltage or percentage of the slide reference voltage (user-selectable)
Event IN Start of the waveform for which the RMS voltage refreshed each half-cycle exceeded the threshold in the positive direction
Event OUT Start of the waveform for which the RMS voltage refreshed each half-cycle exceeded the value obtained by subtracting the hysteresis from the threshold in the negative direction
Multiple-phase system treatment Starts when any of the U1 to U3 channels experiences a swell and ends when the swell has ended for all channels.
Saved waveforms Event waveforms
Fluctuation data RMS data refreshed each cycle is saved from 0.5 s before to 29.5 s after the EVENT IN. When set to 400 Hz, RMS data refreshed each cycle is saved from 0.125 s before to 7.375 s after.

13.3 Measurement Specifications
174
Dip (Dip)
Measurement method IEC61000-4-30 compliantDuring 50/60 Hz measurement, a dip is detected when the RMS voltage refreshed each half-cycle exceeds the threshold in the negative direction.During 400 Hz measurement, a dip is detected when the minimum of 4 RMS voltage values occur-ring within 10 ms (values calculated for one 400 Hz waveform) exceeds the threshold in the neg-ative direction.
Sampling frequency 200 kHz
Displayed item Dip depth : Worst value for RMS voltage refreshed each half-cycle [V]Dip duration: Period from the time a U1 to U3 dip is detected until the reading exceeds the value
obtained by subtracting the hysteresis from the threshold in the positive direction
Measurement range, resolution 600.00 V
Measurement band See RMS frequency characteristics.
Measurement accuracy Same as for RMS voltage refreshed each half-cycleWithin half a cycle of the start accuracy time, within half a cycle of the end accuracy time (not spec-ified for 400 Hz measurement)
Event threshold Percentage of the nominal voltage or percentage of the slide reference voltage (user-selectable)
Event IN Start of the waveform for which the RMS voltage refreshed each half-cycle exceeded the threshold in the negative direction
Event OUT Start of the waveform for which the RMS voltage refreshed each half-cycle exceeded the value obtained by adding the hysteresis to the threshold in the negative direction
Multiple-phase system treatment Starts when any of the U1 to U3 channels experiences a dip and ends when the dip has ended for all channels.
Saved waveforms Event waveforms
Fluctuation data RMS data refreshed each cycle is saved from 0.5 s before to 29.5 s after the EVENT IN. When set to 400 Hz, RMS data refreshed each cycle is saved from 0.125 s before to 7.375 s after.
Interruption (Intrpt)
Measurement method IEC61000-4-30 compliantDuring 50/60 Hz measurement, an interruption is detected when the RMS voltage refreshed each half-cycle exceeds the threshold in the negative direction. During 400 Hz measurement, an interruption is detected when the minimum of 4 RMS voltage val-ues occurring within 10 ms (values calculated for one 400 Hz waveform) exceeds the threshold in the negative direction.
Sampling frequency 200 kHz
Displayed item Interruption depth : Worst value for RMS voltage refreshed each half-cycle [V]Interruption duration : Period from the time a U1 to U3 interruption is detected until the reading ex-
ceeds the value obtained by adding the hysteresis to the threshold in the positive direction
Measurement range, resolution 600.00 V
Measurement band See RMS frequency characteristics.
Measurement accuracy Same as for RMS voltage refreshed each half-cycleWithin half a cycle of the start accuracy time, within half a cycle of the end accuracy time (not spec-ified for 400 Hz measurement)
Event threshold Percentage of the nominal voltage
Event IN Start of the waveform for which the RMS voltage refreshed every cycle exceeded the threshold in the negative direction
Event OUT Start of the waveform for which the RMS voltage refreshed each half-cycle exceeded the value obtained by adding the hysteresis to the threshold in the positive direction
Multiple-phase system treatment Starts when all of the U1 to U3 channels experience an interruption and ends when the interruption ends for any of the channels.
Saved waveforms Event waveforms
Fluctuation data RMS data refreshed each cycle is saved from 0.5 s before to 29.5 s after the EVENT IN. When set to 400 Hz, RMS data refreshed each cycle is saved from 0.125 s before to 7.375 s after.
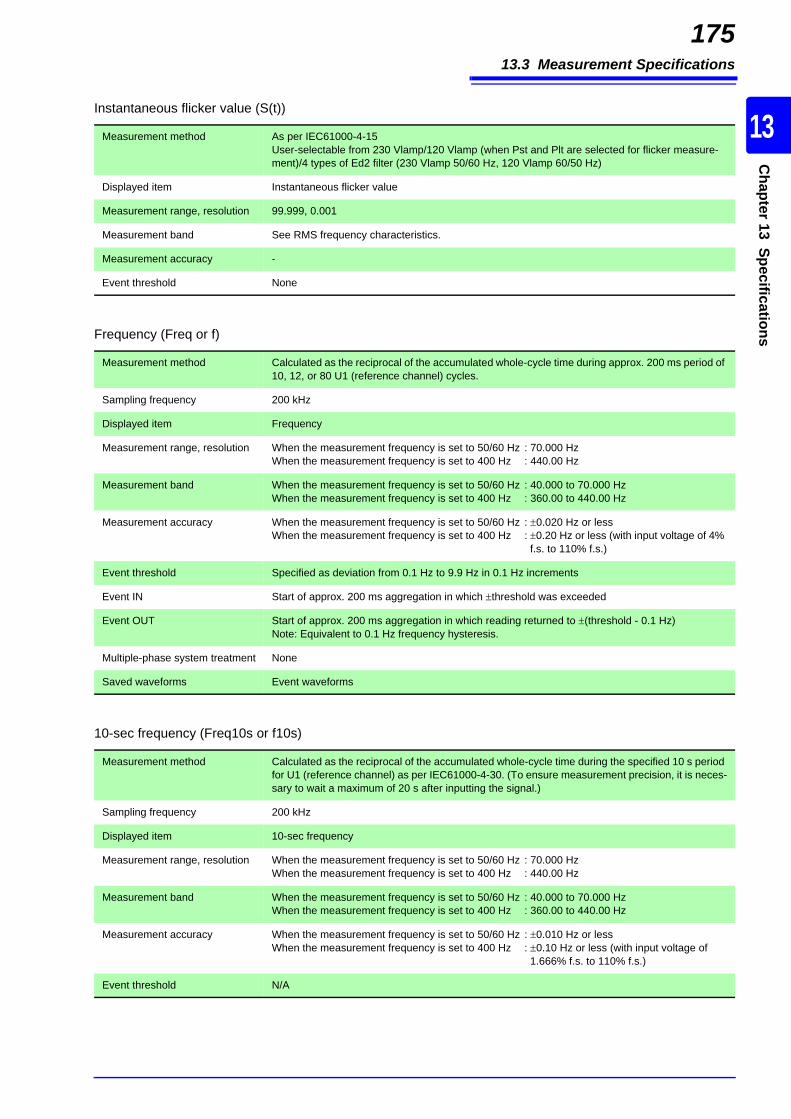
13.3 Measurement Specifications
175
10
13
Chapter 13 Specifications
Instantaneous flicker value (S(t))
Measurement method As per IEC61000-4-15User-selectable from 230 Vlamp/120 Vlamp (when Pst and Plt are selected for flicker measure-ment)/4 types of Ed2 filter (230 Vlamp 50/60 Hz, 120 Vlamp 60/50 Hz)
Displayed item Instantaneous flicker value
Measurement range, resolution 99.999, 0.001
Measurement band See RMS frequency characteristics.
Measurement accuracy -
Event threshold None
Frequency (Freq or f)
Measurement method Calculated as the reciprocal of the accumulated whole-cycle time during approx. 200 ms period of 10, 12, or 80 U1 (reference channel) cycles.
Sampling frequency 200 kHz
Displayed item Frequency
Measurement range, resolution When the measurement frequency is set to 50/60 Hz : 70.000 HzWhen the measurement frequency is set to 400 Hz : 440.00 Hz
Measurement band When the measurement frequency is set to 50/60 Hz : 40.000 to 70.000 HzWhen the measurement frequency is set to 400 Hz : 360.00 to 440.00 Hz
Measurement accuracy When the measurement frequency is set to 50/60 Hz : 0.020 Hz or lessWhen the measurement frequency is set to 400 Hz : 0.20 Hz or less (with input voltage of 4%
f.s. to 110% f.s.)
Event threshold Specified as deviation from 0.1 Hz to 9.9 Hz in 0.1 Hz increments
Event IN Start of approx. 200 ms aggregation in which threshold was exceeded
Event OUT Start of approx. 200 ms aggregation in which reading returned to (threshold - 0.1 Hz)Note: Equivalent to 0.1 Hz frequency hysteresis.
Multiple-phase system treatment None
Saved waveforms Event waveforms
10-sec frequency (Freq10s or f10s)
Measurement method Calculated as the reciprocal of the accumulated whole-cycle time during the specified 10 s period for U1 (reference channel) as per IEC61000-4-30. (To ensure measurement precision, it is neces-sary to wait a maximum of 20 s after inputting the signal.)
Sampling frequency 200 kHz
Displayed item 10-sec frequency
Measurement range, resolution When the measurement frequency is set to 50/60 Hz : 70.000 HzWhen the measurement frequency is set to 400 Hz : 440.00 Hz
Measurement band When the measurement frequency is set to 50/60 Hz : 40.000 to 70.000 HzWhen the measurement frequency is set to 400 Hz : 360.00 to 440.00 Hz
Measurement accuracy When the measurement frequency is set to 50/60 Hz : 0.010 Hz or lessWhen the measurement frequency is set to 400 Hz : 0.10 Hz or less (with input voltage of
1.666% f.s. to 110% f.s.)
Event threshold N/A
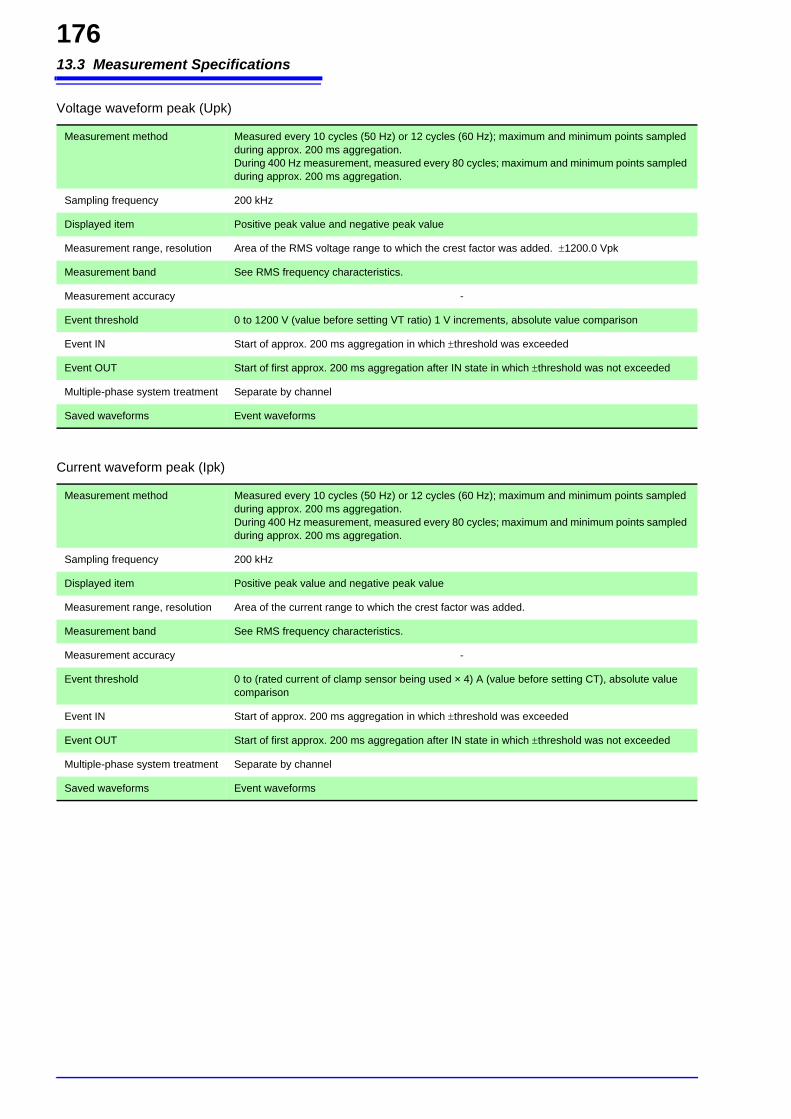
13.3 Measurement Specifications
176
Voltage waveform peak (Upk)
Measurement method Measured every 10 cycles (50 Hz) or 12 cycles (60 Hz); maximum and minimum points sampled during approx. 200 ms aggregation.During 400 Hz measurement, measured every 80 cycles; maximum and minimum points sampled during approx. 200 ms aggregation.
Sampling frequency 200 kHz
Displayed item Positive peak value and negative peak value
Measurement range, resolution Area of the RMS voltage range to which the crest factor was added. 1200.0 Vpk
Measurement band See RMS frequency characteristics.
Measurement accuracy -
Event threshold 0 to 1200 V (value before setting VT ratio) 1 V increments, absolute value comparison
Event IN Start of approx. 200 ms aggregation in which threshold was exceeded
Event OUT Start of first approx. 200 ms aggregation after IN state in which threshold was not exceeded
Multiple-phase system treatment Separate by channel
Saved waveforms Event waveforms
Current waveform peak (Ipk)
Measurement method Measured every 10 cycles (50 Hz) or 12 cycles (60 Hz); maximum and minimum points sampled during approx. 200 ms aggregation.During 400 Hz measurement, measured every 80 cycles; maximum and minimum points sampled during approx. 200 ms aggregation.
Sampling frequency 200 kHz
Displayed item Positive peak value and negative peak value
Measurement range, resolution Area of the current range to which the crest factor was added.
Measurement band See RMS frequency characteristics.
Measurement accuracy -
Event threshold 0 to (rated current of clamp sensor being used × 4) A (value before setting CT), absolute value comparison
Event IN Start of approx. 200 ms aggregation in which threshold was exceeded
Event OUT Start of first approx. 200 ms aggregation after IN state in which threshold was not exceeded
Multiple-phase system treatment Separate by channel
Saved waveforms Event waveforms

13.3 Measurement Specifications
177
10
13
Chapter 13 Specifications
RMS voltage (Urms)
Measurement method AC+DC True RMS typeIEC61000-4-30 compliant: 10 cycles (50 Hz) or 12 cycles (60 Hz) (approx. 200 ms aggregation)During 400 Hz measurement, calculated from 80 cycles (approx. 200 ms aggregation)When set to 3P3W3M/3P4W/3P4W2.5E, the phase voltage/line voltage setting is applied to the RMS voltage Urms.Includes zero suppression.
Sampling frequency 200 kHz
Displayed item RMS voltage for each channel and AVG (average) RMS voltage for multiple channels (for more information, "13.10 Calculation Formula" (p.198))
Measurement range, resolution 600.00 V
Measurement band See RMS frequency characteristics.
Measurement accuracy When input is 10% to 150% of Udin and 1.666%f.s. to 110%f.s. (Up to 660V when Udin>440V):±0.1% of the nominal voltage.Otherwise:±0.2% rdg.±0.08%f.s.When the measurement frequency is set to 400 Hz: 0.2% rdg.0.16%f.s.
Event threshold Upper and lower limits set separately from 0 to (lower limit) to (upper limit) to 780 V (value before setting VT ratio)When set to 3P3W3M/3P4W/3P4W2.5E, the phase voltage/line voltage setting is applied.
Sense Set from 0 to 600 V.
Event IN Start of the approx. 200 ms aggregation during which the reading was greater than the upper limit or less than the lower limit
Event OUT Start of the approx. 200 ms aggregation during which the reading was less than (upper limit - hys-teresis) after being greater than the upper limit or was greater than (lower limit + hysteresis) after being less than the lower limit
Multiple-phase system treatment Separate by channel
Saved waveforms Event waveforms
Voltage DC value (Udc)
Measurement method Average value during approx. 20 ms aggregation synchronized with the reference channel (CH4 only)Includes zero suppression.
Sampling frequency 200 kHz
Displayed item Voltage DC value
Measurement range, resolution 600.00 V
Measurement band See RMS frequency characteristics.
Measurement accuracy 0.3% rdg.0.08%f.s.
Event threshold 0 V to 1,200 VThe difference between the positive and negative waveform peak values in the 200 ms aggrega-tion is compared to the threshold to generate DC fluctuation events.
Sense Set from 0 to 600 V.
Event IN Start of the 200 ms aggregation in which the threshold was exceeded
Event OUT Start of the first 200 ms aggregation after the IN state in which the threshold was not exceed
Multiple-phase system treatment None
Saved waveforms Event waveforms

13.3 Measurement Specifications
178
RMS current (Irms)
Measurement method AC+DC True RMS typeIEC61000-4-30 compliant: 10 cycles (50 Hz) or 12 cycles (60 Hz) (approx. 200 ms aggregation)During 400 Hz measurement, 200 kHz sampling at 80 cycles (approx. 200 ms aggregation)Includes zero suppression.
Sampling frequency 200 kHz
Displayed item RMS current for each channel and AVG (average) RMS current for multiple channels (for more information, "13.10 Calculation Formula" (p.198))
Measurement range, resolution See input specifications.
Measurement band See RMS frequency characteristics.
Measurement accuracy When the measurement frequency is set to 50/60 Hz: 0.2% rdg.0.1%f.s. + clamp sensor accuracyWhen the measurement frequency is set to 400 Hz: 0.2% rdg.0.6%f.s. +clamp sensor accuracy
Event threshold 0 to current range
Sense 0 to current range
Event IN Start of approx. 200 ms aggregation in which threshold was exceeded
Event OUT Start of approx. 200 ms aggregation in which reading was less than (threshold - hysteresis)
Multiple-phase system treatment Separate by channel
Saved waveforms Event waveforms
Current DC value (Idc)
Measurement method Average value during approx. 200 ms aggregation synchronized to reference channel (CH4 only)Includes zero suppression.
Sampling frequency 200 kHz
Displayed item Current DC value
Measurement range, resolution Varies with clamp sensor used (CH4 only).
Measurement band See RMS frequency characteristics and consider clamp sensor measurement band.
Measurement accuracy 0.5% rdg.0.5%f.s. + clamp sensor specifications accuracyNot specified when using AC dedicated clamp sensor.
Event threshold 0 to (rated current of clamp sensor being used × 4) AThe difference between the positive and negative waveform peak values in the 200 ms aggrega-tion is compared to the threshold to generate DC fluctuation events.
Sense 0 to current range
Event IN Start of the 200 ms aggregation in which the threshold was exceeded
Event OUT Start of the first 200 ms aggregation after the IN state in which the threshold was not exceed
Multiple-phase system treatment None
Saved waveforms Event waveforms
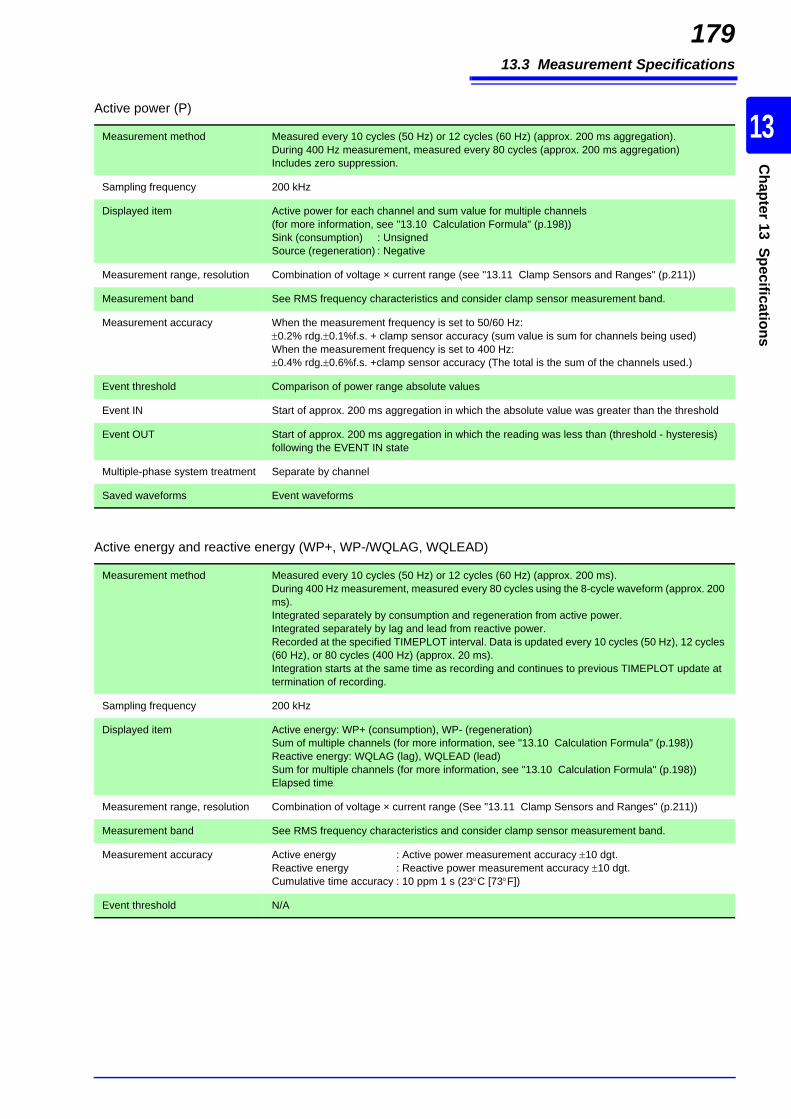
13.3 Measurement Specifications
179
10
13
Chapter 13 Specifications
Active power (P)
Measurement method Measured every 10 cycles (50 Hz) or 12 cycles (60 Hz) (approx. 200 ms aggregation).During 400 Hz measurement, measured every 80 cycles (approx. 200 ms aggregation)Includes zero suppression.
Sampling frequency 200 kHz
Displayed item Active power for each channel and sum value for multiple channels (for more information, see "13.10 Calculation Formula" (p.198))Sink (consumption) : UnsignedSource (regeneration) : Negative
Measurement range, resolution Combination of voltage × current range (see "13.11 Clamp Sensors and Ranges" (p.211))
Measurement band See RMS frequency characteristics and consider clamp sensor measurement band.
Measurement accuracy When the measurement frequency is set to 50/60 Hz: 0.2% rdg.0.1%f.s. + clamp sensor accuracy (sum value is sum for channels being used)When the measurement frequency is set to 400 Hz: 0.4% rdg.0.6%f.s. +clamp sensor accuracy (The total is the sum of the channels used.)
Event threshold Comparison of power range absolute values
Event IN Start of approx. 200 ms aggregation in which the absolute value was greater than the threshold
Event OUT Start of approx. 200 ms aggregation in which the reading was less than (threshold - hysteresis) following the EVENT IN state
Multiple-phase system treatment Separate by channel
Saved waveforms Event waveforms
Active energy and reactive energy (WP+, WP-/WQLAG, WQLEAD)
Measurement method Measured every 10 cycles (50 Hz) or 12 cycles (60 Hz) (approx. 200 ms).During 400 Hz measurement, measured every 80 cycles using the 8-cycle waveform (approx. 200 ms).Integrated separately by consumption and regeneration from active power.Integrated separately by lag and lead from reactive power.Recorded at the specified TIMEPLOT interval. Data is updated every 10 cycles (50 Hz), 12 cycles (60 Hz), or 80 cycles (400 Hz) (approx. 20 ms).Integration starts at the same time as recording and continues to previous TIMEPLOT update at termination of recording.
Sampling frequency 200 kHz
Displayed item Active energy: WP+ (consumption), WP- (regeneration)Sum of multiple channels (for more information, see "13.10 Calculation Formula" (p.198))Reactive energy: WQLAG (lag), WQLEAD (lead)Sum for multiple channels (for more information, see "13.10 Calculation Formula" (p.198))Elapsed time
Measurement range, resolution Combination of voltage × current range (See "13.11 Clamp Sensors and Ranges" (p.211))
Measurement band See RMS frequency characteristics and consider clamp sensor measurement band.
Measurement accuracy Active energy : Active power measurement accuracy 10 dgt.Reactive energy : Reactive power measurement accuracy 10 dgt.Cumulative time accuracy : 10 ppm 1 s (23C [73F])
Event threshold N/A
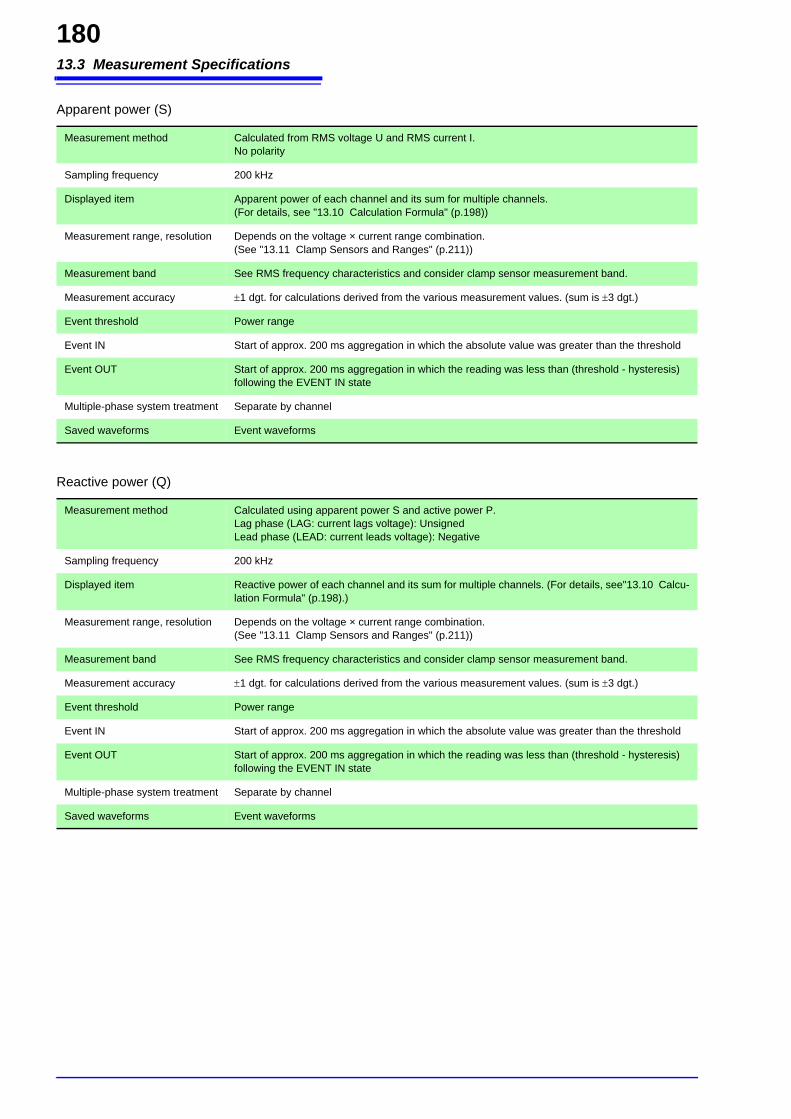
13.3 Measurement Specifications
180
Apparent power (S)
Measurement method Calculated from RMS voltage U and RMS current I.No polarity
Sampling frequency 200 kHz
Displayed item Apparent power of each channel and its sum for multiple channels. (For details, see "13.10 Calculation Formula" (p.198))
Measurement range, resolution Depends on the voltage × current range combination. (See "13.11 Clamp Sensors and Ranges" (p.211))
Measurement band See RMS frequency characteristics and consider clamp sensor measurement band.
Measurement accuracy 1 dgt. for calculations derived from the various measurement values. (sum is 3 dgt.)
Event threshold Power range
Event IN Start of approx. 200 ms aggregation in which the absolute value was greater than the threshold
Event OUT Start of approx. 200 ms aggregation in which the reading was less than (threshold - hysteresis) following the EVENT IN state
Multiple-phase system treatment Separate by channel
Saved waveforms Event waveforms
Reactive power (Q)
Measurement method Calculated using apparent power S and active power P.Lag phase (LAG: current lags voltage): UnsignedLead phase (LEAD: current leads voltage): Negative
Sampling frequency 200 kHz
Displayed item Reactive power of each channel and its sum for multiple channels. (For details, see"13.10 Calcu-lation Formula" (p.198).)
Measurement range, resolution Depends on the voltage × current range combination. (See "13.11 Clamp Sensors and Ranges" (p.211))
Measurement band See RMS frequency characteristics and consider clamp sensor measurement band.
Measurement accuracy 1 dgt. for calculations derived from the various measurement values. (sum is 3 dgt.)
Event threshold Power range
Event IN Start of approx. 200 ms aggregation in which the absolute value was greater than the threshold
Event OUT Start of approx. 200 ms aggregation in which the reading was less than (threshold - hysteresis) following the EVENT IN state
Multiple-phase system treatment Separate by channel
Saved waveforms Event waveforms
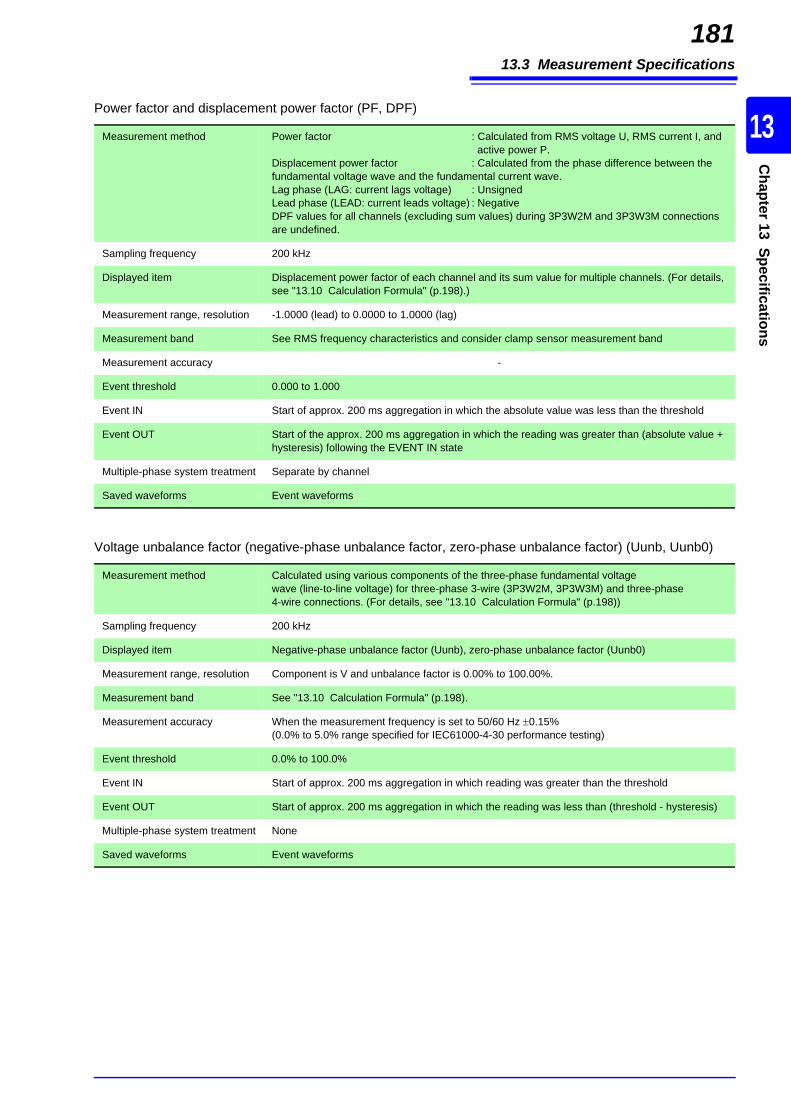
13.3 Measurement Specifications
181
10
13
Chapter 13 Specifications
Power factor and displacement power factor (PF, DPF)
Measurement method Power factor : Calculated from RMS voltage U, RMS current I, and active power P.
Displacement power factor : Calculated from the phase difference between the fundamental voltage wave and the fundamental current wave.Lag phase (LAG: current lags voltage) : UnsignedLead phase (LEAD: current leads voltage) : NegativeDPF values for all channels (excluding sum values) during 3P3W2M and 3P3W3M connections are undefined.
Sampling frequency 200 kHz
Displayed item Displacement power factor of each channel and its sum value for multiple channels. (For details, see "13.10 Calculation Formula" (p.198).)
Measurement range, resolution -1.0000 (lead) to 0.0000 to 1.0000 (lag)
Measurement band See RMS frequency characteristics and consider clamp sensor measurement band
Measurement accuracy -
Event threshold 0.000 to 1.000
Event IN Start of approx. 200 ms aggregation in which the absolute value was less than the threshold
Event OUT Start of the approx. 200 ms aggregation in which the reading was greater than (absolute value + hysteresis) following the EVENT IN state
Multiple-phase system treatment Separate by channel
Saved waveforms Event waveforms
Voltage unbalance factor (negative-phase unbalance factor, zero-phase unbalance factor) (Uunb, Uunb0)
Measurement method Calculated using various components of the three-phase fundamental voltagewave (line-to-line voltage) for three-phase 3-wire (3P3W2M, 3P3W3M) and three-phase4-wire connections. (For details, see "13.10 Calculation Formula" (p.198))
Sampling frequency 200 kHz
Displayed item Negative-phase unbalance factor (Uunb), zero-phase unbalance factor (Uunb0)
Measurement range, resolution Component is V and unbalance factor is 0.00% to 100.00%.
Measurement band See "13.10 Calculation Formula" (p.198).
Measurement accuracy When the measurement frequency is set to 50/60 Hz 0.15%(0.0% to 5.0% range specified for IEC61000-4-30 performance testing)
Event threshold 0.0% to 100.0%
Event IN Start of approx. 200 ms aggregation in which reading was greater than the threshold
Event OUT Start of approx. 200 ms aggregation in which the reading was less than (threshold - hysteresis)
Multiple-phase system treatment None
Saved waveforms Event waveforms
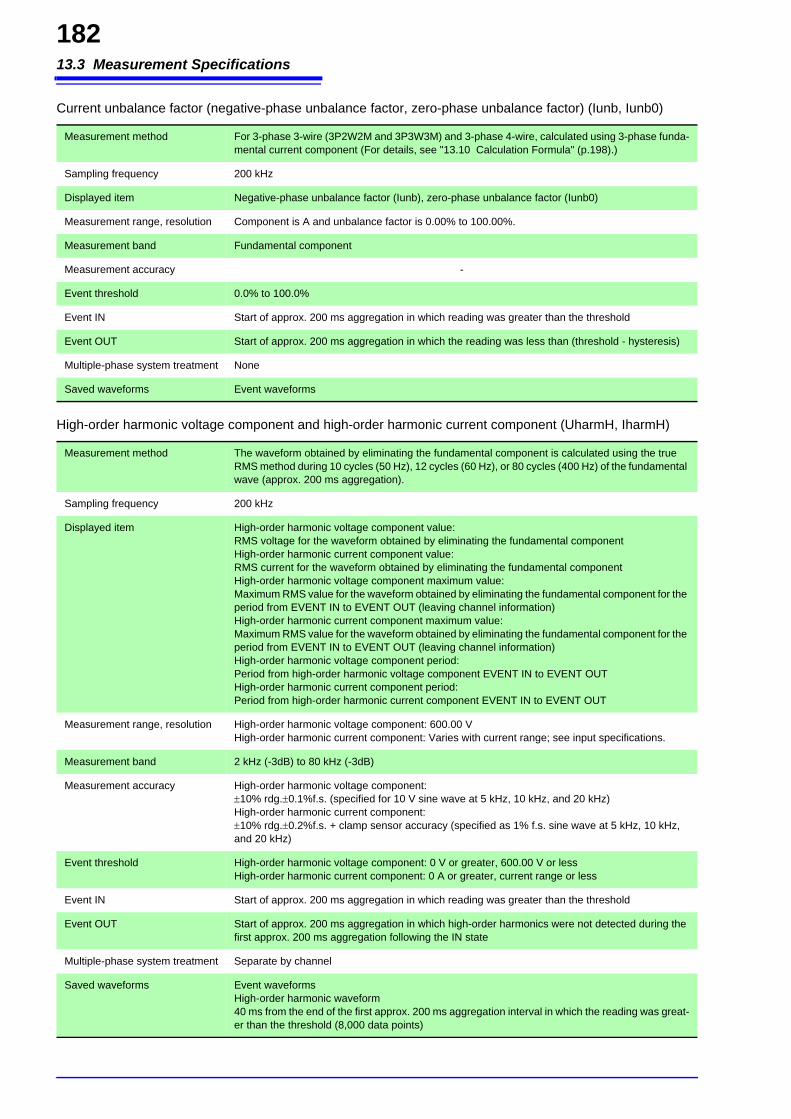
13.3 Measurement Specifications
182
Current unbalance factor (negative-phase unbalance factor, zero-phase unbalance factor) (Iunb, Iunb0)
Measurement method For 3-phase 3-wire (3P2W2M and 3P3W3M) and 3-phase 4-wire, calculated using 3-phase funda-mental current component (For details, see "13.10 Calculation Formula" (p.198).)
Sampling frequency 200 kHz
Displayed item Negative-phase unbalance factor (Iunb), zero-phase unbalance factor (Iunb0)
Measurement range, resolution Component is A and unbalance factor is 0.00% to 100.00%.
Measurement band Fundamental component
Measurement accuracy -
Event threshold 0.0% to 100.0%
Event IN Start of approx. 200 ms aggregation in which reading was greater than the threshold
Event OUT Start of approx. 200 ms aggregation in which the reading was less than (threshold - hysteresis)
Multiple-phase system treatment None
Saved waveforms Event waveforms
High-order harmonic voltage component and high-order harmonic current component (UharmH, IharmH)
Measurement method The waveform obtained by eliminating the fundamental component is calculated using the true RMS method during 10 cycles (50 Hz), 12 cycles (60 Hz), or 80 cycles (400 Hz) of the fundamental wave (approx. 200 ms aggregation).
Sampling frequency 200 kHz
Displayed item High-order harmonic voltage component value: RMS voltage for the waveform obtained by eliminating the fundamental componentHigh-order harmonic current component value: RMS current for the waveform obtained by eliminating the fundamental componentHigh-order harmonic voltage component maximum value: Maximum RMS value for the waveform obtained by eliminating the fundamental component for the period from EVENT IN to EVENT OUT (leaving channel information)High-order harmonic current component maximum value: Maximum RMS value for the waveform obtained by eliminating the fundamental component for the period from EVENT IN to EVENT OUT (leaving channel information)High-order harmonic voltage component period: Period from high-order harmonic voltage component EVENT IN to EVENT OUTHigh-order harmonic current component period: Period from high-order harmonic current component EVENT IN to EVENT OUT
Measurement range, resolution High-order harmonic voltage component: 600.00 VHigh-order harmonic current component: Varies with current range; see input specifications.
Measurement band 2 kHz (-3dB) to 80 kHz (-3dB)
Measurement accuracy High-order harmonic voltage component: 10% rdg.0.1%f.s. (specified for 10 V sine wave at 5 kHz, 10 kHz, and 20 kHz)High-order harmonic current component: 10% rdg.0.2%f.s. + clamp sensor accuracy (specified as 1% f.s. sine wave at 5 kHz, 10 kHz, and 20 kHz)
Event threshold High-order harmonic voltage component: 0 V or greater, 600.00 V or lessHigh-order harmonic current component: 0 A or greater, current range or less
Event IN Start of approx. 200 ms aggregation in which reading was greater than the threshold
Event OUT Start of approx. 200 ms aggregation in which high-order harmonics were not detected during the first approx. 200 ms aggregation following the IN state
Multiple-phase system treatment Separate by channel
Saved waveforms Event waveformsHigh-order harmonic waveform40 ms from the end of the first approx. 200 ms aggregation interval in which the reading was great-er than the threshold (8,000 data points)

13.3 Measurement Specifications
183
10
13
Chapter 13 Specifications
Harmonic voltage and harmonic current (including fundamental component) (Uharm/Iharm)
Measurement method Uses IEC61000-4-7:2002.Max. order: 50th Anti-aliasing low-pass filter causes attenuation of frequencies other than measurement target of at least 50 dB.Indicated harmonic voltage and harmonic current values incorporate inter-harmonics components adjacent to the next whole-number harmonic component after harmonic analysis. (For details see "13.10 Calculation Formula" (p.198).)Measurement accuracy is specified for input that is 10% to 200% of IEC61000-2-4 Class 3.
Analysis window width 10 cycles (50 Hz), 12 cycles (60 Hz), or 80 cycles (400 Hz)
No. of window points Rectangular, 4,096 points
Displayed item From order 0 to 50 (with a fundamental wave of 40 to 70 Hz)From order 0 to 10 (with a fundamental wave of 360 to 440 Hz)Select either RMS or content percentage (When using content percentage, zero suppression causes all orders to be given as 0% when the RMS value is 0.)
Measurement range, resolution Harmonic voltage: 600.00 VHarmonic current: Varies with current range (see input specifications).
Measurement accuracy See measurement accuracy with a fundamental wave of 50/60 Hz and measurement accuracy with a fundamental wave of 400 Hz.
Event threshold Harmonic voltage: 0.00 to 780.00 V (order 0: absolute value comparison)Harmonic current : Varies with clamp sensor ×1.3 (see input specifications) (order 0: absolute val-
ue comparison).
Event IN Start of approx. 200 ms aggregation in which readings were greater than the threshold for each order
Event OUT Start of approx. 200 ms aggregation in which readings were less than (threshold - hysteresis) for each order
Multiple-phase system treatment Separate by channel
Saved waveforms Event waveforms
Constraints When using an AC-only clamp sensor, order 0 is not specified for current and power.
Harmonic power (including fundamental component) (Pharm)
Measurement method Uses IEC61000-4-7:2002.Max. order: 50thAnti-aliasing low-pass filter causes attenuation of frequencies other than measurement target of at least 50 dB.Indicates harmonic power values consisting of harmonic power for each channel and the sum of multiple channels. (For details see "13.10 Calculation Formula" (p.198).)
Analysis window width 10 cycles (50 Hz), 12 cycles (60 Hz), or 80 cycles (400 Hz)
No. of window points Rectangular, 4,096 points
Displayed item From order 0 to 50 (with a fundamental wave of 40 to 70 Hz)From order 0 to 10 (with a fundamental wave of 360 to 440 Hz)Select either RMS or content percentage (When using content percentage, zero suppression causes all orders to be given as 0% when the RMS value is 0.)
Measurement range, resolution See power ranges.
Measurement accuracy See measurement accuracy with a fundamental wave of 50/60 Hz and measurement accuracy with a fundamental wave of 400 Hz.
Event threshold 0 to (varies with range) (specified as absolute value)
Event IN Start of approx. 200 ms aggregation in which the reading is greater than the threshold (when the threshold is positive) or less than the threshold (when the threshold is negative)
Event OUT Start of the approx. 200 ms aggregation in which the reading is less than (threshold - hysteresis) (when the threshold is positive) or greater than (threshold + hysteresis) (when the threshold is neg-ative) in the EVENT IN state
Multiple-phase system treatment Separate by channel
Saved waveforms Event waveforms
Constraints When using an AC-only clamp sensor, order 0 is not specified for current and power.
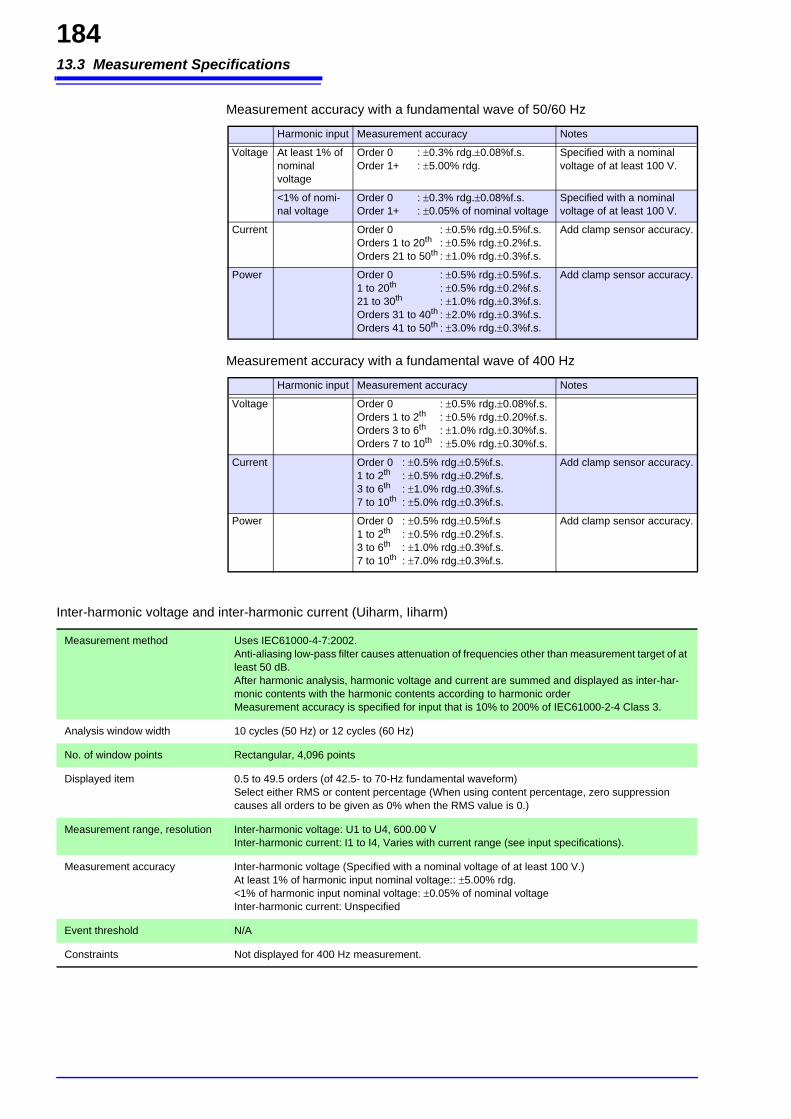
13.3 Measurement Specifications
184
Measurement accuracy with a fundamental wave of 50/60 Hz
Harmonic input Measurement accuracy Notes
Voltage At least 1% of nominal voltage
Order 0 : 0.3% rdg.0.08%f.s.Order 1+ : 5.00% rdg.
Specified with a nominal voltage of at least 100 V.
<1% of nomi-nal voltage
Order 0 : 0.3% rdg.0.08%f.s.Order 1+ : 0.05% of nominal voltage
Specified with a nominal voltage of at least 100 V.
Current Order 0 : 0.5% rdg.0.5%f.s.Orders 1 to 20th : 0.5% rdg.0.2%f.s.Orders 21 to 50th : 1.0% rdg.0.3%f.s.
Add clamp sensor accuracy.
Power Order 0 : 0.5% rdg.0.5%f.s.1 to 20th : 0.5% rdg.0.2%f.s.21 to 30th : 1.0% rdg.0.3%f.s.Orders 31 to 40th : 2.0% rdg.0.3%f.s.Orders 41 to 50th : 3.0% rdg.0.3%f.s.
Add clamp sensor accuracy.
Measurement accuracy with a fundamental wave of 400 Hz
Harmonic input Measurement accuracy Notes
Voltage Order 0 : 0.5% rdg.0.08%f.s.Orders 1 to 2th : 0.5% rdg.0.20%f.s.Orders 3 to 6th : 1.0% rdg.0.30%f.s.Orders 7 to 10th : 5.0% rdg.0.30%f.s.
Current Order 0 : 0.5% rdg.0.5%f.s.1 to 2th : 0.5% rdg.0.2%f.s.3 to 6th : 1.0% rdg.0.3%f.s.7 to 10th : 5.0% rdg.0.3%f.s.
Add clamp sensor accuracy.
Power Order 0 : 0.5% rdg.0.5%f.s1 to 2th : 0.5% rdg.0.2%f.s.3 to 6th : 1.0% rdg.0.3%f.s.7 to 10th : 7.0% rdg.0.3%f.s.
Add clamp sensor accuracy.
Inter-harmonic voltage and inter-harmonic current (Uiharm, Iiharm)
Measurement method Uses IEC61000-4-7:2002.Anti-aliasing low-pass filter causes attenuation of frequencies other than measurement target of at least 50 dB.After harmonic analysis, harmonic voltage and current are summed and displayed as inter-har-monic contents with the harmonic contents according to harmonic orderMeasurement accuracy is specified for input that is 10% to 200% of IEC61000-2-4 Class 3.
Analysis window width 10 cycles (50 Hz) or 12 cycles (60 Hz)
No. of window points Rectangular, 4,096 points
Displayed item 0.5 to 49.5 orders (of 42.5- to 70-Hz fundamental waveform)Select either RMS or content percentage (When using content percentage, zero suppression causes all orders to be given as 0% when the RMS value is 0.)
Measurement range, resolution Inter-harmonic voltage: U1 to U4, 600.00 VInter-harmonic current: I1 to I4, Varies with current range (see input specifications).
Measurement accuracy Inter-harmonic voltage (Specified with a nominal voltage of at least 100 V.)At least 1% of harmonic input nominal voltage:: 5.00% rdg.<1% of harmonic input nominal voltage: 0.05% of nominal voltageInter-harmonic current: Unspecified
Event threshold N/A
Constraints Not displayed for 400 Hz measurement.
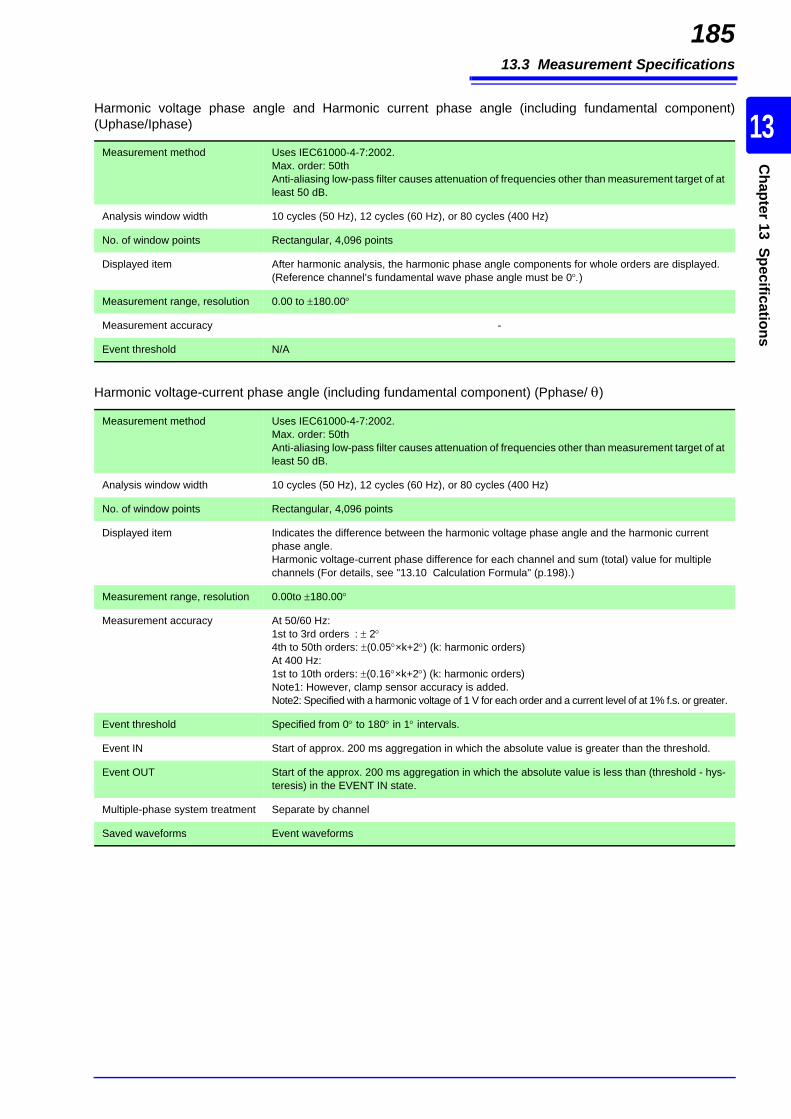
13.3 Measurement Specifications
185
10
13
Chapter 13 Specifications
Harmonic voltage phase angle and Harmonic current phase angle (including fundamental component)(Uphase/Iphase)
Measurement method Uses IEC61000-4-7:2002.Max. order: 50th Anti-aliasing low-pass filter causes attenuation of frequencies other than measurement target of at least 50 dB.
Analysis window width 10 cycles (50 Hz), 12 cycles (60 Hz), or 80 cycles (400 Hz)
No. of window points Rectangular, 4,096 points
Displayed item After harmonic analysis, the harmonic phase angle components for whole orders are displayed. (Reference channel’s fundamental wave phase angle must be 0)
Measurement range, resolution 0.00 to 180.00
Measurement accuracy -
Event threshold N/A
Harmonic voltage-current phase angle (including fundamental component) (Pphase/ )
Measurement method Uses IEC61000-4-7:2002.Max. order: 50thAnti-aliasing low-pass filter causes attenuation of frequencies other than measurement target of at least 50 dB.
Analysis window width 10 cycles (50 Hz), 12 cycles (60 Hz), or 80 cycles (400 Hz)
No. of window points Rectangular, 4,096 points
Displayed item Indicates the difference between the harmonic voltage phase angle and the harmonic current phase angle.Harmonic voltage-current phase difference for each channel and sum (total) value for multiple channels (For details, see "13.10 Calculation Formula" (p.198).)
Measurement range, resolution 0.00to 180.00
Measurement accuracy At 50/60 Hz:1st to 3rd orders : 24th to 50th orders: (0.05×k+2) (k: harmonic orders)At 400 Hz:1st to 10th orders: (0.16×k+2) (k: harmonic orders)Note1: However, clamp sensor accuracy is added.Note2: Specified with a harmonic voltage of 1 V for each order and a current level of at 1% f.s. or greater.
Event threshold Specified from 0 to 180 in 1 intervals.
Event IN Start of approx. 200 ms aggregation in which the absolute value is greater than the threshold.
Event OUT Start of the approx. 200 ms aggregation in which the absolute value is less than (threshold - hys-teresis) in the EVENT IN state.
Multiple-phase system treatment Separate by channel
Saved waveforms Event waveforms
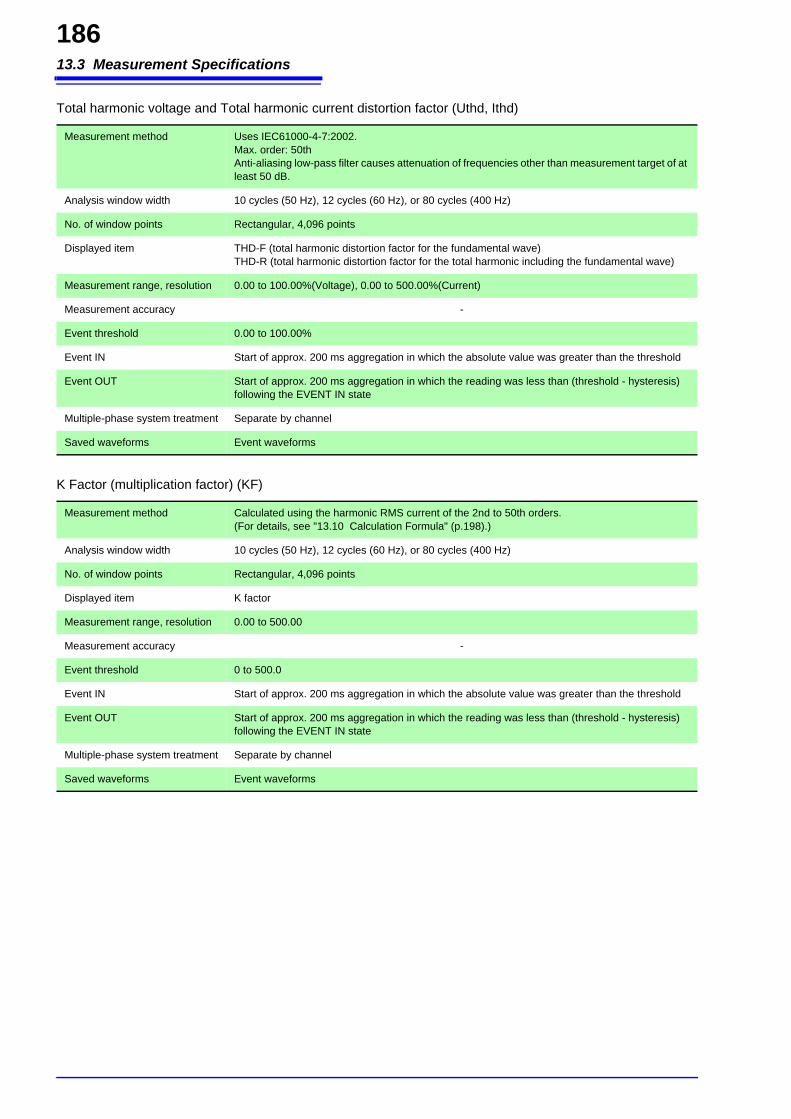
13.3 Measurement Specifications
186
Total harmonic voltage and Total harmonic current distortion factor (Uthd, Ithd)
Measurement method Uses IEC61000-4-7:2002.Max. order: 50th Anti-aliasing low-pass filter causes attenuation of frequencies other than measurement target of at least 50 dB.
Analysis window width 10 cycles (50 Hz), 12 cycles (60 Hz), or 80 cycles (400 Hz)
No. of window points Rectangular, 4,096 points
Displayed item THD-F (total harmonic distortion factor for the fundamental wave)THD-R (total harmonic distortion factor for the total harmonic including the fundamental wave)
Measurement range, resolution 0.00 to 100.00%(Voltage), 0.00 to 500.00%(Current)
Measurement accuracy -
Event threshold 0.00 to 100.00%
Event IN Start of approx. 200 ms aggregation in which the absolute value was greater than the threshold
Event OUT Start of approx. 200 ms aggregation in which the reading was less than (threshold - hysteresis) following the EVENT IN state
Multiple-phase system treatment Separate by channel
Saved waveforms Event waveforms
K Factor (multiplication factor) (KF)
Measurement method Calculated using the harmonic RMS current of the 2nd to 50th orders. (For details, see "13.10 Calculation Formula" (p.198).)
Analysis window width 10 cycles (50 Hz), 12 cycles (60 Hz), or 80 cycles (400 Hz)
No. of window points Rectangular, 4,096 points
Displayed item K factor
Measurement range, resolution 0.00 to 500.00
Measurement accuracy -
Event threshold 0 to 500.0
Event IN Start of approx. 200 ms aggregation in which the absolute value was greater than the threshold
Event OUT Start of approx. 200 ms aggregation in which the reading was less than (threshold - hysteresis) following the EVENT IN state
Multiple-phase system treatment Separate by channel
Saved waveforms Event waveforms
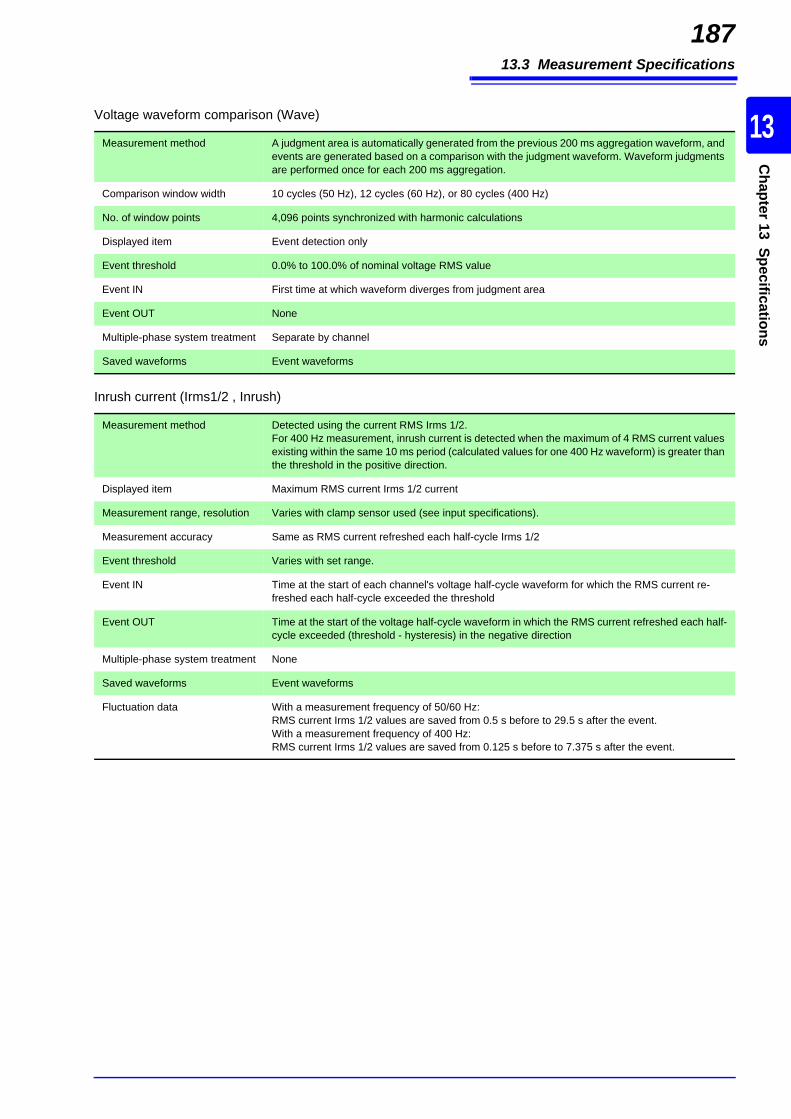
13.3 Measurement Specifications
187
10
13
Chapter 13 Specifications
Voltage waveform comparison (Wave)
Measurement method A judgment area is automatically generated from the previous 200 ms aggregation waveform, and events are generated based on a comparison with the judgment waveform. Waveform judgments are performed once for each 200 ms aggregation.
Comparison window width 10 cycles (50 Hz), 12 cycles (60 Hz), or 80 cycles (400 Hz)
No. of window points 4,096 points synchronized with harmonic calculations
Displayed item Event detection only
Event threshold 0.0% to 100.0% of nominal voltage RMS value
Event IN First time at which waveform diverges from judgment area
Event OUT None
Multiple-phase system treatment Separate by channel
Saved waveforms Event waveforms
Inrush current (Irms1/2 , Inrush)
Measurement method Detected using the current RMS Irms 1/2.For 400 Hz measurement, inrush current is detected when the maximum of 4 RMS current values existing within the same 10 ms period (calculated values for one 400 Hz waveform) is greater than the threshold in the positive direction.
Displayed item Maximum RMS current Irms 1/2 current
Measurement range, resolution Varies with clamp sensor used (see input specifications).
Measurement accuracy Same as RMS current refreshed each half-cycle Irms 1/2
Event threshold Varies with set range.
Event IN Time at the start of each channel's voltage half-cycle waveform for which the RMS current re-freshed each half-cycle exceeded the threshold
Event OUT Time at the start of the voltage half-cycle waveform in which the RMS current refreshed each half-cycle exceeded (threshold - hysteresis) in the negative direction
Multiple-phase system treatment None
Saved waveforms Event waveforms
Fluctuation data With a measurement frequency of 50/60 Hz: RMS current Irms 1/2 values are saved from 0.5 s before to 29.5 s after the event. With a measurement frequency of 400 Hz: RMS current Irms 1/2 values are saved from 0.125 s before to 7.375 s after the event.

13.3 Measurement Specifications
188
Specified for RMS voltage Urms and RMS current Irms. Current and power values incorporate clamp sensor accuracy.
V10 Flicker (dV10)
Measurement method "13.10 Calculation Formula" (p.198)Calculated values are subject to 100 V conversion following gap-less measurement once each minute.
Standard voltage Automatic (with AGC)
Displayed item V10 measured at one minute intervals, average value for one hour, maximum value for one hour, fourth largest value for one hour, total (within the measurement interval) maximum value
Measurement range, resolution 0.000 to 99.999 V
Measurement accuracy 2% rdg.0.01 V (with a fundamental wave of 100 Vrms [50/60 Hz], a fluctuation voltage of 1 Vrms, and a fluctuation frequency of 10 Hz)
Threshold 0.00 to 9.99V Alarm output is generated when the reading for each minute is compared to the threshold and found to be greater
Event IN N/A
Event OUT N/A
Multiple-phase system treatment None
IEC Flicker (Pst, Plt)
Measurement method Uses IEC61000-4-15:1997 +A1:2003 Ed1/Ed2, Calculated as described in "13.10 Calculation For-mula" (p.198).Pst is calculated after 10 minutes of continuous measurement and Plt after 2 hours of continuous measurement.
Displayed item Short interval flicker Pst, long interval flicker Plt
Measurement range, resolution 0.0001 to 10000 PU broken into 1,024 segments with a logarithm
Flicker filter Select 230 V lamp Ed1, 120 V lamp Ed1, 230 V lamp Ed2, or 120 V lamp Ed2.
Measurement accuracy Pst 5% rdg. (Specified within range 0.1000 to 20.000 using IEC61000-4-15 Ed1.1 and IEC61000-4-15 Ed2 Class F1 performance test.)
Other CharacteristicsRMS frequency characteristics
Frequency Voltage Current Power
40 Hz to 70 Hz Specified as RMS value Specified as RMS value Specified as RMS value
70 Hz to 360 Hz 1% rdg.0.2%f.s. 1% rdg.0.5%f.s. 1% rdg.0.5%f.s.
360 Hz to 440 Hz Specified as RMS value Specified as RMS value Specified as RMS value
440 Hz to 5kHz 5% rdg.0.2%f.s. 5% rdg.0.5%f.s. 5% rdg.1%f.s.
5kHz to 20 kHz 5% rdg.0.2%f.s. 5% rdg.0.5%f.s.
20 kHz to 50 kHz 20% rdg.0.4%f.s. 20% rdg.0.5%f.s.
80 kHz -3dB -3dB
Temperature characteristic: Specified within operating temperature and humidity range.
Voltage, Current, Power 0.03%f.s./C Add 0.05% f.s./×C for DC measured values.
Effect of common mode voltage
0.2%f.s. or less 600 Vrms, 50/60 Hz, Between voltage measurement jacks and instrument chassis
2%f.s. or less 600 Vrms, 400 Hz, Between voltage measurement jacks and instrument chassis
Magnetic field interference
Voltage 0.5f.s. or less (in a magnetic field of 400 A/m rms, 50/60 Hz)
Current, Power 1.5%f.s. or less (in a magnetic field of 400 A/m rms, 50/60 Hz)
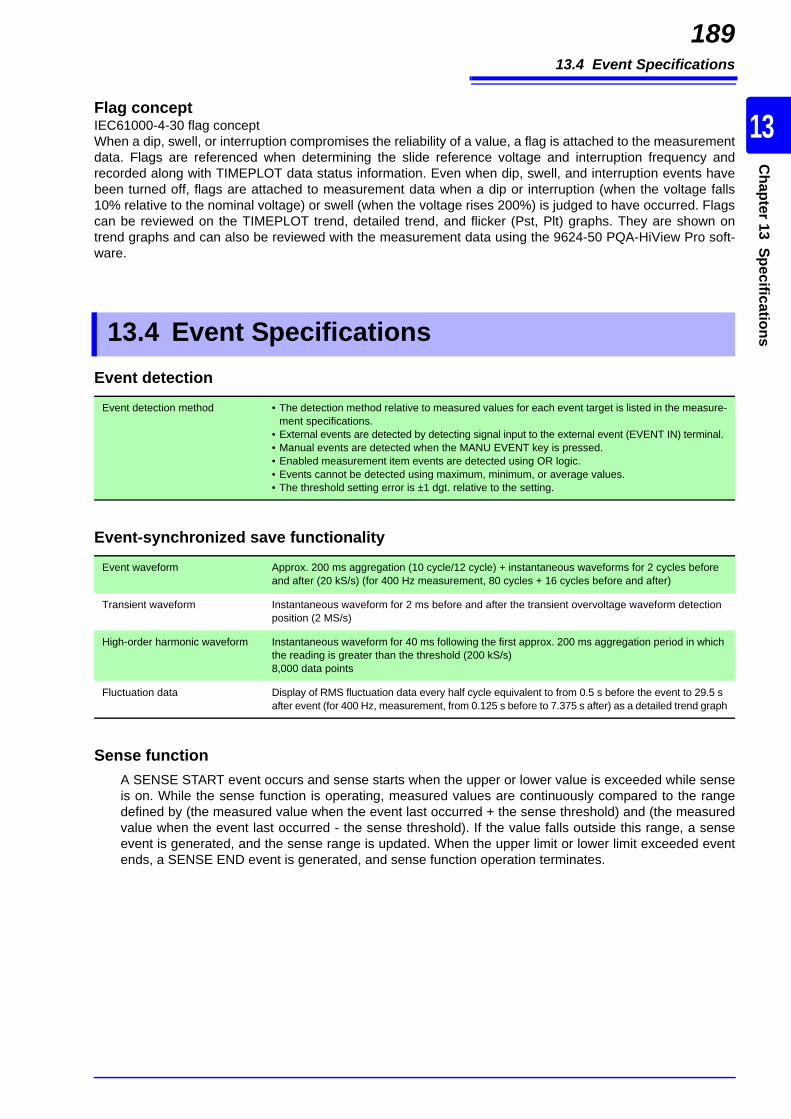
13.4 Event Specifications
189
10
13
Chapter 13 Specifications
Flag conceptIEC61000-4-30 flag conceptWhen a dip, swell, or interruption compromises the reliability of a value, a flag is attached to the measurementdata. Flags are referenced when determining the slide reference voltage and interruption frequency andrecorded along with TIMEPLOT data status information. Even when dip, swell, and interruption events havebeen turned off, flags are attached to measurement data when a dip or interruption (when the voltage falls10% relative to the nominal voltage) or swell (when the voltage rises 200%) is judged to have occurred. Flagscan be reviewed on the TIMEPLOT trend, detailed trend, and flicker (Pst, Plt) graphs. They are shown ontrend graphs and can also be reviewed with the measurement data using the 9624-50 PQA-HiView Pro soft-ware.
Sense functionA SENSE START event occurs and sense starts when the upper or lower value is exceeded while senseis on. While the sense function is operating, measured values are continuously compared to the rangedefined by (the measured value when the event last occurred + the sense threshold) and (the measuredvalue when the event last occurred - the sense threshold). If the value falls outside this range, a senseevent is generated, and the sense range is updated. When the upper limit or lower limit exceeded eventends, a SENSE END event is generated, and sense function operation terminates.
13.4 Event SpecificationsEvent detection
Event detection method • The detection method relative to measured values for each event target is listed in the measure-ment specifications.
• External events are detected by detecting signal input to the external event (EVENT IN) terminal.• Manual events are detected when the MANU EVENT key is pressed.• Enabled measurement item events are detected using OR logic.• Events cannot be detected using maximum, minimum, or average values.• The threshold setting error is ±1 dgt. relative to the setting.
Event-synchronized save functionality
Event waveform Approx. 200 ms aggregation (10 cycle/12 cycle) + instantaneous waveforms for 2 cycles before and after (20 kS/s) (for 400 Hz measurement, 80 cycles + 16 cycles before and after)
Transient waveform Instantaneous waveform for 2 ms before and after the transient overvoltage waveform detection position (2 MS/s)
High-order harmonic waveform Instantaneous waveform for 40 ms following the first approx. 200 ms aggregation period in which the reading is greater than the threshold (200 kS/s)8,000 data points
Fluctuation data Display of RMS fluctuation data every half cycle equivalent to from 0.5 s before the event to 29.5 s after event (for 400 Hz, measurement, from 0.125 s before to 7.375 s after) as a detailed trend graph
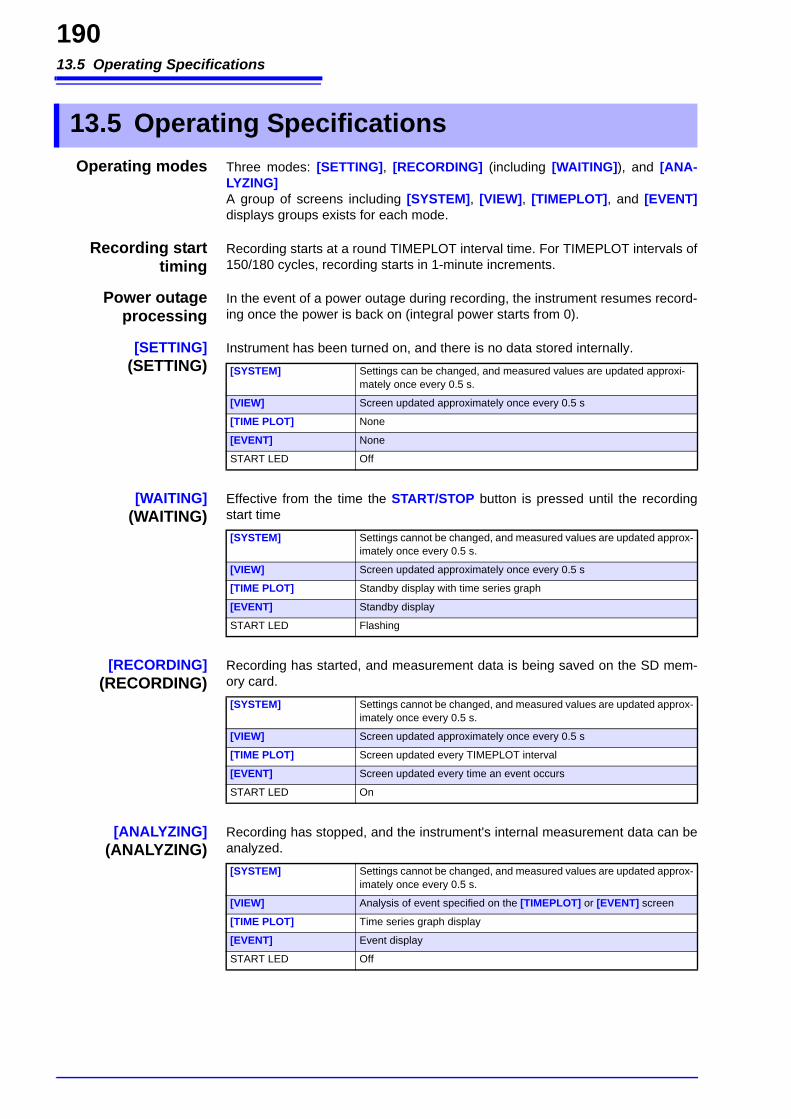
13.5 Operating Specifications
190
Operating modes Three modes: [SETTING], [RECORDING] (including [WAITING]), and [ANA-LYZING]A group of screens including [SYSTEM], [VIEW], [TIMEPLOT], and [EVENT]displays groups exists for each mode.
Recording starttiming
Recording starts at a round TIMEPLOT interval time. For TIMEPLOT intervals of150/180 cycles, recording starts in 1-minute increments.
Power outageprocessing
In the event of a power outage during recording, the instrument resumes record-ing once the power is back on (integral power starts from 0).
[SETTING](SETTING)
Instrument has been turned on, and there is no data stored internally.
[WAITING](WAITING)
Effective from the time the START/STOP button is pressed until the recordingstart time
[RECORDING](RECORDING)
Recording has started, and measurement data is being saved on the SD mem-ory card.
[ANALYZING](ANALYZING)
Recording has stopped, and the instrument's internal measurement data can beanalyzed.
13.5 Operating Specifications
[SYSTEM] Settings can be changed, and measured values are updated approxi-mately once every 0.5 s.
[VIEW] Screen updated approximately once every 0.5 s
[TIME PLOT] None
[EVENT] None
START LED Off
[SYSTEM] Settings cannot be changed, and measured values are updated approx-imately once every 0.5 s.
[VIEW] Screen updated approximately once every 0.5 s
[TIME PLOT] Standby display with time series graph
[EVENT] Standby display
START LED Flashing
[SYSTEM] Settings cannot be changed, and measured values are updated approx-imately once every 0.5 s.
[VIEW] Screen updated approximately once every 0.5 s
[TIME PLOT] Screen updated every TIMEPLOT interval
[EVENT] Screen updated every time an event occurs
START LED On
[SYSTEM] Settings cannot be changed, and measured values are updated approx-imately once every 0.5 s.
[VIEW] Analysis of event specified on the [TIMEPLOT] or [EVENT] screen
[TIME PLOT] Time series graph display
[EVENT] Event display
START LED Off
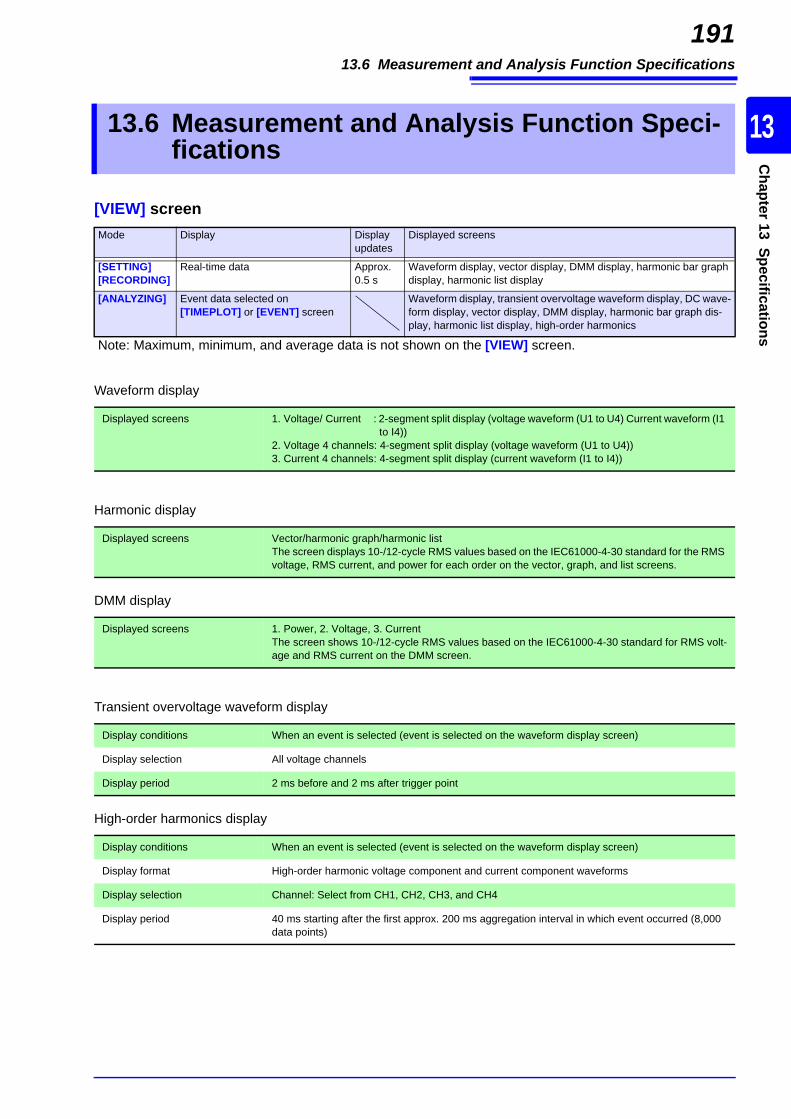
13.6 Measurement and Analysis Function Specifications
191
10
13
Chapter 13 Specifications
Note: Maximum, minimum, and average data is not shown on the [VIEW] screen.
13.6 Measurement and Analysis Function Speci-fications
[VIEW] screenMode Display Display
updatesDisplayed screens
[SETTING][RECORDING]
Real-time data Approx. 0.5 s
Waveform display, vector display, DMM display, harmonic bar graph display, harmonic list display
[ANALYZING] Event data selected on [TIMEPLOT] or [EVENT] screen
Waveform display, transient overvoltage waveform display, DC wave-form display, vector display, DMM display, harmonic bar graph dis-play, harmonic list display, high-order harmonics
Waveform display
Displayed screens 1. Voltage/ Current : 2-segment split display (voltage waveform (U1 to U4) Current waveform (I1 to I4))
2. Voltage 4 channels: 4-segment split display (voltage waveform (U1 to U4))3. Current 4 channels: 4-segment split display (current waveform (I1 to I4))
Harmonic display
Displayed screens Vector/harmonic graph/harmonic listThe screen displays 10-/12-cycle RMS values based on the IEC61000-4-30 standard for the RMS voltage, RMS current, and power for each order on the vector, graph, and list screens.
DMM display
Displayed screens 1. Power, 2. Voltage, 3. CurrentThe screen shows 10-/12-cycle RMS values based on the IEC61000-4-30 standard for RMS volt-age and RMS current on the DMM screen.
Transient overvoltage waveform display
Display conditions When an event is selected (event is selected on the waveform display screen)
Display selection All voltage channels
Display period 2 ms before and 2 ms after trigger point
High-order harmonics display
Display conditions When an event is selected (event is selected on the waveform display screen)
Display format High-order harmonic voltage component and current component waveforms
Display selection Channel: Select from CH1, CH2, CH3, and CH4
Display period 40 ms starting after the first approx. 200 ms aggregation interval in which event occurred (8,000 data points)

13.6 Measurement and Analysis Function Specifications
192
[TIME PLOT] screen
Trend graph display
Displayed screens 1-screen/2-screen/Energy
Displayed content Time series graph of maximum, minimum, and average values for 1 item on 1-screen display or 2 items on 2-screen displaySelect from Freq, Freq10s, Upk+, Upk-, Ipk+, Ipk-, Urms, UrmsAVG, Udc, Irms, IrmsAVG, Idc, P, S, Q, PF, DPF, Uunb0, Uunb, Iunb0, Iunb, UharmH, IharmH, Uthd-F, Uthd-R, Ithd-F, Ithd-R, and KF."Integration" refers to a time series graph of 1 integrated item.
Display update rate during measurement
Every TIMEPLOT interval
Detailed trend graph display (interval)
Displayed screens Time series graph of maximum and minimum values for fluctuation data
Displayed content Select any 1 of Urms1/2, Irms1/2, S(t), and frequency cycle.(S(t) cannot be selected during 400 Hz measurement.)
Display update rate during measurement
Every TIMEPLOT interval
Fluctuation data display (detailed trend graph at event occurrence)
Displayed screens Time series graph of fluctuation data at event occurrence (from 0.5 s before to 29.5 s after event occurrence for 50/60 Hz measurement; from 0.125 s before to 7.375 s after event occurrence for 400 Hz measurement)
Displayed content Either Urms1/2 or Irms1/2 (inrush current)
Display update rate during measurement
Each time a displayed event occurs (display is overwritten)
Harmonic trend graph display
Displayed screens 1-screen display
Displayed content Time series graph of maximum, minimum, and average values for up to 6 items
Display update rate during measurement
Every TIMEPLOT interval
Inter-harmonics trend graph display
Displayed screens 1-screen display
Displayed content Time series graph of maximum, minimum, and average values for up to 6 items
Display update rate during measurement
Every TIMEPLOT interval
V10 flicker graph display (when flicker is set to V10)
Displayed content Time series graph of V10 (instantaneous value) (simultaneous display for all measurement channels)
Constraints No display for 400 Hz measurement
V10 flicker list display (when flicker is set to V10)
Displayed content V10 1-hour average value, V10 1-hour maximum value, V10 1-hour fourth-largest value, V10 overall maximum value
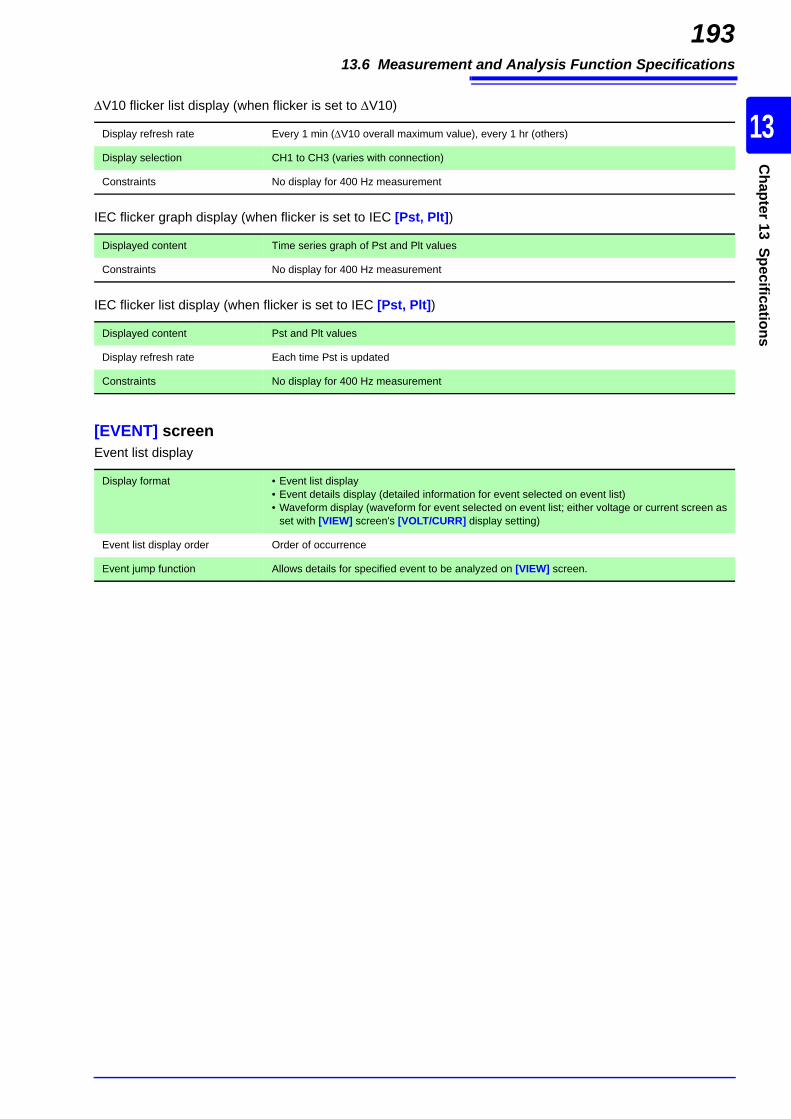
13.6 Measurement and Analysis Function Specifications
193
10
13
Chapter 13 Specifications
[EVENT] screen
Display refresh rate Every 1 min (V10 overall maximum value), every 1 hr (others)
Display selection CH1 to CH3 (varies with connection)
Constraints No display for 400 Hz measurement
V10 flicker list display (when flicker is set to V10)
IEC flicker graph display (when flicker is set to IEC [Pst, Plt])
Displayed content Time series graph of Pst and Plt values
Constraints No display for 400 Hz measurement
IEC flicker list display (when flicker is set to IEC [Pst, Plt])
Displayed content Pst and Plt values
Display refresh rate Each time Pst is updated
Constraints No display for 400 Hz measurement
Event list display
Display format • Event list display• Event details display (detailed information for event selected on event list)• Waveform display (waveform for event selected on event list; either voltage or current screen as
set with [VIEW] screen's [VOLT/CURR] display setting)
Event list display order Order of occurrence
Event jump function Allows details for specified event to be analyzed on [VIEW] screen.
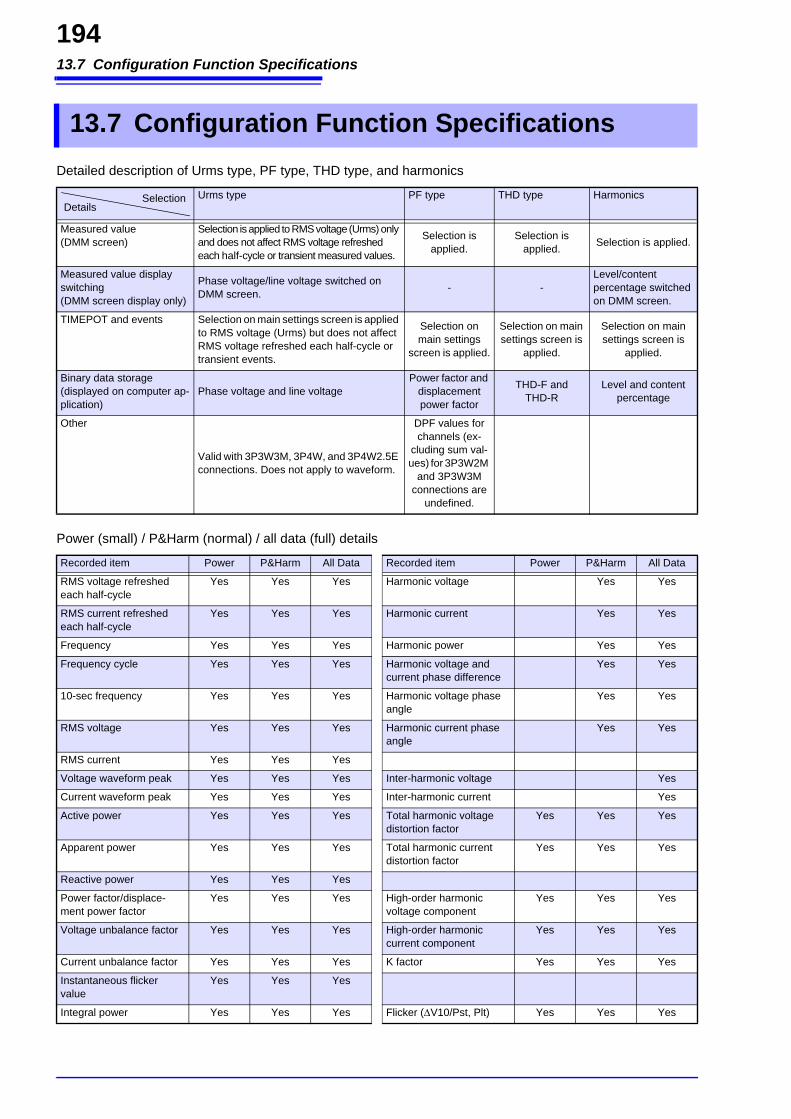
13.7 Configuration Function Specifications
194
13.7 Configuration Function SpecificationsDetailed description of Urms type, PF type, THD type, and harmonics
Urms type PF type THD type Harmonics
Measured value (DMM screen)
Selection is applied to RMS voltage (Urms) only and does not affect RMS voltage refreshed each half-cycle or transient measured values.
Selection is applied.
Selection is applied. Selection is applied.
Measured value display switching (DMM screen display only)
Phase voltage/line voltage switched on DMM screen. - -
Level/content percentage switched on DMM screen.
TIMEPOT and events Selection on main settings screen is applied to RMS voltage (Urms) but does not affect RMS voltage refreshed each half-cycle or transient events.
Selection on main settings
screen is applied.
Selection on main settings screen is
applied.
Selection on main settings screen is
applied.
Binary data storage (displayed on computer ap-plication)
Phase voltage and line voltagePower factor and
displacement power factor
THD-F and THD-R
Level and content percentage
Other
Valid with 3P3W3M, 3P4W, and 3P4W2.5E connections. Does not apply to waveform.
DPF values for channels (ex-
cluding sum val-ues) for 3P3W2M
and 3P3W3M connections are
undefined.
SelectionDetails
Power (small) / P&Harm (normal) / all data (full) details
Recorded item Power P&Harm All Data Recorded item Power P&Harm All Data
RMS voltage refreshed each half-cycle
Yes Yes Yes Harmonic voltage Yes Yes
RMS current refreshed each half-cycle
Yes Yes Yes Harmonic current Yes Yes
Frequency Yes Yes Yes Harmonic power Yes Yes
Frequency cycle Yes Yes Yes Harmonic voltage and current phase difference
Yes Yes
10-sec frequency Yes Yes Yes Harmonic voltage phase angle
Yes Yes
RMS voltage Yes Yes Yes Harmonic current phase angle
Yes Yes
RMS current Yes Yes Yes
Voltage waveform peak Yes Yes Yes Inter-harmonic voltage Yes
Current waveform peak Yes Yes Yes Inter-harmonic current Yes
Active power Yes Yes Yes Total harmonic voltage distortion factor
Yes Yes Yes
Apparent power Yes Yes Yes Total harmonic current distortion factor
Yes Yes Yes
Reactive power Yes Yes Yes
Power factor/displace-ment power factor
Yes Yes Yes High-order harmonic voltage component
Yes Yes Yes
Voltage unbalance factor Yes Yes Yes High-order harmonic current component
Yes Yes Yes
Current unbalance factor Yes Yes Yes K factor Yes Yes Yes
Instantaneous flicker value
Yes Yes Yes
Integral power Yes Yes Yes Flicker (V10/Pst, Plt) Yes Yes Yes

13.7 Configuration Function Specifications
195
10
13
Chapter 13 Specifications
Quick setup pattern details
Abnormal voltage detection
Basic power supply quality measurement
Inrush current measurement
Measured value recording EN50160
Connection Set in advanceClamp sensor Set in advanceCT, PT ratios Set in advanceMeasurement frequen-cy
Automatic detection of 50/60/400 Hz; if unable to detect, user (manual) setting
Nominal input voltage Automatic detection; if unable to detect, user (manual) settingFlicker/V10 (depends on selected language)
Pst, Plt (when Japanese is selected, V10)
Pst, Plt (when Japanese is selected, V10)
Pst, Plt (when Japanese is selected, V10)
Pst, Plt (when Japanese is selected, V10)
Pst,Plt
Measurement RMS voltage selection
Default Default Default Default Default
Measurement harmonics selection
RMS value RMS value RMS value RMS value Content percentage
Total harmonic distortion factor selection
THD_F THD_F THD_F THD_F THD_F
Power factor selection PF PF PF PF PFRepeat setting and iterations
OFF (max. 35 days) OFF (max. 35 days) OFF (max. 35 days) OFF (max. 35 days) OFF (max. 35 days)
Recorded items setting P&Harm (Normal) All Data (Full) P&Harm (Normal) All Data (Full) All Data (Full)TIMEPLOT interval 1 minute 10 minutes 1 minute 10 minutes 10 minutesCurrent range Automatic detection Automatic detection Max. range Automatic detection Automatic detectionEvent hysteresis 1% 1% 1% 1% 2%Transient overvoltage 70% of nominal
voltage70% of nominal voltage
OFF OFF 100% of nominal voltage
Voltage swell 110% of nominal voltage
110% of nominal voltage
OFF OFF 110% of nominal voltage
Voltage dip 90% of nominal voltage
90% of nominal voltage
OFF OFF 90% of nominal voltage
Interruption 10% of nominal voltage
10% of nominal voltage
OFF OFF 1% of nominal voltage
Frequency ±5 Hz of nominal frequency
±0.5 Hz of nominal frequency
OFF OFF ±0.5 Hz of nominal frequency
Frequency cycle OFF OFF OFF OFF OFFVoltage waveform peak (±)
150% of reference value
150% of reference value
OFF OFF 170% of nominal voltage
Voltage DC fluctuation (±) (when DC is selected)
±10% based on DC measured value
±10% based on DC measured value
OFF OFF OFF
Current waveform peak (±)
OFF 200% of reference value
300% of reference value
OFF OFF
Current DC fluctuation (±) (when DC is selected)
±10% based on DC measured value
±10% based on DC measured value
OFF OFF OFF
RMS voltage 10% of reference valueSENSE width: ±10 V
10% of reference valueSENSE width: ±10 V
OFF OFF OFF
RMS current OFFSENSE width: OFF
50% of reference valueSENSE width: OFF
OFFSENSE width: OFF
OFFSENSE width: OFF
OFFSENSE width: OFF
Inrush current (Irms 1/2)
OFF OFF 200% of reference value
OFF OFF
Active power OFF OFF OFF OFF OFFApparent power OFF OFF OFF OFF OFFReactive power OFF OFF OFF OFF OFFPower factor/displace-ment power factor
OFF OFF OFF OFF OFF
SettingPattern
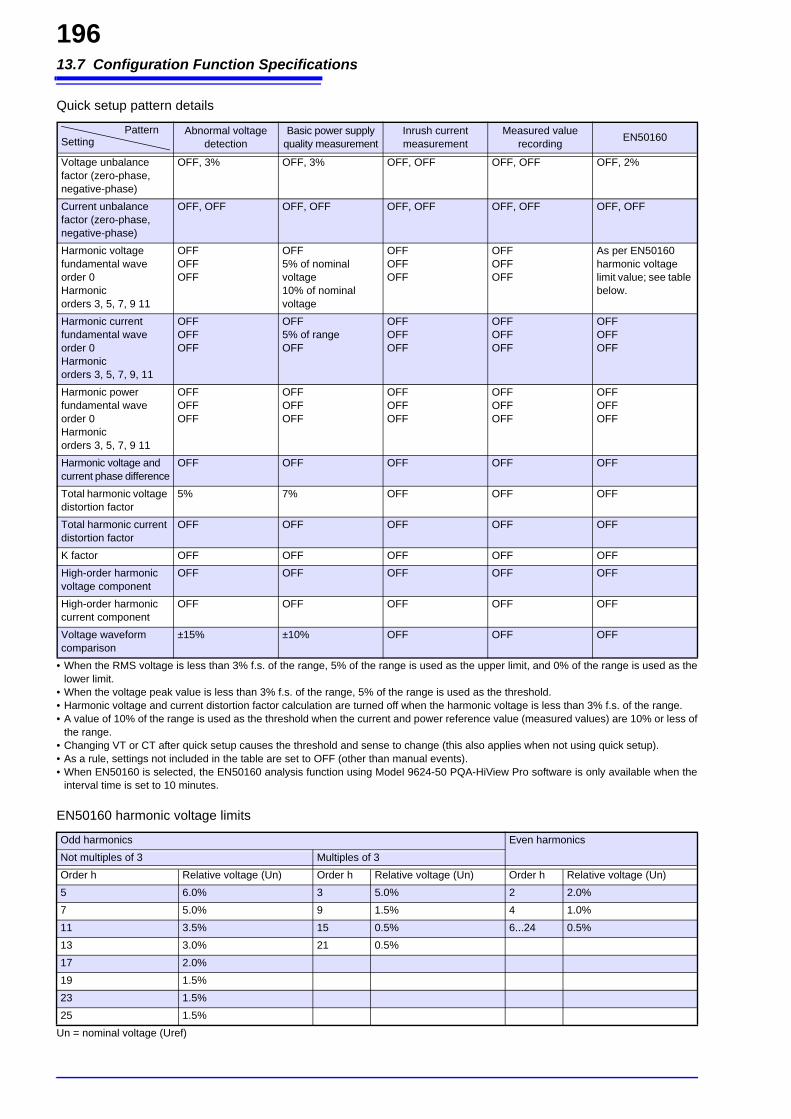
13.7 Configuration Function Specifications
196
• When the RMS voltage is less than 3% f.s. of the range, 5% of the range is used as the upper limit, and 0% of the range is used as thelower limit.
• When the voltage peak value is less than 3% f.s. of the range, 5% of the range is used as the threshold.• Harmonic voltage and current distortion factor calculation are turned off when the harmonic voltage is less than 3% f.s. of the range.• A value of 10% of the range is used as the threshold when the current and power reference value (measured values) are 10% or less of
the range.• Changing VT or CT after quick setup causes the threshold and sense to change (this also applies when not using quick setup).• As a rule, settings not included in the table are set to OFF (other than manual events).• When EN50160 is selected, the EN50160 analysis function using Model 9624-50 PQA-HiView Pro software is only available when the
interval time is set to 10 minutes.
Un = nominal voltage (Uref)
Voltage unbalance factor (zero-phase, negative-phase)
OFF, 3% OFF, 3% OFF, OFF OFF, OFF OFF, 2%
Current unbalance factor (zero-phase, negative-phase)
OFF, OFF OFF, OFF OFF, OFF OFF, OFF OFF, OFF
Harmonic voltage fundamental wave order 0Harmonic orders 3, 5, 7, 9 11
OFFOFFOFF
OFF5% of nominal voltage10% of nominal voltage
OFFOFFOFF
OFFOFFOFF
As per EN50160 harmonic voltage limit value; see table below.
Harmonic current fundamental wave order 0Harmonic orders 3, 5, 7, 9, 11
OFFOFFOFF
OFF5% of rangeOFF
OFFOFFOFF
OFFOFFOFF
OFFOFFOFF
Harmonic power fundamental wave order 0Harmonic orders 3, 5, 7, 9 11
OFFOFFOFF
OFFOFFOFF
OFFOFFOFF
OFFOFFOFF
OFFOFFOFF
Harmonic voltage and current phase difference
OFF OFF OFF OFF OFF
Total harmonic voltage distortion factor
5% 7% OFF OFF OFF
Total harmonic current distortion factor
OFF OFF OFF OFF OFF
K factor OFF OFF OFF OFF OFFHigh-order harmonic voltage component
OFF OFF OFF OFF OFF
High-order harmonic current component
OFF OFF OFF OFF OFF
Voltage waveform comparison
±15% ±10% OFF OFF OFF
Quick setup pattern details
Abnormal voltage detection
Basic power supply quality measurement
Inrush current measurement
Measured value recording EN50160Setting
Pattern
EN50160 harmonic voltage limits
Odd harmonics Even harmonicsNot multiples of 3 Multiples of 3Order h Relative voltage (Un) Order h Relative voltage (Un) Order h Relative voltage (Un)5 6.0% 3 5.0% 2 2.0%7 5.0% 9 1.5% 4 1.0%11 3.5% 15 0.5% 6...24 0.5%13 3.0% 21 0.5%17 2.0%19 1.5%23 1.5%25 1.5%

13.8 GPS Time Synchronization Function
197
10
13
Chapter 13 Specifications
The GPS BOX PW9005 can be connected to the instrument to synchronize the instrument’s timewith the GPS satellite time (coordinated universal time).
13.8 GPS Time Synchronization Function
GPS settings and status display function
GPS box connection setting RS connected device: GPS
GPS reception status display Positioning status : Err (no positioning data), 2D (2D independent positioning), 3D (3D in-dependent positioning), D2D (differential 2D positioning), D3D (differ-ential 3D positioning)
No. of positioning satellites : 0 to 12 (no. of satellites that can be used in position calculation)DOP value : 0 to 9,999 (GPS positioning status reliability) (smaller values other
than 0 indicate higher reliability)
GPS mark A GPS mark is displayed among other icons along the top of the screen to indicate the GPS posi-tioning status.
Blue GPS mark : Time correction has been performed.Yellow GPS mark : The device is unable to acquire GPS satellites or unable to calculate its posi-
tion. The yellow mark is also shown when time correction is canceled during recording.
Red GPS mark : The PW3198 has not detected the GPS box.
Time correction function
Corrected time and correction accuracy
Set to amount of variation from universal coordinated time (UTC).The instrument’s clock is corrected within ±2 ms of the GPS time accuracy.
Initial position 1. The GPS mark is yellow after connecting the GPS BOX PW9005 to the instrument.2. The GPS mark turns blue after the unit has acquired GPS satellites and positioning status and finished correcting the instrument time.
Time correction processing • Time correction is performed once every 1 s (during recording, once every 30 s).• If the time variation is 16 ms or less during recording, time correction is performed every second
with ms-order precision. If the time variation is greater than 16 ms, a GPS Err event occurs, andtime correction is not performed.
• When synchronizing the time among multiple PW3198 instruments, 200 ms aggregation starttimes may vary for up to 10 minutes from the start of recording.
GPS event function When recording is started in the time-corrected state (while the GPS mark is blue), a GPS event is generated when any of the following occur during recording:• GPS error (GPS error): GPS IN• GPS error cleared (GPS positioning): GPS OUT• GPS time correction failure (GPS time error): GPS Err
13.9 Other FunctionsWarning functions
Out of range When the input exceeds the range by 130%, displays ---.---.Phase/line voltage setting is irrelevant.
Out of crest factor When the waveform peak exceeds 2 the voltage range or 4 the current range, "crest factor exceed-ed" is displayed. The phase/line voltage setting is irrelevant.
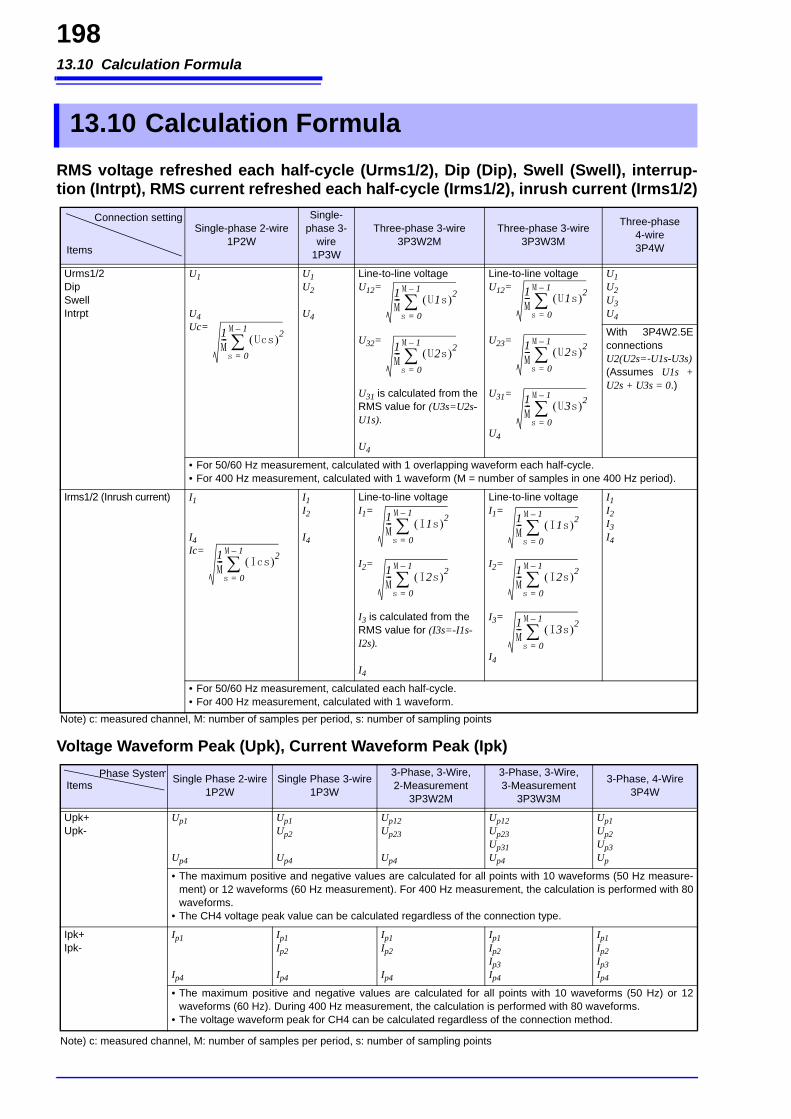
13.10 Calculation Formula
198
Note) c: measured channel, M: number of samples per period, s: number of sampling points
Note) c: measured channel, M: number of samples per period, s: number of sampling points
13.10 Calculation FormulaRMS voltage refreshed each half-cycle (Urms1/2), Dip (Dip), Swell (Swell), interrup-tion (Intrpt), RMS current refreshed each half-cycle (Irms1/2), inrush current (Irms1/2)
Single-phase 2-wire1P2W
Single-phase 3-
wire1P3W
Three-phase 3-wire3P3W2M
Three-phase 3-wire3P3W3M
Three-phase 4-wire3P4W
Urms1/2DipSwellIntrpt
U1
U4Uc=
U1U2
U4
Line-to-line voltageU12=
U32=
U31 is calculated from the RMS value for (U3s=U2s-U1s).
U4
Line-to-line voltageU12=
U23=
U31=
U4
U1U2U3U4
With 3P4W2.5EconnectionsU2(U2s=-U1s-U3s)(Assumes U1s +U2s + U3s = 0.)
• For 50/60 Hz measurement, calculated with 1 overlapping waveform each half-cycle.• For 400 Hz measurement, calculated with 1 waveform (M = number of samples in one 400 Hz period).
Irms1/2 (Inrush current) I1
I4Ic=
I1I2
I4
Line-to-line voltageI1=
I2=
I3 is calculated from the RMS value for (I3s=-I1s-I2s).
I4
Line-to-line voltageI1=
I2=
I3=
I4
I1I2I3I4
• For 50/60 Hz measurement, calculated each half-cycle.• For 400 Hz measurement, calculated with 1 waveform.
Voltage Waveform Peak (Upk), Current Waveform Peak (Ipk)
Single Phase 2-wire1P2W
Single Phase 3-wire1P3W
3-Phase, 3-Wire, 2-Measurement
3P3W2M
3-Phase, 3-Wire, 3-Measurement
3P3W3M
3-Phase, 4-Wire3P4W
Upk+Upk-
Up1
Up4
Up1Up2
Up4
Up12Up23
Up4
Up12Up23Up31Up4
Up1Up2Up3Up
• The maximum positive and negative values are calculated for all points with 10 waveforms (50 Hz measure-ment) or 12 waveforms (60 Hz measurement). For 400 Hz measurement, the calculation is performed with 80waveforms.
• The CH4 voltage peak value can be calculated regardless of the connection type.
Ipk+Ipk-
Ip1
Ip4
Ip1Ip2
Ip4
Ip1Ip2
Ip4
Ip1Ip2Ip3Ip4
Ip1Ip2Ip3Ip4
• The maximum positive and negative values are calculated for all points with 10 waveforms (50 Hz) or 12waveforms (60 Hz). During 400 Hz measurement, the calculation is performed with 80 waveforms.
• The voltage waveform peak for CH4 can be calculated regardless of the connection method.
Connection setting
Items
1M--- Ucs 2
s 0=
M 1–
1M--- U1s 2
s 0=
M 1–
1M--- U2s 2
s 0=
M 1–
1M--- U1s 2
s 0=
M 1–
1M--- U2s 2
s 0=
M 1–
1M--- U3s 2
s 0=
M 1–
1M--- Ics 2
s 0=
M 1–
1M--- I1s 2
s 0=
M 1–
1M--- I2s 2
s 0=
M 1–
1M--- I1s 2
s 0=
M 1–
1M--- I2s 2
s 0=
M 1–
1M--- I3s 2
s 0=
M 1–
Phase SystemItems

13.10 Calculation Formula
199
10
13
Chapter 13 Specifications
Note) c: measured channel, M: number of samples per period, s: number of sampling points
RMS Voltage (Urms), RMS Current (Irms)
Single Phase 2-wire1P2W
Single Phase 3-wire1P3W
3-Phase, 3-Wire, 2-Measurement
3P3W2M
3-Phase, 3-Wire, 3-Measurement
3P3W3M
3-Phase, 4-Wire3P4W
Urms U1
U4Uc=
U1U2
U4
Line-to-line voltageU12=
U32=
U31 is calculated from the RMS value for (U3s=U2s-U1s).
Line-to-line voltageU12=
U23=
U31=
Phase voltageU1U2U3
U4 U4 U4
Phase voltageU1=
U2=
U3=
Line-to-line voltageU12=
U23=
U31=
U4 U4
Uave=Line-to-line voltageUave=
Line-to-line voltageUave=
Phase voltageUave=
Phase voltageUave=
Line-to-line voltageUave=
• Calculated with 10 waveforms (50 Hz measurement) or 12 waveforms (60 Hz measurement). For 400 Hz measurement,the calculation is performed with 80 waveforms.
• For 3-phase 3-wire connections, the phase voltage is calculated so that the neutral point is at the center. The CH4 RMSvoltage can be calculated regardless of the connection type.
Irms I1
I4Ic=
I1I2
I4
I1I2I3 is calculated from the RMS value for (I3s=-I1s-I2s).I4
I1I2I3I4
I1I2I3I4
Iave= Iave= Iave= Iave=
• Calculated with 10 waveforms (50 Hz measurement) or 12 waveforms (60 Hz measurement). For 400 Hz measurement,the calculation is performed with 80 waveforms.
• The CH4 RMS current can be calculated regardless of the connection type.
Phase System
Items
1M--- Ucs 2
s 0=
M 1–
1M--- U1s 2
s 0=
M 1–
1M--- U2s 2
s 0=
M 1–
1M--- U1s 2
s 0=
M 1–
1M--- U2s 2
s 0=
M 1–
1M--- U3s 2
s 0=
M 1–
Phase voltage
1M--- U1s U3s–
3------------------------- 2
s 0=
M 1–
1M--- U2s U1s–
3------------------------- 2
s 0=
M 1–
1M--- U3s U2s–
3------------------------- 2
s 0=
M 1–
1M--- U1s U2s– 2
s 0=
M 1–
1M--- U2s U3s– 2
s 0=
M 1–
1M--- U3s U1s– 2
s 0=
M 1–
12--- U1 U2+
12--- U12 U32+ 1
3--- U12 U23 U31+ +
13--- U1 U2 U3+ +
Phase voltage13--- U1 U2 U3+ + 1
3--- U12 U23 U31+ +
1M--- Ics 2
s 0=
M 1–
12--- I1 I2+ 1
2--- I1 I2+ 1
3--- I1 I2 I3+ + 1
3--- I1 I2 I3+ +
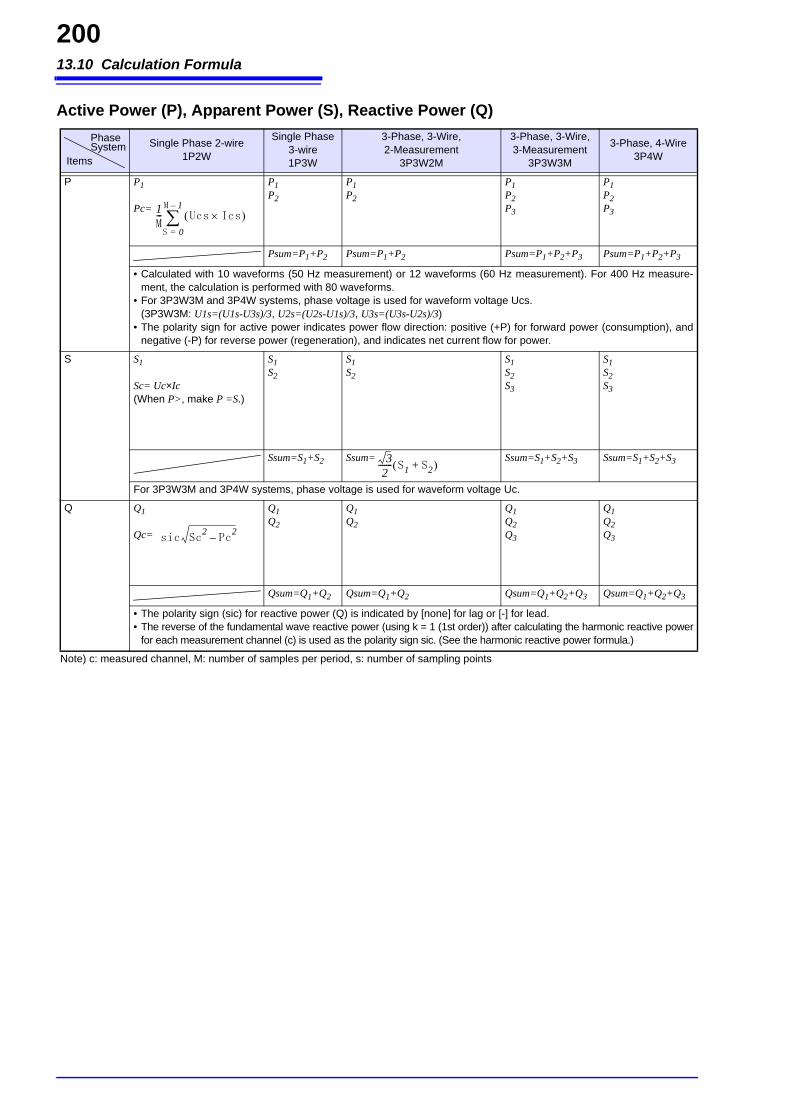
13.10 Calculation Formula
200
Note) c: measured channel, M: number of samples per period, s: number of sampling points
Active Power (P), Apparent Power (S), Reactive Power (Q)
Single Phase 2-wire1P2W
Single Phase 3-wire1P3W
3-Phase, 3-Wire, 2-Measurement
3P3W2M
3-Phase, 3-Wire, 3-Measurement
3P3W3M
3-Phase, 4-Wire3P4W
P P1
Pc=
P1P2
P1P2
P1P2P3
P1P2P3
Psum=P1+P2 Psum=P1+P2 Psum=P1+P2+P3 Psum=P1+P2+P3
• Calculated with 10 waveforms (50 Hz measurement) or 12 waveforms (60 Hz measurement). For 400 Hz measure-ment, the calculation is performed with 80 waveforms.
• For 3P3W3M and 3P4W systems, phase voltage is used for waveform voltage Ucs.(3P3W3M: U1s=(U1s-U3s)/3, U2s=(U2s-U1s)/3, U3s=(U3s-U2s)/3)
• The polarity sign for active power indicates power flow direction: positive (+P) for forward power (consumption), andnegative (-P) for reverse power (regeneration), and indicates net current flow for power.
S S1
Sc= Uc×Ic(When P>, make P =S.)
S1S2
S1S2
S1S2S3
S1S2S3
Ssum=S1+S2 Ssum= Ssum=S1+S2+S3 Ssum=S1+S2+S3
For 3P3W3M and 3P4W systems, phase voltage is used for waveform voltage Uc.
Q Q1
Qc=
Q1Q2
Q1Q2
Q1Q2Q3
Q1Q2Q3
Qsum=Q1+Q2 Qsum=Q1+Q2 Qsum=Q1+Q2+Q3 Qsum=Q1+Q2+Q3
• The polarity sign (sic) for reactive power (Q) is indicated by [none] for lag or [-] for lead.• The reverse of the fundamental wave reactive power (using k = 1 (1st order)) after calculating the harmonic reactive power
for each measurement channel (c) is used as the polarity sign sic. (See the harmonic reactive power formula.)
PhaseSystem
Items
1M--- Ucs Ics S 0=
M 1–
32
------- S1 S2+
sic Sc2
Pc2
–
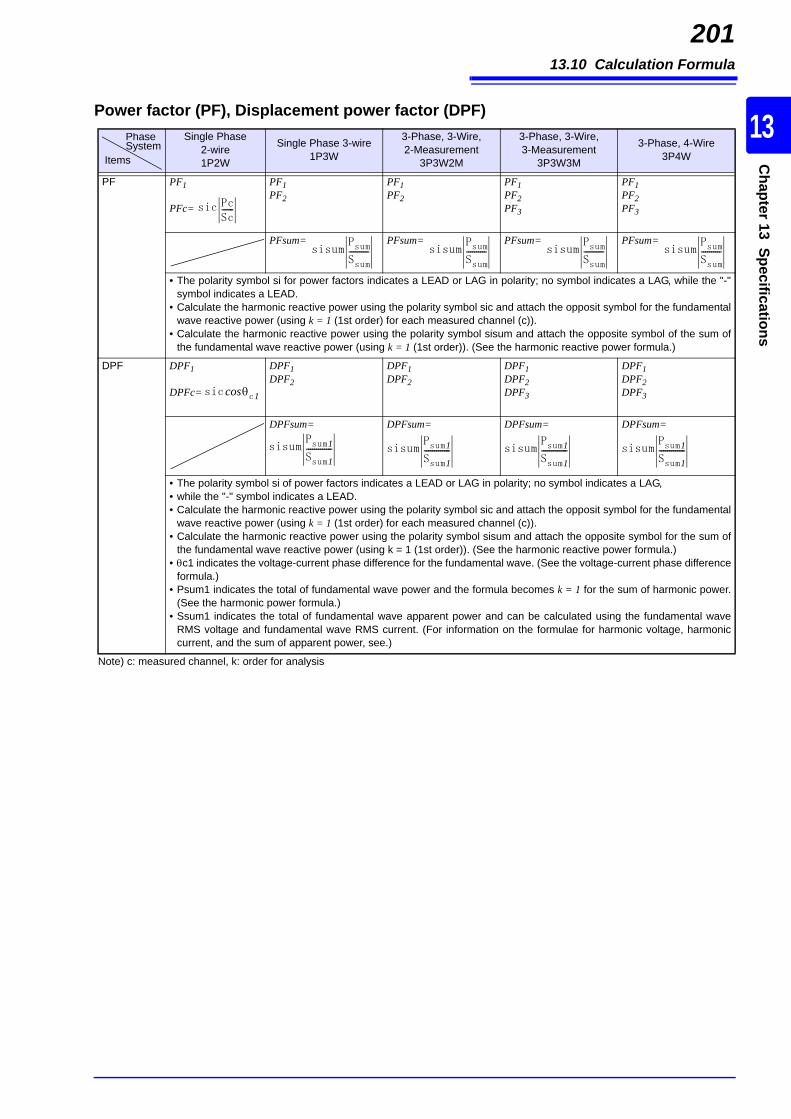
13.10 Calculation Formula
201
10
13
Chapter 13 Specifications
Note) c: measured channel, k: order for analysis
Power factor (PF), Displacement power factor (DPF)Single Phase
2-wire1P2W
Single Phase 3-wire1P3W
3-Phase, 3-Wire, 2-Measurement
3P3W2M
3-Phase, 3-Wire, 3-Measurement
3P3W3M
3-Phase, 4-Wire3P4W
PF PF1
PFc=
PF1PF2
PF1PF2
PF1PF2PF3
PF1PF2PF3
PFsum= PFsum= PFsum= PFsum=
• The polarity symbol si for power factors indicates a LEAD or LAG in polarity; no symbol indicates a LAG, while the "-"symbol indicates a LEAD.
• Calculate the harmonic reactive power using the polarity symbol sic and attach the opposit symbol for the fundamentalwave reactive power (using k = 1 (1st order) for each measured channel (c)).
• Calculate the harmonic reactive power using the polarity symbol sisum and attach the opposite symbol of the sum ofthe fundamental wave reactive power (using k = 1 (1st order)). (See the harmonic reactive power formula.)
DPF DPF1
DPFc=
DPF1DPF2
DPF1DPF2
DPF1DPF2DPF3
DPF1DPF2DPF3
DPFsum=
DPFsum= DPFsum= DPFsum=
• The polarity symbol si of power factors indicates a LEAD or LAG in polarity; no symbol indicates a LAG,• while the "-" symbol indicates a LEAD.• Calculate the harmonic reactive power using the polarity symbol sic and attach the opposit symbol for the fundamental
wave reactive power (using k = 1 (1st order) for each measured channel (c)).• Calculate the harmonic reactive power using the polarity symbol sisum and attach the opposite symbol for the sum of
the fundamental wave reactive power (using k = 1 (1st order)). (See the harmonic reactive power formula.)• c1 indicates the voltage-current phase difference for the fundamental wave. (See the voltage-current phase difference
formula.)• Psum1 indicates the total of fundamental wave power and the formula becomes k = 1 for the sum of harmonic power.
(See the harmonic power formula.)• Ssum1 indicates the total of fundamental wave apparent power and can be calculated using the fundamental wave
RMS voltage and fundamental wave RMS current. (For information on the formulae for harmonic voltage, harmoniccurrent, and the sum of apparent power, see.)
Phase System
Items
sic PcSc------
sisumPsumSsum---------- sisum
PsumSsum---------- sisum
PsumSsum---------- sisum
PsumSsum----------
sic c1cos
sisumPsum1
Ssum1------------- sisum
Psum1
Ssum1------------- sisum
Psum1
Ssum1------------- sisum
Psum1
Ssum1-------------
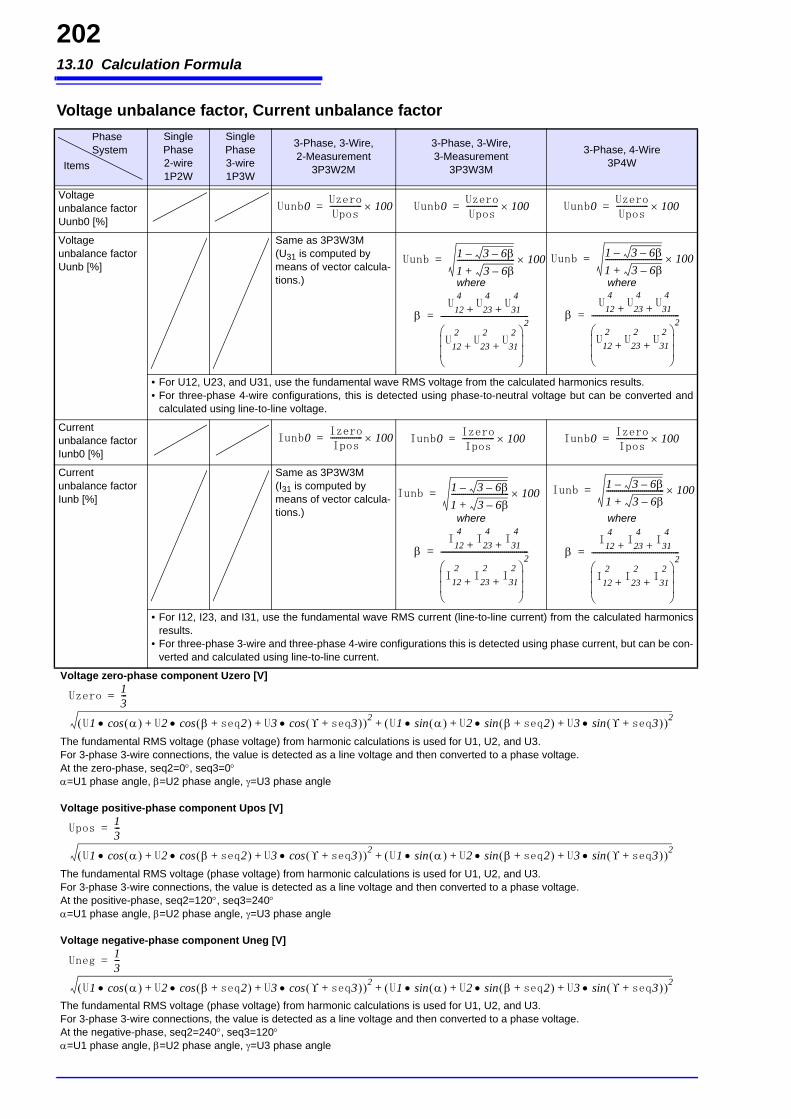
13.10 Calculation Formula
202
Voltage zero-phase component Uzero [V]
The fundamental RMS voltage (phase voltage) from harmonic calculations is used for U1, U2, and U3. For 3-phase 3-wire connections, the value is detected as a line voltage and then converted to a phase voltage.At the zero-phase, seq2=0, seq3=0=U1 phase angle, =U2 phase angle, =U3 phase angle
Voltage positive-phase component Upos [V]
The fundamental RMS voltage (phase voltage) from harmonic calculations is used for U1, U2, and U3. For 3-phase 3-wire connections, the value is detected as a line voltage and then converted to a phase voltage.At the positive-phase, seq2=120, seq3=240=U1 phase angle, =U2 phase angle, =U3 phase angle
Voltage negative-phase component Uneg [V]
The fundamental RMS voltage (phase voltage) from harmonic calculations is used for U1, U2, and U3. For 3-phase 3-wire connections, the value is detected as a line voltage and then converted to a phase voltage.At the negative-phase, seq2=240, seq3=120=U1 phase angle, =U2 phase angle, =U3 phase angle
Voltage unbalance factor, Current unbalance factorSingle Phase 2-wire1P2W
Single Phase 3-wire1P3W
3-Phase, 3-Wire, 2-Measurement
3P3W2M
3-Phase, 3-Wire, 3-Measurement
3P3W3M
3-Phase, 4-Wire3P4W
Voltage unbalance factorUunb0 [%]
Voltage unbalance factorUunb [%]
Same as 3P3W3M(U31 is computed by means of vector calcula-tions.) where where
• For U12, U23, and U31, use the fundamental wave RMS voltage from the calculated harmonics results.• For three-phase 4-wire configurations, this is detected using phase-to-neutral voltage but can be converted and
calculated using line-to-line voltage.
Current unbalance factorIunb0 [%]
Current unbalance factorIunb [%]
Same as 3P3W3M(I31 is computed by means of vector calcula-tions.) where where
• For I12, I23, and I31, use the fundamental wave RMS current (line-to-line current) from the calculated harmonicsresults.
• For three-phase 3-wire and three-phase 4-wire configurations this is detected using phase current, but can be con-verted and calculated using line-to-line current.
Phase System
Items
Uunb0UzeroUpos
---------------- 100= Uunb0UzeroUpos
---------------- 100= Uunb0UzeroUpos---------------- 100=
Uunb1 3 6––
1 3 6–+----------------------------- 100=
U
4
12U
4
23U
4
31+ +
U2
12U
2
23U
2
31+ +
2--------------------------------------------=
Uunb1 3 6––
1 3 6–+----------------------------- 100=
U
4
12U
4
23U
4
31+ +
U2
12U
2
23U
2
31+ +
2--------------------------------------------=
Iunb0IzeroIpos---------------- 100= Iunb0
IzeroIpos
---------------- 100= Iunb0IzeroIpos---------------- 100=
Iunb1 3 6––
1 3 6–+----------------------------- 100=
I
4
12I
4
23I
4
31+ +
I2
12I
2
23I
2
31+ +
2--------------------------------------------=
Iunb1 3 6––
1 3 6–+----------------------------- 100=
I
4
12I
4
23I
4
31+ +
I2
12I
2
23I
2
31+ +
2--------------------------------------------=
Uzero13---
U1 cos U2 seq2+ cos U3 seq3+ cos+ + 2 U1 sin U2 seq2+ sin U3 seq3+ sin+ + 2+
=
Upos13---
U1 cos U2 seq2+ cos U3 seq3+ cos+ + 2 U1 sin U2 seq2+ sin U3 seq3+ sin+ + 2+
=
Uneg13---
U1 cos U2 seq2+ cos U3 seq3+ cos+ + 2 U1 sin U2 seq2+ sin U3 seq3+ sin+ + 2+
=
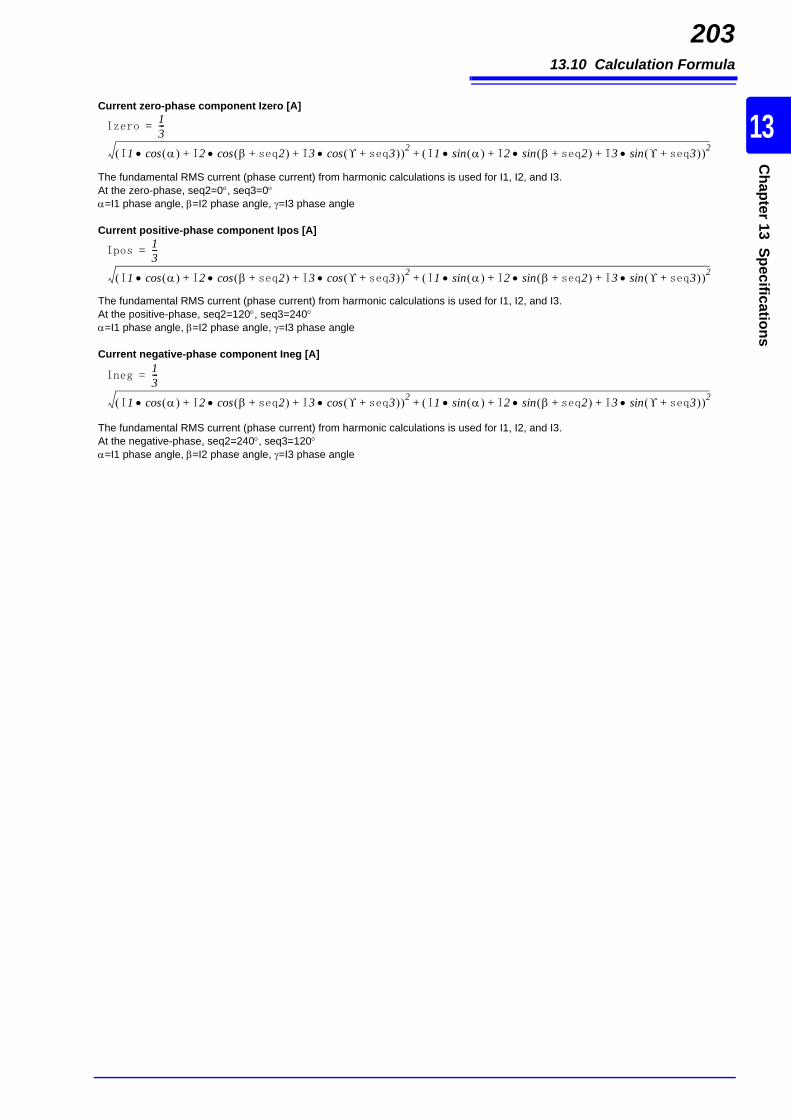
13.10 Calculation Formula
203
10
13
Chapter 13 Specifications
Current zero-phase component Izero [A]
The fundamental RMS current (phase current) from harmonic calculations is used for I1, I2, and I3.At the zero-phase, seq2=0, seq3=0=I1 phase angle, =I2 phase angle, =I3 phase angle
Current positive-phase component Ipos [A]
The fundamental RMS current (phase current) from harmonic calculations is used for I1, I2, and I3.At the positive-phase, seq2=120, seq3=240=I1 phase angle, =I2 phase angle, =I3 phase angle
Current negative-phase component Ineg [A]
The fundamental RMS current (phase current) from harmonic calculations is used for I1, I2, and I3.At the negative-phase, seq2=240, seq3=120=I1 phase angle, =I2 phase angle, =I3 phase angle
Izero13---
I1 cos I2 seq2+ cos I3 seq3+ cos+ + 2 I1 sin I2 seq2+ sin I3 seq3+ sin+ + 2+
=
Ipos13---
I1 cos I2 seq2+ cos I3 seq3+ cos+ + 2 I1 sin I2 seq2+ sin I3 seq3+ sin+ + 2+
=
Ineg13---
I1 cos I2 seq2+ cos I3 seq3+ cos+ + 2 I1 sin I2 seq2+ sin I3 seq3+ sin+ + 2+
=
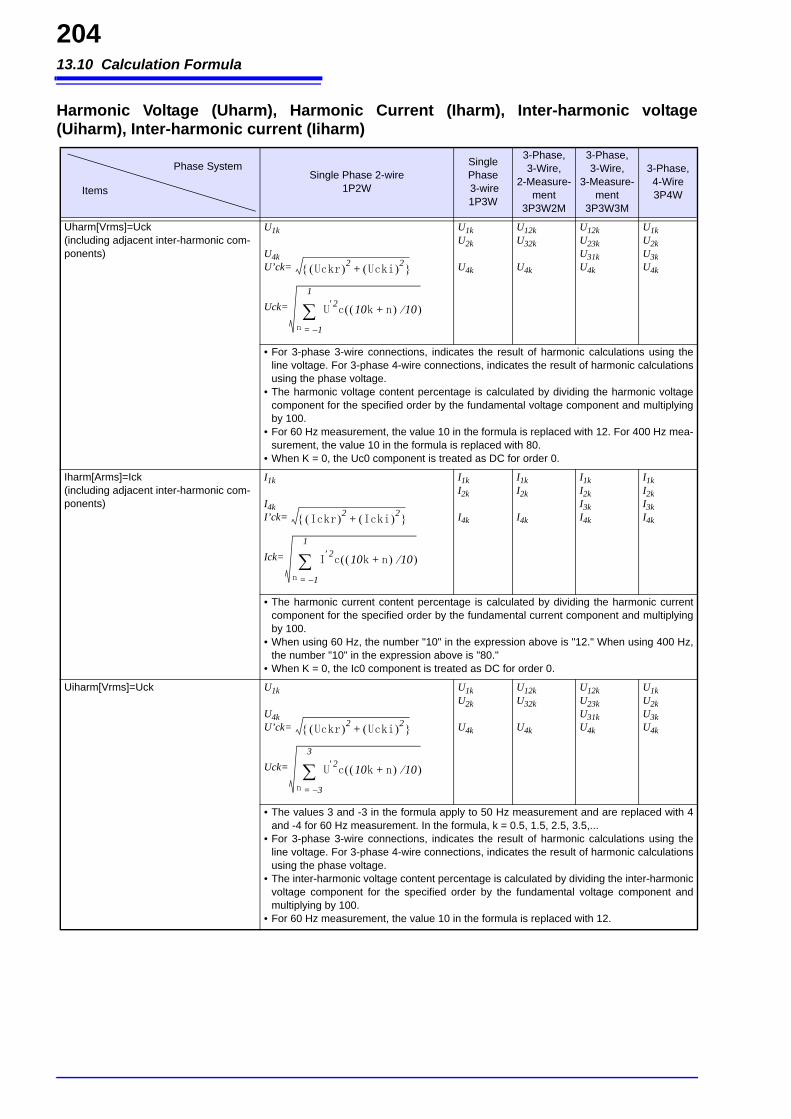
13.10 Calculation Formula
204
Harmonic Voltage (Uharm), Harmonic Current (Iharm), Inter-harmonic voltage(Uiharm), Inter-harmonic current (Iiharm)
Single Phase 2-wire1P2W
Single Phase 3-wire1P3W
3-Phase, 3-Wire,
2-Measure-ment
3P3W2M
3-Phase, 3-Wire,
3-Measure-ment
3P3W3M
3-Phase, 4-Wire3P4W
Uharm[Vrms]=Uck(including adjacent inter-harmonic com-ponents)
U1k
U4kU’ck=
Uck=
U1kU2k
U4k
U12kU32k
U4k
U12kU23kU31kU4k
U1kU2kU3kU4k
• For 3-phase 3-wire connections, indicates the result of harmonic calculations using theline voltage. For 3-phase 4-wire connections, indicates the result of harmonic calculationsusing the phase voltage.
• The harmonic voltage content percentage is calculated by dividing the harmonic voltagecomponent for the specified order by the fundamental voltage component and multiplyingby 100.
• For 60 Hz measurement, the value 10 in the formula is replaced with 12. For 400 Hz mea-surement, the value 10 in the formula is replaced with 80.
• When K = 0, the Uc0 component is treated as DC for order 0.
Iharm[Arms]=Ick(including adjacent inter-harmonic com-ponents)
I1k
I4kI’ck=
Ick=
I1kI2k
I4k
I1kI2k
I4k
I1kI2kI3kI4k
I1kI2kI3kI4k
• The harmonic current content percentage is calculated by dividing the harmonic currentcomponent for the specified order by the fundamental current component and multiplyingby 100.
• When using 60 Hz, the number "10" in the expression above is "12." When using 400 Hz,the number "10" in the expression above is "80."
• When K = 0, the Ic0 component is treated as DC for order 0.
Uiharm[Vrms]=Uck U1k
U4kU’ck=
Uck=
U1kU2k
U4k
U12kU32k
U4k
U12kU23kU31kU4k
U1kU2kU3kU4k
• The values 3 and -3 in the formula apply to 50 Hz measurement and are replaced with 4and -4 for 60 Hz measurement. In the formula, k = 0.5, 1.5, 2.5, 3.5,...
• For 3-phase 3-wire connections, indicates the result of harmonic calculations using theline voltage. For 3-phase 4-wire connections, indicates the result of harmonic calculationsusing the phase voltage.
• The inter-harmonic voltage content percentage is calculated by dividing the inter-harmonicvoltage component for the specified order by the fundamental voltage component andmultiplying by 100.
• For 60 Hz measurement, the value 10 in the formula is replaced with 12.
Phase System
Items
Uckr 2 Ucki 2+
U2c 10k n+ 10
n 1–=
1
Ickr 2 Icki 2+
I2c 10k n+ 10
n 1–=
1
Uckr 2 Ucki 2+
U2c 10k n+ 10
n 3–=
3
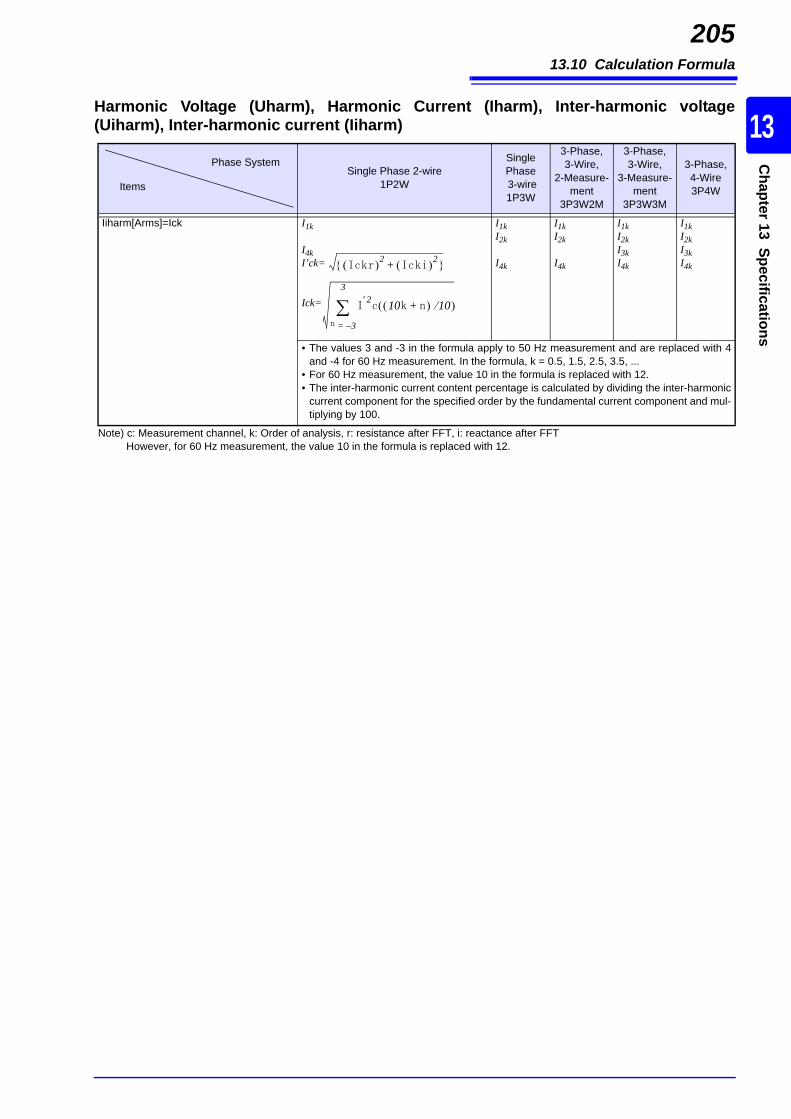
13.10 Calculation Formula
205
10
13
Chapter 13 Specifications
Note) c: Measurement channel, k: Order of analysis, r: resistance after FFT, i: reactance after FFTHowever, for 60 Hz measurement, the value 10 in the formula is replaced with 12.
Iiharm[Arms]=Ick I1k
I4kI’ck=
Ick=
I1kI2k
I4k
I1kI2k
I4k
I1kI2kI3kI4k
I1kI2kI3kI4k
• The values 3 and -3 in the formula apply to 50 Hz measurement and are replaced with 4and -4 for 60 Hz measurement. In the formula, k = 0.5, 1.5, 2.5, 3.5, ...
• For 60 Hz measurement, the value 10 in the formula is replaced with 12.• The inter-harmonic current content percentage is calculated by dividing the inter-harmonic
current component for the specified order by the fundamental current component and mul-tiplying by 100.
Harmonic Voltage (Uharm), Harmonic Current (Iharm), Inter-harmonic voltage(Uiharm), Inter-harmonic current (Iiharm)
Single Phase 2-wire1P2W
Single Phase 3-wire1P3W
3-Phase, 3-Wire,
2-Measure-ment
3P3W2M
3-Phase, 3-Wire,
3-Measure-ment
3P3W3M
3-Phase, 4-Wire3P4W
Phase System
Items
Ickr 2 Icki 2+
I2c 10k n+ 10
n 3–=
3
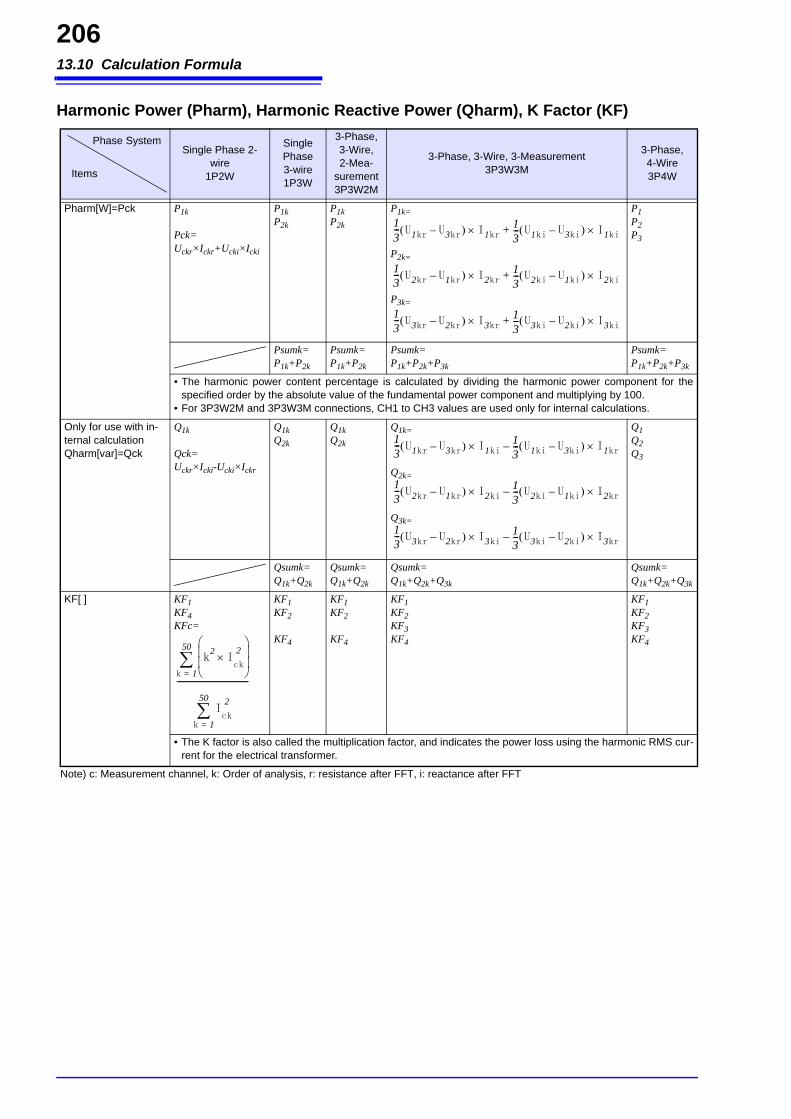
13.10 Calculation Formula
206
Note) c: Measurement channel, k: Order of analysis, r: resistance after FFT, i: reactance after FFT
Harmonic Power (Pharm), Harmonic Reactive Power (Qharm), K Factor (KF)
Single Phase 2-wire
1P2W
Single Phase 3-wire1P3W
3-Phase, 3-Wire, 2-Mea-
surement3P3W2M
3-Phase, 3-Wire, 3-Measurement3P3W3M
3-Phase, 4-Wire3P4W
Pharm[W]=Pck P1k
Pck=Uckr×Ickr+Ucki×Icki
P1kP2k
P1kP2k
P1k=
P2k=
P3k=
P1P2P3
Psumk=P1k+P2k
Psumk=P1k+P2k
Psumk=P1k+P2k+P3k
Psumk=P1k+P2k+P3k
• The harmonic power content percentage is calculated by dividing the harmonic power component for thespecified order by the absolute value of the fundamental power component and multiplying by 100.
• For 3P3W2M and 3P3W3M connections, CH1 to CH3 values are used only for internal calculations.
Only for use with in-ternal calculationQharm[var]=Qck
Q1k
Qck=Uckr×Icki-Ucki×Ickr
Q1kQ2k
Q1kQ2k
Q1k=
Q2k=
Q3k=
Q1Q2Q3
Qsumk=Q1k+Q2k
Qsumk=Q1k+Q2k
Qsumk=Q1k+Q2k+Q3k
Qsumk=Q1k+Q2k+Q3k
KF[ ] KF1KF4KFc=
KF1KF2
KF4
KF1KF2
KF4
KF1KF2KF3KF4
KF1KF2KF3KF4
• The K factor is also called the multiplication factor, and indicates the power loss using the harmonic RMS cur-rent for the electrical transformer.
Phase System
Items
13--- U1kr U3kr– I1kr
13---+ U1ki U3ki– I1ki
13--- U2kr U1kr– I2kr
13---+ U2ki U1ki– I2ki
13--- U3kr U2kr– I3kr
13---+ U3ki U2ki– I3ki
13--- U1kr U3kr– I1ki
13---– U1ki U3ki– I1kr
13--- U2kr U1kr– I2ki
13---– U2ki U1ki– I2kr
13--- U3kr U2kr– I3ki
13---– U3ki U2ki– I3kr
k2
I2
ck
k 1=
50
I2
ckk 1=
50
------------------------------------
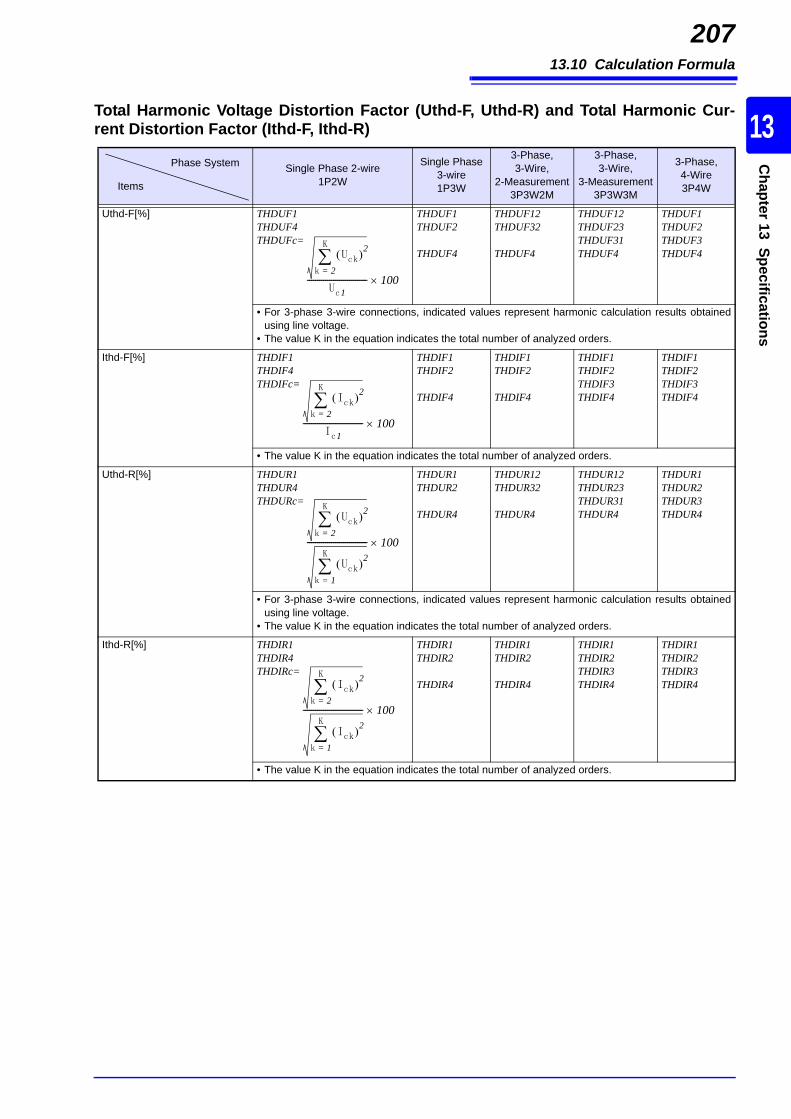
13.10 Calculation Formula
207
10
13
Chapter 13 Specifications
Total Harmonic Voltage Distortion Factor (Uthd-F, Uthd-R) and Total Harmonic Cur-rent Distortion Factor (Ithd-F, Ithd-R)
Single Phase 2-wire1P2W
Single Phase 3-wire1P3W
3-Phase, 3-Wire,
2-Measurement3P3W2M
3-Phase, 3-Wire,
3-Measurement3P3W3M
3-Phase, 4-Wire3P4W
Uthd-F[%] THDUF1THDUF4THDUFc=
THDUF1THDUF2
THDUF4
THDUF12THDUF32
THDUF4
THDUF12THDUF23THDUF31THDUF4
THDUF1THDUF2THDUF3THDUF4
• For 3-phase 3-wire connections, indicated values represent harmonic calculation results obtainedusing line voltage.
• The value K in the equation indicates the total number of analyzed orders.
Ithd-F[%] THDIF1THDIF4THDIFc=
THDIF1THDIF2
THDIF4
THDIF1THDIF2
THDIF4
THDIF1THDIF2THDIF3THDIF4
THDIF1THDIF2THDIF3THDIF4
• The value K in the equation indicates the total number of analyzed orders.
Uthd-R[%] THDUR1THDUR4THDURc=
THDUR1THDUR2
THDUR4
THDUR12THDUR32
THDUR4
THDUR12THDUR23THDUR31THDUR4
THDUR1THDUR2THDUR3THDUR4
• For 3-phase 3-wire connections, indicated values represent harmonic calculation results obtainedusing line voltage.
• The value K in the equation indicates the total number of analyzed orders.
Ithd-R[%] THDIR1THDIR4THDIRc=
THDIR1THDIR2
THDIR4
THDIR1THDIR2
THDIR4
THDIR1THDIR2THDIR3THDIR4
THDIR1THDIR2THDIR3THDIR4
• The value K in the equation indicates the total number of analyzed orders.
Phase System
Items
Uck 2
k 2=
K
Uc1------------------------------ 100
Ick 2
k 2=
K
Ic1------------------------------ 100
Uck 2
k 2=
K
Uck 2
k 1=
K
------------------------------ 100
Ick 2
k 2=
K
Ick 2
k 1=
K
------------------------------ 100

13.10 Calculation Formula
208
Note: c: measurement channel; k: order of analysis; r: resistance after FFT; i: reactance after FFT
Note: c: measurement channel
Harmonic Voltage Phase Angle (Uphase), Harmonic Current Phase Angle (Iphase),Phase Difference Of Harmonic Voltage And Harmonic Current (Pphase)
Single Phase 2-wire1P2W
Single Phase 3-wire1P3W
3-Phase, 3-Wire, 2-Measurement
3P3W2M
3-Phase, 3-Wire, 3-Measurement
3P3W3M
3-Phase, 4-Wire3P4W
Uphase[deg]=Uk U1kU4kUck=tan-1
U1kU2k
U4k
U12kU32k
U4k
U12kU23kU31kU4k
U1kU2kU3kU4k
• For 3-phase 3-wire connections, indicated values represent harmonic calculation results obtained using line voltage. • The harmonic voltage phase angle is displayed after correction using the reference channel’s fundamental
wave to 0. • When Uckr=Ucki=0, uk=0• The harmonic voltage used in calculations is calculated using only whole-number orders.
Iphase[deg]=Ik I1kI4kIck=tan-1
I1kI2k
I4k
I1kI2k
4k
I1kI2kI3kI4k
I1kI2kI3kI4k
• The harmonic voltage phase angle is displayed after correction using the reference channel’s fundamentalwave to 0.
• When Ickr=Icki=0, Ik=0• The harmonic voltage used in calculations is calculated using only whole-number orders.
Pphase[deg]=k 1k
ck=cIk-cUk
1k2k
1k2k3k
sum=tan-1 sum=tan-1 sum=tan-1 sum=tan-1
• When Psumk=Qsumk=0, k=0• Psumk indicates the total harmonic power (see the equations for harmonic power).• Qsumk indicates total harmonic reactive power (see the equations for harmonic reactive power).
Voltage Flicker (dV10), Short Interval Voltage Flicker (Pst), and Long Interval VoltageFlicker (Plt)
Single Phase 2-wire1P2W
Single Phase 3-wire1P3W
3-Phase, 3-Wire,
2-Measurement3P3W2M
3-Phase, 3-Wire,
3-Measurement3P3W3M
3-Phase, 4-Wire3P4W
dV10=V10 V10(1)
V10(c)=
V10(1)V10(2)
V10(12)V10(32)
V10(12)V10(23)V10(31)
V10(1)V10(2)V10(3)
• Uf represents the reference voltage for voltage flicker and indicates the 1-minute average of RMS voltage values.• an represents the flicker luminosity coefficient corresponding to the fluctuation frequency fn [Hz] calculated from
the flicker luminosity curve.• Un represents the voltage fluctuation in fn.
Pst Pst1Pstc=
Pst1Pst2
Pst1Pst2
Pst1Pst2Pst3
Pst1Pst2Pst3
• Indicates values for K1=0.0314, K2=0.0525, K3=0.0657, K4=0.28, and K5=0.08.• Calculations are performed using a 1,024-class cumulative probability function (CPF). • Results are calculated from cumulative probability (Pi) values using linear interpolation, smoothed using the fol-
lowing methods, and used to calculate the cumulative probability (Pis):P1s=(P0.7+P1+P1.5)/3, P3S=(P2.2+P3+P4)/3, P10s=(P6+P8+P10+P13+P17)/5, P50s=(P30+P50+P80)/3
Plt Plt1Pltc=
Plt1Plt2
Plt1Plt2
Plt1Plt2Plt3
Plt1Plt2Plt3
• N indicates the number of measurements (N=12). (When N<12, the number of measurements is used as N.)
Phase System
Items
UckrUcki–
----------------
IckrIcki–
----------------
QsumkPsumk----------------
Qsumk
Psumk----------------
Qsumk
Psumk----------------
Qsumk
Psumk----------------
Phase System
Items
100
Uf2
--------- an Un 2
K1P0.1 K2P1s K3P3s K4P10s K5P50s+ + + +
Pstn 3
n 1=
N
N
-------------------------------3

13.10 Calculation Formula
209
10
13
Chapter 13 Specifications
Active energy (WP), reactive energy (WQ)
Single Phase 2-wire1P2W
Single Phase 3-wire1P3W
3-Phase, 3-Wire,
2-Measure-ment
3P3W2M
3-Phase, 3-Wire,
3-Measure-ment
3P3W3M
3-Phase, 4-Wire3P4W
WP+WP1+= WPsum+=
• h: measurement period; k: coefficient for converting to 1 hour• (+): Value is only used when positive (consumption).
WP-WP1-= WPsum+=
• h: measurement time, k: coefficient converted to 1 hour• (-): Value is only used when negative (regeneration).
WQLAGWQLag=
WQLAG=
• h: measurement time, k: coefficient converted to 1 hour• (+): Value is only used when positive (lag).
WQLEADWQLEAD=
WQLEAD=
• h: measurement time, k: coefficient converted to 1 hour• (-): Value is only used when negative (lead).
Phase System
Items
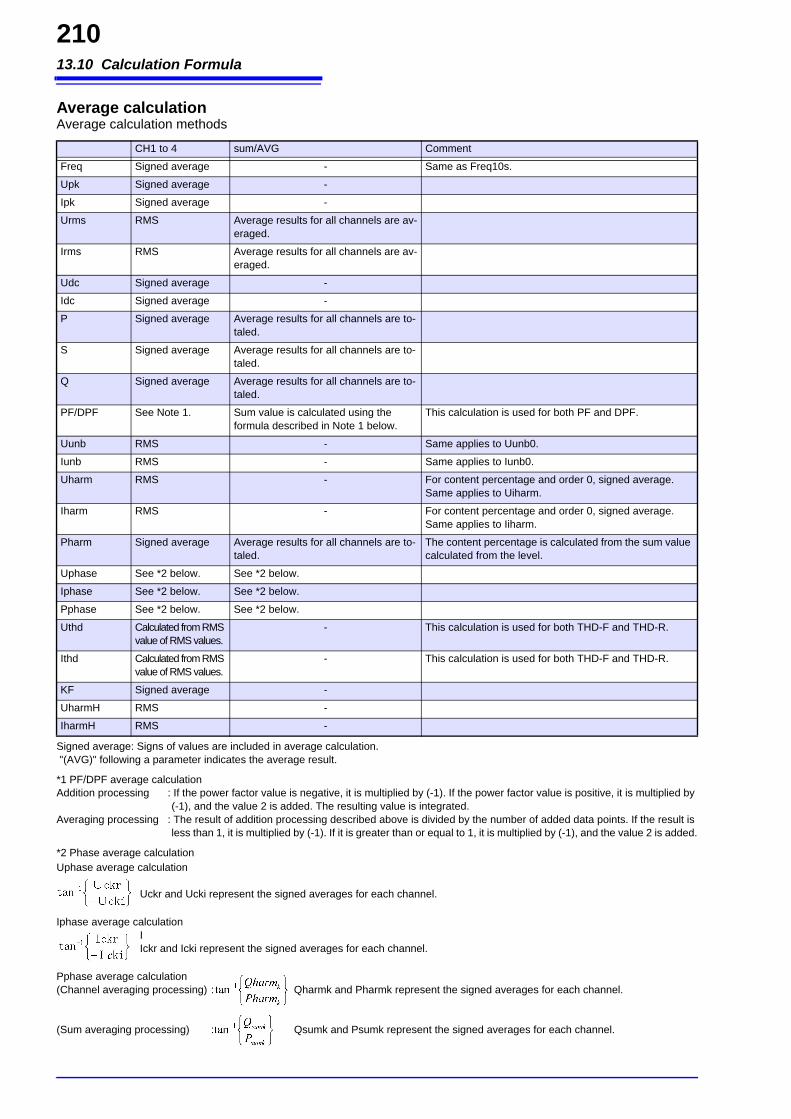
13.10 Calculation Formula
210
Average calculation
Signed average: Signs of values are included in average calculation. "(AVG)" following a parameter indicates the average result.
*1 PF/DPF average calculationAddition processing : If the power factor value is negative, it is multiplied by (-1). If the power factor value is positive, it is multiplied by
(-1), and the value 2 is added. The resulting value is integrated.Averaging processing : The result of addition processing described above is divided by the number of added data points. If the result is
less than 1, it is multiplied by (-1). If it is greater than or equal to 1, it is multiplied by (-1), and the value 2 is added.
*2 Phase average calculation Uphase average calculation
Uckr and Ucki represent the signed averages for each channel.
Iphase average calculationIIckr and Icki represent the signed averages for each channel.
Pphase average calculation(Channel averaging processing) : Qharmk and Pharmk represent the signed averages for each channel.
(Sum averaging processing) : Qsumk and Psumk represent the signed averages for each channel.
Average calculation methods
CH1 to 4 sum/AVG Comment
Freq Signed average - Same as Freq10s.
Upk Signed average -
Ipk Signed average -
Urms RMS Average results for all channels are av-eraged.
Irms RMS Average results for all channels are av-eraged.
Udc Signed average -
Idc Signed average -
P Signed average Average results for all channels are to-taled.
S Signed average Average results for all channels are to-taled.
Q Signed average Average results for all channels are to-taled.
PF/DPF See Note 1. Sum value is calculated using the formula described in Note 1 below.
This calculation is used for both PF and DPF.
Uunb RMS - Same applies to Uunb0.
Iunb RMS - Same applies to Iunb0.
Uharm RMS - For content percentage and order 0, signed average. Same applies to Uiharm.
Iharm RMS - For content percentage and order 0, signed average. Same applies to Iiharm.
Pharm Signed average Average results for all channels are to-taled.
The content percentage is calculated from the sum value calculated from the level.
Uphase See *2 below. See *2 below.
Iphase See *2 below. See *2 below.
Pphase See *2 below. See *2 below.
Uthd Calculated from RMS value of RMS values.
- This calculation is used for both THD-F and THD-R.
Ithd Calculated from RMS value of RMS values.
- This calculation is used for both THD-F and THD-R.
KF Signed average -
UharmH RMS -
IharmH RMS -
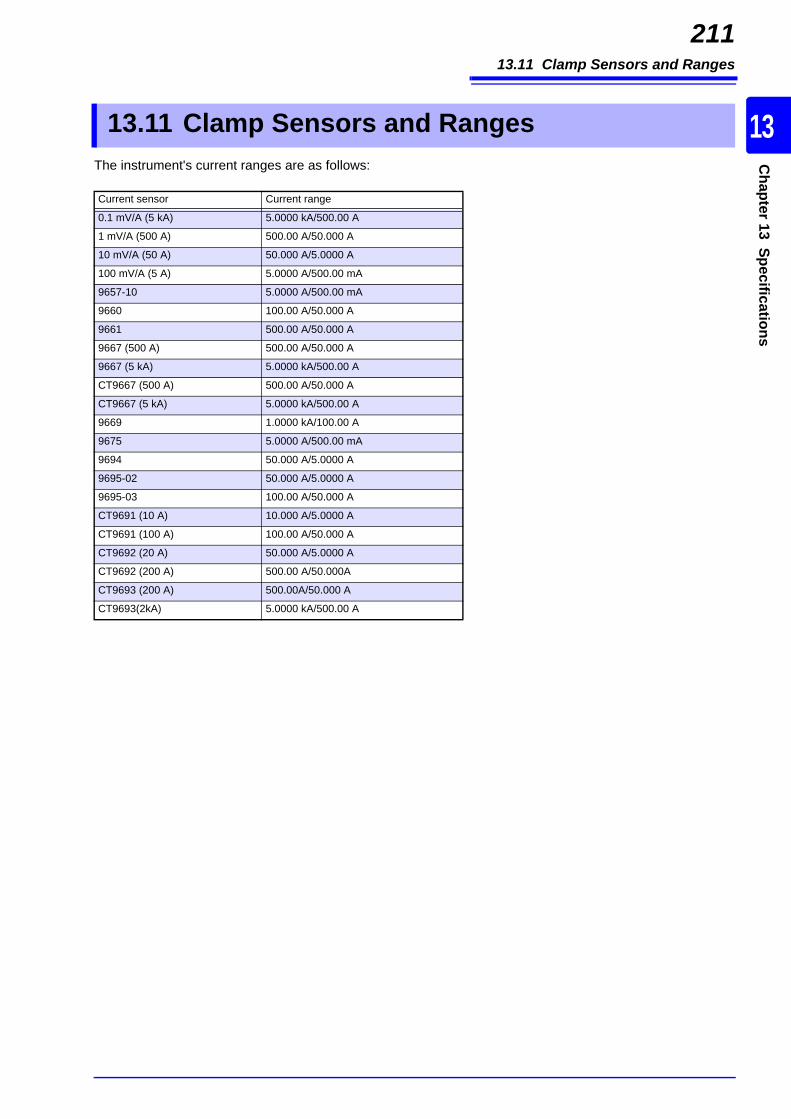
13.11 Clamp Sensors and Ranges
211
10
13
Chapter 13 Specifications
The instrument's current ranges are as follows:
13.11 Clamp Sensors and Ranges
Current sensor Current range
0.1 mV/A (5 kA) 5.0000 kA/500.00 A
1 mV/A (500 A) 500.00 A/50.000 A
10 mV/A (50 A) 50.000 A/5.0000 A
100 mV/A (5 A) 5.0000 A/500.00 mA
9657-10 5.0000 A/500.00 mA
9660 100.00 A/50.000 A
9661 500.00 A/50.000 A
9667 (500 A) 500.00 A/50.000 A
9667 (5 kA) 5.0000 kA/500.00 A
CT9667 (500 A) 500.00 A/50.000 A
CT9667 (5 kA) 5.0000 kA/500.00 A
9669 1.0000 kA/100.00 A
9675 5.0000 A/500.00 mA
9694 50.000 A/5.0000 A
9695-02 50.000 A/5.0000 A
9695-03 100.00 A/50.000 A
CT9691 (10 A) 10.000 A/5.0000 A
CT9691 (100 A) 100.00 A/50.000 A
CT9692 (20 A) 50.000 A/5.0000 A
CT9692 (200 A) 500.00 A/50.000A
CT9693 (200 A) 500.00A/50.000 A
CT9693(2kA) 5.0000 kA/500.00 A
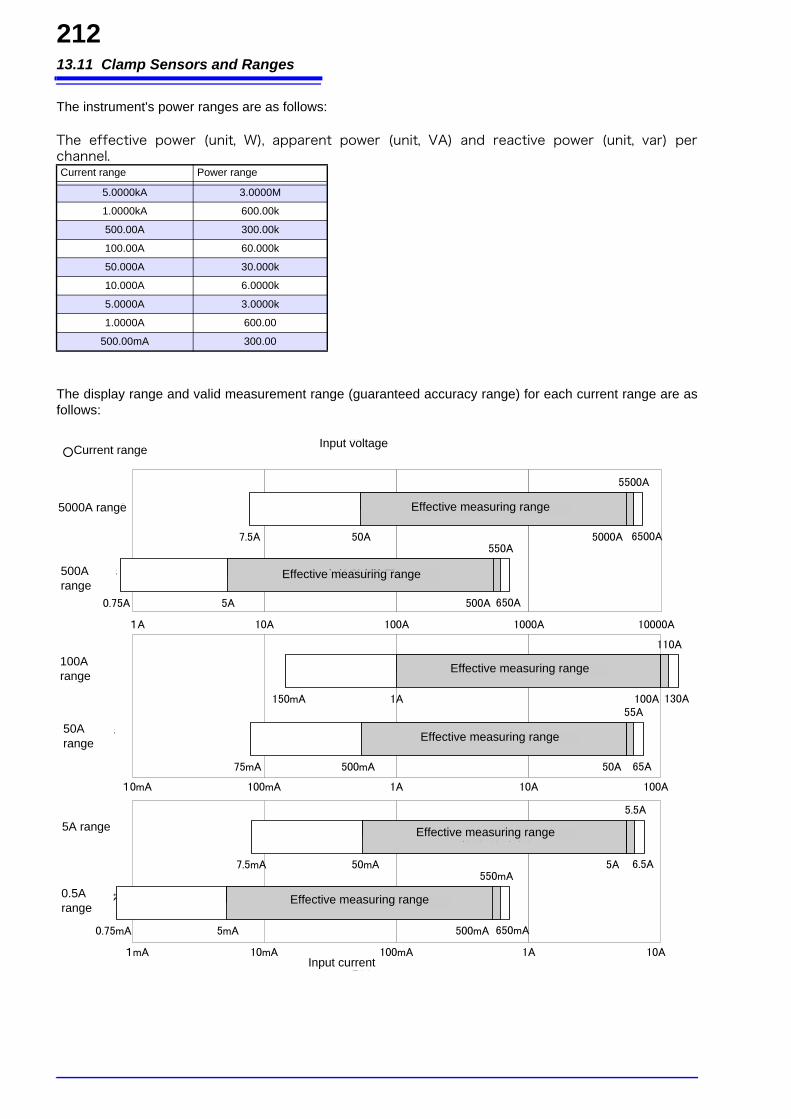
13.11 Clamp Sensors and Ranges
212
The instrument's power ranges are as follows:
The effective power (unit, W), apparent power (unit, VA) and reactive power (unit, var) perchannel.
The display range and valid measurement range (guaranteed accuracy range) for each current range are asfollows:
Current range Power range
5.0000kA 3.0000M
1.0000kA 600.00k
500.00A 300.00k
100.00A 60.000k
50.000A 30.000k
10.000A 6.0000k
5.0000A 3.0000k
1.0000A 600.00
500.00mA 300.00
入力電圧
入力電流
電流レンジ
有効測定範囲
5000A
5500A
6500A50A7.5A
5000Aレンジ
550A
有効測定範囲
500A 650A5A0.75A
500Aレンジ
110A
有効測定範囲
100A 130A1A150mA
100Aレンジ
1A 10A 100A 1000A 10000A
10mA 100mA 1A 10A 100A
50Aレンジ
5Aレンジ
1mA 10mA 100mA 1A 10A
0.5Aレンジ
5.5A
有効測定範囲
5A 6.5A50mA7.5mA
有効測定範囲
500mA 650mA5mA0.75mA
550mA
有効測定範囲
50A 65A500mA75mA
55A
Current range Input voltage
Input current
5000A range
500A range
100A range
50A range
5A range
0.5A range
Effective measuring range
Effective measuring range
Effective measuring range
Effective measuring range
Effective measuring range
Effective measuring range
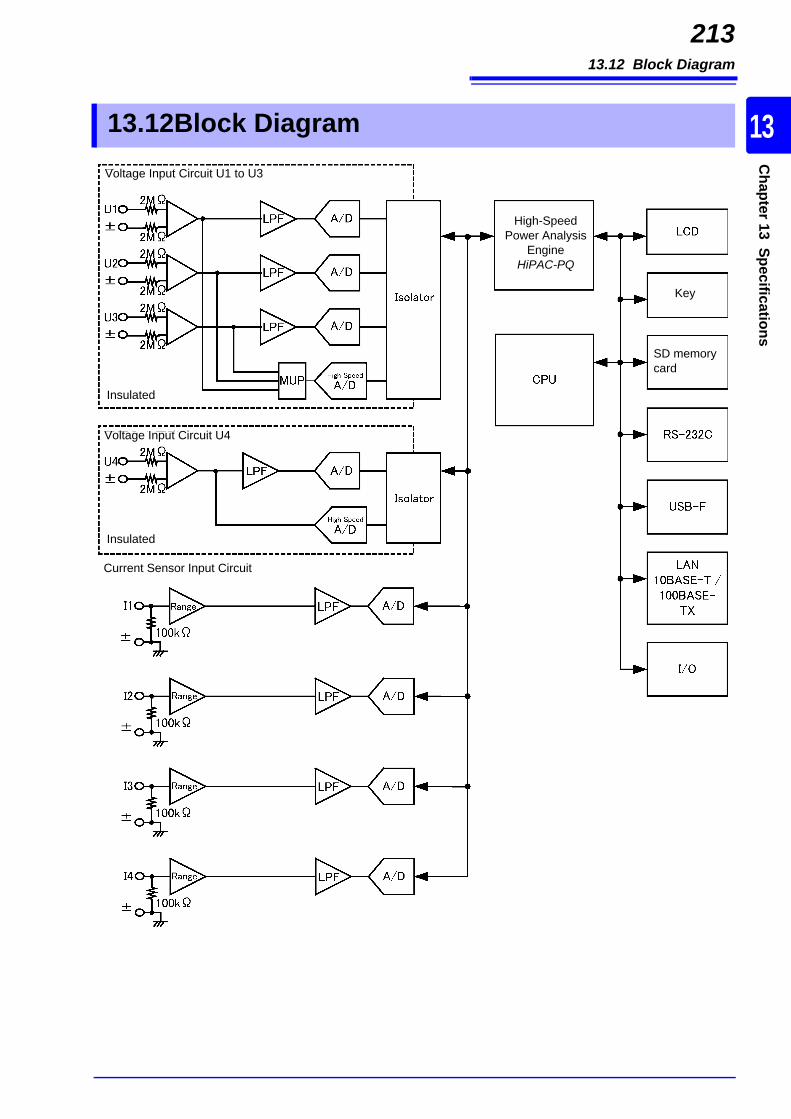
13.12 Block Diagram
213
10
13
Chapter 13 Specifications
13.12Block DiagramVoltage Input Circuit U1 to U3
Voltage Input Circuit U4
High-Speed Power Analysis
EngineHiPAC-PQ
Key
SD memory card
Current Sensor Input Circuit
Insulated
Insulated

13.12 Block Diagram
214
14.1 Cleaning
215C
hapter 14 Maintenance and Service
14
Maintenanceand Service Chapter 1414.1 Cleaning
Instrument
• To clean the instrument/ device/ product, wipe it gently with a soft cloth moistenedwith water or mild detergent. Never use solvents such as benzene, alcohol, acetone,ether, ketones, thinners or gasoline, as they can deform and discolor the case.
• Wipe the LCD gently with a soft, dry cloth.
Clamp Sensor
Measurements are degraded by dirt on the mating surfaces of the clamp-on sensor, sokeep the surfaces clean by gently wiping with a soft cloth.
14.2 Trouble Shooting
216
Before having the instrument repaired or inspected, check the information described in "Before havingthe instrument repaired" (p.217) and "14.3 Error Indication" (p.218).
• If damage is suspected, check the "Before having the instrument repaired" (p.217) section before con-tacting your dealer or Hioki representative.
However, in the following circumstances, you should stop using the instrument, unplug the power cord,and contact your nearest Hioki distributor:• When you are able to confirm that the instrument is damaged• When you are unable to make measurements• When the instrument has been stored for an extended period of time in a hot, humid, or otherwise
undesirable environment• When the instrument has been subjected to the stress of being transported under harsh conditions• When the instrument has gotten wet or soiled with oil or dust (ingress of water, oil, or dust into the
enclosure may cause electrical insulation to deteriorate, increasing the hazard of electric shock or fire)
When transporting the instrument, use the original packing materials in which it was shipped, and pack ina double carton. Pack the instrument so that it will not sustain damage during shipping, and include adescription of existing damage. We do not take any responsibility for damage incurred during shipping.
Certain parts require replacement periodically and at the end of their useful life: (Useful life depends onthe operating environment and frequency of use. Operation cannot be guaranteed beyond the followingperiods)
14.2 Trouble Shooting
Inspection and Repair
Do not attempt to modify, disassemble or repair the instrument; as fire, electricshock and injury could result.
When transporting the instrument
Replaceable Parts and Operating Lifetimes
Part Life Remarks
Electrolytic Capaci-tors
Approx. 10 years The service life of electrolytic capacitors varies with the operating envi-ronment. Requires periodic replacement.
Lithium battery Approx. 10 years The instrument contains a built-in backup lithium battery, which offers a service life of about ten years. If the date and time deviate substantially when the instrument is switched on, it is the time to replace that battery. Contact your dealer or Hioki representative.
LCD backlight (50% drop-off in bright-ness)
Approx. 50,000 hr Requires periodic replacement.
Z1003 Battery Pack Approx. 1 year or approx. 500 charge/recharge cycles
Requires periodic replacement.
Z4001 SD Memory Card 2GB
Data storage of approx. 10 years or approx. 2 million rewrites
The SD card service life varies with the manner in which it is are used. Requires periodic replacement.

14.2 Trouble Shooting
217C
hapter 14 Maintenance and Service
14
Before returning for repairPerform a system reset.This will return all settings to their factory defaults. See: "5.6 Initializing the Instrument (System Reset)" (p.73)
Before having the instrument repaired
Symptom Check Item, or Cause Remedy and Reference
The display doesnot appear whenyou turn the poweron.
Has the power cord been disconnected?Is it connected properly?
Verify that the power cord is connectedproperly.See: "3.4 Connecting the AC Adapter" (p.32)
Keys do not work. Has the key lock been activated? Press and hold the ESC key for at least 3seconds to cancel the key lock.
Cannot print. Has recording paper been properly loaded intothe printer?Is the printer configured properly (baud rate,interface, etc.)?Is the instrument connected to the printer withthe appropriate cable?
-
Voltage or currentmeasured valuesare not being dis-played.
Are the voltage cords or clamp sensors con-nected improperly?
Verify connections.See: "3.6 Connecting the Voltage Cords" (p.34)
to "4.6 Verifying Correct Wiring (Connec-tion Check)" (p.48)
Are the input channels and display channelsincorrect? -
The instrument can-not measure the fre-quency.Measured values donot stabilize.
Is the input frequency within the guaranteedaccuracy range?For a measurement frequency of 50 Hz, 40 to 48HzFor a measurement frequency of 60 Hz, 51 to 70HzFor a measurement frequency of 400 Hz, 360 to440 HzMeasurement cannot be performed if the inputfrequency is outside the guaranteed accuracyfundamental wave range.
-
Is the input frequency lower than the setting?Is a signal being input to U1?Stable measurement may not be possible if inputof at least 2% f.s. is not being supplied to U1 (thereference channel).
When no apparent cause can be established

14.3 Error Indication
218
Any instrument errors are displayed on the screen. If you experience an error, check the appropri-ate corrective action. To clear the error display, press any key.
14.3 Error Indication
Error display Cause Corrective action/more informationFPGA initializing error FPGA initializing error.
The instrument needs to be repaired. Contact your Hiokidistributor.
DRAM1, 2 error DRAM error.SRAM error SRAM error.Invalid FLASH. FLASH error.
Invalid ADJUST. Adjustment value error.
Invalid Backuped values. One or more erroneousbacked-up system variableshave created a conflict.
*** CARD ERROR ***Error while attempting toaccess the SD Card.
Attempted to access a corruptfile or corrupt SD memorycard. The SD memory cardwas removed while it wasbeing accessed.
Back up the SD memory card’s contents on a computerand then format the card with the instrument. Removethe SD memory card and then insert it again. See: "9.2 Formatting SD Memory Cards" (p.138),
"3.5 Inserting (Removing) an SD Memory Card" (p.32)
*** CARD ERROR ***Save failed.
Attempted to write data to awrite-protected file. The SDmemory card was removedwhile data was being saved, ora similar issue occurred.
Using a computer, check whether the file attributes areset to read-only. If the attributes are set to read-only,clear that setting. Check whether the SD memory card isinserted into the instrument.See: "3.5 Inserting (Removing) an SD Memory Card"
(p.32)
*** CARD ERROR ***Load failed.
The file being loaded does notexist on the SD memory card.The file being loaded is cor-rupt.
Update the instrument’s file list. You can update the filelist by accessing another screen, for example by press-ing the DF1 key, and then pressing the DF4 key again. Ifthe file is corrupt, it is recommended to back up the fileon a computer (if possible) and then format the SDmemory card.See: "9.2 Formatting SD Memory Cards" (p.138)
*** CARD ERROR ***Formatting failed.
An SD memory card erroroccurred, or the SD memorycard was removed during for-matting.
Reinsert the SD memory card or replace the SD mem-ory card. See: "3.5 Inserting (Removing) an SD Memory Card"
(p.32)
*** CARD ERROR ***SD Card locked.
The SD memory card islocked.
Unlock the SD memory card.
*** CARD ERROR ***SD Card full.
Unable to save file due toinsufficient space on the SDmemory card.
Delete files to make space or replace the SD memorycard.See: "3.5 Inserting (Removing) an SD Memory Card"
(p.32)
*** CARD ERROR ***SD Card not found.
No memory card is inserted. Insert an SD memory card.See: "3.5 Inserting (Removing) an SD Memory Card"
(p.32)
*** CARD ERROR ***SD Card not compatible.
An unsupported card such asan SDXC memory card hasbeen inserted into the instru-ment.
Use a compatible SD memory card.
*** CARD ERROR ***No readable files found.
Unable to load files in the[PW3198] folder as it has beendeleted.
The [PW3198] folder is created when the SD memorycard is formatted. It is also automatically created whenrecording is started. See: "9.2 Formatting SD Memory Cards" (p.138)

14.3 Error Indication
219C
hapter 14 Maintenance and Service
14
*** CARD ERROR ***File or folder could not bedeleted.
Unable to delete file or folder. If the SD memory card is locked, unlock it. If the file orfolder is set to read-only, change its attributes on a com-puter and then delete it.
*** CARD ERROR ***Maximum files reached. Addi-tional files cannot be created.
The maximum number of filesthat can be created during asingle recording period wasexceeded. The number of set-tings files exceeded 102. Thenumber of measurement fold-ers created on a single dayexceeded 100.
Change the event detection items and detection levels toreduce the number of events that occur. Delete unnecessarysettings files. Delete unnecessary measurement folders.See: "5.5 Changing Event Settings" (p.66),
"9.6 Saving and Deleting Settings Files (Settings Data)" (p.145), "9.4 Saving, Display and Deleting Measurement Data" (p.141)
*** CARD ERROR ***SD Card is not formatted forthis device.
The SD memory card has notbeen formatted using the SDformat.
Format the card with the instrument.See: "9.2 Formatting SD Memory Cards" (p.138)
*** SETTING ERROR ***Folder cannot be moved.
Attempted to move to a folderother than the [PW3198] folder.
When viewing folders other than the [PW3198] folder,use the mass storage function or access the carddirectly using a computer. See: "12.1 Downloading Measurement Data Using the
USB Interface" (p.156)
*** OPERATION ERROR ***This folder cannot be deleted.
Attempted to delete the[PW3198], [SETTING], or[HARDCOPY] folder.
These folders are required for the instrument to operate.To delete them, use a computer.
*** CARD ERROR ***SD-CARD ERROR.
An SD memory card errorother than those listed aboveoccurred.
Contact Hioki with information about the instrument’soperational status at the time of the error.
*** PRINTER ERROR ***Printer Communication Error
Unable to recognize printer pro-tocol or unable to configureprinter. An RS-232C cable errormay have occurred, or a non-recommended printer modelmay be connected to the instru-ment.
Check whether the printer and RS-232C cable are rec-ommended models. Verify that the RS-232C cable issecurely connected to the instrument and printer.
*** OPERATION ERROR ***Outside of settings range.
Attempted to set a voltage out-side the valid range whenusing a user-defined nominalinput voltage.
Use a nominal input voltage of 50 to 780 V.
*** OPERATION ERROR ***Cannot modify settings whilerecording is in progress.
Attempted to change a settingthat cannot be changed whilerecording is in progress.
If you need to change the settings, stop recording oper-ation with the START/STOP key and then reset themeasurement data with the DATA RESET key.
*** OPERATION ERROR ***Cannot modify settings whileanalyzing is in progress.
Attempted to change a settingthat cannot be changed whileanalyzing data.
If you need to change the settings, reset the measure-ment data with the DATA RESET key.
*** OPERATION ERROR ***Cannot modify settings whilewaiting is in progress.
Attempted to change a settingthat cannot be changed whilein the standby state.
If you need to change the settings, stop recording oper-ation with the START/STOP key. If the instrument is inthe standby state during repeated recording (afterrecording has paused and before recording startsagain), reset the measurement data with the DATARESET key after stopping recording operation with theSTART/STOP key.
*** OPERATION ERROR ***Operation not available whilerecording is in progress.
A key such as the DATARESET key that cannot beused during recording waspressed.
If you need to change the settings, stop recording oper-ation with the START/STOP key and then reset themeasurement data with the DATA RESET key.
*** OPERATION ERROR ***Operation not available whileanalyzing is in progress.
A key such as the START/STOP key that cannot be usedduring analysis was pressed.
If you need to change the settings, reset the measure-ment data with the DATA RESET key.
Error display Cause Corrective action/more information

14.3 Error Indication
220
Contact your dealer (agent) or local sales office if a repair should become necessary.
*** OPERATION ERROR ***Operation not available whilewaiting is in progress.
A key such as the DATARESET key that cannot beused while in the standby statewas pressed.
In the standby state before recording has begun, stoprecording with the START/STOP key. If the instrument isin the standby state during repeated recording (afterrecording has paused and before recording startsagain), reset the measurement data with the DATARESET key after stopping recording operation with theSTART/STOP key.
*** OPERATION ERROR ***Recovering from a power inter-ruption. Please wait.
A key such as the START/STOP key that cannot be usedwhile performing power out-age recovery processingimmediately after the instru-ment was turned on waspressed.
Wait a while and then press the key again.
*** OPERATION ERROR ***Settings cannot be modifiedunder present 4ch wiring.
Attempted to change a settingwhose value is constrained bythe CH4 setting conditions, forexample by changing a DCfluctuation event while CH4 isset to ACDC.
Change the connection (CH4) as necessary.
*** OPERATION ERROR ***Settings cannot be madeunder present wiring.
Attempted to change a settingwhose value is constrained bythe connection, for example bychanging the Urms type(phase/line voltage) whileCH123 is set to 1P2W.
Change the connection (CH123) as necessary.
*** OPERATION ERROR ***Cannot be configured whenthe RMS level is set to OFF.
Attempted to set a sense eventwhile the RMS event is in theOFF state.
Set the sense event after setting the RMS event thresh-old.
*** OPERATION ERROR ***This operation is unavailablewhen using Preset. ESC toexit.
A key other than F1 to F4, thecursor arrows, ENTER, or theESC key was pressed on thequick setup screen.
Exit the quick setup display with the ESC key.
*** SETTING ERROR ***Preset configuration could notbe completed.
Unable to perform quick setup. Check connections, verify that appropriate input is beingprovided, and repeat the quick setup process.
*** SETTING ERROR ***Check the actual time controlsettings.
Unable to start recordingbecause the start and stoptime and date for real-timecontrol were set to a time anddate in the past.
Change the start and stop time and date for real-timecontrol.See: "5.2 Changing the Measurement Period" (p.58)
*** Zero Adjustment Failed ***Zero adjustment failed.
Zero adjustment did not termi-nate normally.
Perform zero adjustment again with the instrument inthe no-input state. If the instrument is located close to anoise source, place it further away and repeat zeroadjustment.
Maximum number of record-able events exceeded.
More than 1,000 eventsoccurred during the recordingperiod. Consequently,recorded results could not besaved.
Change the event threshold setting so that the numberof events does not exceed 1,000 during the recordingperiod.
Error display Cause Corrective action/more information
Turning on the instrument while the measurement target line is live may damage theinstrument, causing an error to be displayed when it is turned on. Always turn on theinstrument first and only activate power to the measurement line after verifying that theinstrument is not displaying any errors.
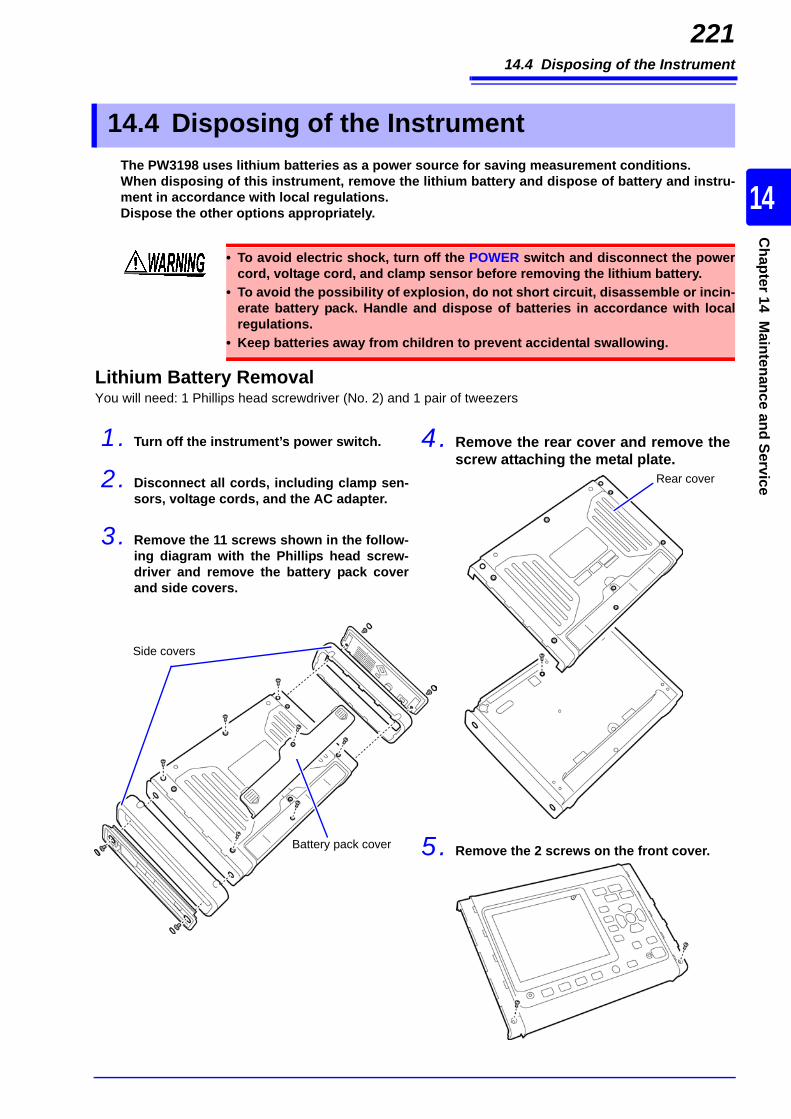
14.4 Disposing of the Instrument
221C
hapter 14 Maintenance and Service
14
The PW3198 uses lithium batteries as a power source for saving measurement conditions.When disposing of this instrument, remove the lithium battery and dispose of battery and instru-ment in accordance with local regulations.Dispose the other options appropriately.14.4 Disposing of the Instrument
• To avoid electric shock, turn off the POWER switch and disconnect the powercord, voltage cord, and clamp sensor before removing the lithium battery.
• To avoid the possibility of explosion, do not short circuit, disassemble or incin-erate battery pack. Handle and dispose of batteries in accordance with localregulations.
• Keep batteries away from children to prevent accidental swallowing.
4. Remove the rear cover and remove thescrew attaching the metal plate.
5. Remove the 2 screws on the front cover.
Lithium Battery RemovalYou will need: 1 Phillips head screwdriver (No. 2) and 1 pair of tweezers
1. Turn off the instrument’s power switch.
2. Disconnect all cords, including clamp sen-sors, voltage cords, and the AC adapter.
3. Remove the 11 screws shown in the follow-ing diagram with the Phillips head screw-driver and remove the battery pack coverand side covers.
Battery pack cover
Side covers
Rear cover

14.4 Disposing of the Instrument
222
6. Remove the 17 screws shown in the followingdiagram and remove the upper chassis.
7. Insert the tweezers between the batteryholder and the battery and lift up thebattery to remove it.
CALIFORNIA, USA ONLYThis product contains a CR Coin LithiumBattery which contains Perchlorate Material- special handling may apply.See www.dtsc.ca.gov/hazardouswaste/perchlorate
Lithium battery
Upper chassis
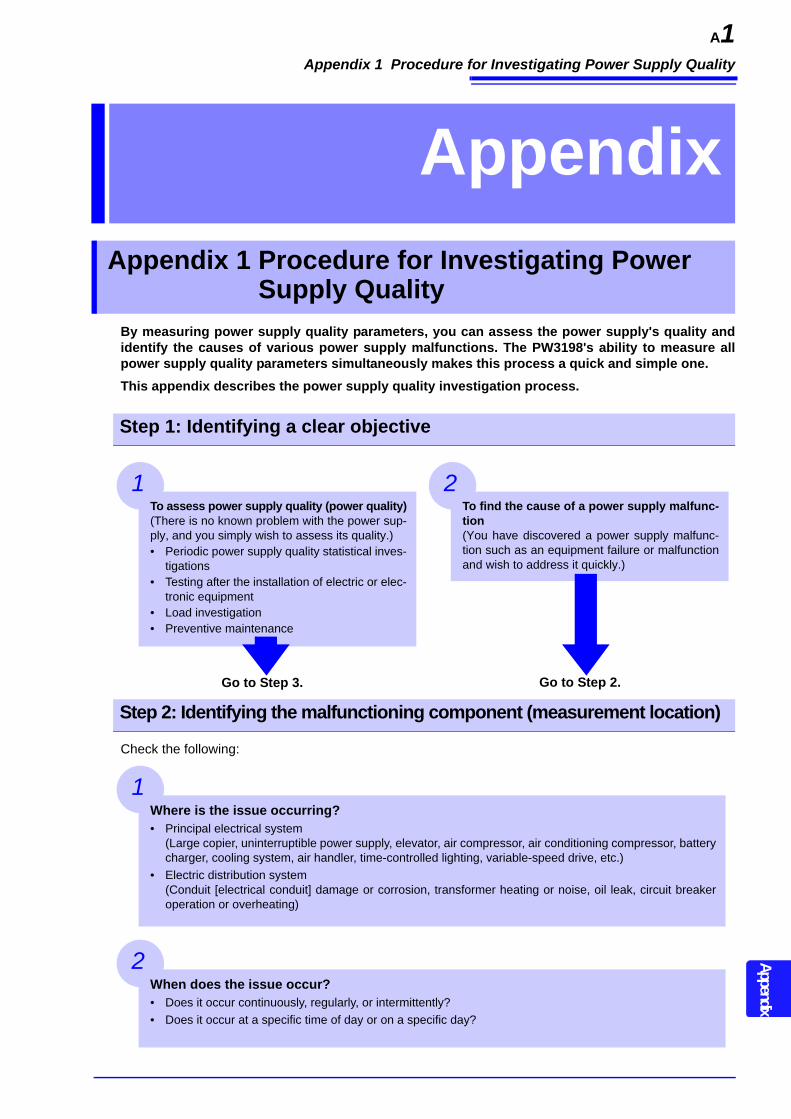
Appendix 1 Procedure for Investigating Power Supply Quality
A1Appendix
By measuring power supply quality parameters, you can assess the power supply's quality andidentify the causes of various power supply malfunctions. The PW3198's ability to measure allpower supply quality parameters simultaneously makes this process a quick and simple one. This appendix describes the power supply quality investigation process.
Check the following:
AppendixAppendix 1 Procedure for Investigating Power
Supply Quality
Step 1: Identifying a clear objective
To assess power supply quality (power quality)(There is no known problem with the power sup-ply, and you simply wish to assess its quality.)• Periodic power supply quality statistical inves-
tigations• Testing after the installation of electric or elec-
tronic equipment• Load investigation• Preventive maintenance
1To find the cause of a power supply malfunc-tion(You have discovered a power supply malfunc-tion such as an equipment failure or malfunctionand wish to address it quickly.)
2
Go to Step 3. Go to Step 2.
Step 2: Identifying the malfunctioning component (measurement location)
Where is the issue occurring?• Principal electrical system
(Large copier, uninterruptible power supply, elevator, air compressor, air conditioning compressor, batterycharger, cooling system, air handler, time-controlled lighting, variable-speed drive, etc.)
• Electric distribution system(Conduit [electrical conduit] damage or corrosion, transformer heating or noise, oil leak, circuit breakeroperation or overheating)
1
When does the issue occur?• Does it occur continuously, regularly, or intermittently?• Does it occur at a specific time of day or on a specific day?
2
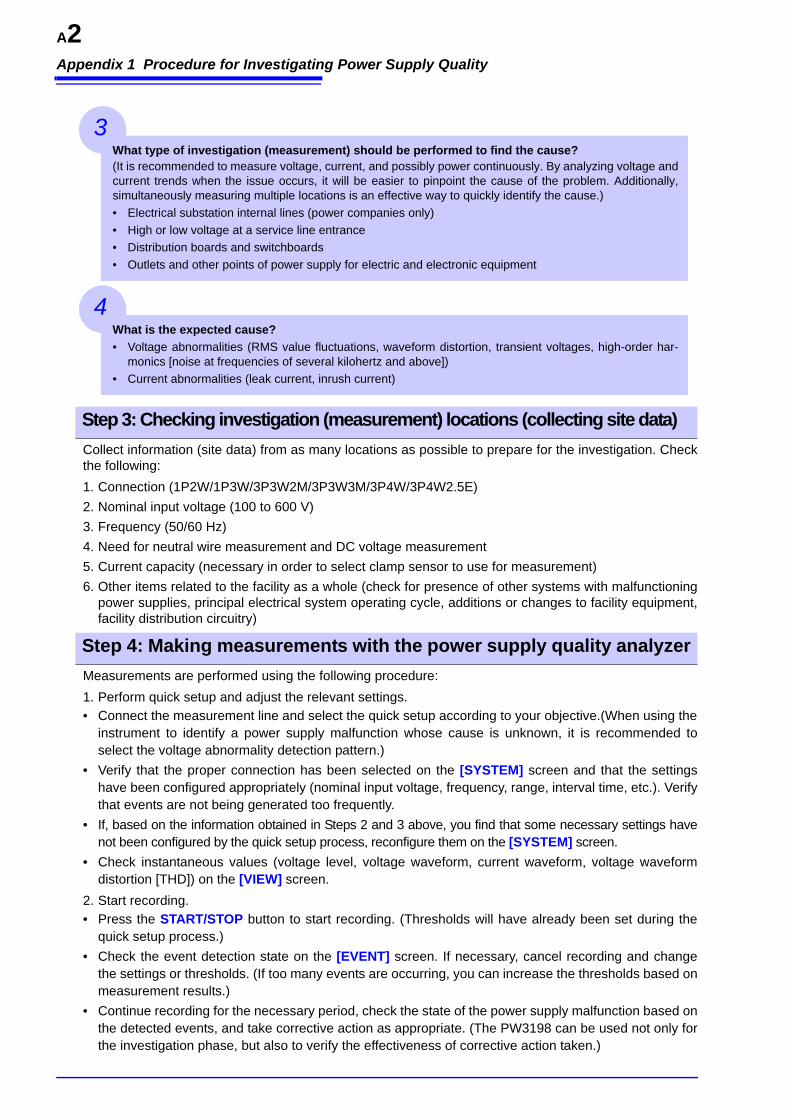
Appendix 1 Procedure for Investigating Power Supply Quality
A2
Collect information (site data) from as many locations as possible to prepare for the investigation. Checkthe following:1. Connection (1P2W/1P3W/3P3W2M/3P3W3M/3P4W/3P4W2.5E)2. Nominal input voltage (100 to 600 V)3. Frequency (50/60 Hz)4. Need for neutral wire measurement and DC voltage measurement5. Current capacity (necessary in order to select clamp sensor to use for measurement)6. Other items related to the facility as a whole (check for presence of other systems with malfunctioning
power supplies, principal electrical system operating cycle, additions or changes to facility equipment,facility distribution circuitry)
Measurements are performed using the following procedure:1. Perform quick setup and adjust the relevant settings. • Connect the measurement line and select the quick setup according to your objective.(When using the
instrument to identify a power supply malfunction whose cause is unknown, it is recommended toselect the voltage abnormality detection pattern.)
• Verify that the proper connection has been selected on the [SYSTEM] screen and that the settingshave been configured appropriately (nominal input voltage, frequency, range, interval time, etc.). Verifythat events are not being generated too frequently.
• If, based on the information obtained in Steps 2 and 3 above, you find that some necessary settings havenot been configured by the quick setup process, reconfigure them on the [SYSTEM] screen.
• Check instantaneous values (voltage level, voltage waveform, current waveform, voltage waveformdistortion [THD]) on the [VIEW] screen.
2. Start recording.• Press the START/STOP button to start recording. (Thresholds will have already been set during the
quick setup process.)• Check the event detection state on the [EVENT] screen. If necessary, cancel recording and change
the settings or thresholds. (If too many events are occurring, you can increase the thresholds based onmeasurement results.)
• Continue recording for the necessary period, check the state of the power supply malfunction based onthe detected events, and take corrective action as appropriate. (The PW3198 can be used not only forthe investigation phase, but also to verify the effectiveness of corrective action taken.)
What type of investigation (measurement) should be performed to find the cause?(It is recommended to measure voltage, current, and possibly power continuously. By analyzing voltage andcurrent trends when the issue occurs, it will be easier to pinpoint the cause of the problem. Additionally,simultaneously measuring multiple locations is an effective way to quickly identify the cause.)• Electrical substation internal lines (power companies only)• High or low voltage at a service line entrance• Distribution boards and switchboards• Outlets and other points of power supply for electric and electronic equipment
3
What is the expected cause?• Voltage abnormalities (RMS value fluctuations, waveform distortion, transient voltages, high-order har-
monics [noise at frequencies of several kilohertz and above])• Current abnormalities (leak current, inrush current)
4
Step 3: Checking investigation (measurement) locations (collecting site data)
Step 4: Making measurements with the power supply quality analyzer
Appendix 1 Procedure for Investigating Power Supply Quality
A3Appendix
Record voltage and current trends at the power circuit inlet.If current consumption in a building is high while the voltage is low, the cause likely lies inside the build-ing. If the voltage and current are both low, the cause is likely to lie outside the building. It's extremelyimportant to select the right measurement locations and to measure current.
Check power trends.Overloaded equipment can cause problems. By understanding power trends, you can more easily iden-tify problematic equipment and locations.
Check when the problem occurs.Equipment that is operating or turning off or on when abnormalities (events) are recorded may be prob-lematic. By understanding the precise times at which abnormalities (events) start and stop, you can moreeasily identify problematic equipment and locations.
Check for heat and unusual sounds.Motors, transformers, and wiring may produce heat or unusual sounds due to causes such as overload-ing or harmonics.
Advice for identifying the cause of abnormalities
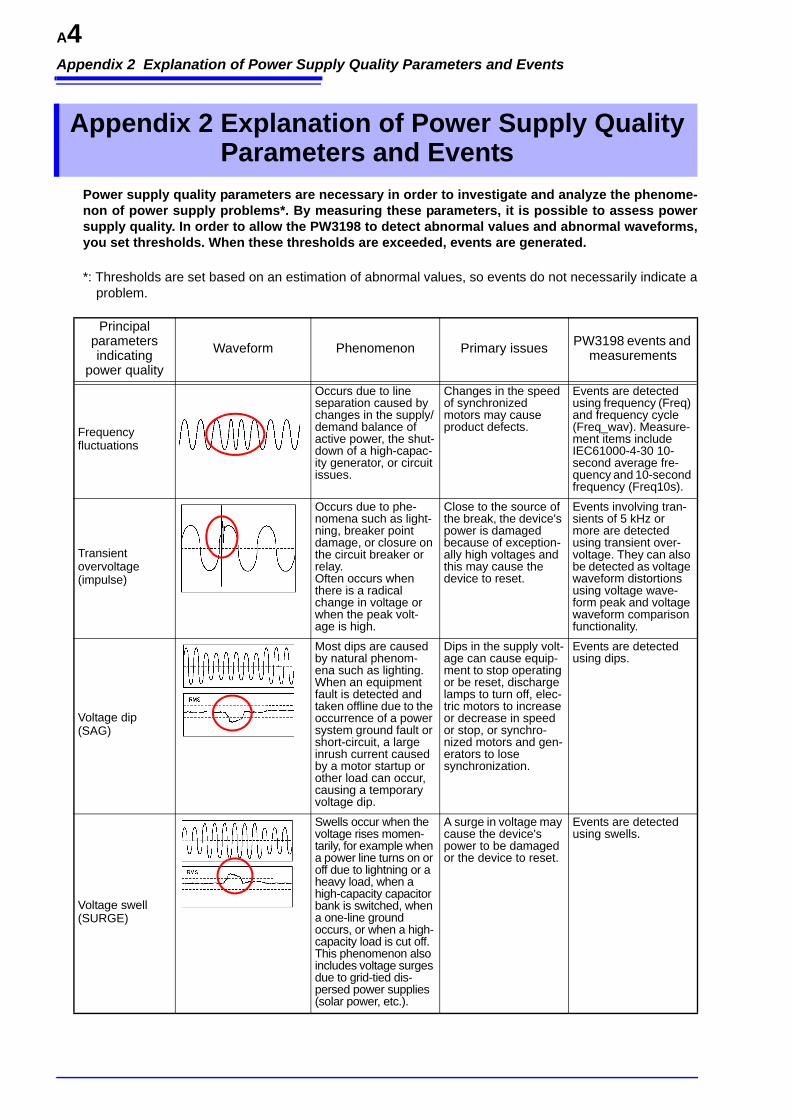
Appendix 2 Explanation of Power Supply Quality Parameters and Events
A4
Power supply quality parameters are necessary in order to investigate and analyze the phenome-non of power supply problems*. By measuring these parameters, it is possible to assess powersupply quality. In order to allow the PW3198 to detect abnormal values and abnormal waveforms,you set thresholds. When these thresholds are exceeded, events are generated.
*: Thresholds are set based on an estimation of abnormal values, so events do not necessarily indicate aproblem.
Appendix 2 Explanation of Power Supply Quality Parameters and Events
Principal parameters indicating
power qualityWaveform Phenomenon Primary issues PW3198 events and
measurements
Frequency fluctuations
Occurs due to line separation caused by changes in the supply/demand balance of active power, the shut-down of a high-capac-ity generator, or circuit issues.
Changes in the speed of synchronized motors may cause product defects.
Events are detected using frequency (Freq) and frequency cycle (Freq_wav). Measure-ment items include IEC61000-4-30 10-second average fre-quency and 10-second frequency (Freq10s).
Transient overvoltage(impulse)
Occurs due to phe-nomena such as light-ning, breaker point damage, or closure on the circuit breaker or relay.Often occurs when there is a radical change in voltage or when the peak volt-age is high.
Close to the source of the break, the device's power is damaged because of exception-ally high voltages and this may cause the device to reset.
Events involving tran-sients of 5 kHz or more are detected using transient over-voltage. They can also be detected as voltage waveform distortions using voltage wave-form peak and voltage waveform comparison functionality.
Voltage dip(SAG)
Most dips are caused by natural phenom-ena such as lighting. When an equipment fault is detected and taken offline due to the occurrence of a power system ground fault or short-circuit, a large inrush current caused by a motor startup or other load can occur, causing a temporary voltage dip.
Dips in the supply volt-age can cause equip-ment to stop operating or be reset, discharge lamps to turn off, elec-tric motors to increase or decrease in speed or stop, or synchro-nized motors and gen-erators to lose synchronization.
Events are detected using dips.
Voltage swell(SURGE)
Swells occur when the voltage rises momen-tarily, for example when a power line turns on or off due to lightning or a heavy load, when a high-capacity capacitor bank is switched, when a one-line ground occurs, or when a high-capacity load is cut off. This phenomenon also includes voltage surges due to grid-tied dis-persed power supplies (solar power, etc.).
A surge in voltage may cause the device's power to be damaged or the device to reset.
Events are detected using swells.
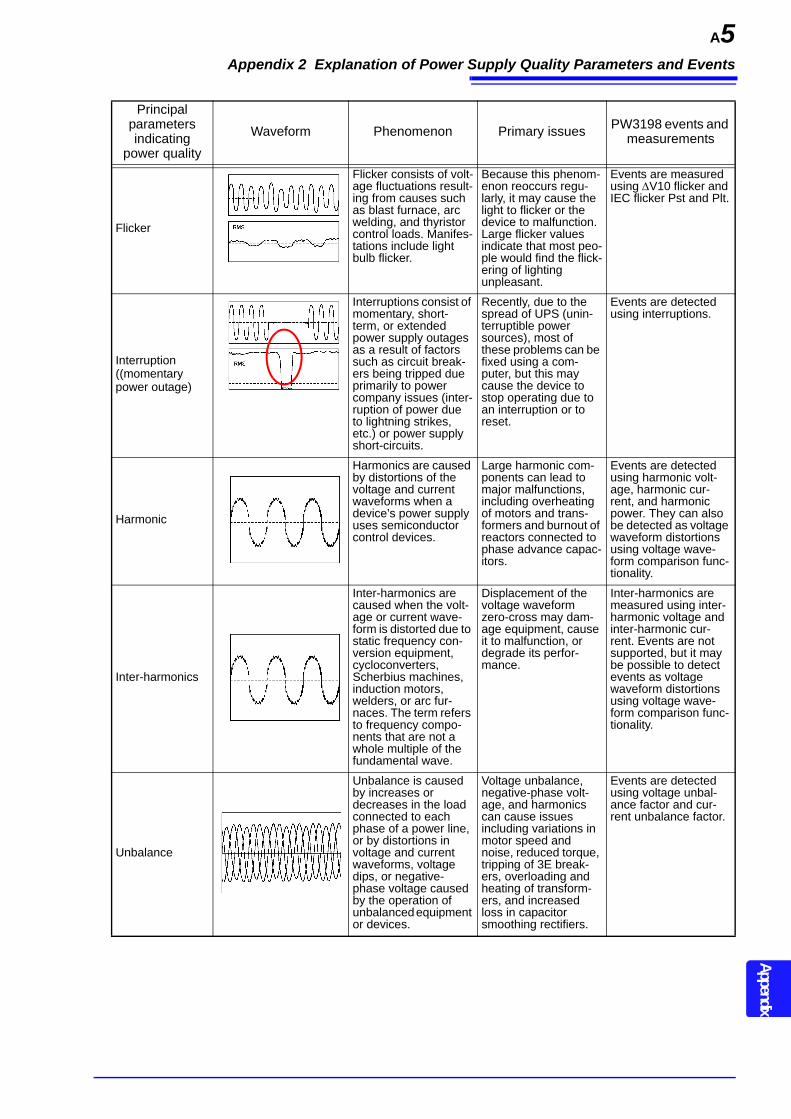
Appendix 2 Explanation of Power Supply Quality Parameters and Events
A5Appendix
Flicker
Flicker consists of volt-age fluctuations result-ing from causes such as blast furnace, arc welding, and thyristor control loads. Manifes-tations include light bulb flicker.
Because this phenom-enon reoccurs regu-larly, it may cause the light to flicker or the device to malfunction.Large flicker values indicate that most peo-ple would find the flick-ering of lighting unpleasant.
Events are measured using V10 flicker and IEC flicker Pst and Plt.
Interruption((momentarypower outage)
Interruptions consist of momentary, short-term, or extended power supply outages as a result of factors such as circuit break-ers being tripped due primarily to power company issues (inter-ruption of power due to lightning strikes, etc.) or power supply short-circuits.
Recently, due to the spread of UPS (unin-terruptible power sources), most of these problems can be fixed using a com-puter, but this may cause the device to stop operating due to an interruption or toreset.
Events are detected using interruptions.
Harmonic
Harmonics are caused by distortions of the voltage and current waveforms when a device’s power supply uses semiconductor control devices.
Large harmonic com-ponents can lead to major malfunctions, including overheating of motors and trans-formers and burnout of reactors connected to phase advance capac-itors.
Events are detected using harmonic volt-age, harmonic cur-rent, and harmonic power. They can also be detected as voltage waveform distortions using voltage wave-form comparison func-tionality.
Inter-harmonics
Inter-harmonics are caused when the volt-age or current wave-form is distorted due to static frequency con-version equipment, cycloconverters, Scherbius machines, induction motors, welders, or arc fur-naces. The term refers to frequency compo-nents that are not a whole multiple of the fundamental wave.
Displacement of the voltage waveform zero-cross may dam-age equipment, cause it to malfunction, or degrade its perfor-mance.
Inter-harmonics are measured using inter-harmonic voltage and inter-harmonic cur-rent. Events are not supported, but it may be possible to detect events as voltage waveform distortions using voltage wave-form comparison func-tionality.
Unbalance
Unbalance is caused by increases or decreases in the load connected to each phase of a power line, or by distortions in voltage and current waveforms, voltage dips, or negative-phase voltage caused by the operation of unbalanced equipment or devices.
Voltage unbalance, negative-phase volt-age, and harmonics can cause issues including variations in motor speed and noise, reduced torque, tripping of 3E break-ers, overloading and heating of transform-ers, and increased loss in capacitor smoothing rectifiers.
Events are detected using voltage unbal-ance factor and cur-rent unbalance factor.
Principal parameters indicating
power qualityWaveform Phenomenon Primary issues PW3198 events and
measurements
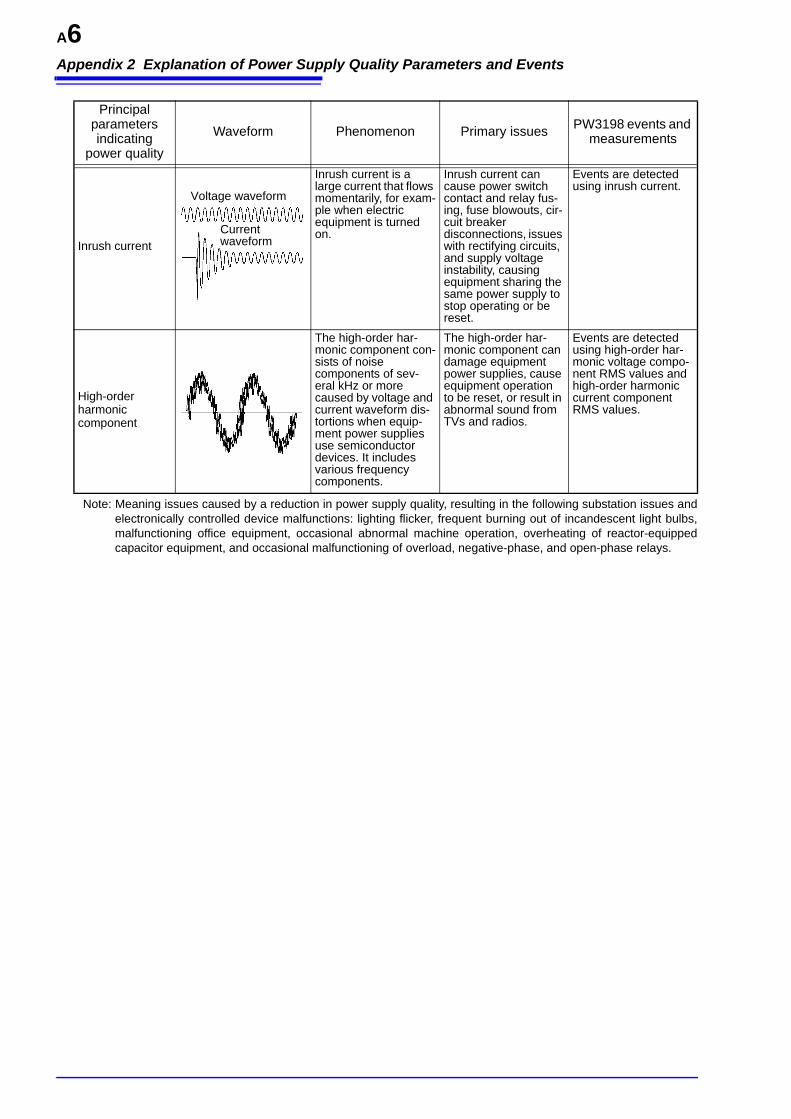
Appendix 2 Explanation of Power Supply Quality Parameters and Events
A6
Note: Meaning issues caused by a reduction in power supply quality, resulting in the following substation issues andelectronically controlled device malfunctions: lighting flicker, frequent burning out of incandescent light bulbs,malfunctioning office equipment, occasional abnormal machine operation, overheating of reactor-equippedcapacitor equipment, and occasional malfunctioning of overload, negative-phase, and open-phase relays.
Inrush current
Inrush current is a large current that flows momentarily, for exam-ple when electric equipment is turned on.
Inrush current can cause power switch contact and relay fus-ing, fuse blowouts, cir-cuit breaker disconnections, issues with rectifying circuits, and supply voltage instability, causing equipment sharing the same power supply to stop operating or be reset.
Events are detected using inrush current.
High-order harmonic component
The high-order har-monic component con-sists of noise components of sev-eral kHz or more caused by voltage and current waveform dis-tortions when equip-ment power supplies use semiconductor devices. It includes various frequency components.
The high-order har-monic component can damage equipment power supplies, cause equipment operation to be reset, or result in abnormal sound from TVs and radios.
Events are detected using high-order har-monic voltage compo-nent RMS values and high-order harmonic current component RMS values.
Principal parameters indicating
power qualityWaveform Phenomenon Primary issues PW3198 events and
measurements
Voltage waveform
Current waveform

Appendix 3 Event Detection Methods
A7Appendix
Appendix 3 Event Detection Methods
Transient overvoltage
Measurement method:• Detected when the waveform obtained by eliminating the fundamental component (50/60/400 Hz) from a waveform
sampled at 2 MHz exceeds a threshold specified as an absolute value. • Detection occurs once for each fundamental voltage waveform, and voltages of up to 6,000 V can be measured.Recorded data:Transient voltage value : Peak value of waveform during 4 ms period after elimination of fundamental componentTransient width : Period during which threshold is exceeded (2 ms max.)Max. transient voltage value: : Max. peak value of waveform obtained by eliminating the fundamental component during
the period from transient IN to transient OUT (leaving channel information)Transient period : Period from transient IN to transient OUTTransient count during period : Number of transients occurring during period from transient IN to transient OUT (tran-
sients occurring across all channels or simultaneously on multiple channels count as 1)Transient waveforms : Event waveform and transient waveform
(Waveforms are saved for 2 ms before and after the position at which the transient over-voltage waveform was detected for the first transient IN and 2 ms before and after the point at which the transient maximum voltage waveform was detected between the IN and OUT points.)
Event IN and OUTEvent IN : The event occurrence time when the first transient overvoltage is detected during an aggregation period of
approx. 200 ms. indicates the peak voltage value and transient width detected when the threshold was ex-ceeded.
Event OUT : Indicates the first transient period (difference between the IN time and OUT time) for the approx. 200 ms aggregation period during which no transient overvoltage was detected for any channel within the first ap-prox. 200 ms aggregation period following the transient event IN state.
Threshold
Threshold Transient voltage
Transient widthEvent IN
2 ms 2 ms
Sampled waveform2 MHz
Elimination of fun-damental compo-nent (5 kHz) and lower
Transient wave-form after elimina-tion of fundamental component
Approx. 200 ms aggregation
Event IN Event OUTEvent period
Transient waveform (including fundament component)The first detected transient wave-form after event IN is saved.
Transient waveform (including fundament component)The waveform with the largest transient voltage value from the IN to the OUT point is saved at event OUT.
Event IN2 ms 2 ms 2 ms 2 ms
Threshold
Approx. 200 ms aggregation
Approx. 200 ms aggregation
Approx. 200 ms aggregation
Threshold
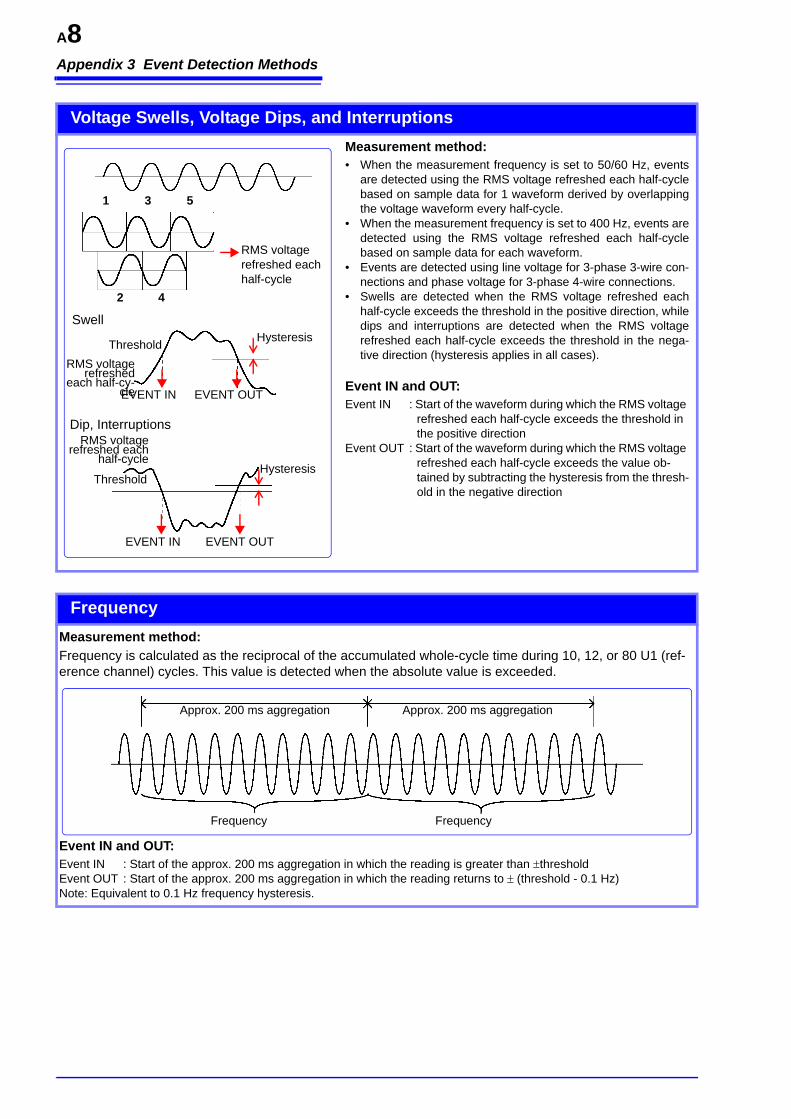
Appendix 3 Event Detection Methods
A8
Voltage Swells, Voltage Dips, and InterruptionsMeasurement method:• When the measurement frequency is set to 50/60 Hz, events
are detected using the RMS voltage refreshed each half-cyclebased on sample data for 1 waveform derived by overlappingthe voltage waveform every half-cycle.
• When the measurement frequency is set to 400 Hz, events aredetected using the RMS voltage refreshed each half-cyclebased on sample data for each waveform.
• Events are detected using line voltage for 3-phase 3-wire con-nections and phase voltage for 3-phase 4-wire connections.
• Swells are detected when the RMS voltage refreshed eachhalf-cycle exceeds the threshold in the positive direction, whiledips and interruptions are detected when the RMS voltagerefreshed each half-cycle exceeds the threshold in the nega-tive direction (hysteresis applies in all cases).
Event IN and OUT:Event IN : Start of the waveform during which the RMS voltage
refreshed each half-cycle exceeds the threshold in the positive direction
Event OUT : Start of the waveform during which the RMS voltage refreshed each half-cycle exceeds the value ob-tained by subtracting the hysteresis from the thresh-old in the negative direction
1 3 5
2 4
RMS voltage refreshed each half-cycle
Threshold
Swell
Dip, Interruptions
Hysteresis
RMS voltagerefreshed
each half-cy-cle
RMS voltagerefreshed each
half-cycle
EVENT IN EVENT OUT
HysteresisThreshold
EVENT IN EVENT OUT
FrequencyMeasurement method:Frequency is calculated as the reciprocal of the accumulated whole-cycle time during 10, 12, or 80 U1 (ref-erence channel) cycles. This value is detected when the absolute value is exceeded.
Event IN and OUT:Event IN : Start of the approx. 200 ms aggregation in which the reading is greater than threshold Event OUT : Start of the approx. 200 ms aggregation in which the reading returns to (threshold - 0.1 Hz)Note: Equivalent to 0.1 Hz frequency hysteresis.
Frequency Frequency
Approx. 200 ms aggregation Approx. 200 ms aggregation
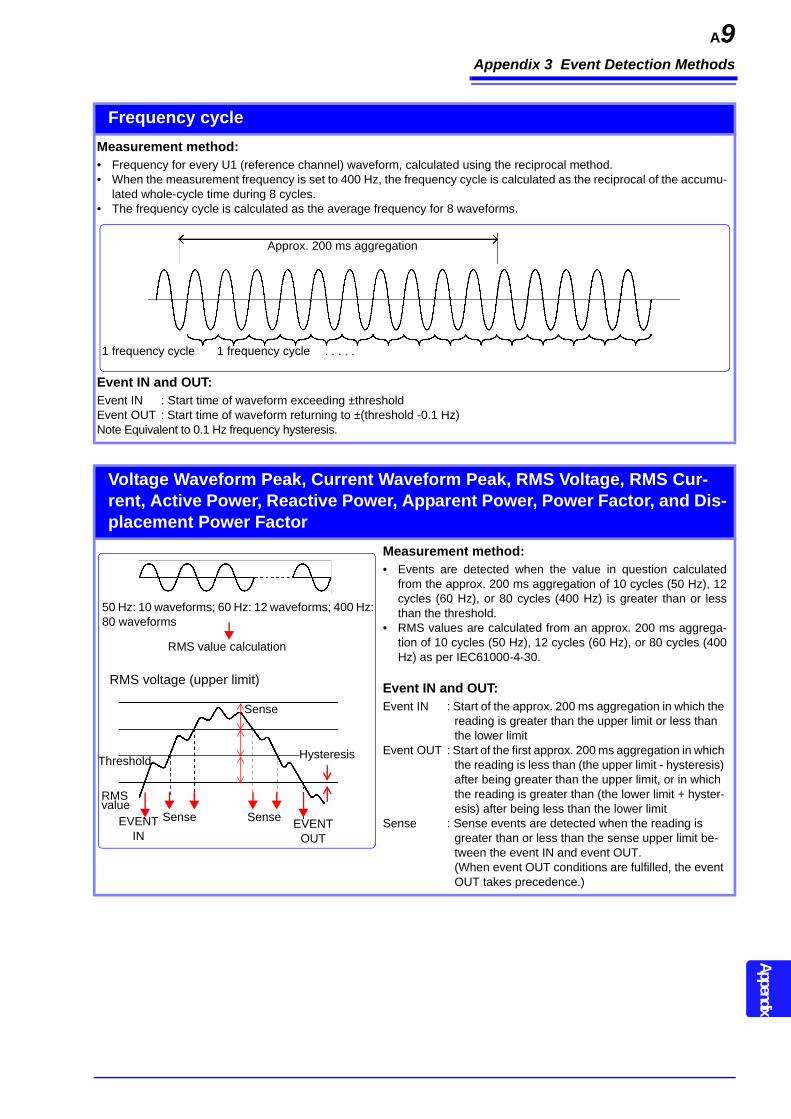
Appendix 3 Event Detection Methods
A9Appendix
Frequency cycleMeasurement method:• Frequency for every U1 (reference channel) waveform, calculated using the reciprocal method.• When the measurement frequency is set to 400 Hz, the frequency cycle is calculated as the reciprocal of the accumu-
lated whole-cycle time during 8 cycles.• The frequency cycle is calculated as the average frequency for 8 waveforms.
Event IN and OUT:Event IN : Start time of waveform exceeding ±thresholdEvent OUT :Start time of waveform returning to ±(threshold -0.1 Hz)Note Equivalent to 0.1 Hz frequency hysteresis.
1 frequency cycle 1 frequency cycle . . . . .
Approx. 200 ms aggregation
Voltage Waveform Peak, Current Waveform Peak, RMS Voltage, RMS Cur-rent, Active Power, Reactive Power, Apparent Power, Power Factor, and Dis-placement Power Factor
Measurement method:• Events are detected when the value in question calculated
from the approx. 200 ms aggregation of 10 cycles (50 Hz), 12cycles (60 Hz), or 80 cycles (400 Hz) is greater than or lessthan the threshold.
• RMS values are calculated from an approx. 200 ms aggrega-tion of 10 cycles (50 Hz), 12 cycles (60 Hz), or 80 cycles (400Hz) as per IEC61000-4-30.
Event IN and OUT:Event IN : Start of the approx. 200 ms aggregation in which the
reading is greater than the upper limit or less than the lower limit
Event OUT : Start of the first approx. 200 ms aggregation in which the reading is less than (the upper limit - hysteresis) after being greater than the upper limit, or in which the reading is greater than (the lower limit + hyster-esis) after being less than the lower limit
Sense : Sense events are detected when the reading is greater than or less than the sense upper limit be-tween the event IN and event OUT.(When event OUT conditions are fulfilled, the event OUT takes precedence.)
50 Hz: 10 waveforms; 60 Hz: 12 waveforms; 400 Hz: 80 waveforms
RMS value calculation
RMS voltage (upper limit)
Sense
Hysteresis
RMS value
Threshold
Sense Sense EVENT OUT
EVENT IN

Appendix 3 Event Detection Methods
A10
Voltage DC Value, Current DC Value (CH4 only)Measurement method:Values are detected when the average value for the approx. 200 ms aggregation synchronized to the reference channel U1 exceeds a threshold specified as an absolute value.
Event IN and OUT:Event IN : Start of the approx. 200 ms aggregation in which the reading is greater than the upper limit or less than the
lower limitEvent OUT : Start of the first approx. 200 ms aggregation in which the reader is less than (the upper limit - hysteresis)
after being greater than the upper limit, or in which the reading is greater than (the lower limit + hysteresis) after being less than the lower limit
Voltage DC Change and Current DC Change (CH4 only)Measurement method:DC fluctuation events are detected when the difference between the positive and negative waveform peak values in an approx. 200 ms aggregation exceeds the set threshold.
Measured values in the event list are displayed as the voltage or current value for the difference between the positive and negative waveform peak values. (These measured values are not recorded.)
Sampled waveform
Positive waveform peak value
DC value (average value)
Negative waveform peak value
Approx. 200 ms aggregation
Event IN Event OUT
Approx. 200 ms aggregation
Approx. 200 ms aggregation
Approx. 200 ms aggregation
Difference between positive and negative waveform peak values
Voltage Unbalance Factor, Current Unbalance Factor, Harmonic Voltage, Harmonic Current, Harmonic Power, Harmonic Voltage-Current Phase Dif-ference, Total Harmonic Voltage Distortion Factor, Total Harmonic Current Distortion Factor, and K Factor
Measurement method:Measured values are calculated for a rectangular window of 4,096 points in an approx. 200 ms aggregation of 10 cycles (50 Hz), 12 cycles (60 Hz), or 80 cycles (400 Hz), and events are detected when the calculated values are greater than or less than the cor-responding threshold.
Event IN and OUT:Event IN : Start of the approx. 200 ms aggregation in which the
reading is greater than the thresholdEvent OUT : Start of the approx. 200 ms aggregation in which the
reading is less than (the threshold - hysteresis)
50 Hz: 10 cycles, 60 Hz: 12 cycles, 400 Hz: 80 cy-cles
Harmonic calculation using rectangular window
3rd-order harmonic voltage
HysteresisThreshold
EVENT OUT
EVENT IN
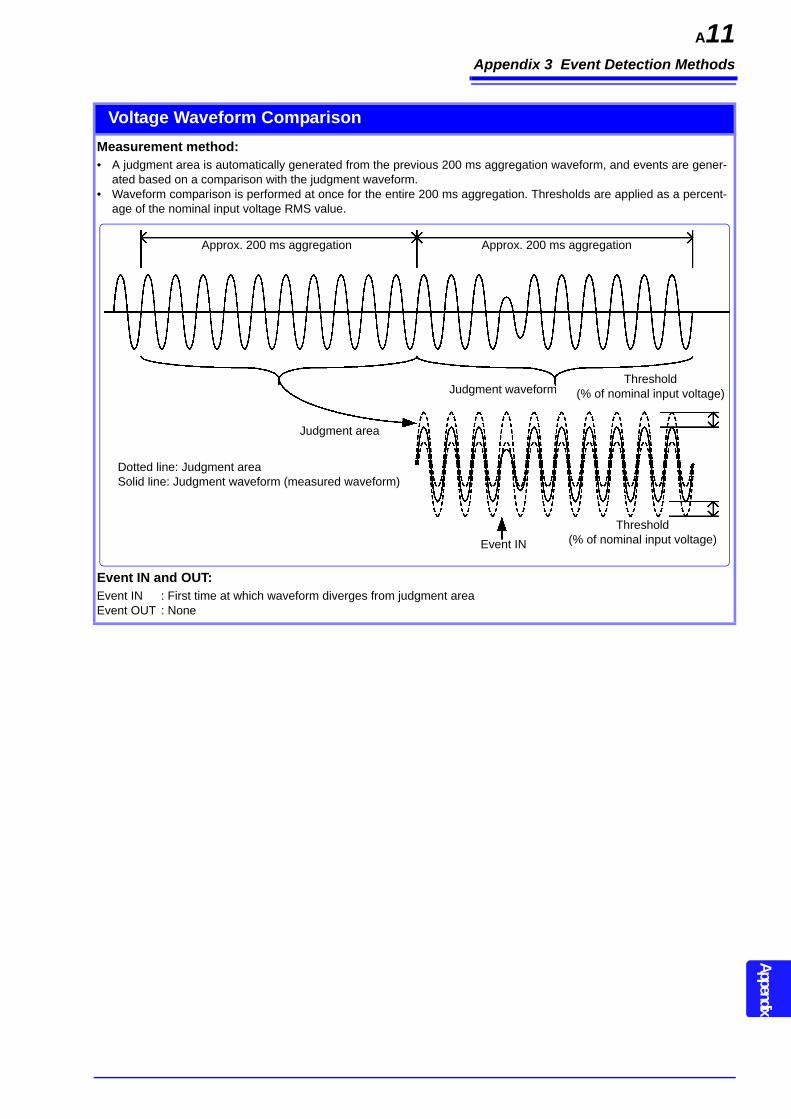
Appendix 3 Event Detection Methods
A11Appendix
Voltage Waveform ComparisonMeasurement method:• A judgment area is automatically generated from the previous 200 ms aggregation waveform, and events are gener-
ated based on a comparison with the judgment waveform. • Waveform comparison is performed at once for the entire 200 ms aggregation. Thresholds are applied as a percent-
age of the nominal input voltage RMS value.
Event IN and OUT:Event IN : First time at which waveform diverges from judgment areaEvent OUT : None
Judgment area
Judgment waveform
Event IN
Threshold(% of nominal input voltage)
Threshold(% of nominal input voltage)
Dotted line: Judgment areaSolid line: Judgment waveform (measured waveform)
Approx. 200 ms aggregation Approx. 200 ms aggregation
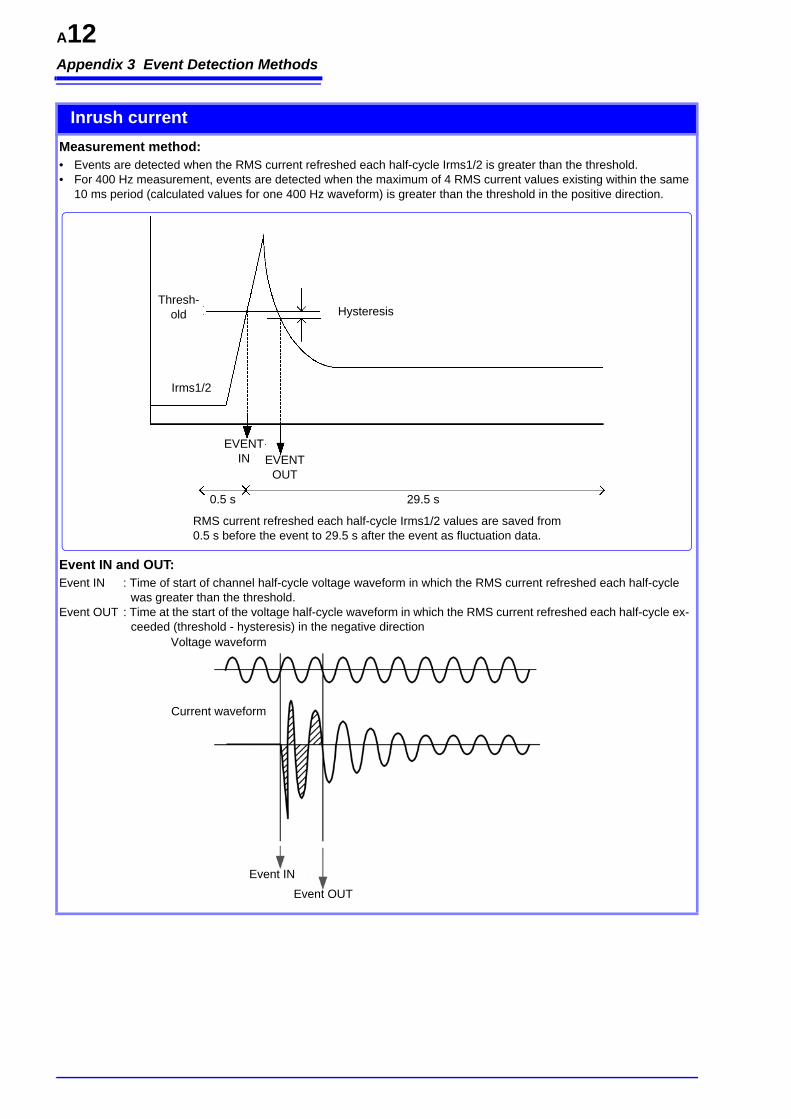
Appendix 3 Event Detection Methods
A12
Inrush currentMeasurement method:• Events are detected when the RMS current refreshed each half-cycle Irms1/2 is greater than the threshold. • For 400 Hz measurement, events are detected when the maximum of 4 RMS current values existing within the same
10 ms period (calculated values for one 400 Hz waveform) is greater than the threshold in the positive direction.
Event IN and OUT:Event IN : Time of start of channel half-cycle voltage waveform in which the RMS current refreshed each half-cycle
was greater than the threshold.Event OUT : Time at the start of the voltage half-cycle waveform in which the RMS current refreshed each half-cycle ex-
ceeded (threshold - hysteresis) in the negative direction
Thresh-old Hysteresis
Irms1/2
EVENTIN EVENT
OUT
0.5 s 29.5 s
RMS current refreshed each half-cycle Irms1/2 values are saved from 0.5 s before the event to 29.5 s after the event as fluctuation data.
Event INEvent OUT
Current waveform
Voltage waveform
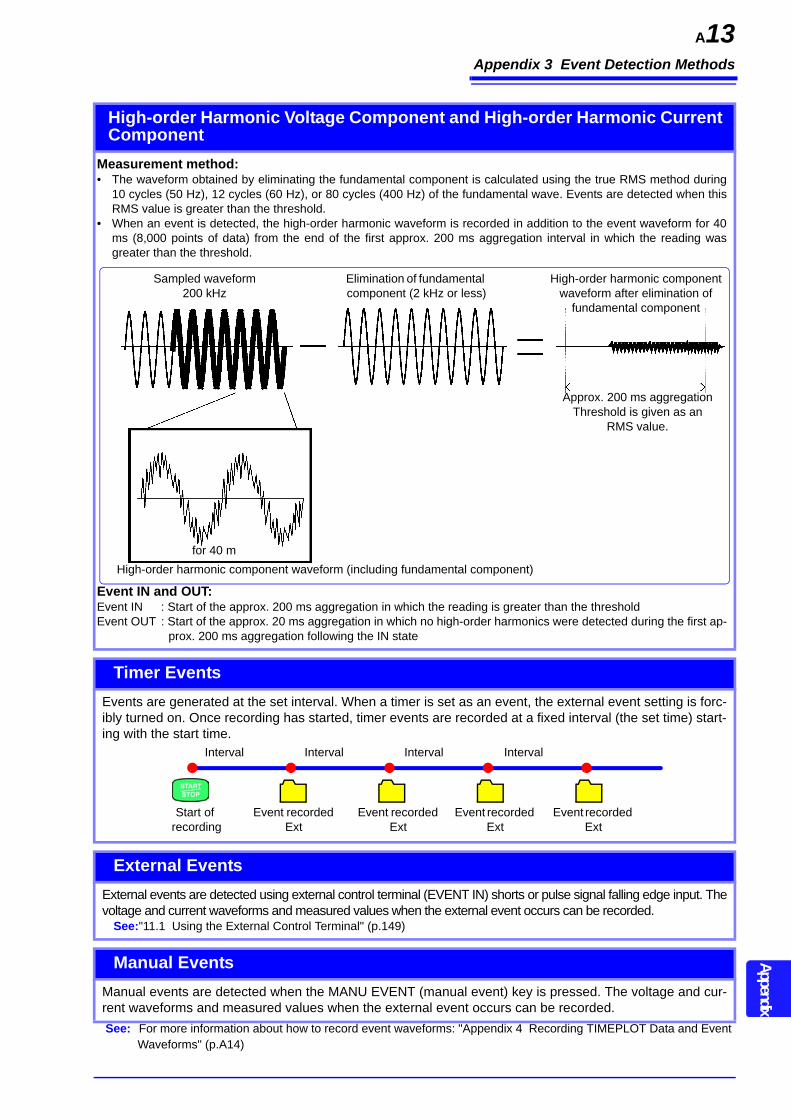
Appendix 3 Event Detection Methods
A13Appendix
See: For more information about how to record event waveforms: "Appendix 4 Recording TIMEPLOT Data and Event Waveforms" (p.A14)
High-order Harmonic Voltage Component and High-order Harmonic Current Component
Measurement method:• The waveform obtained by eliminating the fundamental component is calculated using the true RMS method during
10 cycles (50 Hz), 12 cycles (60 Hz), or 80 cycles (400 Hz) of the fundamental wave. Events are detected when thisRMS value is greater than the threshold.
• When an event is detected, the high-order harmonic waveform is recorded in addition to the event waveform for 40ms (8,000 points of data) from the end of the first approx. 200 ms aggregation interval in which the reading wasgreater than the threshold.
Event IN and OUT:Event IN : Start of the approx. 200 ms aggregation in which the reading is greater than the thresholdEvent OUT : Start of the approx. 20 ms aggregation in which no high-order harmonics were detected during the first ap-
prox. 200 ms aggregation following the IN state
Approx. 200 ms aggregationThreshold is given as an
RMS value.
Sampled waveform200 kHz
for 40 m
Elimination of fundamental component (2 kHz or less)
High-order harmonic component waveform after elimination of
fundamental component
High-order harmonic component waveform (including fundamental component)
Timer EventsEvents are generated at the set interval. When a timer is set as an event, the external event setting is forc-ibly turned on. Once recording has started, timer events are recorded at a fixed interval (the set time) start-ing with the start time.
Event recorded Ext
Event recorded Ext
Event recorded Ext
Event recorded Ext
Start of recording
Interval Interval Interval Interval
External EventsExternal events are detected using external control terminal (EVENT IN) shorts or pulse signal falling edge input. Thevoltage and current waveforms and measured values when the external event occurs can be recorded.
See:"11.1 Using the External Control Terminal" (p.149)
Manual EventsManual events are detected when the MANU EVENT (manual event) key is pressed. The voltage and cur-rent waveforms and measured values when the external event occurs can be recorded.
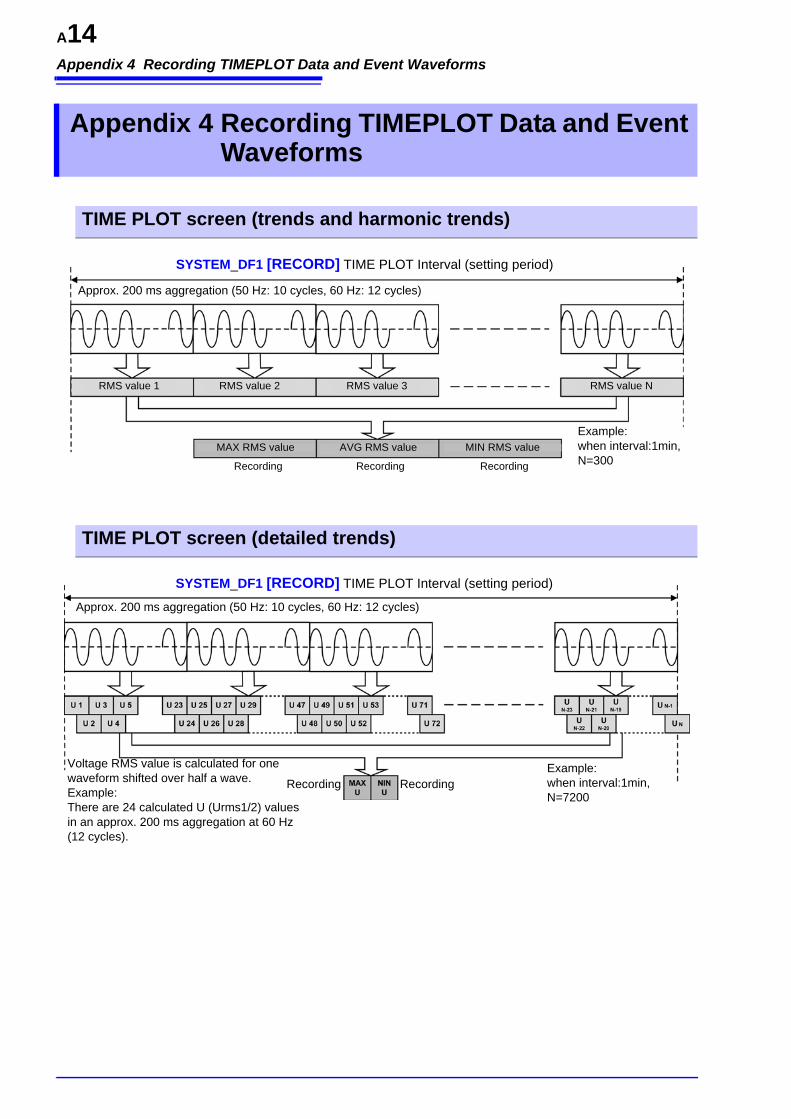
Appendix 4 Recording TIMEPLOT Data and Event Waveforms
A14
Appendix 4 Recording TIMEPLOT Data and Event Waveforms
TIME PLOT screen (trends and harmonic trends)
SYSTEM_DF1 [RECORD] TIME PLOT Interval (setting period)
Approx. 200 ms aggregation (50 Hz: 10 cycles, 60 Hz: 12 cycles)
RMS value 1 RMS value 2 RMS value 3 RMS value N
Example:when interval:1min, N=300
MAX RMS value AVG RMS value MIN RMS value
Recording Recording Recording
TIME PLOT screen (detailed trends)
SYSTEM_DF1 [RECORD] TIME PLOT Interval (setting period)
Approx. 200 ms aggregation (50 Hz: 10 cycles, 60 Hz: 12 cycles)
Voltage RMS value is calculated for one waveform shifted over half a wave.Example: There are 24 calculated U (Urms1/2) values in an approx. 200 ms aggregation at 60 Hz (12 cycles).
RecordingRecordingExample:when interval:1min, N=7200

Appendix 4 Recording TIMEPLOT Data and Event Waveforms
A15Appendix
Event Waveform Recording MethodGenerating events using approx. 200 ms aggregation measured values
RMS calculation RMS calculation RMS calculationEVENT occur
Event waveform record-ing period50 Hz: 14 cycles60 Hz: 16 cycles
The result of adding the two waveforms prior to and the two waveforms after the approx. 200 ms aggregation is displayed as the event waveform.
Approx. 200 ms aggregation (50 Hz: 10 cycles, 60 Hz: 12 cycles)
SYSTEM_DF1 [RECORD] TIME PLOT Interval (setting period)
Generating events using one- or half-wave measured values
SYSTEM_DF1 [RECORD] TIME PLOT Interval (setting period)
Approx. 200 ms aggregation (50 Hz: 10 cycles, 60 Hz: 12 cycles)
Event waveform record-ing period50 Hz: 14 cycles60 Hz: 16 cycles
The result of adding the two waveforms prior to and the two waveforms after the approx. 200 ms aggregation is displayed as the event waveform.

Appendix 4 Recording TIMEPLOT Data and Event Waveforms
A16
Instruments defined under IEC61000-4-30 Class A must generate measurement results within the stipu-lated accuracy range when measuring the same signal, even if different instruments are used to make themeasurement.
A series of 150/180 cycle time intervals is resynchronized every 10 minutes as shown in the figure toalign measurement times and measured values. Consequently, the approx. 200 ms aggregations (10 or12 cycles) are also resynchronized every 10 minutes.
A new 150/180 cycle time interval starts every 10 minutes (for example, x+1), while measurement of theexisting 150/180 cycle time interval (for example, x) continues until it is complete. In this way, there is anoverlap between the two 150/180 cycle time intervals and between approx. 200 ms aggregations (10 or12 cycles). The PW3198 synchronizes the start of the set TIMEPLOT interval every 10 minutes. For thisreason, approx. 200 ms aggregations (10 or 12 cycles) are also resynchronized every 10 minutes.
A new TIMEPLOT interval starts every 10 minutes, while measurement of the existing TIMEPLOT intervalcontinues until it is complete. In this way, there is an overlap between the two TIMEPLOT intervals.
To perform standard-compliant measurement, the TIMEPLOT interval must be set to 50 Hz/150 waves or60 Hz/180 waves.
TIMEPLOT time synchronization and overlap
Figure. Synchronization Required by IEC61000-4-30 Class A
Figure. PW3198 Synchronization Note: 10/12 cycles = 200 ms aggregation

Appendix 4 Recording TIMEPLOT Data and Event Waveforms
A17Appendix
Method for verifying aggregation values required by IEC61000-4-30
IEC flickerFor IEC 61000-4-30 Plt values, use only the values shown with even numbered 2-hour intervals, and dis-card the other Plt values. The other Plt values are provided for information only, and are not IEC 61000-4-30 Plt values.
IEC61000-4-30 Class A requires that regardless of the overall time interval, time clock accuracy must bewithin ±20 ms for 50 Hz and within ±16.7 ms for 60 Hz. When accurate time synchronization using anexternal signal is not possible, a tolerance of less than ±1 second over 24 hours is permitted, but regard-less of the overall time interval, accuracy must be within ±20 ms for 50 Hz and ±16.7 ms for 60 Hz.
By synchronizing the PW3198 with the PW9005 GPS Box, the instrument time can be synchronized toUTC at a high degree of accuracy. In the event that accurate time synchronization using an external sig-nal, such as that provided by the GPS unit, is not possible, the instrument incorporates a clock capable ofoperating at a real-time accuracy of within ±1 second per day (within the specified operating temperatureand humidity range).
3-second aggregated values (=150/180cycle data) 10-minute aggregated values 2-hour aggregated values
Magnitude of the Supply Voltage
Applies to average value of channel Urms values on the [TIMEPLOT] - [TREND] screen.
Applies to average value of channel Urms values on the [TIMEPLOT] - [TREND] screen.
Applies to average value of channel Urms values on the [TIMEPLOT] - [TREND] screen.
Voltage harmonics
Applies to average values on the [TIMEPLOT] - [HarmTrend] screen.
Applies to average values on the [TIMEPLOT] - [HarmTrend] screen.
Applies to average values on the [TIMEPLOT] - [HarmTrend] screen.
Voltage inter-harmonics
Applies to average values for each channel's orders on the [TIMEPLOT] - [Harm Trend] - [INTERHARM] screen.
Applies to average values for each channel's orders on the [TIMEPLOT] - [Harm Trend] - [INTERHARM] screen.
Applies to average values for each channel's orders on the [TIMEPLOT] - [Harm Trend] - [INTERHARM] screen.
Supply Voltage unbalance
Applies to average value of unb0 and unb for Uunb on the [TIMEPLOT] - [TREND] screen.
Applies to average value of unb0 and unb for Uunb on the [TIMEPLOT] - [TREND] screen.
Applies to average value of unb0 and unb for Uunb on the [TIMEPLOT] - [TREND] screen.
Measurement conditions
• The TIMEPLOT interval isset to 150/180 cycles.
• During analysis, cursormeasurement is performedafter setting Tdiv to the min-imum value.
• The order being checked forharmonics and inter-har-monics is selected and dis-played.
• Recorded items for inter-harmonics are set to [ALLDATA].
• The TIMEPLOT interval isset to 10 minutes.
• During analysis, cursormeasurement is performedafter setting Tdiv to the min-imum value.
• The order being checked forharmonics and inter-har-monics is selected and dis-played.
• Recorded items for inter-harmonics are set to [ALLDATA].
• The TIMEPLOT interval isset to 2 hours.
• During analysis, cursormeasurement is performedafter setting Tdiv to the min-imum value.
• The order being checked forharmonics and inter-har-monics is selected and dis-played.
• Recorded items for inter-harmonics are set to [ALLDATA].
Time clock accuracy

Appendix 5 Detailed Explanation of IEC Flicker and DV10 Flicker
A18
The IEC flicker function is based on international standard IEC61000- 4-15, "Flickermeter - Functionaland design specifications".
Appendix 5 Detailed Explanation of IEC Flicker and V10 Flicker
To measure the IEC Flicker or V10 FlickerFlicker calculation and IEC flicker filter settings are configured on the SYSTEM-DF1[MAIN]-F1 [MEASURE] screen.
See:"5.1 Changing Measurement Conditions" (p.55)
IEC Flicker Meter
A/D conver-
sion
Waveform data
Block 1Input voltage adapter
AGC
Block 2Square multiplier
Square multi-plier
Luminous sensitivity
filter
Block 3Weighing filter
Voltage waveform
Square multi-plier
Block 4Average
smoothing
1st orderSmooth
averaging filter
Block 5Online statistical analysis
Class cate-gory
Pst cal-cula-tion
Plt cal-cula-tion
Long interval flicker
Plt
Instantaneous flicker value
S(t)Short interval
flickerPst
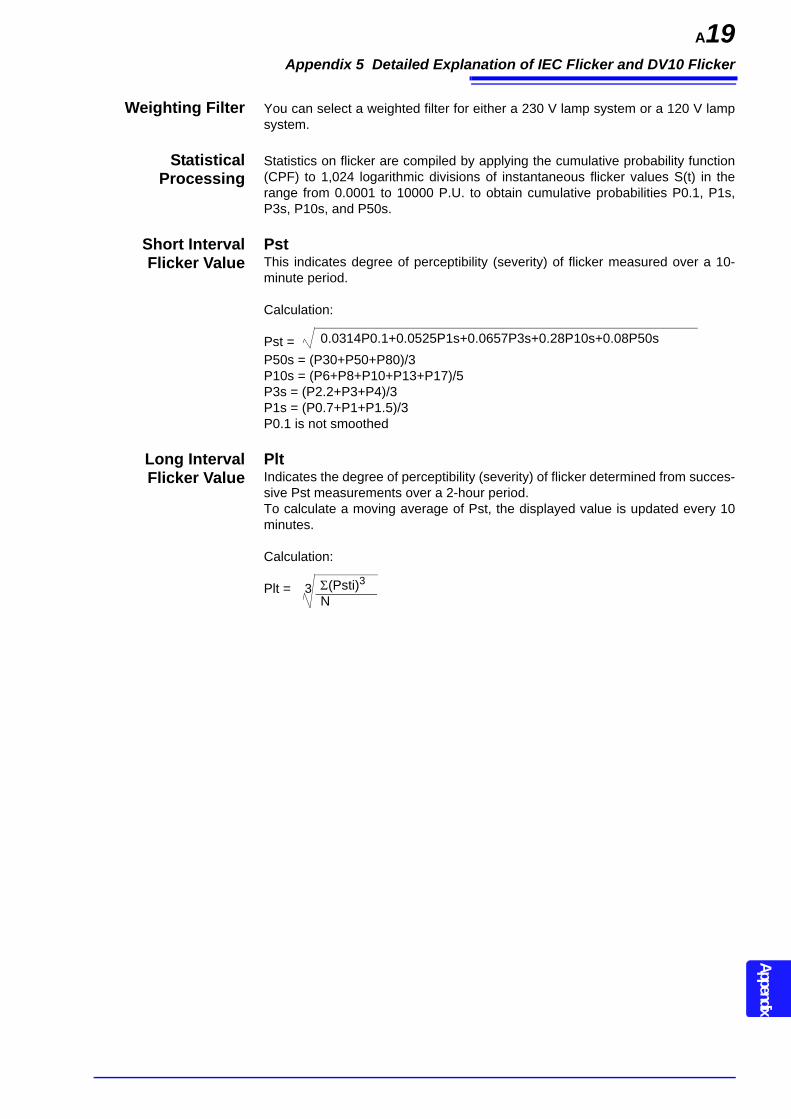
Appendix 5 Detailed Explanation of IEC Flicker and DV10 Flicker
A19Appendix
Weighting Filter You can select a weighted filter for either a 230 V lamp system or a 120 V lampsystem.
StatisticalProcessing
Statistics on flicker are compiled by applying the cumulative probability function(CPF) to 1,024 logarithmic divisions of instantaneous flicker values S(t) in therange from 0.0001 to 10000 P.U. to obtain cumulative probabilities P0.1, P1s,P3s, P10s, and P50s.
Short IntervalFlicker Value
PstThis indicates degree of perceptibility (severity) of flicker measured over a 10-minute period.
Calculation:
Pst = P50s = (P30+P50+P80)/3P10s = (P6+P8+P10+P13+P17)/5P3s = (P2.2+P3+P4)/3P1s = (P0.7+P1+P1.5)/3P0.1 is not smoothed
Long IntervalFlicker Value
PltIndicates the degree of perceptibility (severity) of flicker determined from succes-sive Pst measurements over a 2-hour period.To calculate a moving average of Pst, the displayed value is updated every 10minutes.
Calculation:
Plt =
0.0314P0.1+0.0525P1s+0.0657P3s+0.28P10s+0.08P50s
(Psti)3N
3
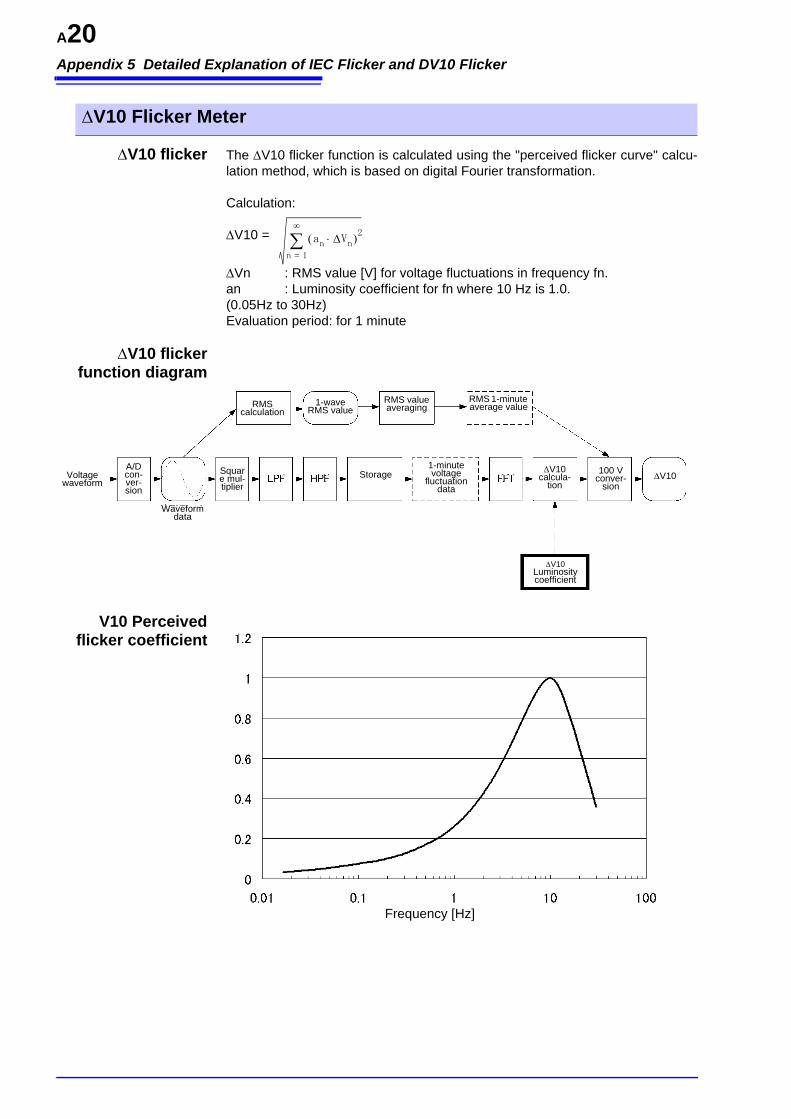
Appendix 5 Detailed Explanation of IEC Flicker and DV10 Flicker
A20
V10 flicker The V10 flicker function is calculated using the "perceived flicker curve" calcu-lation method, which is based on digital Fourier transformation.
Calculation:
V10 =
Vn : RMS value [V] for voltage fluctuations in frequency fn.an : Luminosity coefficient for fn where 10 Hz is 1.0.(0.05Hz to 30Hz)Evaluation period: for 1 minute
V10 flickerfunction diagram
V10 Perceivedflicker coefficient
V10 Flicker Meter
an Vn 2
n 1=
A/D con-ver-sion
Waveform data
Voltage waveform
Square mul-tiplier
RMScalculation
1-wave RMS value
RMS value averaging
RMS 1-minute average value
Storage1-minutevoltage
fluctuation data
V10 calcula-
tion100 V
conver-sion
V10
V10 Luminosity coefficient
Frequency [Hz]
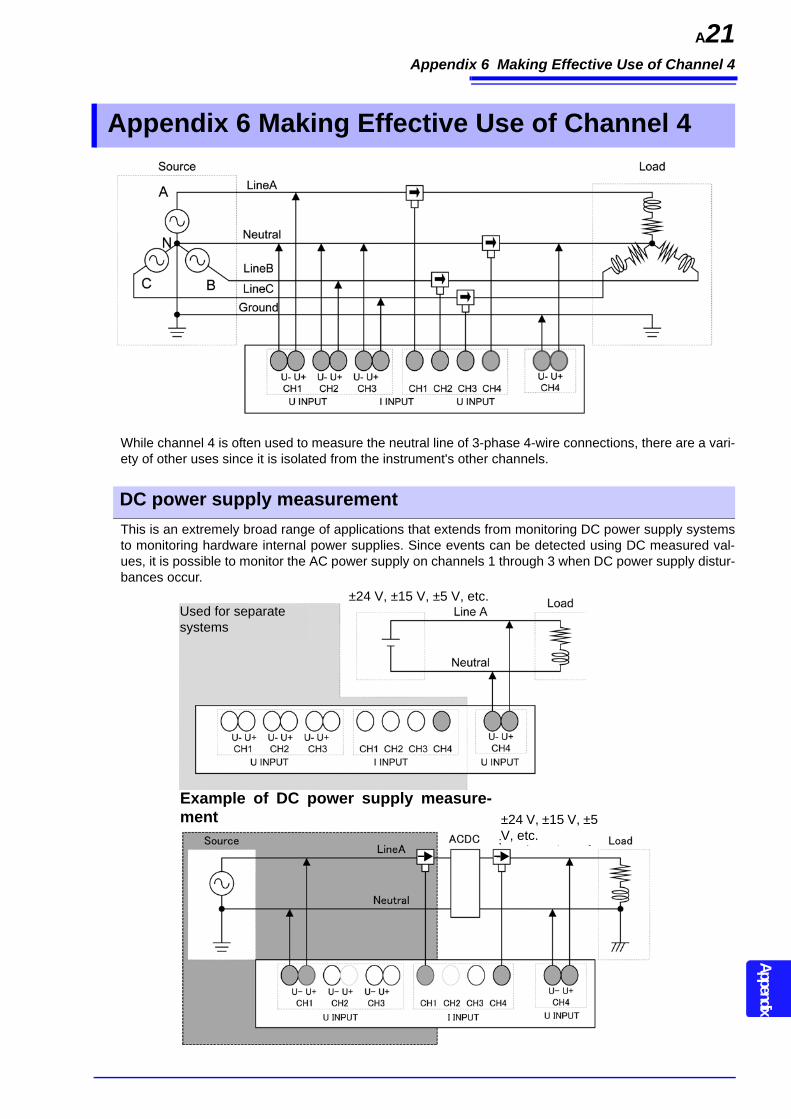
Appendix 6 Making Effective Use of Channel 4
A21Appendix
While channel 4 is often used to measure the neutral line of 3-phase 4-wire connections, there are a vari-ety of other uses since it is isolated from the instrument's other channels.
This is an extremely broad range of applications that extends from monitoring DC power supply systemsto monitoring hardware internal power supplies. Since events can be detected using DC measured val-ues, it is possible to monitor the AC power supply on channels 1 through 3 when DC power supply distur-bances occur.
Appendix 6 Making Effective Use of Channel 4
DC power supply measurement
Example of DC power supply measure-ment
±24 V, ±15 V, ±5 V, etc.Used for separate systems
±24 V, ±15 V, ±5 V, etc.
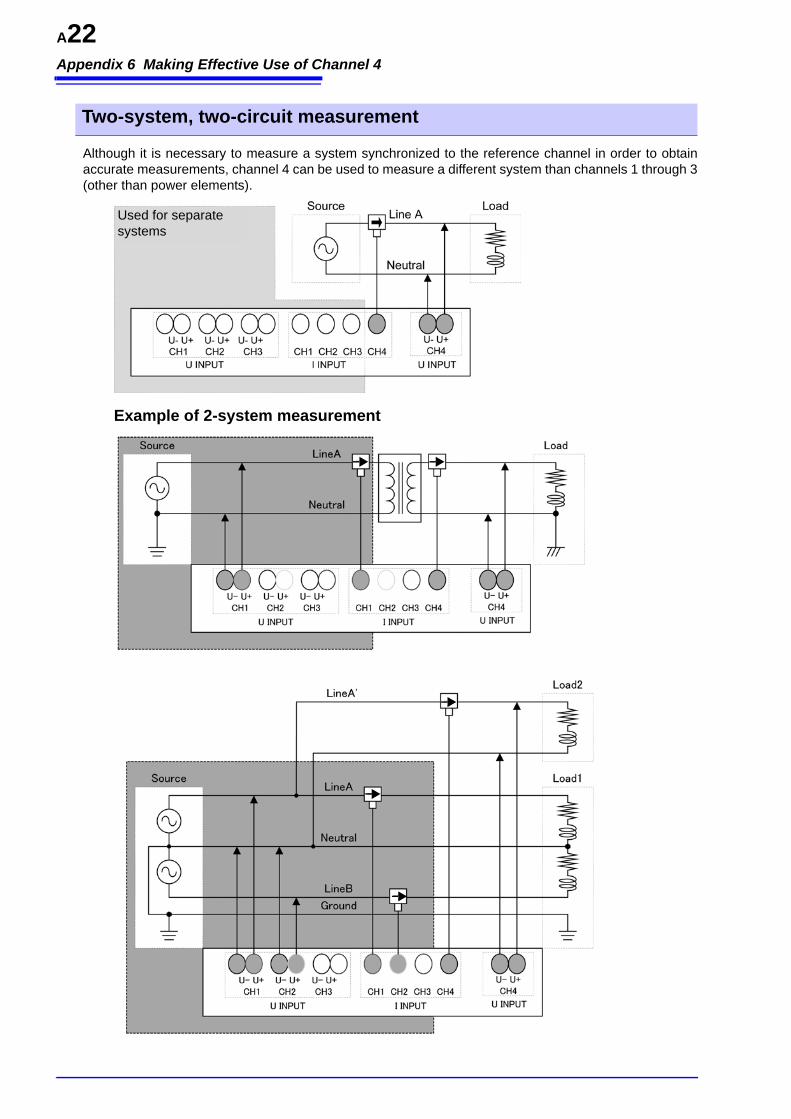
Appendix 6 Making Effective Use of Channel 4
A22
Although it is necessary to measure a system synchronized to the reference channel in order to obtainaccurate measurements, channel 4 can be used to measure a different system than channels 1 through 3(other than power elements).
Two-system, two-circuit measurement
Example of 2-system measurement
Used for separate systems
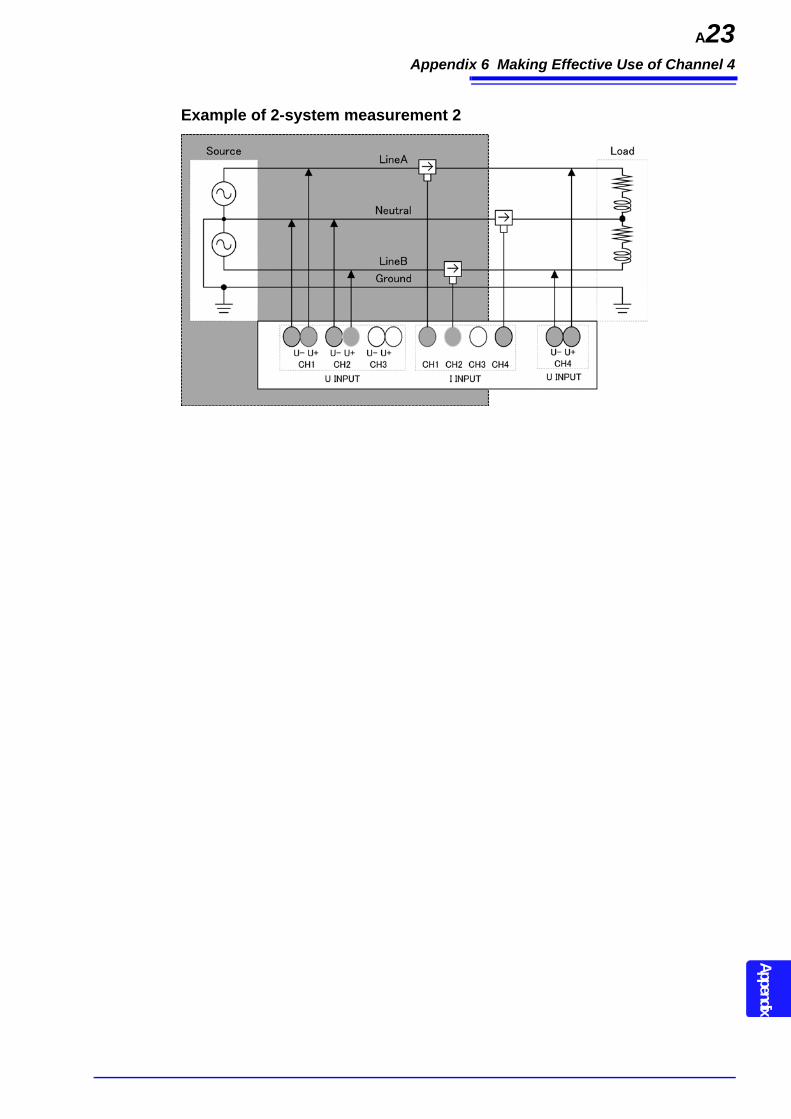
Appendix 6 Making Effective Use of Channel 4
A23Appendix
Example of 2-system measurement 2
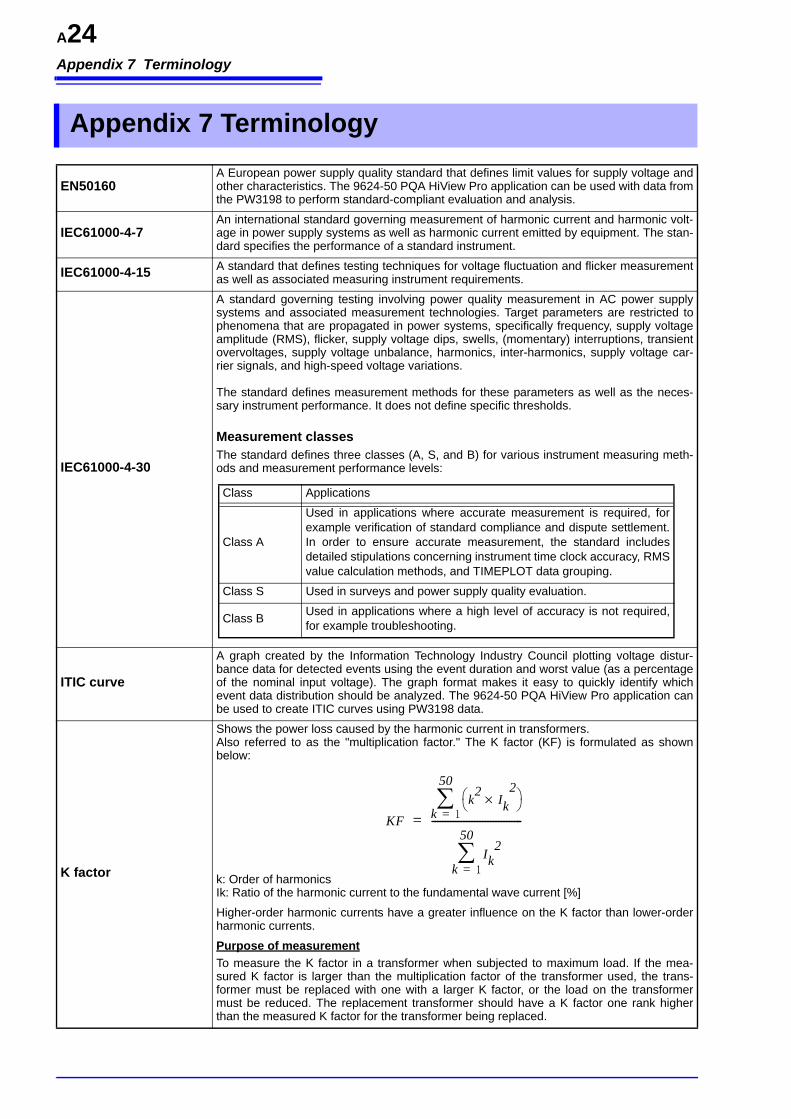
Appendix 7 Terminology
A24
Appendix 7 Terminology
EN50160A European power supply quality standard that defines limit values for supply voltage andother characteristics. The 9624-50 PQA HiView Pro application can be used with data fromthe PW3198 to perform standard-compliant evaluation and analysis.
IEC61000-4-7An international standard governing measurement of harmonic current and harmonic volt-age in power supply systems as well as harmonic current emitted by equipment. The stan-dard specifies the performance of a standard instrument.
IEC61000-4-15 A standard that defines testing techniques for voltage fluctuation and flicker measurementas well as associated measuring instrument requirements.
IEC61000-4-30
A standard governing testing involving power quality measurement in AC power supplysystems and associated measurement technologies. Target parameters are restricted tophenomena that are propagated in power systems, specifically frequency, supply voltageamplitude (RMS), flicker, supply voltage dips, swells, (momentary) interruptions, transientovervoltages, supply voltage unbalance, harmonics, inter-harmonics, supply voltage car-rier signals, and high-speed voltage variations.
The standard defines measurement methods for these parameters as well as the neces-sary instrument performance. It does not define specific thresholds. Measurement classesThe standard defines three classes (A, S, and B) for various instrument measuring meth-ods and measurement performance levels:
ITIC curve
A graph created by the Information Technology Industry Council plotting voltage distur-bance data for detected events using the event duration and worst value (as a percentageof the nominal input voltage). The graph format makes it easy to quickly identify whichevent data distribution should be analyzed. The 9624-50 PQA HiView Pro application canbe used to create ITIC curves using PW3198 data.
K factor
Shows the power loss caused by the harmonic current in transformers.Also referred to as the "multiplication factor." The K factor (KF) is formulated as shownbelow:
k: Order of harmonicsIk: Ratio of the harmonic current to the fundamental wave current [%]
Higher-order harmonic currents have a greater influence on the K factor than lower-orderharmonic currents.
Purpose of measurementTo measure the K factor in a transformer when subjected to maximum load. If the mea-sured K factor is larger than the multiplication factor of the transformer used, the trans-former must be replaced with one with a larger K factor, or the load on the transformermust be reduced. The replacement transformer should have a K factor one rank higherthan the measured K factor for the transformer being replaced.
Class Applications
Class A
Used in applications where accurate measurement is required, forexample verification of standard compliance and dispute settlement.In order to ensure accurate measurement, the standard includesdetailed stipulations concerning instrument time clock accuracy, RMSvalue calculation methods, and TIMEPLOT data grouping.
Class S Used in surveys and power supply quality evaluation.
Class B Used in applications where a high level of accuracy is not required,for example troubleshooting.
KF
k2
Ik2
k 1=
50
Ik2
k 1=
50
----------------------------------=
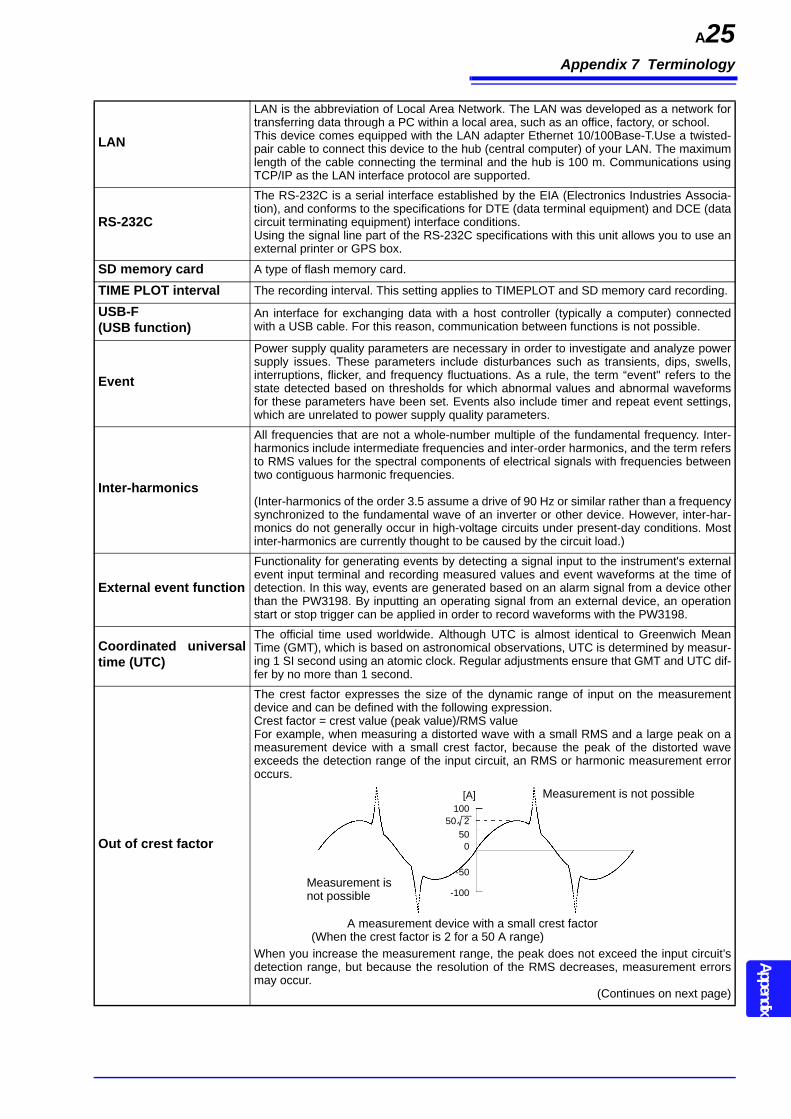
Appendix 7 Terminology
A25Appendix
LAN
LAN is the abbreviation of Local Area Network. The LAN was developed as a network fortransferring data through a PC within a local area, such as an office, factory, or school.This device comes equipped with the LAN adapter Ethernet 10/100Base-T.Use a twisted-pair cable to connect this device to the hub (central computer) of your LAN. The maximumlength of the cable connecting the terminal and the hub is 100 m. Communications usingTCP/IP as the LAN interface protocol are supported.
RS-232C
The RS-232C is a serial interface established by the EIA (Electronics Industries Associa-tion), and conforms to the specifications for DTE (data terminal equipment) and DCE (datacircuit terminating equipment) interface conditions.Using the signal line part of the RS-232C specifications with this unit allows you to use anexternal printer or GPS box.
SD memory card A type of flash memory card.
TIME PLOT interval The recording interval. This setting applies to TIMEPLOT and SD memory card recording.
USB-F (USB function)
An interface for exchanging data with a host controller (typically a computer) connectedwith a USB cable. For this reason, communication between functions is not possible.
Event
Power supply quality parameters are necessary in order to investigate and analyze powersupply issues. These parameters include disturbances such as transients, dips, swells,interruptions, flicker, and frequency fluctuations. As a rule, the term “event" refers to thestate detected based on thresholds for which abnormal values and abnormal waveformsfor these parameters have been set. Events also include timer and repeat event settings,which are unrelated to power supply quality parameters.
Inter-harmonics
All frequencies that are not a whole-number multiple of the fundamental frequency. Inter-harmonics include intermediate frequencies and inter-order harmonics, and the term refersto RMS values for the spectral components of electrical signals with frequencies betweentwo contiguous harmonic frequencies.
(Inter-harmonics of the order 3.5 assume a drive of 90 Hz or similar rather than a frequencysynchronized to the fundamental wave of an inverter or other device. However, inter-har-monics do not generally occur in high-voltage circuits under present-day conditions. Mostinter-harmonics are currently thought to be caused by the circuit load.)
External event function
Functionality for generating events by detecting a signal input to the instrument's externalevent input terminal and recording measured values and event waveforms at the time ofdetection. In this way, events are generated based on an alarm signal from a device otherthan the PW3198. By inputting an operating signal from an external device, an operationstart or stop trigger can be applied in order to record waveforms with the PW3198.
Coordinated universaltime (UTC)
The official time used worldwide. Although UTC is almost identical to Greenwich MeanTime (GMT), which is based on astronomical observations, UTC is determined by measur-ing 1 SI second using an atomic clock. Regular adjustments ensure that GMT and UTC dif-fer by no more than 1 second.
Out of crest factor
The crest factor expresses the size of the dynamic range of input on the measurementdevice and can be defined with the following expression.Crest factor = crest value (peak value)/RMS valueFor example, when measuring a distorted wave with a small RMS and a large peak on ameasurement device with a small crest factor, because the peak of the distorted waveexceeds the detection range of the input circuit, an RMS or harmonic measurement erroroccurs.
When you increase the measurement range, the peak does not exceed the input circuit’sdetection range, but because the resolution of the RMS decreases, measurement errorsmay occur.
(Continues on next page)
10050 2
500
-50
-100
[A] Measurement is not possible
Measurement is not possible
A measurement device with a small crest factor(When the crest factor is 2 for a 50 A range)
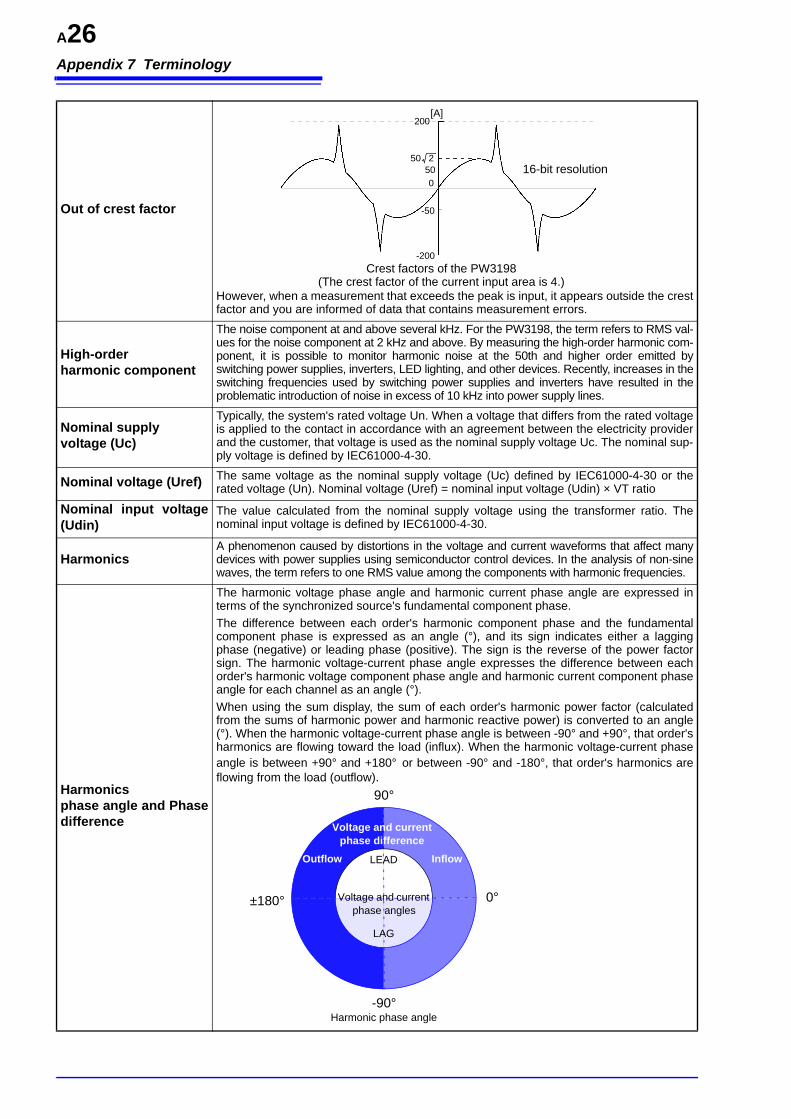
Appendix 7 Terminology
A26
Out of crest factor
However, when a measurement that exceeds the peak is input, it appears outside the crestfactor and you are informed of data that contains measurement errors.
High-order harmonic component
The noise component at and above several kHz. For the PW3198, the term refers to RMS val-ues for the noise component at 2 kHz and above. By measuring the high-order harmonic com-ponent, it is possible to monitor harmonic noise at the 50th and higher order emitted byswitching power supplies, inverters, LED lighting, and other devices. Recently, increases in theswitching frequencies used by switching power supplies and inverters have resulted in theproblematic introduction of noise in excess of 10 kHz into power supply lines.
Nominal supply voltage (Uc)
Typically, the system's rated voltage Un. When a voltage that differs from the rated voltageis applied to the contact in accordance with an agreement between the electricity providerand the customer, that voltage is used as the nominal supply voltage Uc. The nominal sup-ply voltage is defined by IEC61000-4-30.
Nominal voltage (Uref) The same voltage as the nominal supply voltage (Uc) defined by IEC61000-4-30 or therated voltage (Un). Nominal voltage (Uref) = nominal input voltage (Udin) × VT ratio
Nominal input voltage(Udin)
The value calculated from the nominal supply voltage using the transformer ratio. Thenominal input voltage is defined by IEC61000-4-30.
HarmonicsA phenomenon caused by distortions in the voltage and current waveforms that affect manydevices with power supplies using semiconductor control devices. In the analysis of non-sinewaves, the term refers to one RMS value among the components with harmonic frequencies.
Harmonics phase angle and Phasedifference
The harmonic voltage phase angle and harmonic current phase angle are expressed interms of the synchronized source's fundamental component phase. The difference between each order's harmonic component phase and the fundamentalcomponent phase is expressed as an angle (°), and its sign indicates either a laggingphase (negative) or leading phase (positive). The sign is the reverse of the power factorsign. The harmonic voltage-current phase angle expresses the difference between eachorder's harmonic voltage component phase angle and harmonic current component phaseangle for each channel as an angle (°). When using the sum display, the sum of each order's harmonic power factor (calculatedfrom the sums of harmonic power and harmonic reactive power) is converted to an angle(°). When the harmonic voltage-current phase angle is between -90° and +90°, that order'sharmonics are flowing toward the load (influx). When the harmonic voltage-current phaseangle is between +90° and +180° or between -90° and -180°, that order's harmonics areflowing from the load (outflow).
200
50 2500
-50
-200
[A]
16-bit resolution
Crest factors of the PW3198 (The crest factor of the current input area is 4.)
0°
90°
-90°
±180°
Harmonic phase angle
Voltage and current phase difference
Outflow InflowLEAD
LAG
Voltage and current phase angles
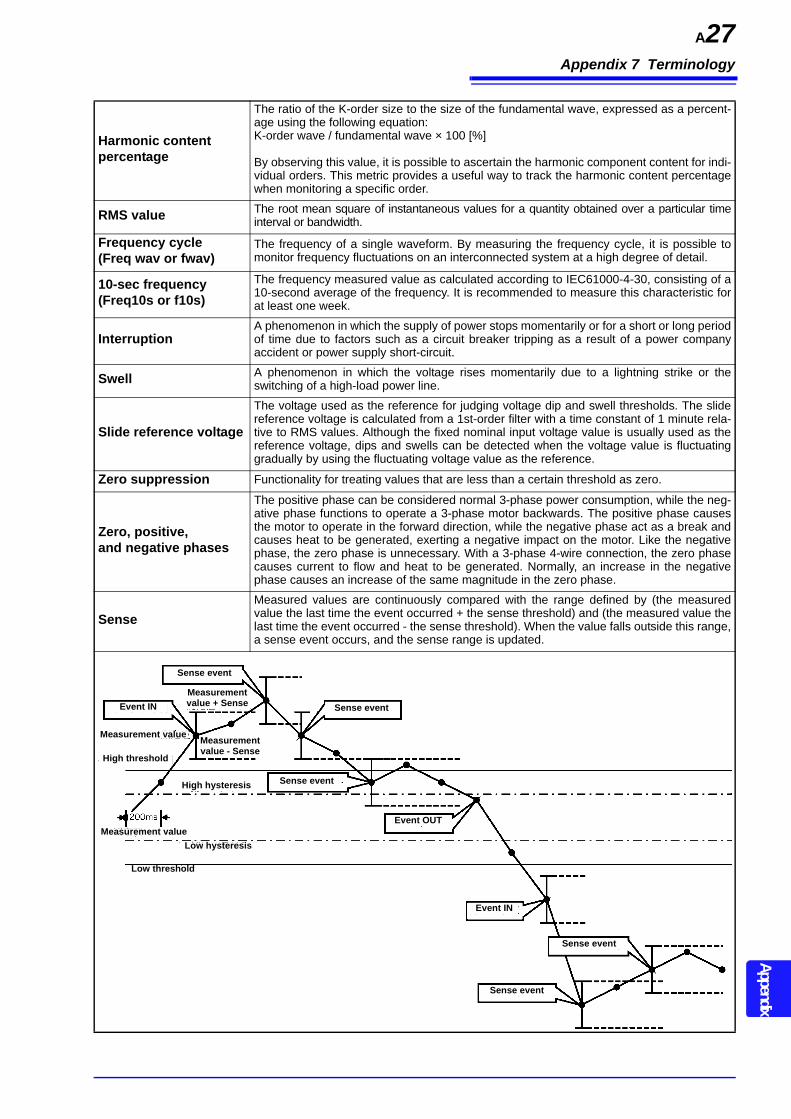
Appendix 7 Terminology
A27Appendix
Harmonic content percentage
The ratio of the K-order size to the size of the fundamental wave, expressed as a percent-age using the following equation:K-order wave / fundamental wave × 100 [%]
By observing this value, it is possible to ascertain the harmonic component content for indi-vidual orders. This metric provides a useful way to track the harmonic content percentagewhen monitoring a specific order.
RMS value The root mean square of instantaneous values for a quantity obtained over a particular timeinterval or bandwidth.
Frequency cycle (Freq wav or fwav)
The frequency of a single waveform. By measuring the frequency cycle, it is possible tomonitor frequency fluctuations on an interconnected system at a high degree of detail.
10-sec frequency (Freq10s or f10s)
The frequency measured value as calculated according to IEC61000-4-30, consisting of a10-second average of the frequency. It is recommended to measure this characteristic forat least one week.
InterruptionA phenomenon in which the supply of power stops momentarily or for a short or long periodof time due to factors such as a circuit breaker tripping as a result of a power companyaccident or power supply short-circuit.
Swell A phenomenon in which the voltage rises momentarily due to a lightning strike or theswitching of a high-load power line.
Slide reference voltage
The voltage used as the reference for judging voltage dip and swell thresholds. The slidereference voltage is calculated from a 1st-order filter with a time constant of 1 minute rela-tive to RMS values. Although the fixed nominal input voltage value is usually used as thereference voltage, dips and swells can be detected when the voltage value is fluctuatinggradually by using the fluctuating voltage value as the reference.
Zero suppression Functionality for treating values that are less than a certain threshold as zero.
Zero, positive, and negative phases
The positive phase can be considered normal 3-phase power consumption, while the neg-ative phase functions to operate a 3-phase motor backwards. The positive phase causesthe motor to operate in the forward direction, while the negative phase act as a break andcauses heat to be generated, exerting a negative impact on the motor. Like the negativephase, the zero phase is unnecessary. With a 3-phase 4-wire connection, the zero phasecauses current to flow and heat to be generated. Normally, an increase in the negativephase causes an increase of the same magnitude in the zero phase.
SenseMeasured values are continuously compared with the range defined by (the measuredvalue the last time the event occurred + the sense threshold) and (the measured value thelast time the event occurred - the sense threshold). When the value falls outside this range,a sense event occurs, and the sense range is updated.
Sense event
High threshold
Low hysteresis
High hysteresis
Low threshold
Sense event
Sense event
Sense event
Event IN
Event IN
Event OUT
Sense event
Measurement value + Sense
Measurement value - Sense
Measurement value
Measurement value
Appendix 7 Terminology
A28
Total harmonic distortion factor
THD-F:The ratio of the size of the total harmonic component to the size of the fundamental wave,expressed as a percentage using the following equation:
(for the PW3198, calculated to the 50th order)
This value can be monitored to assess waveform distortion for each item, providing a yard-stick that indicates the extent to which the total harmonic component is distorting the fun-damental waveform. As a general rule, the total distortion factor for a high-voltage systemshould be 5% or less; it may be higher at the terminal point of the system. THD-R:The ratio of the size of the total harmonic component to the size of RMS values, expressedas a percentage using the following equation:
(for the PW3198, calculated to the 50th order)
THD-F is typically used.
Measurement frequency (fnom)
The nominal frequency of the system being measured. Select from 50 Hz/60 Hz/400 Hz.(The measurement frequency is automatically set during the quick setup process.)
Timer event functionFunctionality for generating events at a set time interval and recording the measured valueand event waveform at that time. This function allows you to capture instantaneous wave-forms and other data regularly, even if no abnormalities have occurred. Use this functional-ity when you wish to record a waveform at a fixed time interval.
Multiple-phase system treatment
Method for defining the start and end of events such as dips, swells, and interruptions inmultiple-phase systems, for example systems with 3 phasesDip:A dip begins when the voltage of at least one channel is less than or equal to the thresholdand ends when voltage readings for all measurement channels exceed (threshold + hyster-esis voltage). Swell:A swell begins when the voltage of at least one channel exceeds the threshold and endswhen voltage readings for all measurement channels are less than or equal to (threshold +hysteresis voltage). Interruption:An interruption begins when voltage readings for all channels are less than or equal to thethreshold and ends when the voltage of a user-specified channel is greater than or equal to(threshold + hysteresis).
Dip
A short-lived voltage drop caused by the occurrence of a inrush current with a large load,such as when a motor starts. When recording voltage and current trends at the power ser-vice inlet, you can determine whether you should look for the cause of the dip inside or out-side the building. If the voltage drops while the building's current consumption rises, thecause likely lies inside the building. If the voltage and current are both low, the cause islikely to lie outside the building.
Text data A file containing only data expressed using characters and character codes.
RMS voltage refreshedeach half-cycle The RMS value of one voltage waveform overlapped every half-cycle.
RMS current refreshedeach half-cycle The RMS value of the current waveform every half-cycle.
Inrush currentA large current that flows temporarily, for example when an electric device is turned on. Ainrush current can be equal to or greater than 10 times the current that flows when thedevice is in the normal operating state. Inrush current measurement can be a useful diag-nostic when setting circuit breaker capacity.
Transient overvoltageAn event caused by lightning strikes, circuit-breaker and relay contact obstructions andtripping, and other phenomena. Transient overvoltages are often characterized by precipi-tous voltage variations and a high peak voltage.
Binary data All data other than text (character) data. Use binary data when analyzing data with the9624-50 PQA HiView Pro application.
Apparent powerThe (vector) power obtained by combining active power and reactive power. As its namesuggests, apparent power expresses the “visible" power and comprises the product of thevoltage and current RMS values.
Appendix 7 Terminology
A29Appendix
Unbalance factor
Unbalanced (symmetrical) 3-phase voltage (current)Three-phase AC voltage (current) with equal voltage and current magnitude for eachphase and 120 phase separation.Unbalanced (asymmetrical) 3-phase voltage (current) Three-phase AC voltage (current) with equal voltage and current magnitude for eachphase and 120° phase separation.Though all of the following descriptions refer to voltage, they apply to current as well.Degree of unbalance in threephase alternating voltageNormally described as the voltage unbalance factor, which is the ratio of negative-phasevoltage to positive-phase voltage
Zero-phase/positive-phase/negative-phase voltageThe concept of a zero-phase-sequence/positive-phase-sequence/negative-phase- sequence component in a three-phase alternating circuit applies the method ofsymmetrical coordinates (a method in which a circuit is treated so as to be divided intosymmetrical components of a zero phase, positive phase, and negative phase).• Zero-phase-sequence component: Voltage that is equal in each phase. Described as
V0. (Subscript 0: Zero-phase-sequence component)• Positive-phase-sequence component: Symmetrical three-phase voltage in which the value
for each phase is equal, and each of the phases is delayed by 120 degrees in the phasesequence a->b->c. Described as V1.(Subscript 1: Positive-phase-sequence component)
• Negative-phase-sequence component: Symmetrical three-phase voltage in which the valuefor each phase is equal, and each of the phases is delayed by 120 degrees in the phasesequence a->c->b. Described as V2. (Subscript 2: Negative-phase-sequence component)
If Va, Vb, and Vc are given as the three-phase alternating voltage, the zero-phase voltage,positive-phase voltage, and negative voltage are formulated as shown below.
a is referred to as the “vector operator.” It is a vector with a magnitude of 1 and a phase angle of 120 degrees. Therefore, the phase angle is advanced by 120 degrees if multiplied by a, and by 240 degrees if multiplied by a2. If the three-phase alternating voltage is balanced, the zero-phase voltage and negative-phase voltage are 0, and only positive phase voltage, which is equal to the effective value of the three-phase alternating voltage, is described.Unbalance factor of three-phase currentUsed in applications such as the verification of power supplied to electrical equipment pow-ered by a 3-phase induction motor. The current unbalance factor is several times larger than the voltage unbalance factor. The less a three-phase induction motor slips, the greater the difference between these two factors. Volt-age unbalance causes such phenomena as current unbalance, an increase in temperature, an increase in input, a decline in efficiency, and an increase in vibration and noise.Uunb must not exceed 2%, and Iunb must be 10% or less. In a 3P4W system with anunbalanced load, the Uunb0 and Inub0 components indicate the current that flows to the N(neutral) line.
FlagA marker used to distinguish unreliable measured values occurring due to disturbancessuch as dips, swells, and interruptions. Flags are recorded as part of the TIMEPLOT datastatus information. The concept is defined by the IEC61000-4-30 standard.
Flicker
A disturbance caused by a voltage drop resulting when equipment with a large load startsup or when a large current flows under a temporary high-load state. For lighting loads,flicker primarily manifests itself as blinking. Electric-discharge lamps such as fluorescentand mercury-vapor lights are particularly prone to the effects of flicker. When temporary dimming of lights due to voltage drops occurs frequently, it produces a flickeringeffect (caused by repeated dimming) that produces an extremely unpleasant visual sensation. Measurement methods can be broadly divided into IEC flicker and XXV10 flicker. In Japan,the V10 method is most frequently used.
Voltage unbalance factor = Negative-phase voltage
Positive-phase voltagex 100 [%]
Zero-phase voltage V0 = Va+Vb+Vc3
Positive-phase voltage V1 = Va+aVb+a2Vc3
Negative-phase voltage V2 = Va+a2Vb+aVc3

Appendix 7 Terminology
A30
Manual event function
Functionality for generating events when the MANU EVENT key is pressed and recordingthe measured value and event waveform at that time. In this way, events can be generatedas a snapshot of the system being measured. Use this functionality when you wish torecord a waveform but cannot find another event that defines the desired phenomenon orwhen you wish to record data manually to avoid the generation of too many events.
Reactive power
Power that does not perform actual work, resulting in power consumption as it travelsbetween the load and the power supply. Reactive power is calculated by multiplying theactive power by the sine of the phase difference (sin ). It arises from inductive loads(deriving from inductance) and capacitive loads (deriving from capacitance), with reactivepower derived from inductive loads known as lag reactive power and reactive powerderived from capacitive loads known as lead reactive power.
Reactive power demand The average reactive power used during a set period of time (usually 30 minutes).
Active power Power that is consumed doing work.
Active power demand The average active power used during a set period of time (usually 30 minutes).
Power factor (PF/DPF)
Power factor is the ratio of effective power to apparent power. The larger the absolutevalue of the power factor, the greater the proportion of effective power, which provides thepower that is consumed, and the greater the efficiency. The maximum absolute value is 1.Conversely, the smaller the absolute value of the power factor, the greater the proportion ofreactive power, which is not consumed, and the lower the efficiency. The minimum abso-lute value is 0.For this device, the sign of the power factor indicates whether the current phase is laggingor leading the voltage. A positive value (no sign) indicates that the current phase is laggingthe voltage. Inductive loads (such as motors) are characterized by lagging phase. A nega-tive value indicates that the current phase is leading the voltage. Capacitive loads (such ascapacitors) are characterized by leading phase.The power factor (PF) is calculated using rms values that include harmonic components.Larger harmonic current components cause the power factor to deteriorate. By contrast,since the displacement power factor (DPF) calculates the ratio of effective power to appar-ent power from the fundamental voltage and fundamental current, no voltage or currentharmonic component is included. This is the same measurement method used by reactivepower meters installed at commercial-scale utility customers' facilities.Displacement power factor, or DPF, is typically used by the electric power system, althoughpower factor, or PF, is sometimes used to measure equipment in order to evaluate effi-ciency.When a lagging phase caused by a large inductive load such as a motor results in a lowdisplacement power factor, there are corrective measures that can be taken to improve thepower factor, for example by adding a phase advance capacitor to the power system. Dis-placement power factor (DPF) measurements can be taken under such circumstances toverify the improvement made by the phase advance capacitor.
Continuous event function
Functionality for automatically generating the set number of events in succession everytime a target event occurs. Events after the initial event are recorded as continuous events.This functionality allows an instantaneous waveform of up to 1 s in duration to be recordedafter the event occurs. However, continuous events are not generated when an eventoccurs while continuous events are occurring. Additionally, continuous event generationstops when measurement is stopped. Use this function when you wish to observe a wave-form at the instant an event occurs as well as subsequent changes in the instantaneouswaveform. For the PW3198, a waveform of up to 1 s in duration will be recorded.

Index
Index 1Inde
Numbers10-sec frequency ............................................. A27
BBattery pack ........................................................30Beep ....................................................................64Before connecting measurement cables ...............8Boot key reset .....................................................73
CClamp sensor
Connecting ......................................................47connecting .......................................................34Input cable label ..............................................28Settings ...........................................................39
ClampSensorSettings ...........................................................56
Clock .............................................................38, 65Color ...................................................................64Connection check ...............................................48Connection diagram ............................................40Connection mode ................................................39Continuous event ....................................... 72, A30Crest factor ...................................................... A25CT .......................................................................34CT Ratio ..............................................................56
DDedicated application program .........................155Default Gateway ...............................................158DELETE ............................................................142Dip .................................................................... A28Disp COPY Interval .............................................63DPF .................................................................. A30
EEN50160 .................................................... 51, A24ENKAKU ...........................................................153Ethernet (LAN) connection ........................155, 161Event ................................................................ A25Event icon ...........................................................52EVENT indicator .................................................21Event list ...........................................................121
Event list notation ............................................. 122Event waveform ............................................... 189External event .................................................. A25External Out ....................................................... 65
FFactory settings .................................................. 74File types .......................................................... 136Filter ................................................................... 57Flag .................................................................. A29Flag concept ..................................................... 189Flicker ...................................................57, A5, A29Fluctuation data ................................................ 189FORMAT .......................................................... 138Frequency .......................................................... 56Frequency cycle ............................................... A27Frequency fluctuations ....................................... A4
HHarm Calc
Settings .......................................................... 57Harmonic ............................................................ A5Harmonic content percentage .......................... A27Harmonics phase angle ................................... A26High-order harmonic component ................A6, A26High-order harmonic waveform ........................ 189HOLD indicator ................................................... 20HTTP server ..................................................... 162
II Range ............................................................... 56IEC61000-4-30 ................................................. A24Initializing ........................................................... 73Input cable labels ............................................... 28Inrush Current .................................................... 51Inrush current .............................................A6, A28Inspection ..................................................... 6, 216Inter-harmonics ..........................................A5, A25Interruption .................................................A5, A27IP address ........................................................ 159ITIC curve ......................................................... A24
KK factor ............................................................. A24
Index
x

Index
Index 2
Key lock .............................................................. 16
LLAN .................................................................... 65LAN cable ................................................. 160, 161LAN interface ................................................... 157Language ........................................................... 64LCD Backlight .................................................... 65List of event settings .......................................... 66Lithium battery .................................................. 221LOAD ............................................................... 146
MMANU EVENT key ............................................. 71Manual event .................................................... A30Manual event settings ........................................ 71Measurement categories ...................................... 5
NNegative phase ................................................ A27Noise ................................................................ 129Nominal input voltage ....................................... A26Number or order ................................................. 82
OOperating state ................................................... 20Options ................................................................. 3
PPF ..................................................................... A30PF Type .............................................................. 57Phase difference .............................................. A26Phase names ..................................................... 46Positive phase .................................................. A27Power factor ..................................................... A30PT ....................................................................... 34
QQuick setup ........................................................ 50
RReal-time clock ................................................. 166Recording ........................................................... 51Recording Items ................................................. 62Recording times ......................................... 63, 141Remaining storage time ................................... 141Remote control ......................................... 157, 162Repair ............................................................... 216Repeat Record ................................................... 59Replaceable parts and operating lifetimes ....... 216
Reverting the instrument to its factory settings .. 73RS-232C ............................................................. 65
SSAVE ................................................................ 145Save operation ................................................. 139SD memory card .......................................... 20, 32
Format .......................................................... 138Self-test .............................................................. 31Sense ...............................................................A27Slide reference voltage .....................................A27Spiral tube .......................................................... 29Standard Power Quality ..................................... 51Start time and date ............................................. 58Stop time and date ............................................. 58Strap ................................................................... 28Subnet mask .................................................... 159Swell .................................................................A27System reset ...................................................... 73
TTHD Type ........................................................... 57TIME PLOT Interval ............................................ 63Time Start ........................................................... 58Timer event function .........................................A28Timer event settings ........................................... 72Total harmonic distortion factor ........................A28Transient overvoltage .........................................A4Transient waveform .......................................... 189Transporting ..................................................... 216Trend time series graphs .................................... 91
UU Event ............................................................... 51Udin .................................................................... 55Unbalance ..........................................................A5Unbalance factor ..............................................A29URMS Type ........................................................ 56USB connection ................................................ 155USB interface ................................................... 156
VVector ................................................................. 48VIEW ................................................................ 144Voltage cord
Attaching ........................................................ 46Voltage dip .........................................................A4Voltage swell ......................................................A4Voltage Waveform Comparison .......................A11VT Ratio ............................................................. 56VT(PT) ................................................................ 34
Index
Index 3Inde
WWarm-up .......................................................36, 37When the memory is full .....................................63WIRING
Settings ...........................................................55
ZZero adjustment ..................................................37Zero phase ....................................................... A27
x

Index
Index 4