
www.ironmountain.com
Earnings Commentary and Supplemental Information
Second Quarter 2014
Unaudited
www.ironmountain.com Selected metric definitions are available in the appendix
Safe Harbor Statement
2
Safe Harbor Statement Under the Private Securities Litigation Reform Act of 1995: This presentation contains certain forward-looking statements within the meaning of the Private Securities Litigation Reform Act of 1995 and other securities laws and is subject to the safe-harbor created by such Act. Forward-looking statements include our financial performance outlook and statements regarding our operations, economic performance, financial condition, goals, beliefs, future growth strategies, investment objectives, plans and current expectations, and the anticipated benefits of our conversion to a real estate investment trust for federal income tax purposes, including the opportunity to create value by acquiring leased space, our potential for a broadened investor base and enhanced valuations and the estimated range of our remaining special distribution and our ordinary dividends. These forward-looking statements are subject to various known and unknown risks, uncertainties and other factors. When we use words such as "believes," "expects," "anticipates," "estimates" or similar expressions, we are making forward-looking statements. You should not rely upon forward-looking statements except as statements of our present intentions and of our present expectations, which may or may not occur. Although we believe that our forward-looking statements are based on reasonable assumptions, our expected results may not be achieved, and actual results may differ materially from our expectations. Important factors that could cause actual results to differ from our other expectations include, among others: (i) the actual 2014 special distribution and our expected ordinary dividends may be materially different from our estimates; (ii) the cost to comply with current and future laws, regulations and customer demands relating to privacy issues; (iii) the impact of litigation or disputes that may arise in connection with incidents in which we fail to protect our customers' information; (iv) changes in the price for our storage and information management services relative to the cost of providing such storage and information management services; (v) changes in customer preferences and demand for our storage and information management services; (vi) the adoption of alternative technologies and shifts by our customers to storage of data through non-paper based technologies; (vii) the cost or potential liabilities associated with real estate necessary for our business; (viii) the performance of business partners upon whom we depend for technical assistance or management expertise outside the U.S.; (ix) changes in the political and economic environments in the countries in which our international subsidiaries operate; (x) claims that our technology violates the intellectual property rights of a third party; (xi) changes in the cost of our debt; (xii) the impact of alternative, more attractive investments on dividends; (xiii) our ability or inability to complete acquisitions on satisfactory terms and to integrate acquired companies efficiently; (xiv) other trends in competitive or economic conditions affecting our financial condition or results of operations not presently contemplated; and (xv) other risks described more fully in our Annual Report on Form 10-K filed on February 28, 2014 under “Item 1A. Risk Factors” and other documents that we file with the SEC from time to time. Except as required by law, we undertake no obligation to release publicly the result of any revision to these forward-looking statements that may be made to reflect events or circumstances after the date hereof or to reflect the occurrence of unanticipated events.
www.ironmountain.com Selected metric definitions are available in the appendix
All figures except per share and facility counts in 000s unless noted
All figures in R$ unless noted
Figures may not foot due to rounding
Table of Contents
3
Investor Relations Contacts:
Faten Freiha, 617-535-8404
Director, Investor Relations
Melissa Marsden, 617-535-8595
Senior Vice President, Investor Relations
Earnings Commentary 4
Company Profile 6
Financial Highlights 7
Components of Year-over-Year Revenue Growth 8
Guidance Summary 9
Quarterly Operating Performance 10
Year-to-Date Operating Performance 11
Consolidated Balance Sheets 12
Consolidated Statements of Operations 13
Reconciliation of Operating Income to Adjusted OIBDA 14
Reconciliation of Reported Earnings per Share to Adjusted Earnings per Share 15
Reconciliation of Free Cash Flows to Operating Cash Flow 16
Reconciliation of Net Income Attributable to IRM to FFO & AFFO 17
Storage Net Operating Income (NOI) 18
Global Real Estate Portfolio 19
Revenue from Rental Activities and Storage NOI per Racked Square Foot 20
Portfolio Utilization 21
Gross Book Value of Real Estate Assets 22
Service Business Detail 23
Customer Data 24
Debt Schedule 25
Capitalization 26
Lease Obligations 27
Components of Value 28
Appendix 29

www.ironmountain.com Selected metric definitions are available in the appendix
Earnings Commentary
4
Reconciliation of Non-GAAP Measures: Throughout this document, Iron Mountain will discuss Adjusted Operating Income Before Depreciation, Amortization and
Intangible Impairments and REIT Costs (Adjusted OIBDA), Free Cash Flows Before Acquisitions and Discretionary Items (FCF), Adjusted Earnings Per Share (Adjusted
EPS), Funds From Operations (FFO NAREIT), FFO (Normalized) and Adjusted Funds From Operations (AFFO), which do not conform to accounting principles generally
accepted in the United States (GAAP). The reconciliations of these measures to the appropriate GAAP measure, as required by Regulation G of the Securities Exchange
Act of 1934, as amended, are included later in this document (see Table of Contents).
Iron Mountain Second Quarter 2014 Financial Results
Second Quarter Performance Driven by Strong Constant Dollar Storage Rental Growth
Key Initiatives and REIT Conversion Position Company for Future Growth and Enhanced Stockholder Returns
• Total reported revenues were $787 million, compared with $754 million in 2013. On a constant dollar (C$) basis, total revenue growth was 4.4%, reflecting
solid storage rental revenue gains of 5.7% and service revenue growth of 2.7%. Year-to-date total reported revenues were $1.56 billion, compared with $1.50
billion in 2013. On a C$ basis, first-half total revenue growth was 4.6%, driven by storage rental revenue gains of 5.5% and service revenue growth of 3.3%.
• Adjusted OIBDA was $242 million, compared with $232 million in 2013, while year-to-date Adjusted OIBDA was $470 million, compared with $459 million in
2013. Year-to-date Adjusted OIBDA in 2014 includes $3.6 million of costs associated with the company’s 2013 restructuring and $3.9 million of real estate
investment trust (REIT) compliance costs, while Adjusted OIBDA for the first half of 2013 included $4.8 million of legal accrual costs.
• Adjusted EPS was $0.41 per diluted share ($1.41 per share on a GAAP basis), compared with $0.39 per diluted share ($0.14 per share on a GAAP basis) in
2013. Year-to-date Adjusted EPS was $0.75 per diluted share ($1.63 per share on a GAAP basis), compared with $0.77 per diluted share ($0.24 per share on
a GAAP basis) in 2013. Adjusted EPS for both the quarter and six months ended June 30, 2013 has been restated to reflect a structural tax rate of
approximately 15%. GAAP EPS for the quarter and year-to-date in 2014 includes $194 million and $176 million, respectively, of a net discrete tax benefit
primarily related to the reversal of current and deferred tax assets and liabilities, partially offset by incremental taxes related to foreign repatriation associated
with the company’s conversion to a REIT effective January 1, 2014.
• Progress on the company’s strategic plan included improved retention and positive volume growth in the North American records management (RM) business
while maintaining strong margins. Global RM net volume growth was 7.6%. Emerging Markets expanded to 12% of total revenue demonstrating good
progress toward the company’s goal to increase contribution from these markets to 16% by the end of 2016.
“During the second quarter, we made progress on several key fronts,” said William L. Meaney, Iron Mountain’s president and chief executive officer. “We
received the necessary private letter rulings from the IRS and approved conversion to a REIT for the taxable year that began January 1, 2014, and advanced our
strategic plan with acquisitions in both emerging and developed markets. In keeping with our goal to own more of our strategic real estate over time, we also
completed our first above-ground data center near Boston and installed initial racking in the first building at our newly developed records management campus
near Sao Paulo, Brazil.”
www.ironmountain.com Selected metric definitions are available in the appendix
Earnings Commentary
5
Additionally, we continued to demonstrate the resilience of our storage rental business and our ability to preserve and extend that durability with strong financial and
operating results for the quarter. We delivered improvement in revenue, maintained our strong margins, and drove solid constant dollar storage rental growth with
increases in volume – all in line with or exceeding expectations,” Meaney said.
Second quarter C$ total storage rental growth of 5.7% reflected strong increases of 14.0% in the company’s International business (including 32.2% C$ growth in
Emerging Markets) and growth in the North American Records and Information Management (RIM) and North American Data Management (DM) segments of 3.3%
and 0.4%, respectively. Since the beginning of 2014, the company has acquired five international storage-related businesses and the records inventory of nine
document storage companies for a total investment of approximately $72 million. During the second quarter, the company enhanced its presence in the emerging
market of Brazil and added to its position in the United States with customer acquisitions in New Orleans, Philadelphia and Buffalo. “These transactions are
consistent with our plan to expand our market leadership in developed markets and extend our reach into emerging markets to support long-term growth and solid
returns. We believe our capital allocation approach will continue to deliver consistent, long-term growth with low volatility and attractive stockholder returns,” Meaney
added.
Operations Review
Operating performance for the quarter was in line with expectations, with internal storage rental growth for the quarter of 1.6%, driven by 5.6% gains in the
International business (including 12% internal growth in Emerging Markets) and flat internal growth in the North American RIM and North American DM segments.
Foreign currency rate changes reduced reported storage rental revenue growth rates by approximately 0.3% for the quarter.
Global RM net volumes grew by 7.6% on a year-over-year basis, supported by strong 17.9% volume increases in the International business, which was driven by
growth from both emerging and developed markets as well as recent acquisitions.
As the company has previously noted, service revenues reflect a trend toward reduced retrieval/re-file activity and related transportation revenues, although the rate
of decline in these activities has begun to moderate in recent periods. Second quarter internal service revenue declined 1.9% compared with the prior-year period,
due to lower project fees and revenue associated with customer terminations in North America. Second quarter C$ service revenue growth was 2.7%, driven by
recent acquisitions with related new incoming volume and transportation fees. Recycled paper pricing was roughly in line with prior year averages.
Financial Review
Consolidated Adjusted OIBDA margins for the second quarter of 2014 of 30.7% were in line with the second quarter of 2013. Second quarter Adjusted OIBDA
margins in the North American RIM segment remained strong at 38.3%, and North American DM Adjusted OIBDA margins of 60.5% also were in line with the same
period in 2013. The International business continued to deliver profitability on a portfolio basis in line with the company’s mid-20% target, with Adjusted OIBDA
margins of 23.8% for the second quarter.
Free Cash Flows Before Acquisitions and Discretionary Items (FCF) for the year-to-date before acquisitions, real estate capital expenditures, operating costs and
cash taxes related to the conversion to a REIT was $93 million, compared with $154 million for the same period in 2013. This change was primarily due to higher
cash taxes and additions to customer acquisition costs in 2014. Capital expenditures for the first half of 2014, excluding $49 million of real estate and $4 million of
REIT-related capital expenditures, totaled $94 million, or 6.0% of revenues. The company’s liquidity position remains strong with availability of $536 million and a net
total lease adjusted leverage ratio of 5.1x at quarter end, as compared to a maximum allowable ratio of 6.5x. The calculation for this ratio is net debt including the
capitalized value of lease obligations divided by EBITDAR as defined in the company’s credit agreement.
www.ironmountain.com Selected metric definitions are available in the appendix
Company Profile
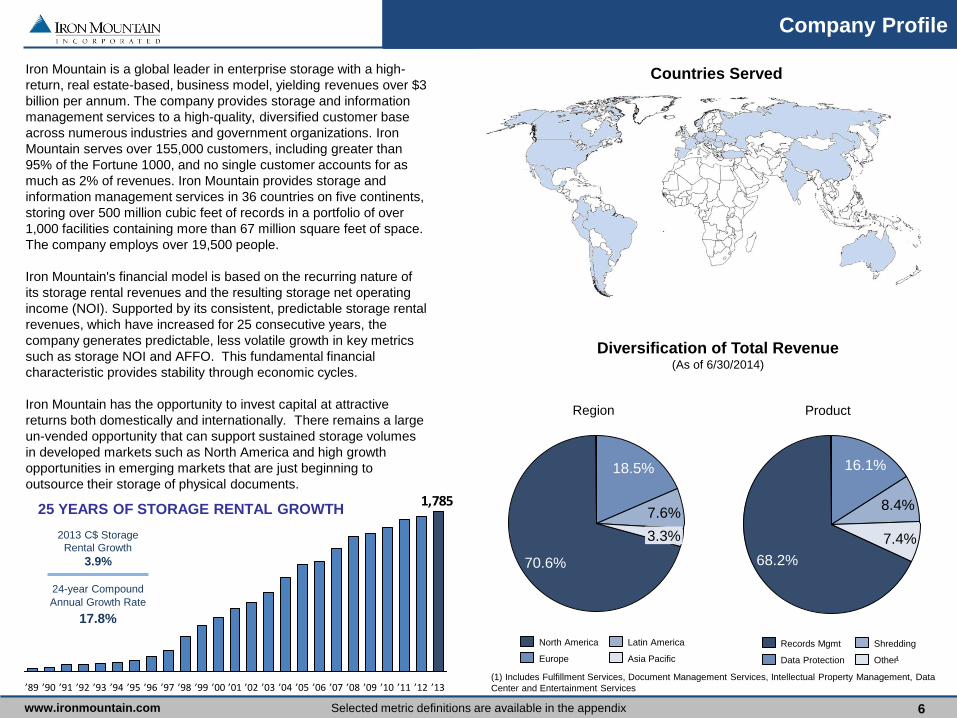
Iron Mountain is a global leader in enterprise storage with a high-
return, real estate-based, business model, yielding revenues over $3
billion per annum. The company provides storage and information
management services to a high-quality, diversified customer base
across numerous industries and government organizations. Iron
Mountain serves over 155,000 customers, including greater than
95% of the Fortune 1000, and no single customer accounts for as
much as 2% of revenues. Iron Mountain provides storage and
information management services in 36 countries on five continents,
storing over 500 million cubic feet of records in a portfolio of over
1,000 facilities containing more than 67 million square feet of space.
The company employs over 19,500 people.
Iron Mountain's financial model is based on the recurring nature of
its storage rental revenues and the resulting storage net operating
income (NOI). Supported by its consistent, predictable storage rental
revenues, which have increased for 25 consecutive years, the
company generates predictable, less volatile growth in key metrics
such as storage NOI and AFFO. This fundamental financial
characteristic provides stability through economic cycles.
Iron Mountain has the opportunity to invest capital at attractive
returns both domestically and internationally. There remains a large
un-vended opportunity that can support sustained storage volumes
in developed markets such as North America and high growth
opportunities in emerging markets that are just beginning to
outsource their storage of physical documents.
Diversification of Total Revenue (As of 6/30/2014)
6
Countries Served
(1) Includes Fulfillment Services, Document Management Services, Intellectual Property Management, Data
Center and Entertainment Services
70.6%
3.3%
7.6%
18.5%
7.4%
8.4%
16.1%
68.2%
Europe
North America
Asia Pacific
Latin America
Other
Shredding
Data Protection
Records Mgmt
2013 C$ Storage
Rental Growth
3.9%
24-year Compound
Annual Growth Rate
17.8%
25 YEARS OF STORAGE RENTAL GROWTH 1,785
’09 ’04 ’05 ’02 ’01 ’00 ’99 ’98 ’13 ’96 ’95 ’11 ’12 ’03 ’06 ’07 ’97 ’10 ’08 ’94 ’93 ’92 ’91 ’90 ’89
1
Product Region
www.ironmountain.com Selected metric definitions are available in the appendix
Financial Highlights
7
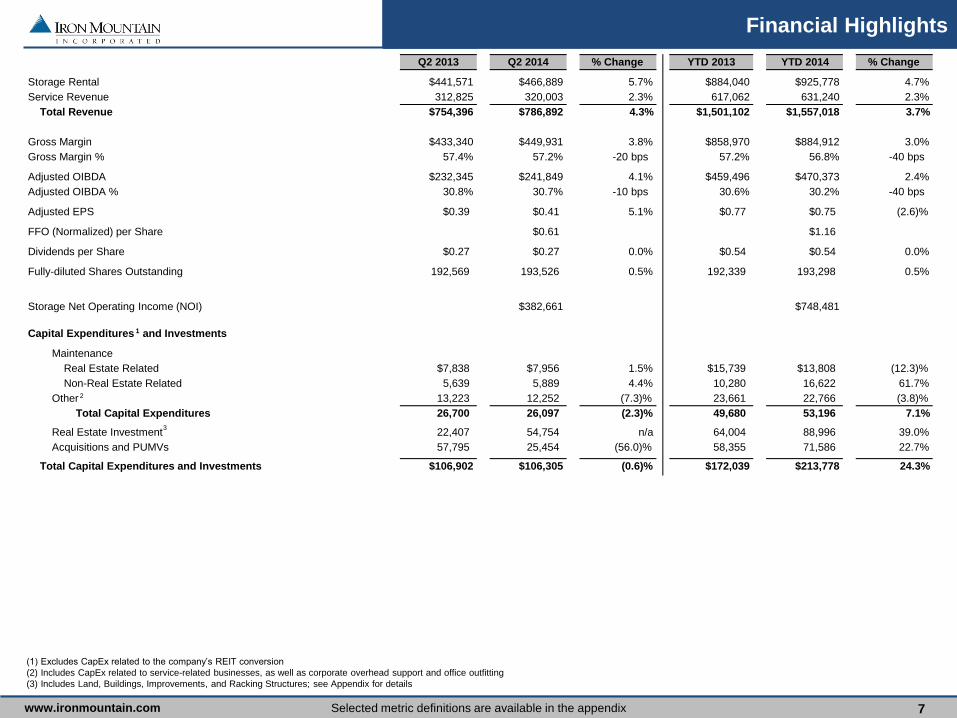
(1) Excludes CapEx related to the company’s REIT conversion
(2) Includes CapEx related to service-related businesses, as well as corporate overhead support and office outfitting
(3) Includes Land, Buildings, Improvements, and Racking Structures; see Appendix for details
Q2 2013 Q2 2014 % Change YTD 2013 YTD 2014 % Change
Storage Rental $441,571 $466,889 5.7% $884,040 $925,778 4.7%
Service Revenue 312,825 320,003 2.3% 617,062 631,240 2.3%
Total Revenue $754,396 $786,892 4.3% $1,501,102 $1,557,018 3.7%
Gross Margin $433,340 $449,931 3.8% $858,970 $884,912 3.0%
Gross Margin % 57.4% 57.2% -20 bps 57.2% 56.8% -40 bps
Adjusted OIBDA $232,345 $241,849 4.1% $459,496 $470,373 2.4%
Adjusted OIBDA % 30.8% 30.7% -10 bps 30.6% 30.2% -40 bps
Adjusted EPS $0.39 $0.41 5.1% $0.77 $0.75 (2.6)%
FFO (Normalized) per Share $0.61 $1.16
Dividends per Share $0.27 $0.27 0.0% $0.54 $0.54 0.0%
Fully-diluted Shares Outstanding 192,569 193,526 0.5% 192,339 193,298 0.5%
Storage Net Operating Income (NOI) $382,661 $748,481
Capital Expenditures 1 and Investments
Maintenance
Real Estate Related
3
$7,838 $7,956 1.5% $15,739 $13,808 (12.3)%
Non-Real Estate Related 5,639 5,889 4.4% 10,280 16,622 61.7%
Other 2 13,223 12,252 (7.3)% 23,661 22,766 (3.8)%
Total Capital Expenditures 26,700 26,097 (2.3)% 49,680 53,196 7.1%
Real Estate Investment 22,407 54,754 n/a 64,004 88,996 39.0%
Acquisitions and PUMVs 57,795 25,454 (56.0)% 58,355 71,586 22.7%
Total Capital Expenditures and Investments $106,902 $106,305 (0.6)% $172,039 $213,778 24.3%
www.ironmountain.com Selected metric definitions are available in the appendix
Components of Year-over-Year Revenue Growth
8
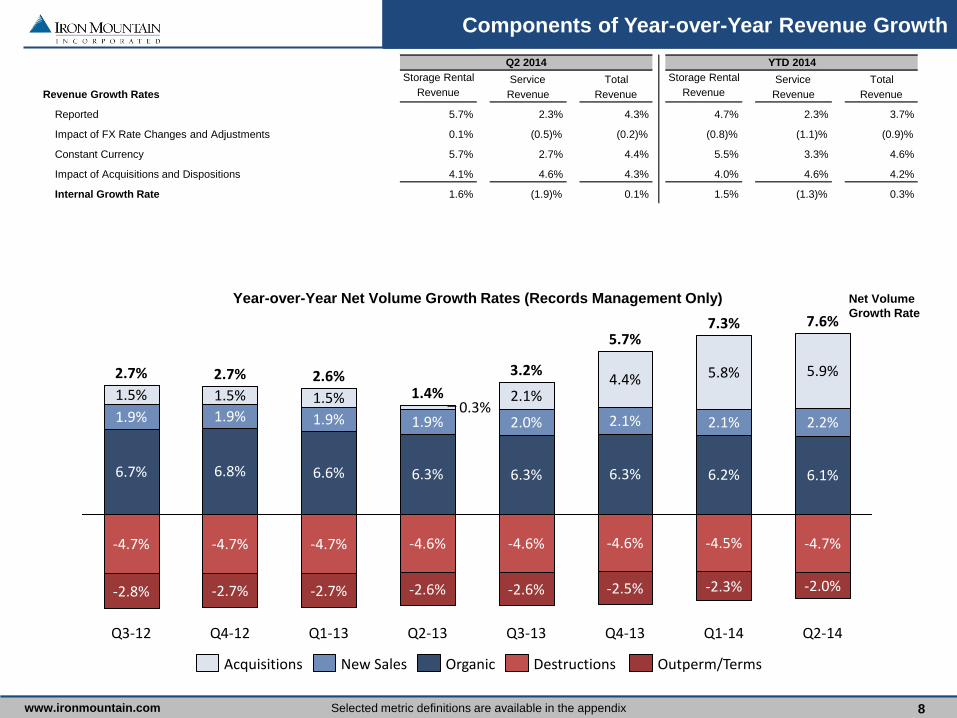
Net Volume
Growth Rate Year-over-Year Net Volume Growth Rates (Records Management Only)
-4.6%
6.3%
2.1%
4.4%
Q3-13
-4.7%
6.6%
1.9%
1.5%
Q4-12
2.7%
-4.7%
6.8%
1.9%
1.5%
Q3-12
2.7%
-4.7%
Q2-14
7.6%
-4.7%
6.1%
2.2%
5.9%
Q1-14
6.7%
1.9%
1.5%
-2.8% -2.7% -2.7% -2.6% -2.6% -2.5% -2.3% -2.0%
3.2%
-4.6%
6.3%
2.0%
2.1%
Q2-13
1.4%
-4.6%
6.3%
1.9% 0.3%
Q1-13
2.6%
5.7% 7.3%
-4.5%
6.2%
2.1%
5.8%
Q4-13
Destructions New Sales Organic Acquisitions Outperm/Terms
Revenue Growth Rates
Reported 5.7% 2.3% 4.3% 4.7% 2.3% 3.7%
Impact of FX Rate Changes and Adjustments 0.1% (0.5)% (0.2)% (0.8)% (1.1)% (0.9)%
Constant Currency 5.7% 2.7% 4.4% 5.5% 3.3% 4.6%
Impact of Acquisitions and Dispositions 4.1% 4.6% 4.3% 4.0% 4.6% 4.2%
Internal Growth Rate 1.6% (1.9)% 0.1% 1.5% (1.3)% 0.3%
Service
Revenue
Total
Revenue
Q2 2014 YTD 2014
Storage Rental
Revenue
Service
Revenue
Total
Revenue
Storage Rental
Revenue
www.ironmountain.com Selected metric definitions are available in the appendix
Guidance Summary
9
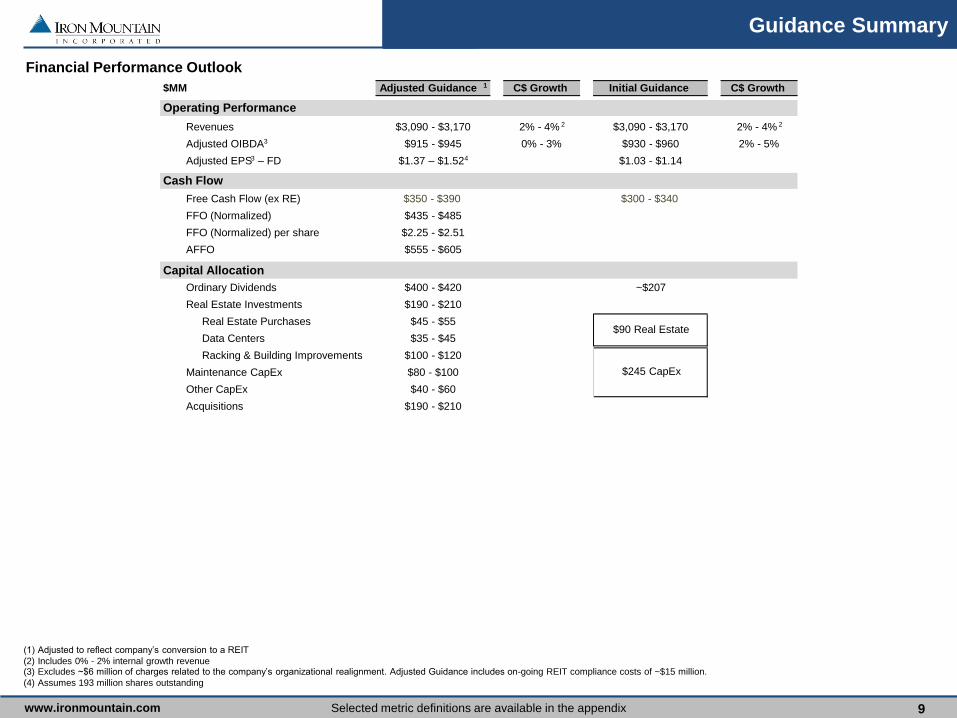
Financial Performance Outlook
(1) Adjusted to reflect company’s conversion to a REIT
(2) Includes 0% - 2% internal growth revenue (3) Excludes ~$6 million of charges related to the company’s organizational realignment. Adjusted Guidance includes on-going REIT compliance costs of ~$15 million.
(4) Assumes 193 million shares outstanding
$MM Adjusted Guidance 1 C$ Growth Initial Guidance C$ Growth
Operating Performance
Revenues $3,090 - $3,170 2% - 4% 2 $3,090 - $3,170 2% - 4% 2
Adjusted OIBDA 3 $915 - $945 0% - 3% $930 - $960 2% - 5%
Adjusted EPS 3 – FD $1.37 – $1.52 4 $1.03 - $1.14
Cash Flow
Free Cash Flow (ex RE) $350 - $390 $300 - $340
FFO (Normalized) $435 - $485
FFO (Normalized) per share $2.25 - $2.51
AFFO $555 - $605
Capital Allocation
Ordinary Dividends $400 - $420 ~$207
Real Estate Investments $190 - $210
Real Estate Purchases $45 - $55
Data Centers $35 - $45
Racking & Building Improvements $100 - $120
Maintenance CapEx $80 - $100
Other CapEx $40 - $60
Acquisitions $190 - $210
$90 Real Estate
$245 CapEx

www.ironmountain.com Selected metric definitions are available in the appendix
Quarterly Operating Performance
10
(1) Includes ~$2 million for the relocation of the Boston headquarters (2) Includes ~$8 million for data center construction
(3) Excludes certain costs and expenditures associated with the previous work of the Strategic Review Special Committee of the Company’s Board of directors and the company’s conversion to a REIT
(4) Based on incurred versus cash paid basis
Q2 Results 3 % Growth
Q2 2013 Q2 2014 Reported
Impact of FX Rate
Changes and
Adjustments
Constant
Currency
Impact of
Acquisitions and
Dispositions
Internal
Growth
NA Records and Information Management
Storage Revenue $261,870 $270,462 3.3% (0.0)% 3.3% (3.0)% 0.3%
Service Revenue 184,145 181,809 (1.3)% (0.8)% (0.5)% (2.4)% (2.9)%
Total Revenue $446,015 $452,271 1.4% (0.3)% 1.7% (2.7)% (1.0)%
Adjusted OIBDA 169,391 173,327
Adjusted OIBDA Margin % 38.0% 38.3%
CapEx % (ex RE and REIT) 4 4.7% 4.3%
NA Data Management
Storage Revenue $61,302 $61,190 (0.2)% (0.6)% 0.4% (0.6)% (0.2)%
Service Revenue 38,178 36,361 (4.8)% (0.6)% (4.2)% (0.7)% (4.9)%
Total Revenue $99,480 $97,551 (1.9)% (0.6)% (1.3)% (0.7)% (2.0)%
Adjusted OIBDA 60,081 59,020
Adjusted OIBDA Margin % 60.4% 60.5%
CapEx % (ex RE and REIT) 4 2.8% 4.2%
International
Storage Revenue $115,447 $132,323 14.6% 0.6% 14.0% (8.4)% 5.6%
Service Revenue 90,256 101,267 12.2% 0.6% 11.6% (10.7)% 0.9%
Total Revenue $205,703 $233,590 13.6% 0.6% 13.0% (9.4)% 3.6%
Adjusted OIBDA 52,909 55,704
Adjusted OIBDA Margin % 25.7% 23.8%
CapEx % (ex RE and REIT) 4 6.3% 8.0%
Corporate and Other
Storage Revenue $2,952 $2,914 (1.3)% 0.0% (1.3)% 0.0% (1.3)%
Service Revenue 246 566 130.1% 0.0% 130.1% 0.0% 130.1%
Total Revenue $3,198 $3,480 8.8% 0.0% 8.8% 0.0% 8.8%
Adjusted OIBDA (50,036) (46,202)
CapEx % (ex RE and REIT) 1 2 4 0.3% 0.6%

www.ironmountain.com Selected metric definitions are available in the appendix
Year-to-Date Operating Performance
11
(1) Includes ~$7 million for the relocation of the Boston headquarters (2) Includes ~$15 million for data center construction
(3) Excludes certain costs and expenditures associated with the previous work of the Strategic Review Special Committee of the Company’s Board of directors and the company’s conversion to a REIT
(4) Based on incurred versus cash paid basis
YTD Results 3 % Growth
YTD 2013 YTD 2014 Reported
Impact of FX Rate
Changes and
Adjustments
Constant
Currency
Impact of
Acquisitions and
Dispositions
Internal
Growth
NA Records and Information Management
Storage Revenue $525,869 $538,985 2.5% (0.7)% 3.2% (3.2)% (0.0)%
Service Revenue 359,836 359,418 (0.1)% (1.0)% 0.9% (2.9)% (2.0)%
Total Revenue $885,705 $898,403 1.4% (0.8)% 2.2% (3.0)% (0.8)%
Adjusted OIBDA 331,894 340,736
Adjusted OIBDA Margin % 37.5% 37.9%
CapEx % (ex RE and REIT) 4 4.6% 4.1%
NA Data Management
Storage Revenue $121,014 $122,174 1.0% (0.5)% 1.5% (0.5)% 1.0%
Service Revenue 77,293 72,101 (6.7)% (0.6)% (6.1)% (0.7)% (6.8)%
Total Revenue $198,307 $194,275 (2.0)% (0.5)% (1.5)% (0.5)% (2.0)%
Adjusted OIBDA 119,498 113,288
Adjusted OIBDA Margin % 60.3% 58.3%
CapEx % (ex RE and REIT) 4 4.7% 4.1%
International
Storage Revenue $230,889 $258,897 12.1% (1.3)% 13.4% (8.0)% 5.4%
Service Revenue 179,367 199,123 11.0% (1.2)% 12.2% (9.8)% 2.4%
Total Revenue $410,256 $458,020 11.6% (1.3)% 12.9% (8.8)% 4.1%
Adjusted OIBDA 100,807 114,467
Adjusted OIBDA Margin % 24.6% 25.0%
CapEx % (ex RE and REIT) 4 7.2% 8.3%
Corporate and Other
Storage Revenue $6,268 $5,722 (8.7)% 0.0% (8.7)% 0.0% (8.7)%
Service Revenue 566 598 5.7% 0.0% 5.7% 0.0% 5.7%
Total Revenue $6,834 $6,320 (7.5)% 0.0% (7.5)% 0.0% (7.5)%
Adjusted OIBDA (92,703) (98,118)
CapEx % (ex RE and REIT) 1 2 4 0.4% 0.7%
www.ironmountain.com Selected metric definitions are available in the appendix
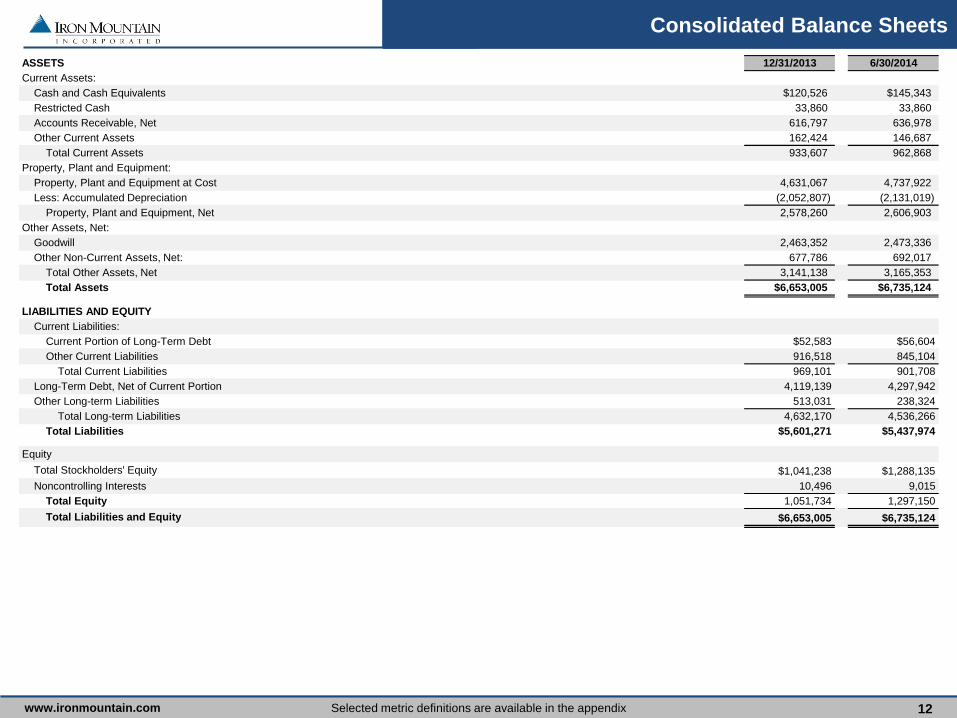
Consolidated Balance Sheets
12
ASSETS 12/31/2013 6/30/2014
Current Assets:
Cash and Cash Equivalents $120,526 $145,343
Restricted Cash 33,860 33,860
Accounts Receivable, Net 616,797 636,978
Other Current Assets 162,424 146,687
Total Current Assets 933,607 962,868
Property, Plant and Equipment:
Property, Plant and Equipment at Cost 4,631,067 4,737,922
Less: Accumulated Depreciation (2,052,807) (2,131,019)
Property, Plant and Equipment, Net 2,578,260 2,606,903
Other Assets, Net:
Goodwill 2,463,352 2,473,336
Other Non-Current Assets, Net: 677,786 692,017
Total Other Assets, Net 3,141,138 3,165,353
Total Assets $6,653,005 $6,735,124
LIABILITIES AND EQUITY
Current Liabilities:
Current Portion of Long-Term Debt $52,583 $56,604
Other Current Liabilities 916,518 845,104
Total Current Liabilities 969,101 901,708
Long-Term Debt, Net of Current Portion 4,119,139 4,297,942
Other Long-term Liabilities 513,031 238,324
Total Long-term Liabilities 4,632,170 4,536,266
Total Liabilities $5,601,271 $5,437,974
Equity
Total Stockholders' Equity $1,041,238 $1,288,135
Noncontrolling Interests 10,496 9,015
Total Equity 1,051,734 1,297,150
Total Liabilities and Equity $6,653,005 $6,735,124
www.ironmountain.com Selected metric definitions are available in the appendix
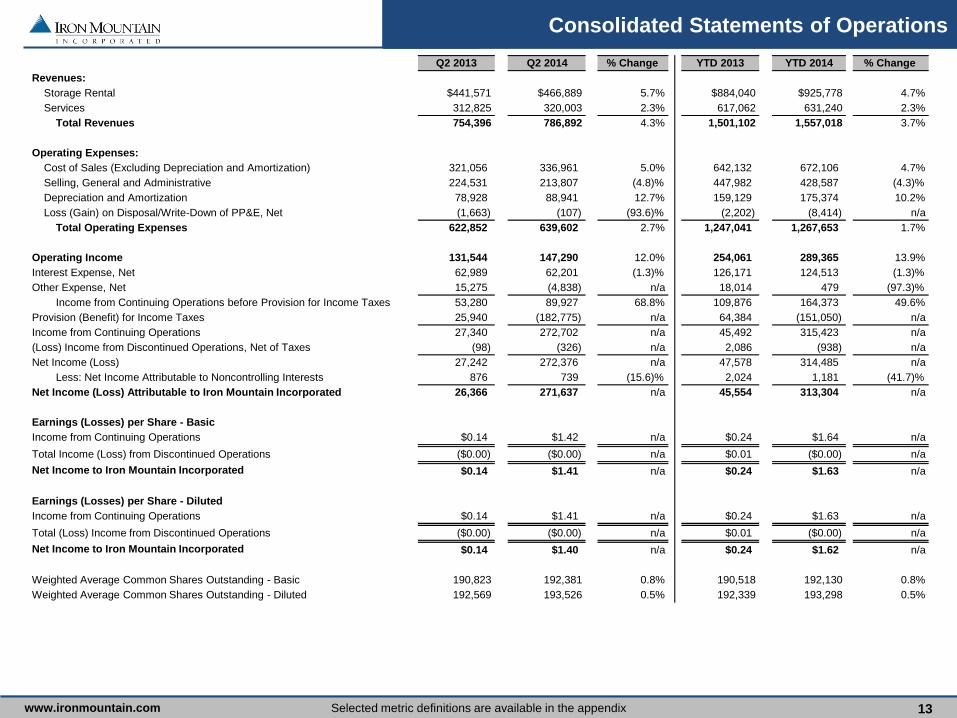
Consolidated Statements of Operations
13
Q2 2013 Q2 2014 % Change YTD 2013 YTD 2014 % Change
Revenues:
Storage Rental $441,571 $466,889 5.7% $884,040 $925,778 4.7%
Services 312,825 320,003 2.3% 617,062 631,240 2.3%
Total Revenues 754,396 786,892 4.3% 1,501,102 1,557,018 3.7%
Operating Expenses:
Cost of Sales (Excluding Depreciation and Amortization) 321,056 336,961 5.0% 642,132 672,106 4.7%
Selling, General and Administrative 224,531 213,807 (4.8)% 447,982 428,587 (4.3)%
Depreciation and Amortization 78,928 88,941 12.7% 159,129 175,374 10.2%
Loss (Gain) on Disposal/Write-Down of PP&E, Net (1,663) (107) (93.6)% (2,202) (8,414) n/a
Total Operating Expenses 622,852 639,602 2.7% 1,247,041 1,267,653 1.7%
Operating Income 131,544 147,290 12.0% 254,061 289,365 13.9%
Interest Expense, Net 62,989 62,201 (1.3)% 126,171 124,513 (1.3)%
Other Expense, Net 15,275 (4,838) n/a 18,014 479 (97.3)%
Income from Continuing Operations before Provision for Income Taxes 53,280 89,927 68.8% 109,876 164,373 49.6%
Provision (Benefit) for Income Taxes 25,940 (182,775) n/a 64,384 (151,050) n/a
Income from Continuing Operations 27,340 272,702 n/a 45,492 315,423 n/a
(Loss) Income from Discontinued Operations, Net of Taxes (98) (326) n/a 2,086 (938) n/a
Net Income (Loss) 27,242 272,376 n/a 47,578 314,485 n/a
Less: Net Income Attributable to Noncontrolling Interests 876 739 (15.6)% 2,024 1,181 (41.7)%
Net Income (Loss) Attributable to Iron Mountain Incorporated 26,366 271,637 n/a 45,554 313,304 n/a
Earnings (Losses) per Share - Basic
Income from Continuing Operations $0.14 $1.42 n/a $0.24 $1.64 n/a
Total Income (Loss) from Discontinued Operations ($0.00) ($0.00) n/a $0.01 ($0.00) n/a
Net Income to Iron Mountain Incorporated $0.14 $1.41 n/a $0.24 $1.63 n/a
Earnings (Losses) per Share - Diluted
Income from Continuing Operations $0.14 $1.41 n/a $0.24 $1.63 n/a
Total (Loss) Income from Discontinued Operations ($0.00) ($0.00) n/a $0.01 ($0.00) n/a
Net Income to Iron Mountain Incorporated $0.14 $1.40 n/a $0.24 $1.62 n/a
Weighted Average Common Shares Outstanding - Basic 190,823 192,381 0.8% 190,518 192,130 0.8%
Weighted Average Common Shares Outstanding - Diluted 192,569 193,526 0.5% 192,339 193,298 0.5%

www.ironmountain.com Selected metric definitions are available in the appendix 14
Reconciliation of Operating Income to Adjusted OIBDA
Q2 2013 Q2 2014 % Change YTD 2013 YTD 2014 % Change
Operating Income $131,544 $147,290 12.0% $254,061 $289,365 13.9%
Depreciation and Amortization 78,928 88,941 12.7% 159,129 175,374 10.2%
(Gain) Loss on Disposal/Write-Down of PP&E, Net (1,663) (107) (93.6)% (2,202) (8,414) n/a
REIT Costs 23,536 5,725 (75.7)% 48,508 14,048 (71.0)%
Adjusted OIBDA $232,345 $241,849 4.1% $459,496 $470,373 2.4%

www.ironmountain.com Selected metric definitions are available in the appendix 15
Reconciliation of Reported Earnings per Share to
Adjusted Earnings per Share1
Q2 2013 Q2 2014 % Change YTD 2013 YTD 2014 % Change
Reported EPS - FD from Continuing Operations $0.14 $1.41 n/a $0.24 $1.63 n/a
Add:
(Gain) Loss on Disposal/Write-Down of PP&E, Net (0.01) - (100.0)% (0.01) (0.04) n/a
REIT Costs 0.12 0.03 (75.0)% 0.25 0.07 (72.0)%
Other (Income) Expense, Net 0.08 (0.02) n/a 0.09 - (100.0)%
Tax Impact of Reconciling Items and Discrete Tax Items 0.06 (1.01) n/a 0.20 (0.91) n/a
Adjusted EPS - FD from Continuing Operations $0.39 $0.41 5.1% $0.77 $0.75 (2.6)%
(1) The Adjusted EPS for the three and six months ended June 30, 2013 has been restated to reflect a structural tax rate of approximately 15%. The Adjusted EPS for the three and six months ended June 30, 2014
reflects a structural tax rate of approximately 15%.

www.ironmountain.com Selected metric definitions are available in the appendix 16
Reconciliation of Free Cash Flows Before Acquisitions
and Discretionary Items to Operating Cash Flow Q2 2013 Q2 2014 % Change YTD 2013 YTD 2014 % Change
Cash Flows from Operating Activities from Continuing Operations $107,213 $139,960 30.5% $212,948 $195,601 (8.1)%
Less:
Capital Expenditures, net 1 58,833 80,670 37.1% 154,186 170,438 10.5%
Additions to Customer Acquisitions Costs 3,625 9,052 n/a 8,261 17,210 108.3%
Add:
Real Estate Capital Expenditures 2 7,887 33,907 n/a 27,892 48,551 74.1%
REIT Cash Taxes 27,500 21,000 (23.6)% 27,500 21,000 (23.6)%
REIT Conversion Costs, net of tax 15,759 6,455 (59.0)% 33,707 11,857 (64.8)%
REIT Conversion Capital Expenditures 8,166 1,380 (83.1)% 14,334 3,536 (75.3)%
FCF Before Acquisitions and Discretionary Items $104,067 $112,980 8.6% $153,934 $92,897 (39.7)%
(1) Includes racking additions
(2) This measure refers to IRM’s historical presentation of real estate, which included real estate purchases and Data Centers, but excluded racking. This reconciliation will be eliminated over time as we
transition to REIT specific cash flow measures of FFO (normalized) and AFFO.
(3) Tax payments related to D&A recapture
3
www.ironmountain.com Selected metric definitions are available in the appendix 17
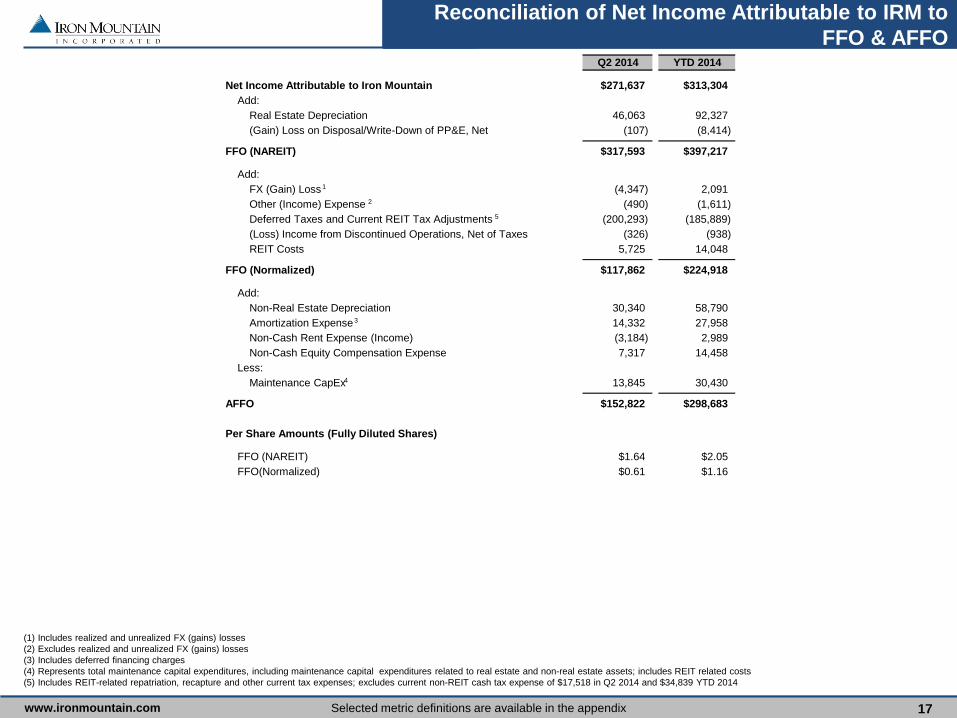
Reconciliation of Net Income Attributable to IRM to
FFO & AFFO
(1) Includes realized and unrealized FX (gains) losses
(2) Excludes realized and unrealized FX (gains) losses
(3) Includes deferred financing charges
(4) Represents total maintenance capital expenditures, including maintenance capital expenditures related to real estate and non-real estate assets; includes REIT related costs
(5) Includes REIT-related repatriation, recapture and other current tax expenses; excludes current non-REIT cash tax expense of $17,518 in Q2 2014 and $34,839 YTD 2014
Q2 2014 YTD 2014
Net Income Attributable to Iron Mountain $271,637 $313,304
Add:
Real Estate Depreciation 46,063 92,327
(Gain) Loss on Disposal/Write-Down of PP&E, Net (107) (8,414)
FFO (NAREIT) $317,593 $397,217
Add:
FX (Gain) Loss 1 (4,347) 2,091
Other (Income) Expense 2 (490) (1,611)
Deferred Taxes and Current REIT Tax Adjustments 5 (200,293) (185,889)
(Loss) Income from Discontinued Operations, Net of Taxes (326) (938)
REIT Costs 5,725 14,048
FFO (Normalized) $117,862 $224,918
Add:
Non-Real Estate Depreciation 30,340 58,790
Amortization Expense 3 14,332 27,958
Non-Cash Rent Expense (Income) (3,184) 2,989
Non-Cash Equity Compensation Expense 7,317 14,458
Less:
Maintenance CapEx 4 13,845 30,430
AFFO $152,822 $298,683
Per Share Amounts (Fully Diluted Shares)
FFO (NAREIT) $1.64 $2.05
FFO(Normalized) $0.61 $1.16

www.ironmountain.com Selected metric definitions are available in the appendix 18
Storage Net Operating Income (NOI)
(1) Includes Fulfillment Services, Document Management Services, Intellectual Property Management, Data Center and Entertainment Services
(2) Includes Building Maintenance, Property Taxes, Utilities and Insurance costs
(3) Refer to ‘Components of Value’ and Appendix for overhead allocations and definitions
Effective July 1, 2013, in preparation for electing REIT status we established TRS service entities in each our identified REIT countries,
which included transferring the designation of employees who perform services in our warehouses and were previously categorized as
storage-related. The transfer of these employees in REIT countries resulted in a shift of labor expenses previously categorized as storage
rental labor to services labor. We expect to transfer additional storage rental labor costs in the future as we establish TRS service entities in
future REIT countries.
Q2 2014 YTD 2014
Revenue from Storage Rental Activities
Records Management $373,098 $740,127
Data Protection 75,134 149,037
Other 1 18,657 36,614
Total Storage Rental 466,889 925,778
Terminations/Permanent Withdrawal Fees 5,564 10,861
Total Revenue from Storage Rental Activities $472,453 $936,639
Less: Storage Rental Costs
Facility Costs 2 100,790 208,629
Less: Storage Rent 52,132 102,228
Adjusted Facility Costs 48,658 106,401
Storage Rental Labor 1,367 3,338
Other Storage Rental Costs 4,024 7,652
Allocated Overhead 3 35,743 70,767
Total Storage Rental Costs $89,792 $188,158
Storage Net Operating Income $382,661 $748,481
Storage Net Operating Income Margin 81.0% 79.9%

www.ironmountain.com Selected metric definitions are available in the appendix
Global Real Estate Portfolio1
19
(1) Includes all real estate held in joint ventures
(2) Adjustments to previous quarter close based on refinements to real estate basis, reclass of multiple adjoining facilities into single buildings
As of 3/31/14 Adjusted 2
Total
Buildings Sq. Ft. Buildings Sq. Ft. Buildings Sq. Ft.
North America 175 19,395 503 30,970 678 50,365
Europe 48 2,412 202 7,465 250 9,877
Latin America 26 1,436 67 3,378 93 4,814
Asia Pacific 2 51 69 2,200 71 2,252
International 76 3,900 338 13,043 414 16,943
Total 251 23,294 841 44,013 1,092 67,307
Q2 2014 Additions & Expansions
Total
Buildings Sq. Ft. Buildings Sq. Ft. Buildings Sq. Ft.
North America 1 222 1 5 2 227
Europe - - 10 180 10 180
Latin America - - 3 329 3 329
Asia Pacific - - 3 5 3 5
International - - 16 515 16 515
Total 1 222 17 520 18 742
Q2 2014 Dispositions & Move Outs
Total
Buildings Sq. Ft. Buildings Sq. Ft. Buildings Sq. Ft.
North America - - (11) (449) (11) (449)
Europe - - (2) (12) (2) (12)
Latin America - - - - - -
Asia Pacific - - (2) (0) (2) (0)
International - - (4) (12) (4) (12)
Total - - (15) (461) (15) (461)
As of 6/30/14
Total
Buildings Sq. Ft. Buildings Sq. Ft. Buildings Sq. Ft.
North America 176 19,617 493 30,526 669 50,143
Europe 48 2,412 210 7,633 258 10,045
Latin America 26 1,436 70 3,707 96 5,143
Asia Pacific 2 51 70 2,205 72 2,256
International 76 3,900 350 13,545 426 17,445
Total 252 23,516 843 44,071 1,095 67,588
Leased Facilities
Leased Facilities
Owned Facilities
Owned Facilities
Owned Facilities
Leased Facilities
Owned Facilities Leased Facilities

www.ironmountain.com Selected metric definitions are available in the appendix
Revenue from Rental Activities and
Storage NOI per Racked Square Foot
20
(1) Includes loading docks, unracked space, office space, common areas, as well as space in service-related facilities
(2) Excludes revenue / NOI associated with Intellectual Property Management, Fulfillment Services, Data Centers and Entertainment Services
Square Footage by Region
North
America Europe
Latin
America
Asia
Pacific Total
Records Management Racked Space 38,624 7,068 3,642 1,472 50,807
Data Protection Racked Space 723 125 44 27 919
Other 1 10,795 2,852 1,457 757 15,862
Total 50,143 10,045 5,143 2,256 67,588
Annualized Revenue from Rental Activities and Storage NOI per Racked Square Foot 2
Revenue NOI Revenue NOI
North America
Records Management $ per Sq Ft $26.95 $21.82 $26.87 $21.43
Data Protection $ per Sq Ft $318.93 $283.64 $318.07 $282.54
Europe $45.41 $37.31 $44.44 $36.32
Latin America $38.19 $33.20 $37.58 $32.99
Asia Pacific $36.00 $28.62 $34.77 $27.59
Total $34.66 $28.64 $34.38 $28.15
Q2 2014 Annualized YTD 2014 Annualized
As of Q2 2014

www.ironmountain.com Selected metric definitions are available in the appendix
Portfolio Utilization
Records Management Storage Portfolio (CuFt MM)
As of 6/30/14
14
30
75
15
39
85
80
60
40
20
0
400
Europe North America
381 368
+3.5%
+12.6%
+7.6%
+31.7%
Asia Pacific Latin America
16
43
93
19
48
110
0
50
100
450
Latin America Europe North America
449
417
Asia Pacific
Q2 2014 Total Potential Building Cap. Q2 2014 Total Installed Racking Cap.
Units Stored
Capacity
1
3
8
1
5
9
60
10
5
0
+1.1%
Latin America Europe North America
59 59
+80.4%
+11.2%
Asia Pacific
+40.4%
1
6
14
2
7
22
0
10
20
80
Asia Pacific Latin America Europe North America
79
70
Data Protection Storage Portfolio (DPUs MM)
As of 6/30/14
Q2 2013 Q3 2013 Q2 2014 Q4 2013 Q1 2014
(1) Iron Mountain operates its storage operations to achieve a maximum utilization of between 94% – 98% to achieve maximum operating efficiency
Utilization¹ 91% 85% 91% 77% 90% 82% 92% 79% 84% 75% 67% 43% 78% 70% 89% 54%
21
www.ironmountain.com Selected metric definitions are available in the appendix
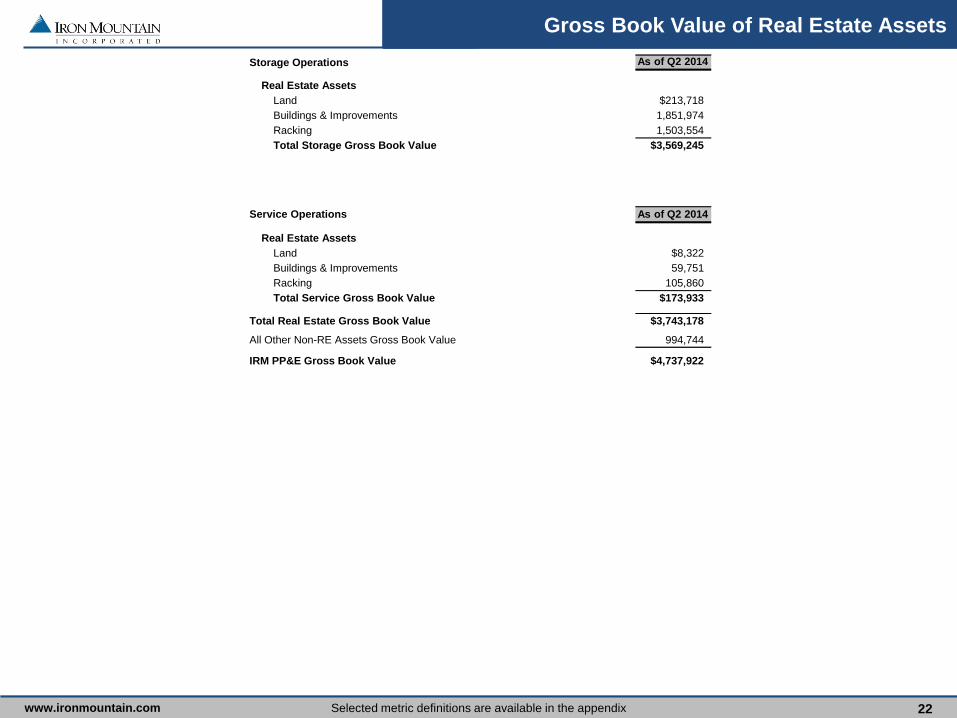
Gross Book Value of Real Estate Assets
22
Storage Operations
Real Estate Assets
Land $213,718
Buildings & Improvements 1,851,974
Racking 1,503,554
Total Storage Gross Book Value $3,569,245
Service Operations
Real Estate Assets
Land $8,322
Buildings & Improvements 59,751
Racking 105,860
Total Service Gross Book Value $173,933
Total Real Estate Gross Book Value $3,743,178
All Other Non-RE Assets Gross Book Value 994,744
IRM PP&E Gross Book Value $4,737,922
As of Q2 2014
As of Q2 2014
www.ironmountain.com Selected metric definitions are available in the appendix
Service Business Detail
23
(1) Includes Document Management Services, Consulting, Intellectual Property Management, Fulfillment Services, Data Center Services and Entertainment Services
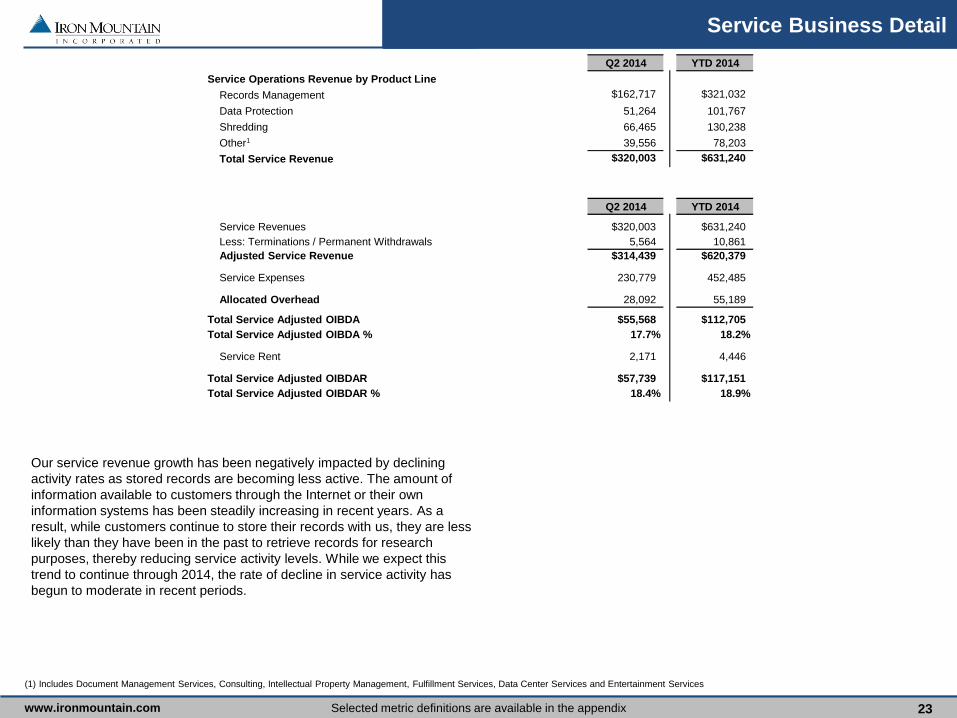
Our service revenue growth has been negatively impacted by declining
activity rates as stored records are becoming less active. The amount of
information available to customers through the Internet or their own
information systems has been steadily increasing in recent years. As a
result, while customers continue to store their records with us, they are less
likely than they have been in the past to retrieve records for research
purposes, thereby reducing service activity levels. While we expect this
trend to continue through 2014, the rate of decline in service activity has
begun to moderate in recent periods.
Q2 2014 YTD 2014
Service Operations Revenue by Product Line
Records Management $162,717 $321,032
Data Protection 51,264 101,767
Shredding 66,465 130,238
Other 1 39,556 78,203
Total Service Revenue $320,003 $631,240
Q2 2014 YTD 2014
Service Revenues $320,003 $631,240
Less: Terminations / Permanent Withdrawals 5,564 10,861
Adjusted Service Revenue $314,439 $620,379
Service Expenses 230,779 452,485
Allocated Overhead 28,092 55,189
Total Service Adjusted OIBDA $55,568 $112,705
Total Service Adjusted OIBDA % 17.7% 18.2%
Service Rent 2,171 4,446
Total Service Adjusted OIBDAR $57,739 $117,151
Total Service Adjusted OIBDAR % 18.4% 18.9%
www.ironmountain.com Selected metric definitions are available in the appendix
Customer Data
24
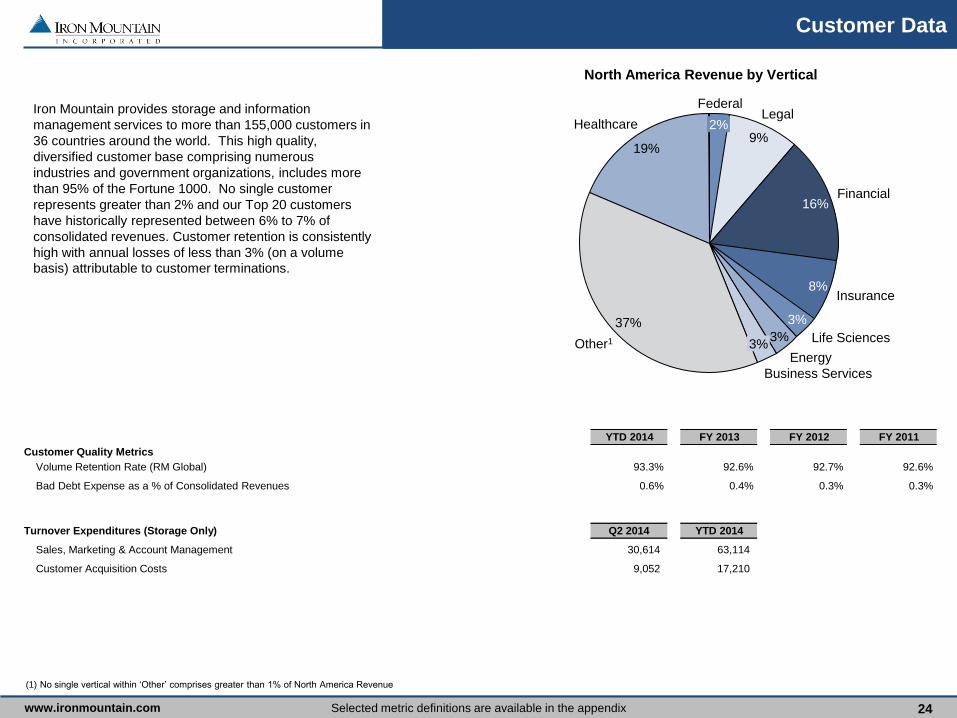
(1) No single vertical within ‘Other’ comprises greater than 1% of North America Revenue
Federal Legal
Financial
3% 37%
3%
Insurance
3%
Other1
8%
Healthcare
16%
Business Services
9%
Energy
2%
Life Sciences
19%
North America Revenue by Vertical
Iron Mountain provides storage and information
management services to more than 155,000 customers in
36 countries around the world. This high quality,
diversified customer base comprising numerous
industries and government organizations, includes more
than 95% of the Fortune 1000. No single customer
represents greater than 2% and our Top 20 customers
have historically represented between 6% to 7% of
consolidated revenues. Customer retention is consistently
high with annual losses of less than 3% (on a volume
basis) attributable to customer terminations.
YTD 2014 FY 2013 FY 2012 FY 2011
Customer Quality Metrics
Volume Retention Rate (RM Global) 93.3% 92.6% 92.7% 92.6%
Bad Debt Expense as a % of Consolidated Revenues 0.6% 0.4% 0.3% 0.3%
Turnover Expenditures (Storage Only) Q2 2014 YTD 2014
Sales, Marketing & Account Management 30,614 63,114
Customer Acquisition Costs 9,052 17,210
www.ironmountain.com Selected metric definitions are available in the appendix
Debt Schedule
25
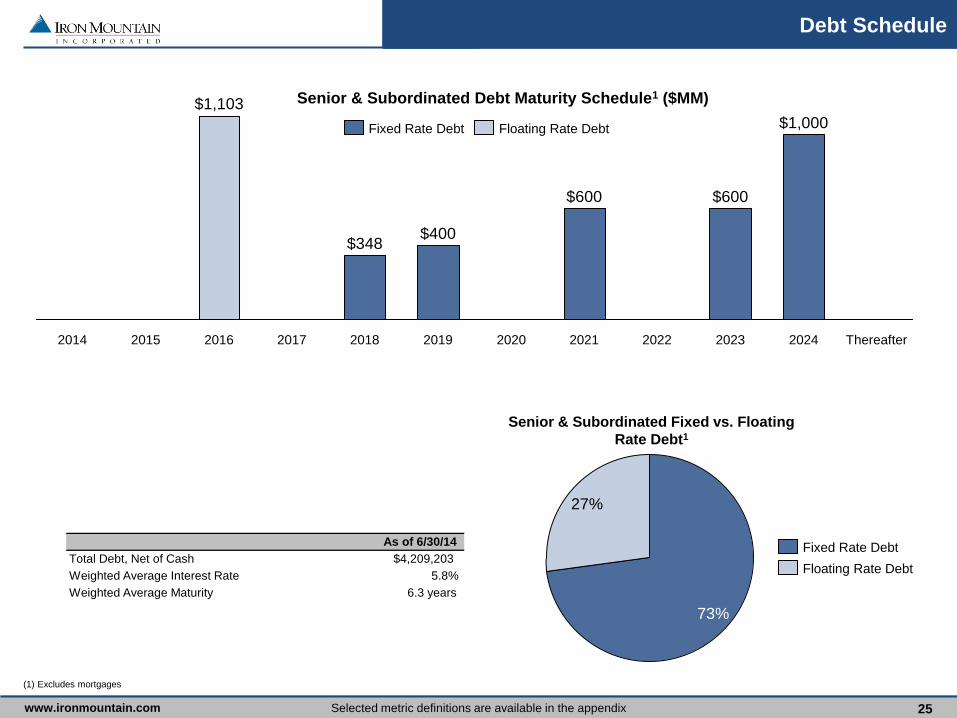
(1) Excludes mortgages
2024 2022
$600
Thereafter 2023
$1,000
2021
$600
2020 2019
$400
2018
$348
2017 2016
$1,103
2015 2014
Floating Rate Debt Fixed Rate Debt
27%
73%
Senior & Subordinated Fixed vs. Floating
Rate Debt1
Senior & Subordinated Debt Maturity Schedule1 ($MM)
Floating Rate Debt
Fixed Rate Debt Total Debt, Net of Cash $4,209,203
Weighted Average Interest Rate 5.8%
Weighted Average Maturity 6.3 years
As of 6/30/14
www.ironmountain.com Selected metric definitions are available in the appendix
Capitalization
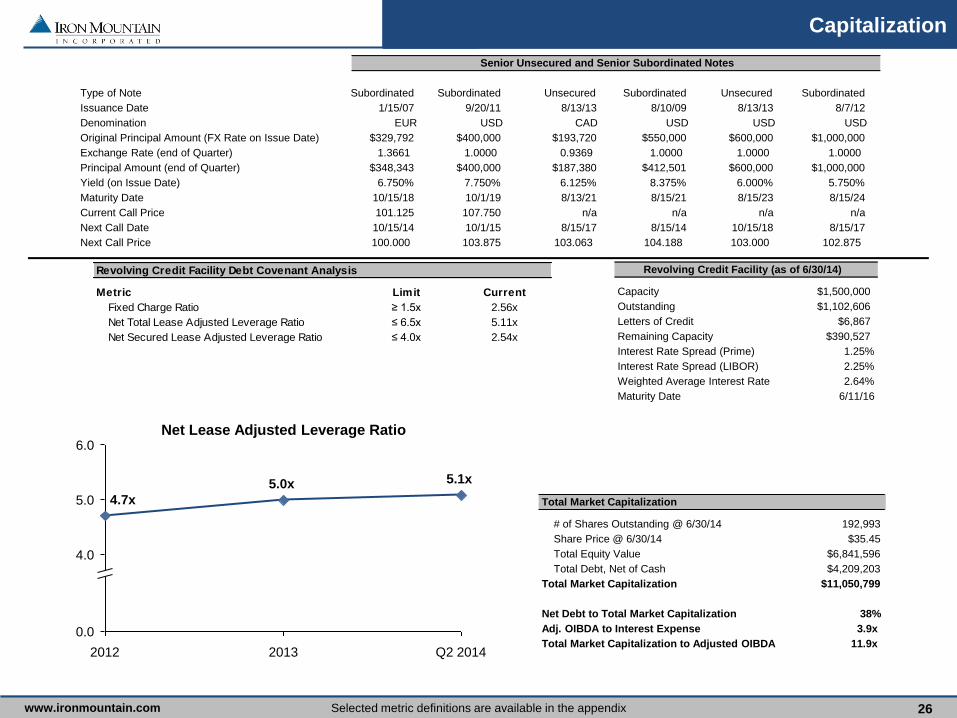
26
6.0
5.0
4.0
0.0
2012 Q2 2014
5.1x
2013
5.0x
4.7x
Net Lease Adjusted Leverage Ratio
Total Market Capitalization
# of Shares Outstanding @ 6/30/14 192,993
Share Price @ 6/30/14 $35.45
Total Equity Value $6,841,596
Total Debt, Net of Cash $4,209,203
Total Market Capitalization $11,050,799
Net Debt to Total Market Capitalization 38%
Adj. OIBDA to Interest Expense 3.9x
Total Market Capitalization to Adjusted OIBDA 11.9x
Revolving Credit Facility (as of 6/30/14)
Capacity $1,500,000
Outstanding $1,102,606
Letters of Credit $6,867
Remaining Capacity $390,527
Interest Rate Spread (Prime) 1.25%
Interest Rate Spread (LIBOR) 2.25%
Weighted Average Interest Rate 2.64%
Maturity Date 6/11/16
Senior Unsecured and Senior Subordinated Notes
Type of Note Subordinated Subordinated Unsecured Subordinated Unsecured Subordinated
Issuance Date 1/15/07 9/20/11 8/13/13 8/10/09 8/13/13 8/7/12
Denomination EUR USD CAD USD USD USD
Original Principal Amount (FX Rate on Issue Date) $329,792 $400,000 $193,720 $550,000 $600,000 $1,000,000
Exchange Rate (end of Quarter) 1.3661 1.0000 0.9369 1.0000 1.0000 1.0000
Principal Amount (end of Quarter) $348,343 $400,000 $187,380 $412,501 $600,000 $1,000,000
Yield (on Issue Date) 6.750% 7.750% 6.125% 8.375% 6.000% 5.750%
Maturity Date 10/15/18 10/1/19 8/13/21 8/15/21 8/15/23 8/15/24
Current Call Price 101.125 107.750 n/a n/a n/a n/a
Next Call Date 10/15/14 10/1/15 8/15/17 8/15/14 10/15/18 8/15/17
Next Call Price 100.000 103.875 103.063 104.188 103.000 102.875
Revolving Credit Facility Debt Covenant Analysis
Metric Limit Current
Fixed Charge Ratio ≥ 1.5x 2.56x
Net Total Lease Adjusted Leverage Ratio ≤ 6.5x 5.11x
Net Secured Lease Adjusted Leverage Ratio ≤ 4.0x 2.54x

www.ironmountain.com Selected metric definitions are available in the appendix
Lease Obligations1
(1) Includes capital and operating lease obligations
Weighted Average Remaining Lease Obligations (no exercise of extension options): 5.6 years
Weighted Average Remaining Lease Obligations (exercise of all extension options): 13.1 years
2025
1.6%
2024
2.6%
2023
5.5%
2022
4.1%
2021
8.2%
2020
5.5%
2019 Thereafter
8.5%
12.0%
2018
11.2%
2017
11.0%
2016
11.4%
2015
12.4%
2014
6.0%
2015
3.2%
2014
3.3%
2019 2018
3.2%
2025
4.4%
2020
3.6%
2021
2.4%
2022
1.8%
2023
4.0%
2024
2.7% 3.5%
2017 Thereafter
63.4%
1.9%
2016
2.5%
Assuming No Exercise of Extension Options
Facility Lease Expirations (% of total square feet subject to lease)
Assuming Exercise of All Extension Options
27
www.ironmountain.com Selected metric definitions are available in the appendix
Components of Value
28
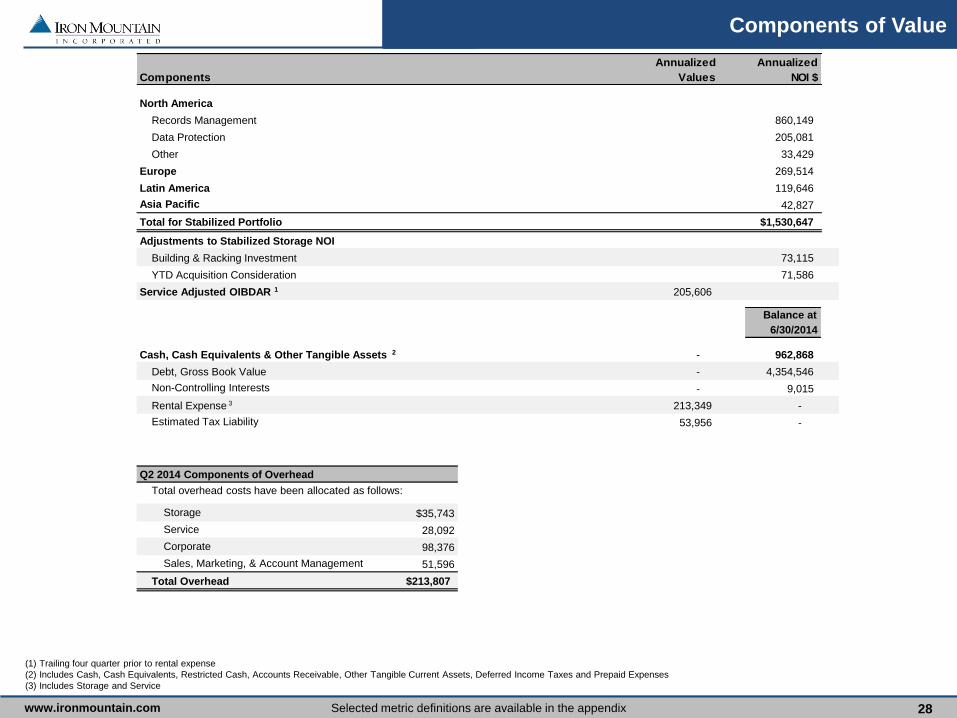
(1) Trailing four quarter prior to rental expense
(2) Includes Cash, Cash Equivalents, Restricted Cash, Accounts Receivable, Other Tangible Current Assets, Deferred Income Taxes and Prepaid Expenses
(3) Includes Storage and Service
North America
Records Management 860,149
Data Protection 205,081
Other 33,429
Europe 269,514
Latin America 119,646
Asia Pacific 42,827
Total for Stabilized Portfolio $1,530,647
Adjustments to Stabilized Storage NOI
Building & Racking Investment 73,115
YTD Acquisition Consideration 71,586
Service Adjusted OIBDAR 1 205,606
Balance at
6/30/2014
Cash, Cash Equivalents & Other Tangible Assets 2 - 962,868
Debt, Gross Book Value - 4,354,546
Non-Controlling Interests - 9,015
Rental Expense 3 213,349 -
Estimated Tax Liability 53,956 -
Q2 2014 Components of Overhead
Total overhead costs have been allocated as follows:
Storage $35,743
Service 28,092
Corporate 98,376
Sales, Marketing, & Account Management 51,596
Total Overhead $213,807
Components
Annualized
Values
Annualized
NOI $
www.ironmountain.com Selected metric definitions are available in the appendix
Appendix
29
Non-GAAP Measures
Non-GAAP measures are supplemental metrics designed to enhance our disclosure and to provide additional information that we believe to be
important for investors to consider when evaluating our financial performance. These non-GAAP measures should be considered in addition to, but not
as a substitute for, other measures of financial performance reported in accordance with accounting principles generally accepted in the Unites States of
America (“GAAP”), such as operating or net income (loss) or cash flows from operating activities from continuing operations (as determined in
accordance with GAAP).
Adjusted Operating Income Before Depreciation, Amortization, Intangible Impairments, and REIT Costs, or Adjusted OIBDA
Adjusted OIBDA is defined as operating income before depreciation, amortization, intangible impairments, (gain) loss on disposal/write-down of
property, plant and equipment, net, and REIT Costs. These measures are an integral part of the internal reporting system we use to assess and
evaluate the operating performance of our business. We use multiples of current or projected Adjusted OIBDA in conjunction with our discounted cash
flow models to determine our overall enterprise valuation and to evaluate acquisition targets. We believe Adjusted OIBDA provides our current and
potential investors with relevant and useful information regarding our ability to generate cash flow to support business investment.
Funds From Operations, or FFO (NAREIT), and FFO (Normalized)
FFO is a non-GAAP financial measure commonly used in the REIT industry. FFO is defined by the National Association of Real Estate Investment
Trusts (“NAREIT”) and us as net income excluding gains and losses on the sale or write-down of real estate assets plus depreciation on real estate
assets. FFO does not give effect to real estate depreciation and amortization because these amounts are computed, under GAAP, to allocate the cost of
a property over its useful life. Because values for well-maintained real estate assets have historically increased or decreased based upon prevailing
market conditions, we believe that FFO (Normalized) provides investors with a clearer view of our operating performance. Our most directly comparable
GAAP measure to FFO (Normalized) is net income attributable to Iron Mountain. Although NAREIT has published a definition of FFO, modifications to
the NAREIT calculation of FFO are common among REITs as companies seek to provide financial measures that most meaningfully reflect their
business. Our definition of FFO (Normalized) excludes other items that we believe do not appropriately reflect our underlying operations such as
intangible impairment charges, other income and expense (including foreign exchange gains and losses), income and losses from discontinued
operations, provision or benefit from deferred taxes and REIT Costs.
www.ironmountain.com Selected metric definitions are available in the appendix
Appendix
Non-GAAP Measures (continued)
Adjusted Funds From Operations, or AFFO
AFFO is defined as FFO (Normalized) excluding non-cash rent expense or income, plus depreciation on non-real estate assets, amortization expense
(including amortization of deferred financing costs) and non-cash equity compensation expense, less maintenance capital expenditures. We believe
AFFO is a useful measure in determining our ability to generate excess cash that may be used for reinvestment in the business, discretionary
deployment in investments such as real estate or acquisition opportunities, returning of capital to our stockholders and voluntary prepayments of
indebtedness.
Adjusted Earnings Per Share, or Adjusted EPS
Adjusted EPS is defined as reported earnings per share from continuing operations excluding: (1) (gain) loss on the disposal/write-down of property,
plant and equipment, net; (2) intangible impairments; (3) other (income) expense, net; (4) REIT Costs; and (5) the tax impact of reconciling items and
discrete tax items. We do not believe these excluded items to be indicative of our ongoing operating results, and they are not considered when we are
forecasting our future results. We believe Adjusted EPS is of value to our current and potential investors when comparing our results from past, present
and future periods.
Storage Net Operating Income, or Storage NOI
Storage NOI is defined as revenue from rental activities (storage rental revenue, termination fees and permanent withdrawal fees) less storage rental
costs. Storage rental costs include facility costs (excluding rent), storage rental labor, other storage costs and allocated overhead.
30
www.ironmountain.com Selected metric definitions are available in the appendix
Appendix
Definitions
Building Development Projects – The construction of new facilities, or three-wall additions, including all initial and future racking installations.
Business Segments
North American Records and Information Management Business (“RIM”) — Storage and information management services throughout the
United States and Canada, including the storage of paper documents, as well as other media such as microfilm and microfiche, master audio
and videotapes, film, X-rays and blueprints, including healthcare information services, vital records services, service and courier operations, and
the collection, handling and disposal of sensitive documents for corporate customers ("Records Management"); information destruction services
("Destruction"); Document Management Services; Fulfillment Services; and Intellectual Property Management.
North American Data Management Business (“DM”) — The storage and rotation of backup computer media as part of corporate disaster
recovery plans throughout the United States and Canada, including service and courier operations ("Data Protection & Recovery"); server and
computer backup services; digital content repository systems to house, distribute, and archive key media assets; and storage, safeguarding and
electronic or physical delivery of physical media of all types, primarily for entertainment and media industry clients.
International Business — Storage and information management services throughout Europe, Latin America and Asia Pacific, including
Records Management, Data Protection & Recovery, Destruction and DMS. Our European operations provide Records Management, Data
Protection & Recovery and DMS throughout Europe, and Destruction services are primarily provided in the United Kingdom and Ireland. Our
Latin America operations provide Records Management, Data Protection & Recovery, Destruction and DMS throughout Argentina, Brazil, Chile,
Colombia, Mexico and Peru. Our Asia Pacific operations provide Records Management, Data Protection & Recovery, Destruction and DMS
throughout Australia, with Records Management and Data Protection & Recovery services also provided in certain cities in India, Singapore,
Hong Kong-SAR and China.
Corporate and Other — Consists of our data center business in the United States, the primary product offering of our Emerging Businesses
segment, as well as costs related to executive and staff functions, including finance, human resources and information technology, which benefit
the enterprise as a whole. These costs are primarily related to the general management of these functions on a corporate level and the design
and development of programs, policies and procedures that are then implemented in the individual segments, with each segment bearing its
own cost of implementation. Corporate and Other also includes non-cash equity compensation expense associated with all employee stock-
based awards.
31
www.ironmountain.com Selected metric definitions are available in the appendix
Appendix
32
Definitions (continued)
Capacity Measures
Building Capacity – The maximum number of cubic feet of records or standard DPUs that can be stored in a given facility.
Building Capacity Utilization – The number of cubic feet of records or standard DPUs in storage divided by the Building Capacity.
Installed Racking Capacity – The storage capacity of the racking installed in a given facility. Capacity is generally measured in cubic feet or
standard DPUs.
Installed Racking Capacity Utilization – The number of cubic feet of records or standard DPUs in storage divided by the Installed Racking
Capacity.
Capital Expenditures – Our business requires significant capital expenditures to support our expected storage rental revenue and service revenue
growth and ongoing operations, new products and services and increased profitability. Every year we expend capital to support a number of different
objectives. The majority of our capital goes to support business line growth and our ongoing operations. Additionally, we invest capital to acquire or
construct real estate. We also expend capital to support the development and improvement of products and services and projects designed to increase
our profitability. These expenditures are generally relatively small and discretionary in nature. We categorize our capital expenditures as follows:
Real Estate – These capital expenditures include land, buildings (purchased or constructed), building and leasehold improvements, and racking
structure systems.
Maintenance – These capital expenditures include major repairs to and/or the replacement of existing assets. These expenditures are
associated with either Real Estate Assets (as described above) or Non-Real Estate Assets (all other capital assets). Non-Real Estate Assets
are primarily associated with our service operations.
Other – Other includes all other capital expenditures not classified as Real Estate or Maintenance capital expenditures.
Change in Average Monthly Price per Cubic Foot – Calculated as percent change in average price, where:
Average Price = Total Storage Billings / Total Cubic Feet Stored
www.ironmountain.com Selected metric definitions are available in the appendix
Appendix
33
Definitions (continued)
Components of Overhead
Allocated Overhead – Includes overhead expenses directly associated with storage and service business operations allocated as follows:
Field Operation Costs – Allocated to storage and service operations based on percent of revenue.
Bad Debt Expenses – Allocated to storage and service operations based on percent of revenue.
Transportation Costs – Allocated fully to service operations.
Corporate Overhead – Includes all other overhead expenses associated with business support functions, including Executive, Legal,
RE/Facilities, Accounting, Financial Performance & Analysis, Treasury, Tax, Internal Audit, M&A, Security, Procurement, HR, REIT, Other G&A,
Integration Costs, IT, Product Engineering and Product Management.
Customer Turnover Overhead – Overhead associated with customer acquisition and retention including Sales, Marketing and Account
Management expenses.
Constant Dollar Growth (C$) – The year-over-year growth rate excluding the impact of changes to foreign currency exchange rates.
Customer Volume Retention Rate – One minus the result of dividing the total number of cubic feet of records removed from inventory due to customer
terminations in a one-year period by the total number of cubic feet of records in storage at the beginning of the period.
Destruction Rate – Calculated by dividing the total number of cubic feet of records removed from inventory due to destructions in a one-year period
divided by the total number of cubic feet of records in storage at the beginning of the period.
DPUs – Data protection units, a unit of measurement specific to our Data Protection storage services.
Free Cash Flow – Defined as Cash Flows from Operating Activities from continuing operations less capital expenditures (excluding real estate and
capital expenditures associated with the REIT conversion), net of proceeds from the sales of property and equipment and other, net, and additions to
customer relationship and acquisition costs. REIT Costs are also excluded from FCF.
Incremental Racking Structure Installations – Racking structures that are installed, sometimes in phases, in facilities we owned or operated prior to
January 1, 2014, the effective date of our conversion to a REIT.
Internal Revenue Growth – Internal revenue growth represents the year-over-year growth rate of revenues excluding the impacts of changes to foreign
currency exchange rates, acquisitions and other unusual items. In general, only acquisitions that have been in our results for the full calendar year prior
to the quarter of measurement are included in internal revenue growth.
www.ironmountain.com Selected metric definitions are available in the appendix
Appendix
34
Definitions (continued)
Lease Adjusted Leverage Ratio – The calculation for this ratio is EBITDA + Rent Expense divided by net debt including the capitalized value of lease
obligations.
Net Volume Growth – New records management storage volume from existing customers, plus volume from new customers and volume from
acquisitions, offset by volume related to destructions, permanent withdrawals and customer terminations. Quarterly percentages are calculated by
dividing the trailing four quarters’ total activity by the ending balance of the same prior-year period.
Non-Cash Rent Expense – Calculated as rent expense less cash paid for rent.
Permanent Withdrawal Rate – This rate is calculated by dividing the total number of cubic feet of records removed from inventory due to permanent
withdrawals in a one-year period divided by the total number of cubic feet of records in storage at the beginning of the period. Permanent withdrawals
occur when records are permanently removed from inventory by customers for reasons other than the customer terminating its relationship.
REIT Costs – Includes costs associated with our 2011 proxy contest, the previous work of the former Strategic Review Special Committee of the board
of directors and upfront operating and capital expenses associated with the Company’s conversion to a REIT.
Regional NOI / CF or DPU – The average expected NOI for a specific region (NA, Europe, Lat Am, Asia Pac) and product (Records Management or
Data Protection).
Stabilized Storage NOI – The projected Storage NOI of a facility once the facility has attained 85% capacity utilization.
Storage Net Operating Income, or Storage NOI – Storage NOI is defined as revenue from rental activities (storage rental revenue, termination fees
and permanent withdrawal fees) less storage rental costs. Storage rental costs include facility costs (excluding rent), storage rental labor, other storage
costs and allocated overhead.
Tangible Assets – Includes PP&E, cash and cash equivalents, restricted cash, accounts receivable, deferred income taxes, and prepaid expenses.


