
Q2FY18 Financial
Results Presentation
For the quarter ended 30 Sep 2017
Chua Sock Koong, Group CEO
9 November 2017

2
Forward looking statement – Important note
The following presentation contains forward looking statements by the management of
Singapore Telecommunications Limited ("Singtel"), relating to financial trends for future
periods, compared to the results for previous periods.
Some of the statements contained in this presentation that are not historical facts are
statements of future expectations with respect to the financial conditions, results of
operations and businesses, and related plans and objectives. Forward looking information
is based on management's current views and assumptions including, but not limited to,
prevailing economic and market conditions. These statements involve known and unknown
risks and uncertainties that could cause actual results, performance or events to differ
materially from those in the statements as originally made. Such statements are not, and
should not be construed as a representation as to future performance of Singtel. In
particular, such targets should not be regarded as a forecast or projection of future
performance of Singtel. It should be noted that the actual performance of Singtel may vary
significantly from such targets.
“S$” means Singapore dollars, "A$" means Australian dollars and “US$” means United
States dollars unless otherwise indicated. Any discrepancies between individual amounts
and totals are due to rounding.

Agenda
Overview
Business Units
Supplementary Information
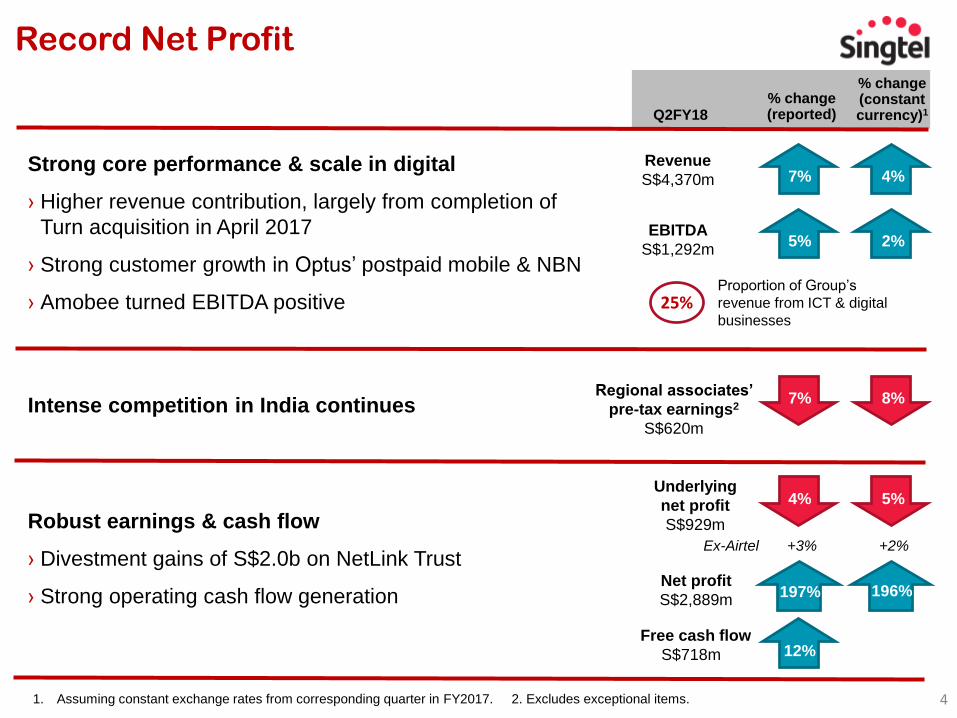
Record Net Profit
41. Assuming constant exchange rates from corresponding quarter in FY2017. 2. Excludes exceptional items.
Strong core performance & scale in digital
› Higher revenue contribution, largely from completion of
Turn acquisition in April 2017
› Strong customer growth in Optus’ postpaid mobile & NBN
› Amobee turned EBITDA positive
Intense competition in India continues
Robust earnings & cash flow
› Divestment gains of S$2.0b on NetLink Trust
› Strong operating cash flow generation
Revenue
S$4,370m
EBITDA
S$1,292m
Regional associates’
pre-tax earnings2
S$620m
Underlying
net profit
S$929m
Free cash flow
S$718m
% change (reported)
% change (constant currency)1Q2FY18
7%
Proportion of Group’s
revenue from ICT & digital
businesses25%
4%
5% 2%
7% 8%
4% 5%
197%Net profit
S$2,889m
12%
+3% +2%Ex-Airtel
196%
5
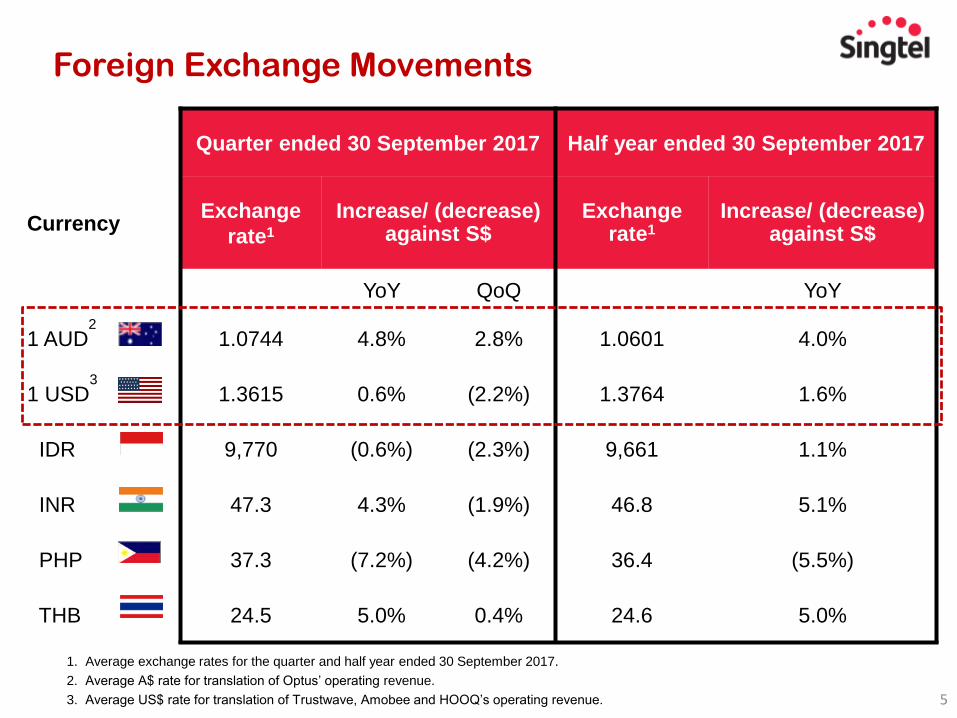
Quarter ended 30 September 2017 Half year ended 30 September 2017
CurrencyExchange
rate1
Increase/ (decrease)against S$
Exchange rate1
Increase/ (decrease)against S$
YoY QoQ YoY
1 AUD2
1.0744 4.8% 2.8% 1.0601 4.0%
1 USD3
1.3615 0.6% (2.2%) 1.3764 1.6%
IDR 9,770 (0.6%) (2.3%) 9,661 1.1%
INR 47.3 4.3% (1.9%) 46.8 5.1%
PHP 37.3 (7.2%) (4.2%) 36.4 (5.5%)
THB 24.5 5.0% 0.4% 24.6 5.0%
1. Average exchange rates for the quarter and half year ended 30 September 2017.
2. Average A$ rate for translation of Optus’ operating revenue.
3. Average US$ rate for translation of Trustwave, Amobee and HOOQ’s operating revenue.
Foreign Exchange Movements
6
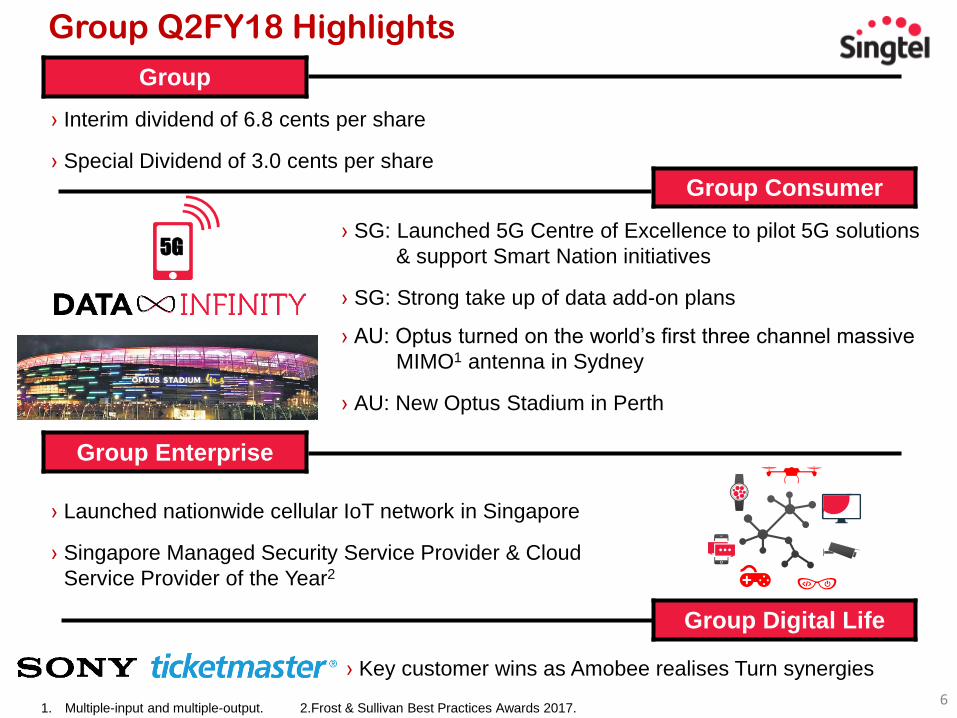
› Interim dividend of 6.8 cents per share
› Special Dividend of 3.0 cents per share
Group Q2FY18 Highlights
› Launched nationwide cellular IoT network in Singapore
› Singapore Managed Security Service Provider & Cloud
Service Provider of the Year2
› SG: Launched 5G Centre of Excellence to pilot 5G solutions
& support Smart Nation initiatives
› SG: Strong take up of data add-on plans
› AU: Optus turned on the world’s first three channel massive
MIMO1 antenna in Sydney
› AU: New Optus Stadium in Perth
Group
Group Consumer
Group Enterprise
Group Digital Life
› Key customer wins as Amobee realises Turn synergies
1. Multiple-input and multiple-output. 2.Frost & Sullivan Best Practices Awards 2017.
5G

7
3 months to 6 months to
Sep 17 Sep 161 YoY % Sep 17 Sep 161 YoY %
Operating revenue 4,370 4,086 6.9% 8,602 7,994 7.6%
EBITDA 1,292 1,233 4.8% 2,561 2,469 3.7%
- margin 29.6% 30.2% 29.8% 30.9%
Associates pre-tax earnings2 648 725 (10.6%) 1,382 1,478 (6.5%)
EBITDA & share of associates’
pre-tax earnings1,951 1,958 (0.4%) 3,950 3,947 0.1%
Depreciation & amortisation (599) (549) 9.2% (1,171) (1,092) 7.2%
Net finance expense (91) (71) 27.9% (179) (136) 31.3%
Profit before EI and tax 1,261 1,338 (5.8%) 2,600 2,719 (4.4%)
Tax (337) (374) (9.7%) (773) (815) (5.2%)
Underlying net profit 929 969 (4.1%) 1,839 1,912 (3.8%)
Exceptional Items (post tax) 1,960 3 N.M. 1,942 5 N.M.
Net profit 2,889 972 197.1% 3,781 1,917 97.3%
1. Restated to reclassify AIS’ 3G/4G handset subsidy costs from exceptional items of the Singtel Group to share of associates’ results to be
consistent with the current periods.
2. Excluding exceptional items. N.M. – not meaningful.
H1FY18: Record Net Profit
8
Gro
up
fre
e c
ash
flo
w (
S$
m)
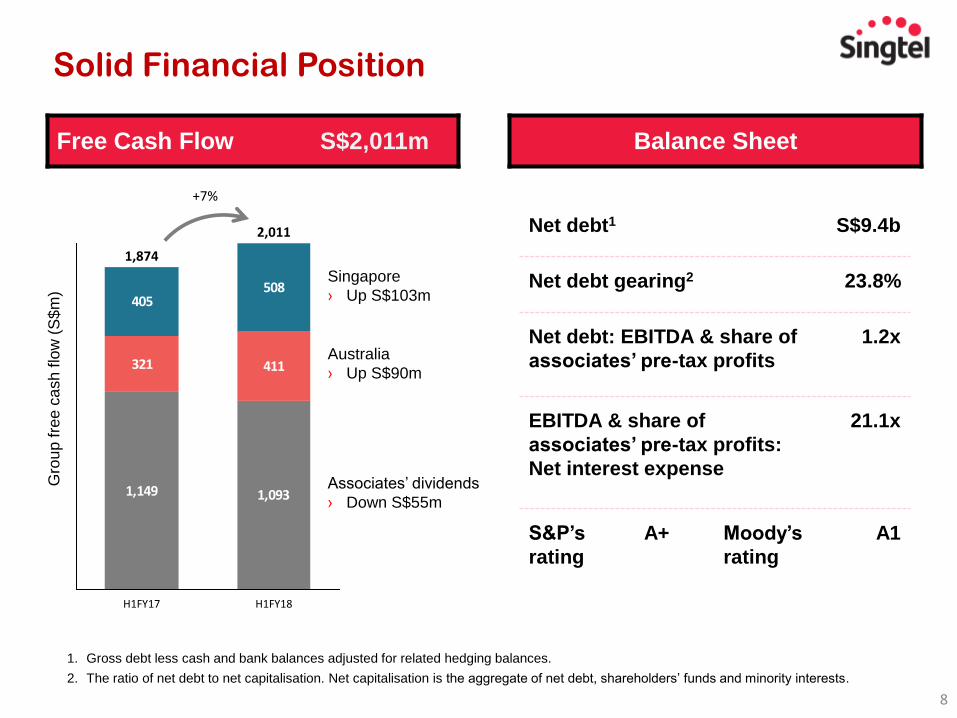
Singapore
› Up S$103m
+7%
Associates’ dividends
› Down S$55m
1. Gross debt less cash and bank balances adjusted for related hedging balances.
2. The ratio of net debt to net capitalisation. Net capitalisation is the aggregate of net debt, shareholders’ funds and minority interests.
Australia
› Up S$90m
Net debt1 S$9.4b
Net debt gearing2 23.8%
Net debt: EBITDA & share of
associates’ pre-tax profits
1.2x
EBITDA & share of
associates’ pre-tax profits:
Net interest expense
21.1x
S&P’s
rating
A+ Moody’s
rating
A1
Solid Financial Position
Free Cash Flow S$2,011m Balance Sheet
1,149 1,093
321 411
405508
H1FY17
1,874
H1FY18
2,011

Agenda
Overview
Business Units
Supplementary Information
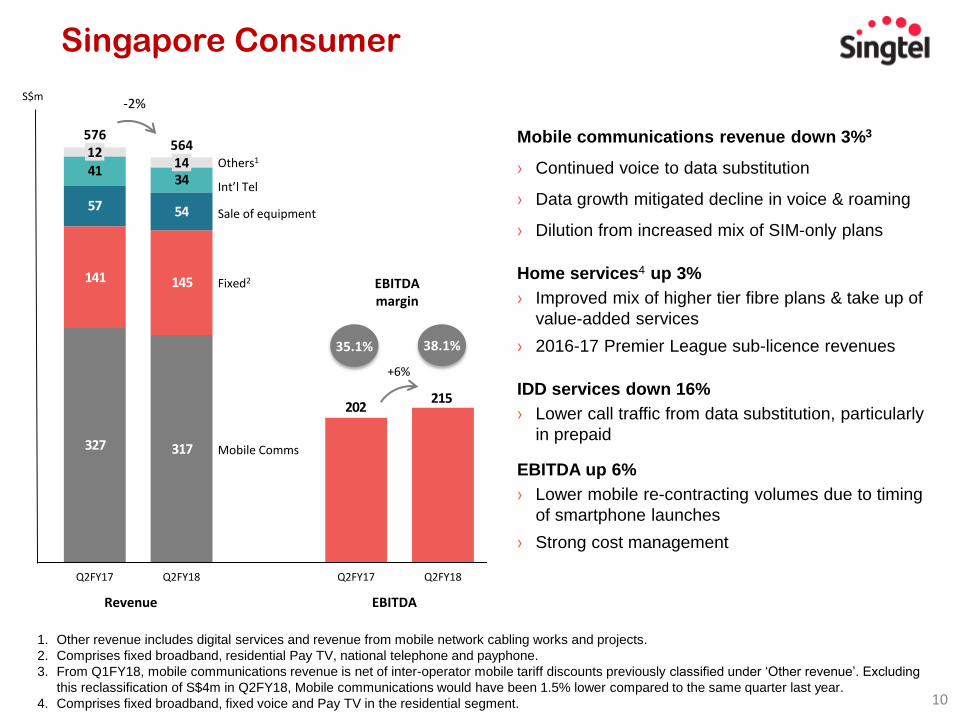
317327
145141
5457
3441
215202
Q2FY18
564
Q2FY18 Q2FY17Q2FY17
576
1412
10
Revenue
S$m
Mobile communications revenue down 3%3
› Continued voice to data substitution
› Data growth mitigated decline in voice & roaming
› Dilution from increased mix of SIM-only plans
Home services4 up 3%
› Improved mix of higher tier fibre plans & take up of
value-added services
› 2016-17 Premier League sub-licence revenues
IDD services down 16%
› Lower call traffic from data substitution, particularly
in prepaid
EBITDA up 6%
› Lower mobile re-contracting volumes due to timing
of smartphone launches
› Strong cost management
1. Other revenue includes digital services and revenue from mobile network cabling works and projects.
2. Comprises fixed broadband, residential Pay TV, national telephone and payphone.
3. From Q1FY18, mobile communications revenue is net of inter-operator mobile tariff discounts previously classified under ‘Other revenue’. Excluding
this reclassification of S$4m in Q2FY18, Mobile communications would have been 1.5% lower compared to the same quarter last year.
4. Comprises fixed broadband, fixed voice and Pay TV in the residential segment.
-2%
EBITDA
38.1%
Singapore Consumer
Mobile Comms
Fixed2
Int’l Tel
Sale of equipment
+6%
35.1%
EBITDA margin
Others1
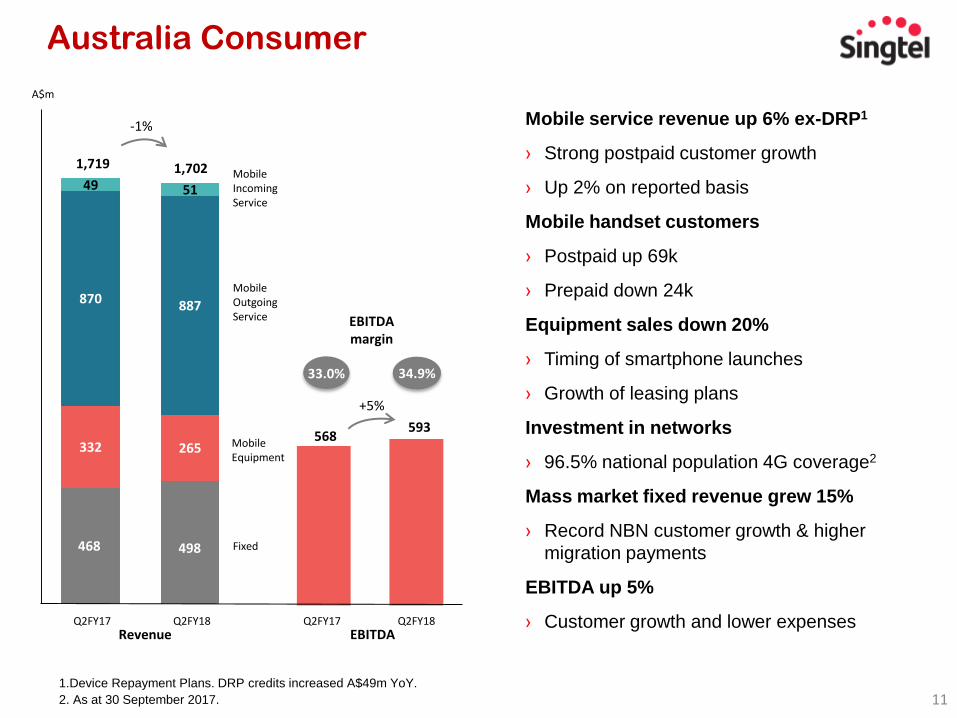
468 498
332 265
870 887
49 51
Fixed
Mobile Equipment
1,7021,719
Mobile Outgoing Service
Mobile Incoming Service
-1%
11
Australia Consumer
568 593
A$m
Mobile service revenue up 6% ex-DRP1
› Strong postpaid customer growth
› Up 2% on reported basis
Mobile handset customers
› Postpaid up 69k
› Prepaid down 24k
Equipment sales down 20%
› Timing of smartphone launches
› Growth of leasing plans
Investment in networks
› 96.5% national population 4G coverage2
Mass market fixed revenue grew 15%
› Record NBN customer growth & higher
migration payments
EBITDA up 5%
› Customer growth and lower expenses
1.Device Repayment Plans. DRP credits increased A$49m YoY.
2. As at 30 September 2017.
Q2FY17 Q2FY18 Q2FY17 Q2FY18EBITDARevenue
+5%
34.9%
EBITDA margin
33.0%
12
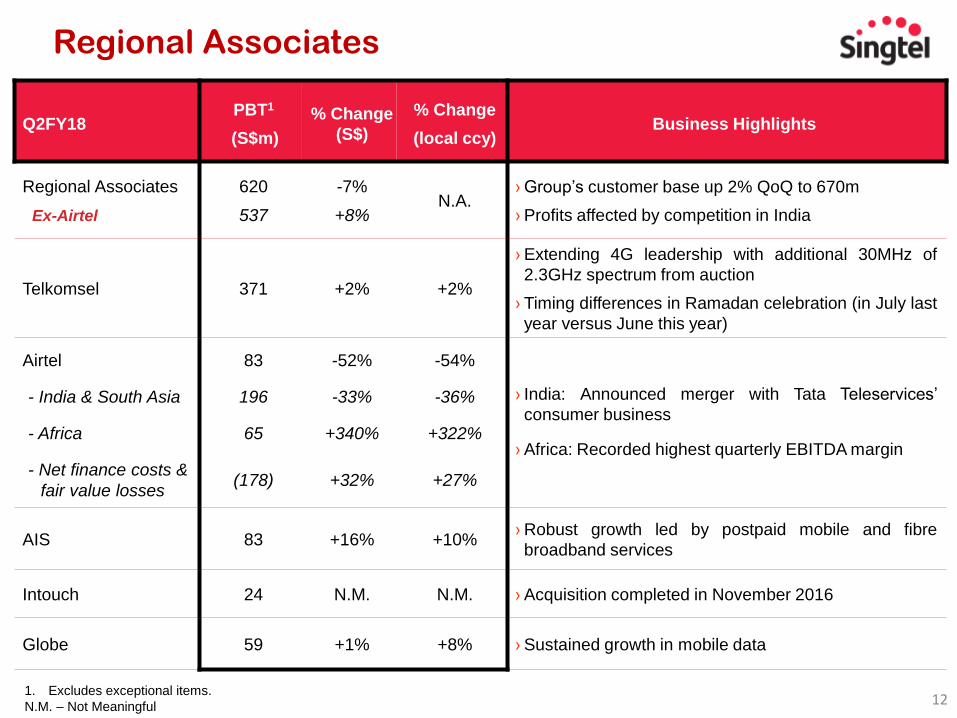
Q2FY18PBT1
(S$m)
% Change
(S$)
% Change
(local ccy)Business Highlights
Regional Associates
Ex-Airtel
620
537
-7%
+8%N.A.
› Group’s customer base up 2% QoQ to 670m
› Profits affected by competition in India
Telkomsel 371 +2% +2%
› Extending 4G leadership with additional 30MHz of
2.3GHz spectrum from auction
› Timing differences in Ramadan celebration (in July last
year versus June this year)
Airtel 83 -52% -54%
› India: Announced merger with Tata Teleservices’
consumer business
› Africa: Recorded highest quarterly EBITDA margin
- India & South Asia 196 -33% -36%
- Africa 65 +340% +322%
- Net finance costs &
fair value losses(178) +32% +27%
AIS 83 +16% +10%› Robust growth led by postpaid mobile and fibre
broadband services
Intouch 24 N.M. N.M. › Acquisition completed in November 2016
Globe 59 +1% +8% › Sustained growth in mobile data
1. Excludes exceptional items.
N.M. – Not Meaningful
Regional Associates
65 68
546 610
643663
Q2FY18
1,254
Q2FY17
1,209
476502
889899
670578
141135
Q2FY18
1,700
Q2FY17
1,612
Q2FY18Q2FY17
13
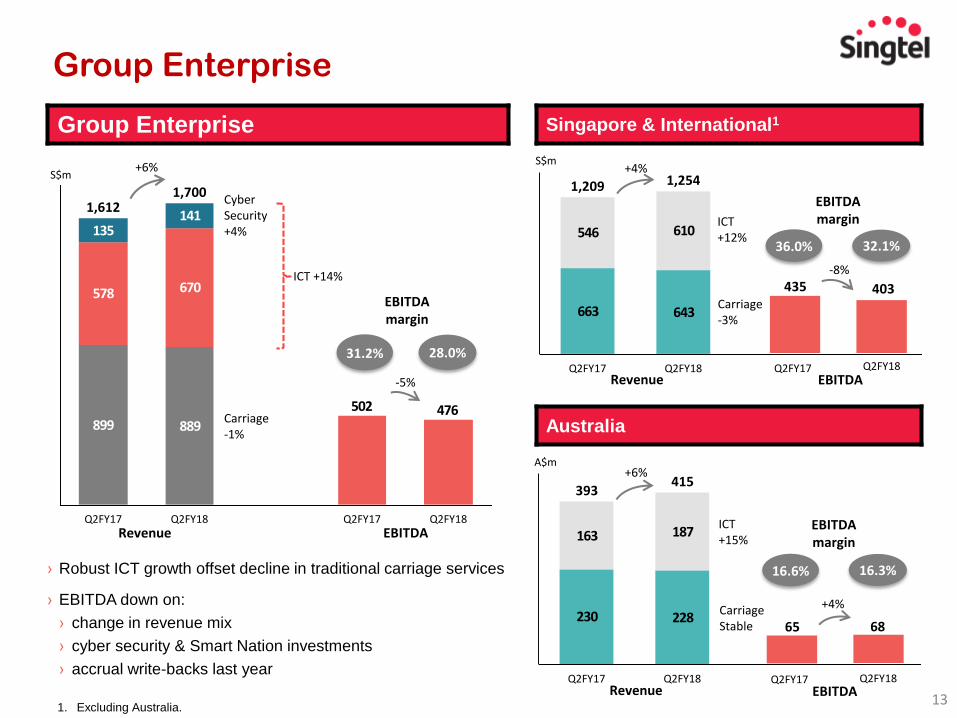
Group Enterprise
Group Enterprise
230 228
163 187
Q2FY18
415
Q2FY17
393
Singapore & International1
Australia
Q2FY17 Q2FY18Revenue EBITDA
A$m
CarriageStable
16.6% 16.3%
EBITDA margin
S$m
Carriage-1%
31.2% 28.0%
EBITDA margin
CyberSecurity+4%
+6%
435 403
Q2FY17 Q2FY18Revenue EBITDA
S$m
ICT +12%
Carriage-3%
36.0% 32.1%
EBITDA margin
-8%
› Robust ICT growth offset decline in traditional carriage services
› EBITDA down on:
› change in revenue mix
› cyber security & Smart Nation investments
› accrual write-backs last year
ICT +14%
ICT +15%
1. Excluding Australia.
Revenue EBITDA
-5%
+4%
+6%
+4%
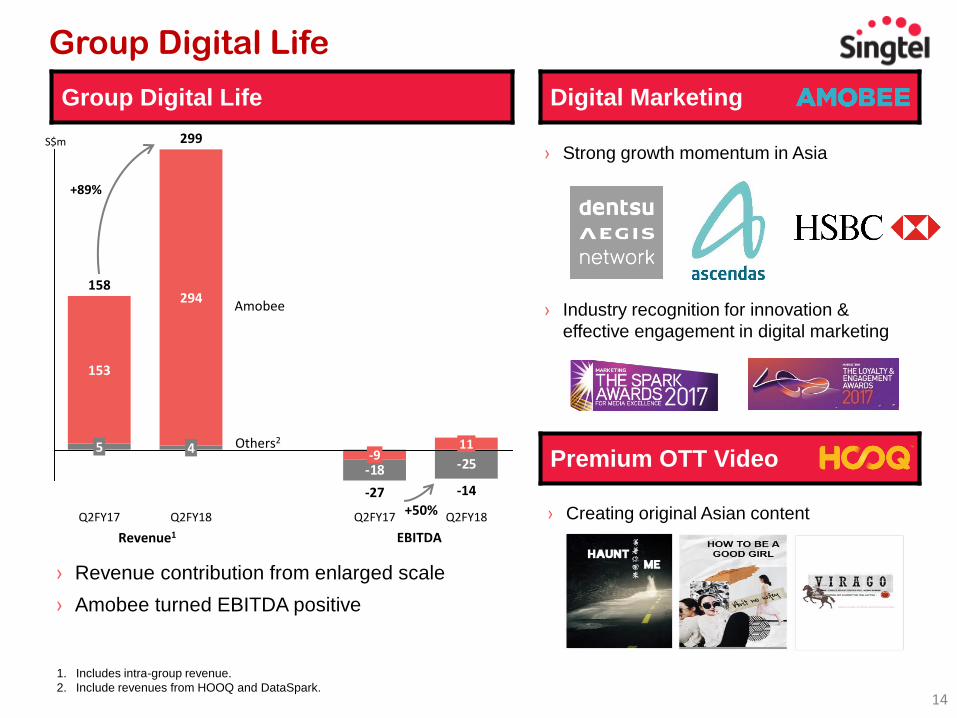
Premium OTT Video
Digital Marketing
14
Revenue1 EBITDA
S$m
+89%
› Revenue contribution from enlarged scale
› Amobee turned EBITDA positive
1. Includes intra-group revenue.
2. Include revenues from HOOQ and DataSpark.
› Creating original Asian content
› Industry recognition for innovation &
effective engagement in digital marketing
Group Digital Life
Group Digital Life
-25-18
11
Q2FY18Q2FY17
299
294
4
-14
5
153
-27
-9
Q2FY18Q2FY17
158
Others2
Amobee
+50%
› Strong growth momentum in Asia

Agenda
Overview
Business Units
Supplementary Information
16
1.77 1.74 1.75 1.71 1.68
2.34 2.35 2.39 2.41 2.42
$520 $526$511 $506 $506
Q2FY17 Q3FY17 Q4FY17 Q1FY18 Q2FY18
Prepaid Postpaid Revenue
Mobile customers
(m)Mobile revenue
(S$m)
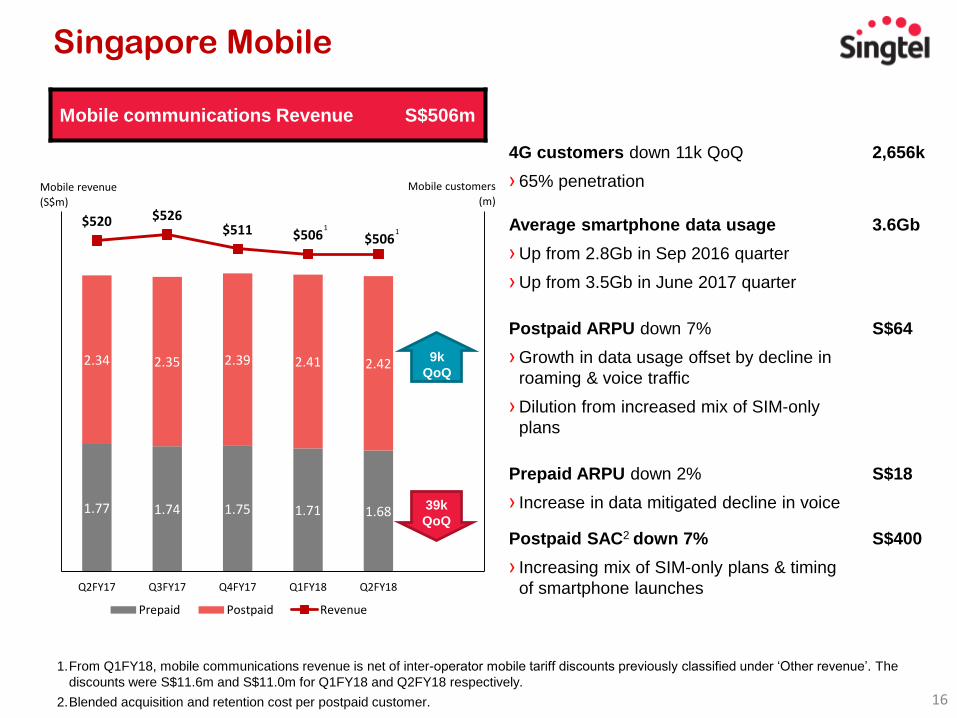
Singapore Mobile
1.From Q1FY18, mobile communications revenue is net of inter-operator mobile tariff discounts previously classified under ‘Other revenue’. The
discounts were S$11.6m and S$11.0m for Q1FY18 and Q2FY18 respectively.
2.Blended acquisition and retention cost per postpaid customer.
Mobile communications Revenue S$506m
9k
QoQ
39k
QoQ
4G customers down 11k QoQ
› 65% penetration
2,656k
Average smartphone data usage
› Up from 2.8Gb in Sep 2016 quarter
› Up from 3.5Gb in June 2017 quarter
3.6Gb
Postpaid ARPU down 7%
› Growth in data usage offset by decline in
roaming & voice traffic
› Dilution from increased mix of SIM-only
plans
S$64
Prepaid ARPU down 2%
› Increase in data mitigated decline in voice
S$18
Postpaid SAC2 down 7%
› Increasing mix of SIM-only plans & timing
of smartphone launches
S$400
1 1
17
Customers (‘000)
Singtel TV Revenue1
(S$m)
412 409 408 404 404
63 63
61
63 64
Q2FY17 Q3FY17 Q4FY17 Q1FY18 Q2FY18
Residential Singtel TV Customers Singtel TV revenue
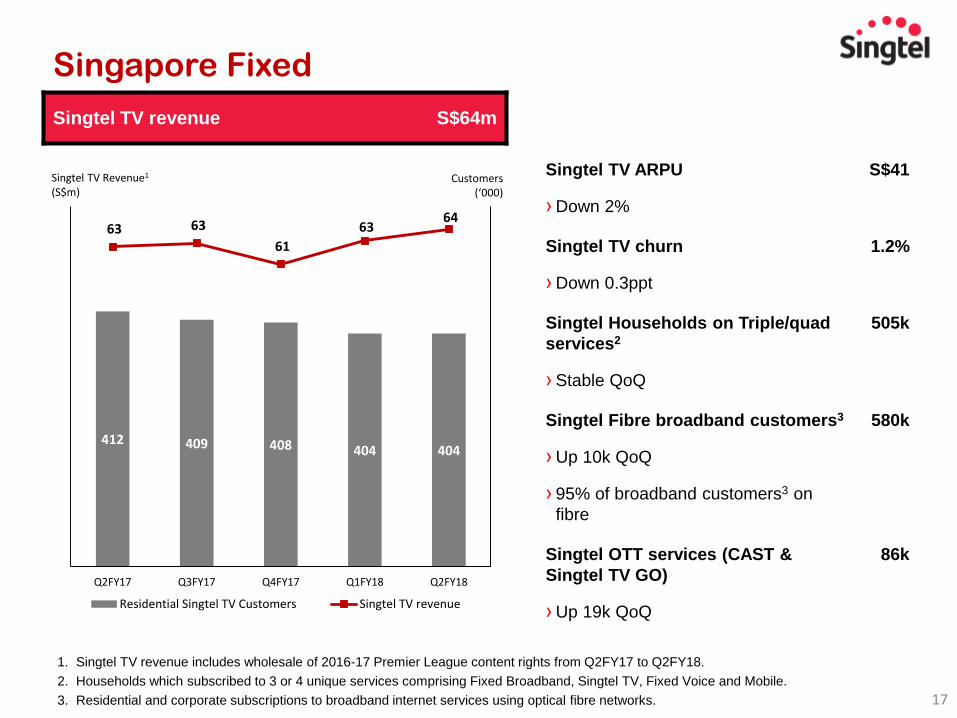
Singtel TV ARPU
› Down 2%
S$41
Singtel TV churn
› Down 0.3ppt
1.2%
Singtel Households on Triple/quad
services2
› Stable QoQ
505k
Singtel Fibre broadband customers3
› Up 10k QoQ
› 95% of broadband customers3 on
fibre
580k
Singtel OTT services (CAST &
Singtel TV GO)
› Up 19k QoQ
86k
1. Singtel TV revenue includes wholesale of 2016-17 Premier League content rights from Q2FY17 to Q2FY18.
2. Households which subscribed to 3 or 4 unique services comprising Fixed Broadband, Singtel TV, Fixed Voice and Mobile.
3. Residential and corporate subscriptions to broadband internet services using optical fibre networks.
Singapore Fixed
Singtel TV revenue S$64m
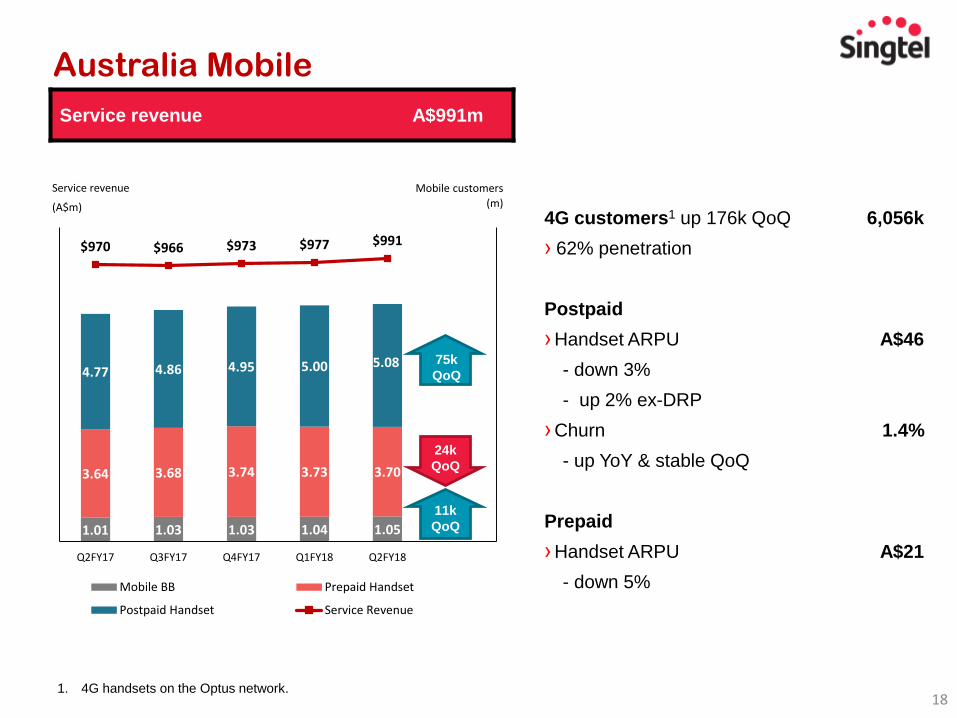
18
Australia Mobile
Service revenue A$991m
1.01 1.03 1.03 1.04 1.05
3.64 3.68 3.74 3.73 3.70
4.77 4.86 4.95 5.00 5.08
$970 $966 $973 $977 $991
Q2FY17 Q3FY17 Q4FY17 Q1FY18 Q2FY18
Mobile BB Prepaid Handset
Postpaid Handset Service Revenue
Mobile customers
(m)
Service revenue
(A$m)4G customers1 up 176k QoQ
› 62% penetration
6,056k
Postpaid
›Handset ARPU
- down 3%
- up 2% ex-DRP
›Churn
- up YoY & stable QoQ
A$46
1.4%
Prepaid
›Handset ARPU
- down 5%
A$21
1. 4G handsets on the Optus network.
75k
QoQ
11k
QoQ
24k
QoQ

19
Australia Fixed
Mass market revenue A$353m
Customers (‘000)
Mass market revenue1
(A$m)
437 440 438 433 418
447 429 413 396 373
164 192 228 279 351
63 65 6866
64
$307$315
$354
$333$353
Q2FY17 Q3FY17 Q4FY17 Q1FY18 Q2FY18
HFC BB customers ULL BB customers NBN BB customers
Others mass market revenue
On-net BB ARPU
› Up 3%
A$54
NBN BB Customers
›Up 72k QoQ
351k
Resale DSL BB Customers
›Down 2k QoQ
39k
TV Customers
›Up 12k QoQ
469k
1,111
1. Impacted by customer growth and timing of migration payments.
1,125 1,147 1,1741,206

201. Assuming constant exchange rates from corresponding periods in FY2017.
2. The Group’s share of associates’ earnings before exceptionals.
3 months ended September 2017Q2FY18
(reported S$m)YoY % change(reported S$)
YoY % change(at constant FX)1
Group revenue 4,370 6.9% 4.3%
Group reported NPAT 2,889 197.1% 196.4%
Group underlying NPAT 929 (4.1%) (4.9%)
Optus revenue 2,275 5.0% 0.2%
Regional Associates
pre-tax earnings2 620 (7.2%) (7.5%)
Trends In Constant Currency Terms1
6 months ended September 2017H1FY18
(reported S$m)YoY % change(reported S$)
YoY % change(at constant FX)1
Group revenue 8,602 7.6% 5.3%
Group reported NPAT 3,781 97.3% 96.0%
Group underlying NPAT 1,839 (3.8%) (5.2%)
Optus revenue 4,466 6.6% 2.5%
Regional Associates
pre-tax earnings2 1,292 (5.5%) (7.0%)
Disclaimer: This material that follows is a presentation of general background information about Singtel’s activities current at the date of the presentation. The information contained in this document is intended only for use during the presentation and
should not be disseminated or distributed to parties outside the presentation. It is information given in summary form and does not purport to be complete. It is not to be relied upon as advice to investors or potential investors and does not take into
account the investment objectives, financial situation or needs of any particular investor. This material should be considered with professional advice when deciding if an investment is appropriate.


