

Agenda
2
Survey
Exercise 1
Agile vs. Traditional
Effect of Test Driving
Testing Pyramid
Exercise 2
Q&A

Quick Survey
3
How many QA folks are focused on testing?
Who owns Quality?
Who owns improvement?
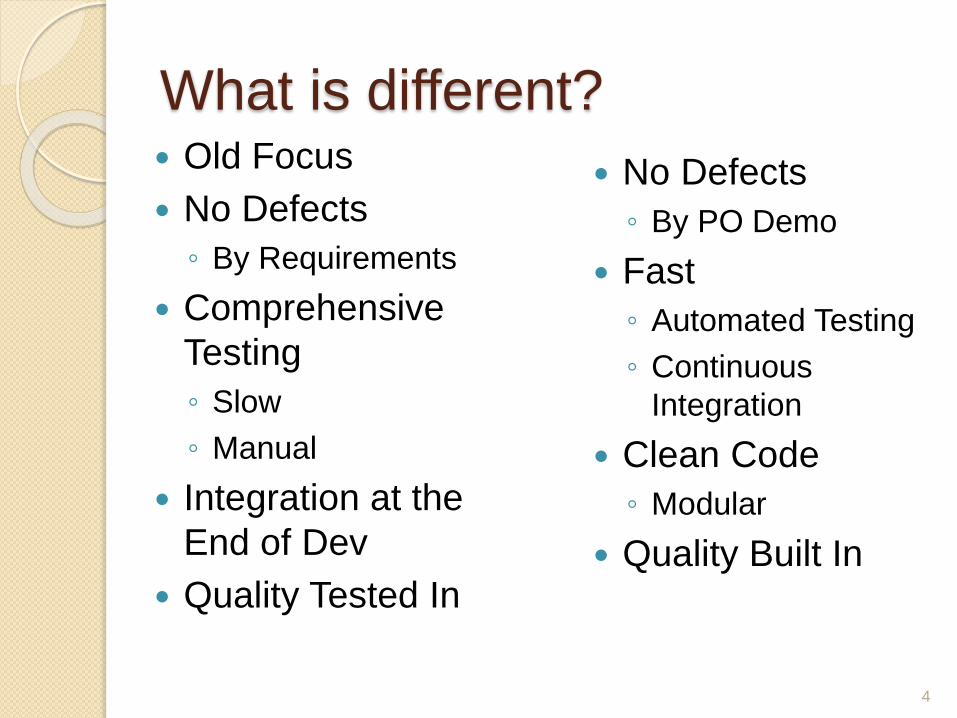
What is different?
4
Old Focus
No Defects
◦ By Requirements
Comprehensive
Testing
◦ Slow
◦ Manual
Integration at the
End of Dev
Quality Tested In
No Defects
◦ By PO Demo
Fast
◦ Automated Testing
◦ Continuous
Integration
Clean Code
◦ Modular
Quality Built In

Manifesto for Agile Software
Development
We are uncovering better ways of developing
software by doing it and helping others do it.
Through this work we have come to value:
• Individuals and interactions over processes and tools
• Working software over comprehensive documentation
• Customer collaboration over contract negotiation
• Responding to change over following a plan
That is, while there is value in the items on the right, we value the
items on the left more.

Working Software
6
Quality Assurance is all about working
software.
Quality Standards
Confidence in the codebase is the key to
sente; having choices, momentum,
velocity, autonomy, adaptability,
competitive advantage and the inherent
propensity for innovation and luck.
Exercise 1
7
What does a traditional QA do that an Agile QA
does not do?
What skills does an agile QA need that a
traditional QA does not?
Report Outs…

Cultural
Environmental Practical
Collaborative
Big & Visible
Perpetual Buzz
Food
Thorough
Courageous
Adaptable
Forthright
FUN
TDD
Quality Standards
Iterative Development
Business Verification

Whole Team Ownership Quality as a fundamental ongoing concern for the
team◦ Not just at the end of a release
◦ Meeting quality standards has become a part of the “Definition of Done” for the whole team
An Integrated Team Focus◦ QA throughout development
Elimination of QA as a sequential process
◦ Whole Team collaboration from beginning to end
◦ Teams take ownership Definition of Done
Quality Standards
Level of quality being produced every day
Business Verification◦ Weekly verification demo
◦ Product Owner Drives the Demo

10

Tasting after baking
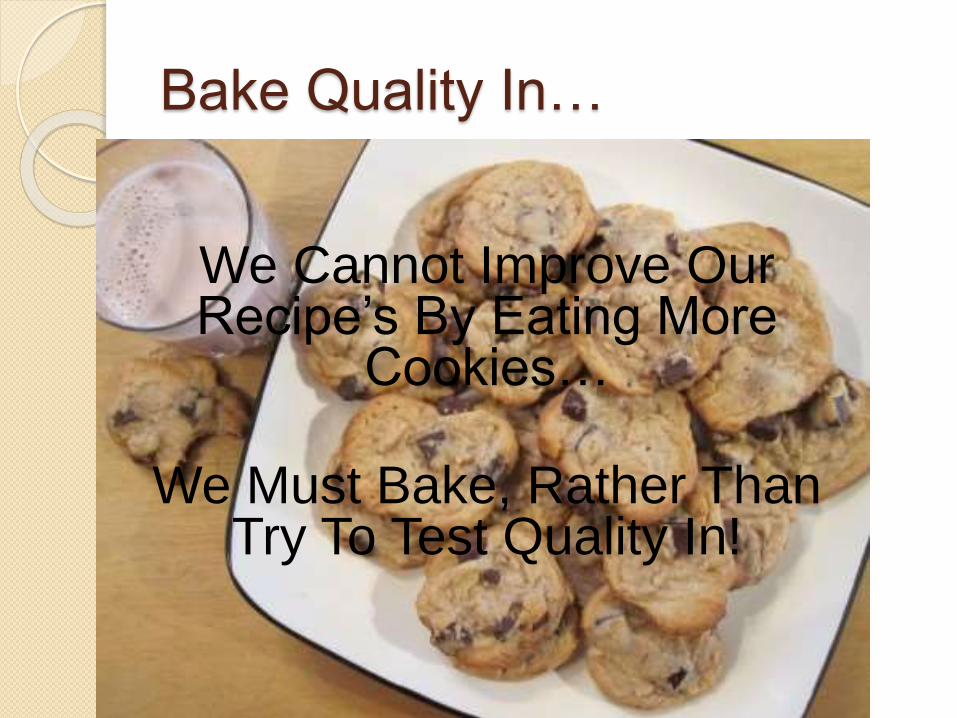
Bake Quality In…
We Cannot Improve Our Recipe’s By Eating More
Cookies…
We Must Bake, Rather Than Try To Test Quality In!
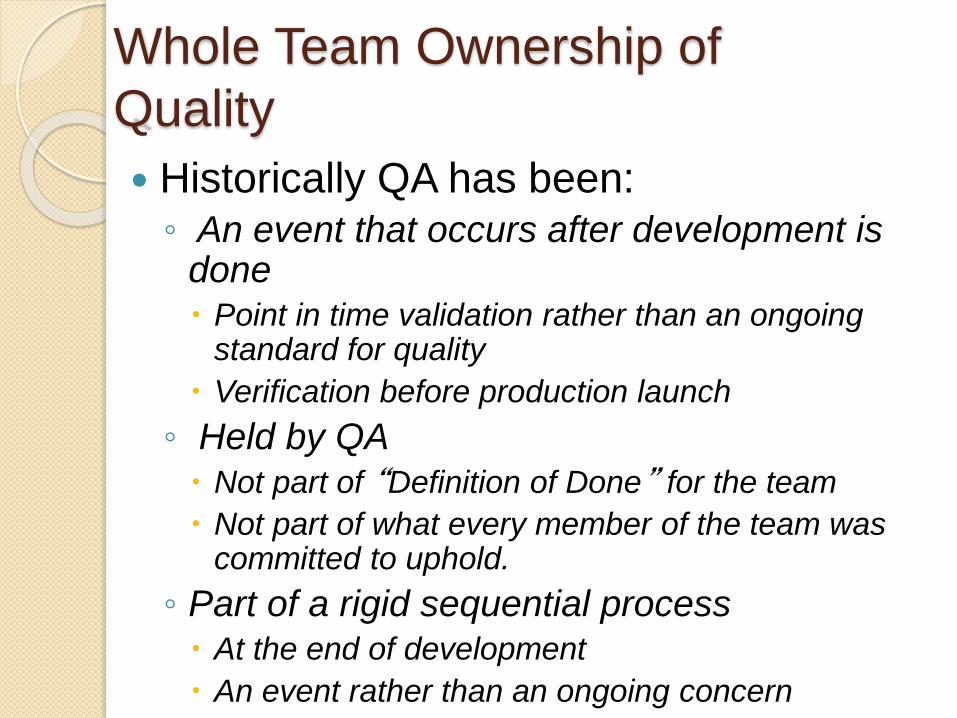
Whole Team Ownership of
Quality
Historically QA has been:◦ An event that occurs after development is
done Point in time validation rather than an ongoing
standard for quality
Verification before production launch
◦ Held by QA
Not part of “Definition of Done” for the team
Not part of what every member of the team was committed to uphold.
◦ Part of a rigid sequential process At the end of development
An event rather than an ongoing concern

Definition Of Done
14
Build it RIGHT -- “Done”
• Quality Metrics Passed• Unit test coverage at or above 80% overall
• Cyclomatic Complexity 1-3
• Fewer Than 10 Statements per Method
• Integration tests created and successfully passed for each
external dependency (minimum one per dependency)
• Deploy scripts updated for deployment to DevInt and QA.
• Functional tests pass in DevInt or preferably QA
• Functional tests automated (Selenium, Fitnesse or other)
• Single user execution against functional timing SLA passed
for each story.
• Business verified by product owner OR technical
lead/architect if technical card.
• Exploratory Testing Complete

Definition Of Done
15
“Production Ready” -- “Done” – Done
• Performance testing executed and passed.
• Production-level content successfully
integrated and tested
• Accessibility & Usability Tested
• Full browser testing for all specified browsers
and versions

Traditional Development
16
Specify
Design
Code
Test
Deploy
Sustain
Test Driving
17
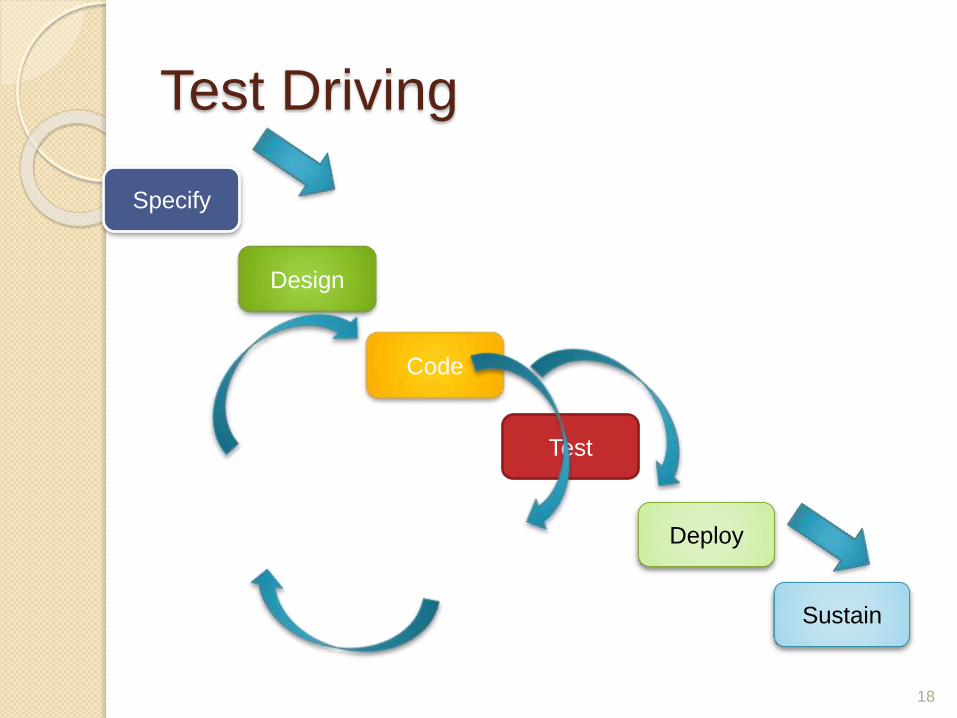
Test Driving
18
Specify
Design
Code
Test
Deploy
Sustain
Working Software Environment
19
Source Code
Management

Environment
20
Source Code
Management
Continuous Integration
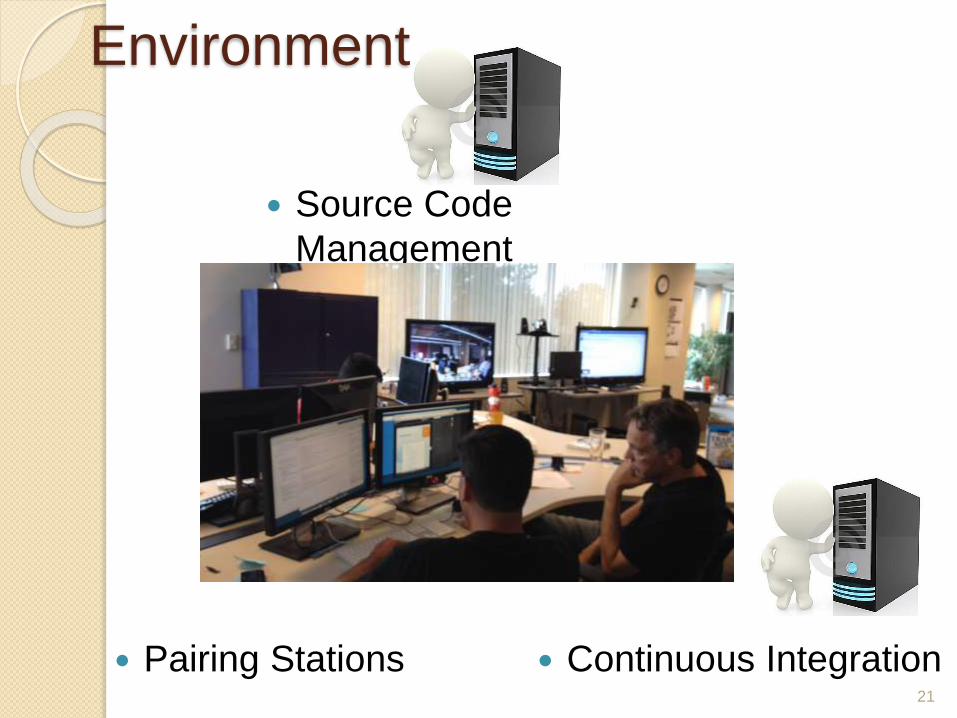
Environment
21
Pairing Stations
Source Code
Management
Continuous Integration

Environment
22
Pairing Stations
Source Code
Management
Continuous Integration
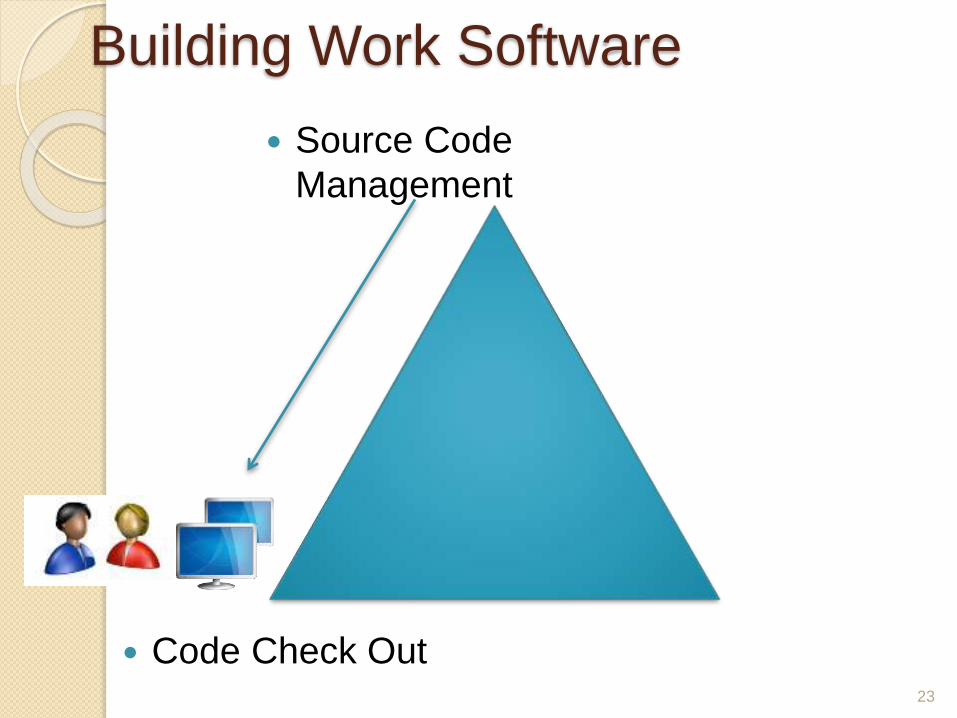
Building Work Software
23
Code Check Out
Source Code
Management
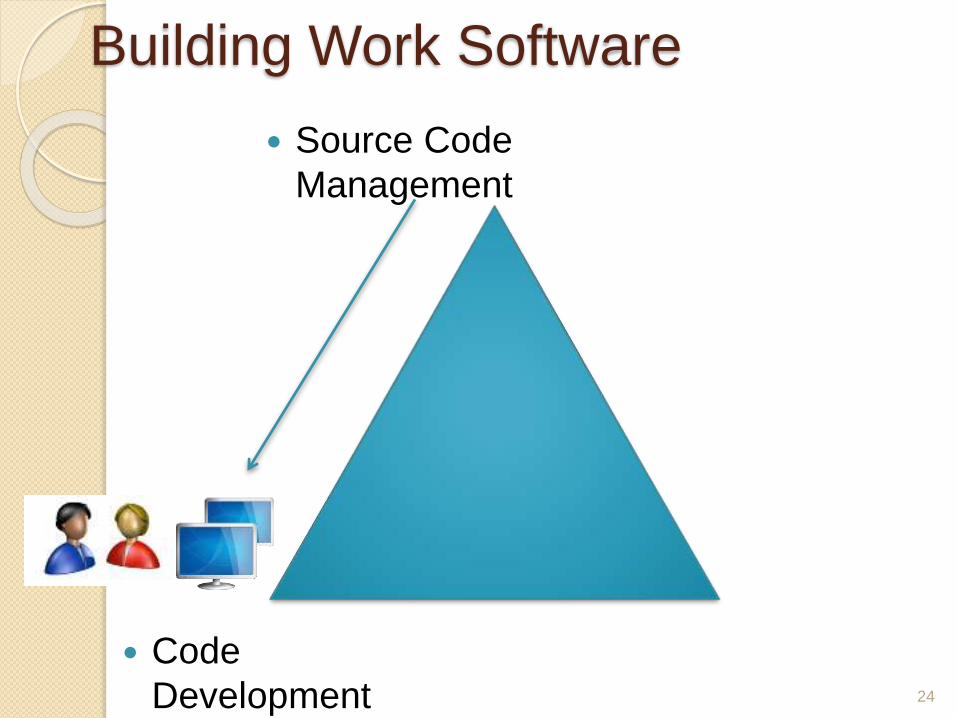
Building Work Software
24
Code
Development
Source Code
Management

Building Work Software
25
Coding Pair
Source Code
Management
Code Check-In
Continuous Integration

Iterative Development
26
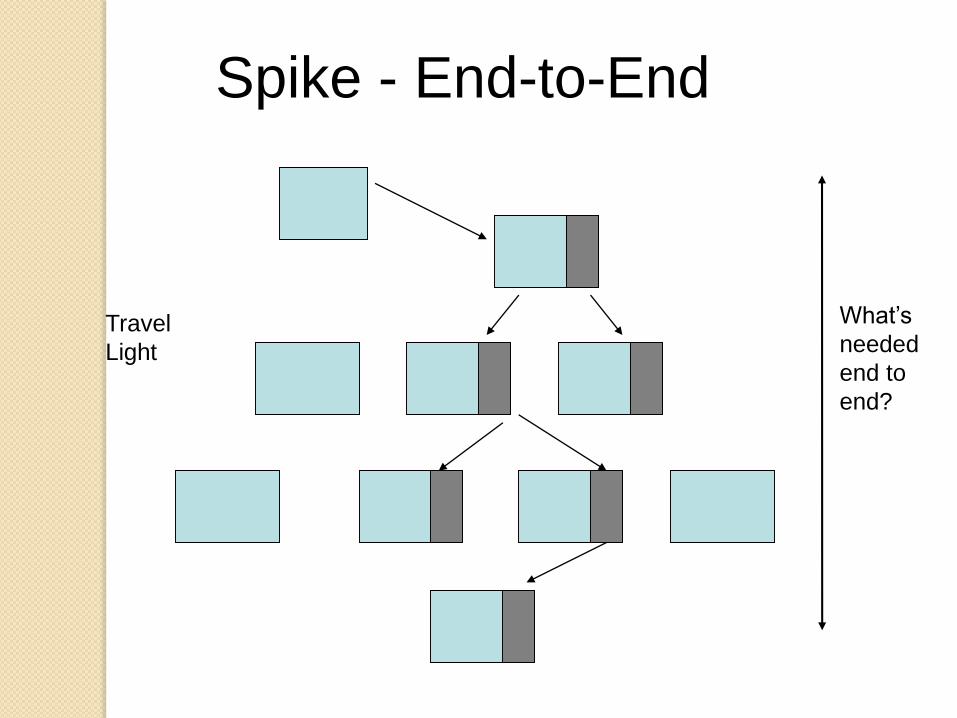
Spike - End-to-End
What’s
needed
end to
end?
Travel
Light

Iterative Growth
What’s
needed
end to
end?

• Project Concerns– Tight Schedules
– Maintaining “High Quality” despite changes
– Responsiveness to customer needs
• Project Situations – Don’t know all of what is needed at onset of project
• ONLY Commit for the “Known's”
– Requirements Change During the Project• Accommodate change with later releases
• Value to the Customer– Give customers regular functionality reviews
– Realizing Value often rather than “big bang”
Accommodates Multiple Challenges

• Project Concerns– Burn-Down Chart
– Burn-Up Charts
• Practices – Consistency Allows Ease of Spool Up
– Allows Migration of Team Members
• Tools– Consistency Allows Ease Migration of Team Members
• Quality– Defects
– Components
Big Visible Charts
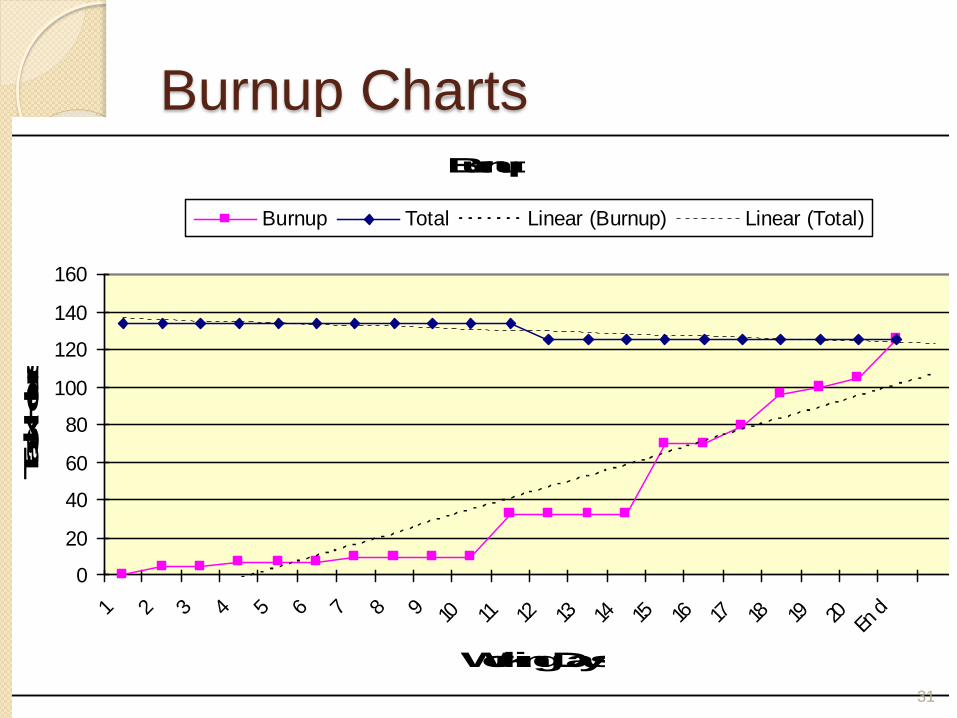
Burnup Charts
7/6/2011
25
Electronic Task Wall
Burning Up Tasks Burnup
0
20
40
60
80
100
120
140
160
1 2 3 4 5 6 7 8 9 10 11 12 13 14 15 16 17 18 19 20En
d
Working Days
Task Hours
Burnup Total Linear (Burnup) Linear (Total)
Collaboration / Validation
Story Tests Define Done
31

32
1026 1013982
951 924 913879
847798
742695
16 1331
3127 32
3445
16
23
34
40 43 5362
66 90
7261
7093
120
53 62 6267
90102
138 173
189200 223
150 160 180 190 198198
143 150
180 184196.5
050
100150200250300350400450500550600650700750800850900950
1000105011001150120012501300135014001450
2/3
2/1
0
2/1
7
2/2
4
3/3
3/1
0
3/1
7
3/2
4
3/3
1
4/7
4/1
4
4/2
1
4/2
8
5/5
5/1
2
5/1
9
5/2
6
6/2
6/9
6/1
6
6/2
3
6/3
0
7/7
7/1
4
7/2
1
7/2
8
Te
am
Po
ints
Sprint Iteration
K12 Burndown
Content Verified / DONE QA Verified Complete / Business Verified Active Remaining
Release 1 Release 2 & 3
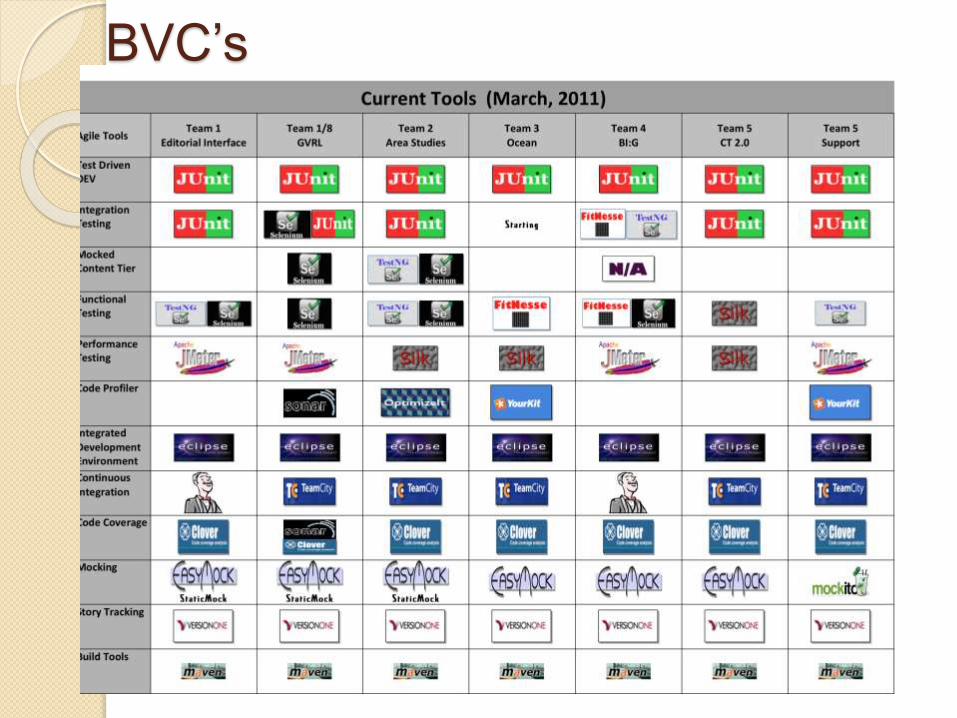
BVC’s
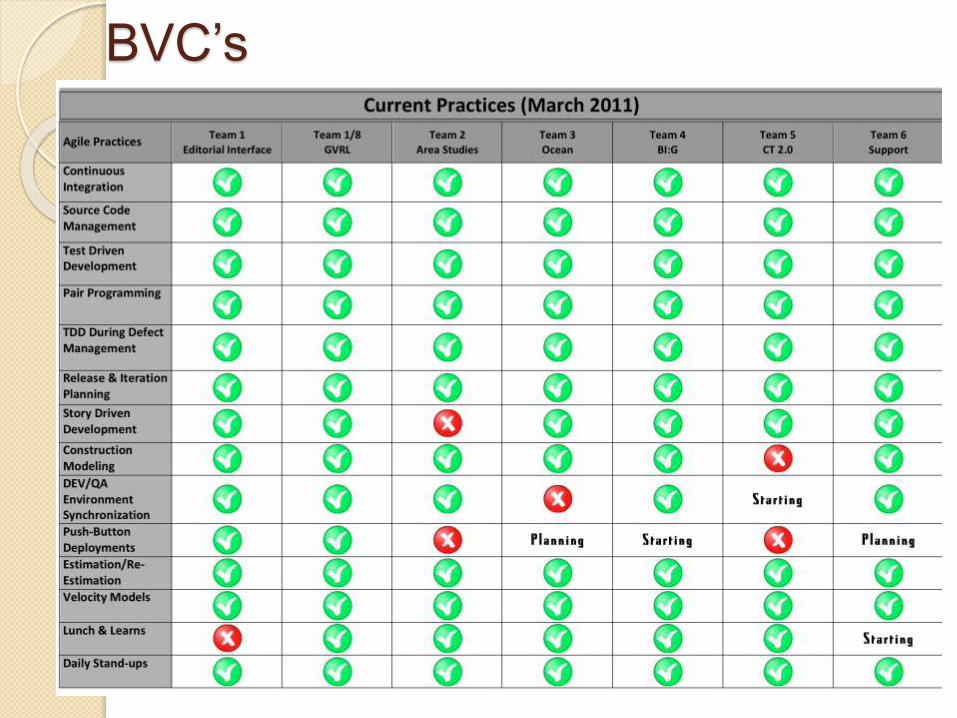
BVC’s
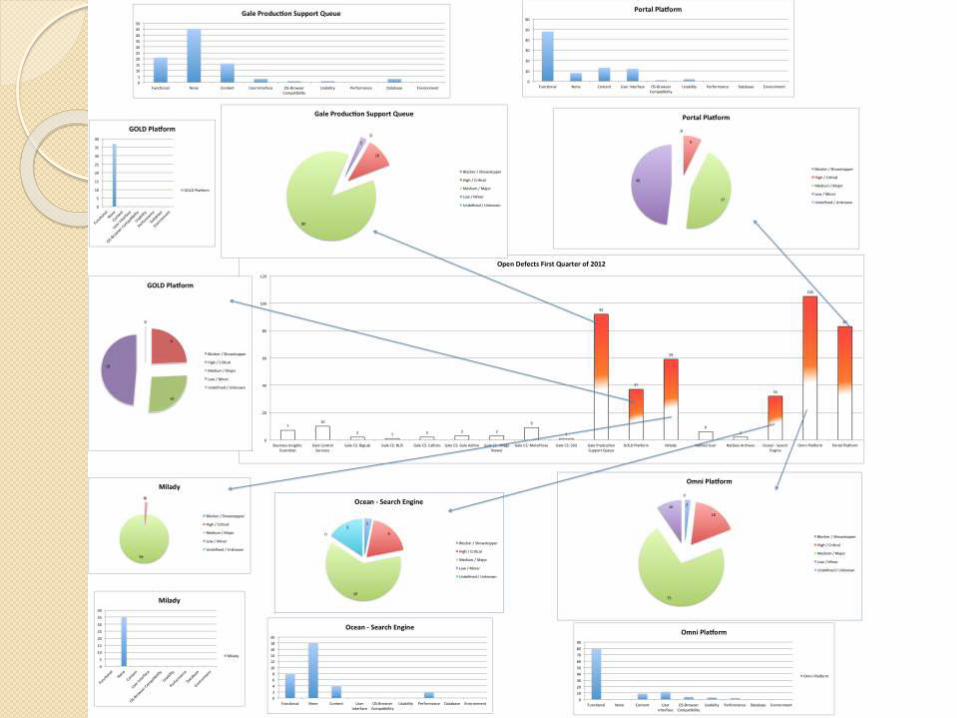
BVC’s
BVC’s
Working Software
Questions?


