
Quality Concentrates by Reverse Osmosis
Cecilia Hodúr Katalin K. Bajúsz Mária F. Halasz Gábor Szabó
Outline
AimsAimsDisadvantages and Benefits of Disadvantages and Benefits of
Evaporation/ RO Evaporation/ RO Materials & MethodsMaterials & MethodsResults and DiscussionResults and DiscussionConclusionsConclusions
Aims
To produceTo produce quality concentrated quality concentrated tomatotomato juice, means:juice, means:
maximum flavour containminimum heat degradationminimum energy comsumption
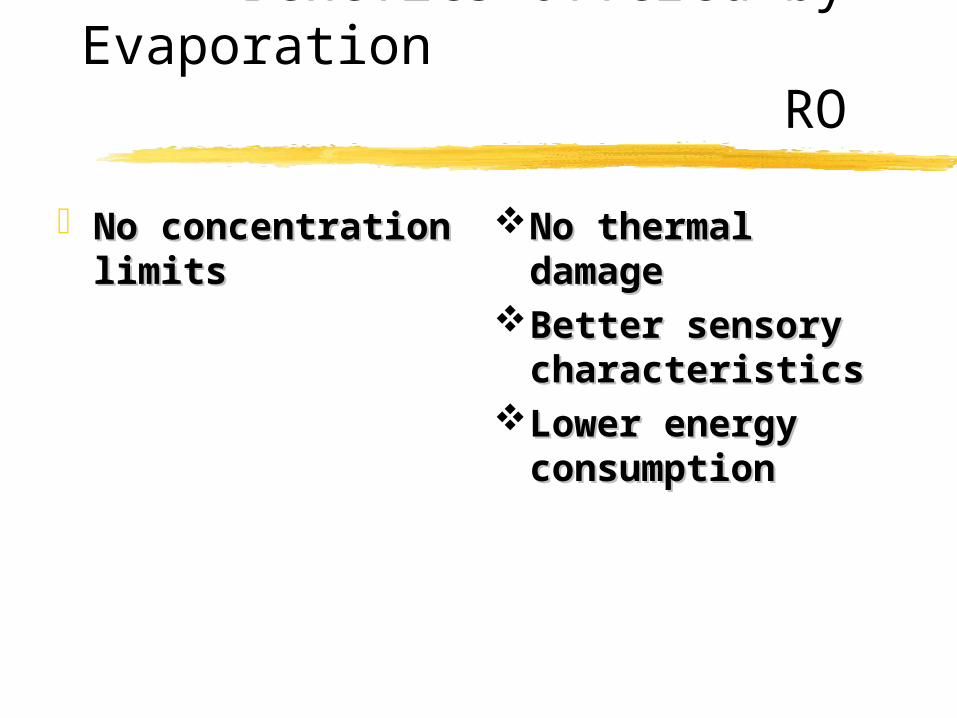
Benefits offered byEvaporation RO
No concentration No concentration limitslimits
No thermal No thermal damagedamage
Better sensory Better sensory characteristicscharacteristics
Lower energy Lower energy consumptionconsumption
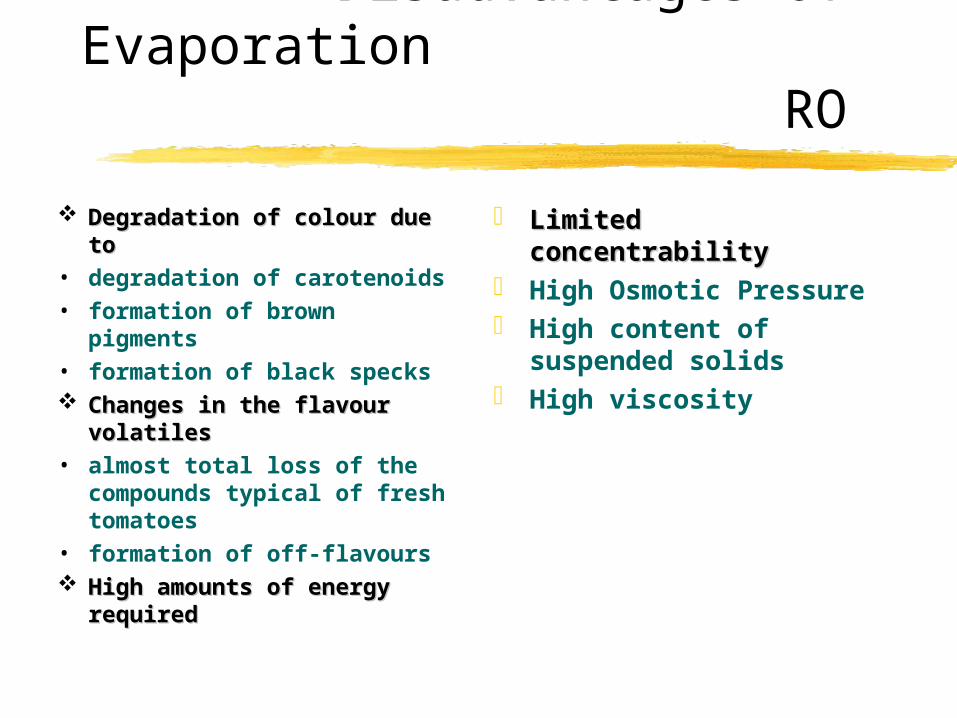
Disadvantages ofEvaporation RO
Degradation of colour due Degradation of colour due toto
• degradation of carotenoids• formation of brown
pigments • formation of black specks Changes in the flavour Changes in the flavour
volatiles volatiles • almost total loss of the
compounds typical of fresh tomatoes
• formation of off-flavours High amounts of energy High amounts of energy
requiredrequired
Limited concentrabilityLimited concentrability High Osmotic Pressure High content of
suspended solids High viscosity

Osmotic Pressure of Tomato Osmotic Pressure of Tomato Juice and SerumJuice and Serum
0
10
20
30
40
50
60
70
80
90
0 10 20 30 40 50
concentration (wt% or oBrix)
os
mo
tic
pre
ss
ure
(b
ar)
tomato juice (Ishii et al., 1981)
tomato serum (Dale et al., 1982)
Glucose (Weast, 1983)
Sucrose (Weast, 1983)
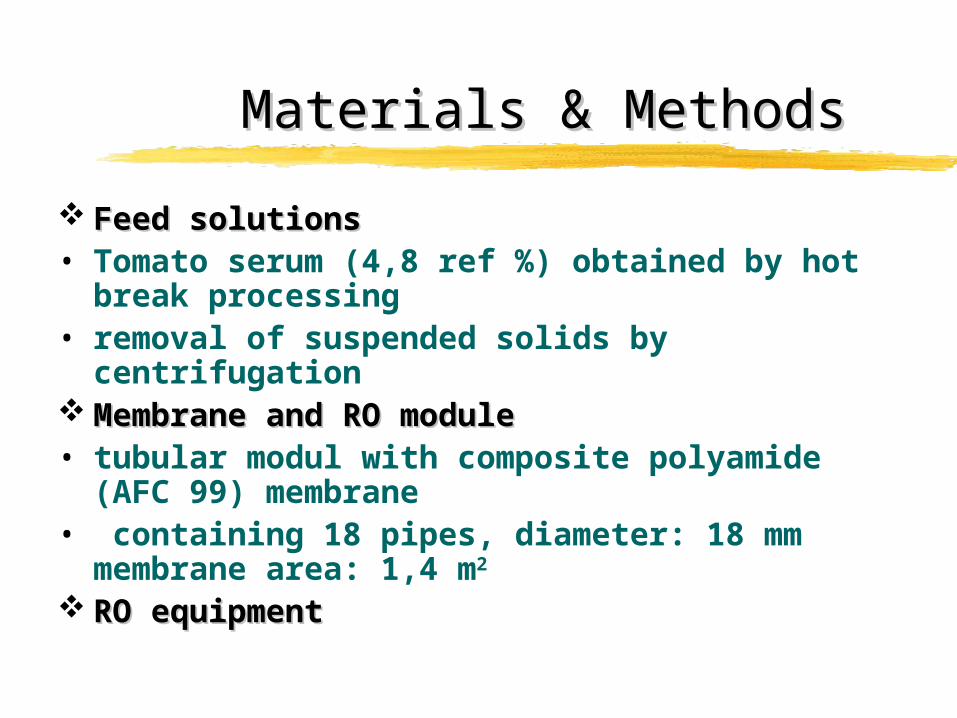
Materials & MethodsMaterials & Methods
Feed solutionsFeed solutions• Tomato serum (4,8 ref %) obtained by hot
break processing• removal of suspended solids by
centrifugation Membrane and RO moduleMembrane and RO module• tubular modul with composite polyamide
(AFC 99) membrane• containing 18 pipes, diameter: 18 mm
membrane area: 1,4 m2
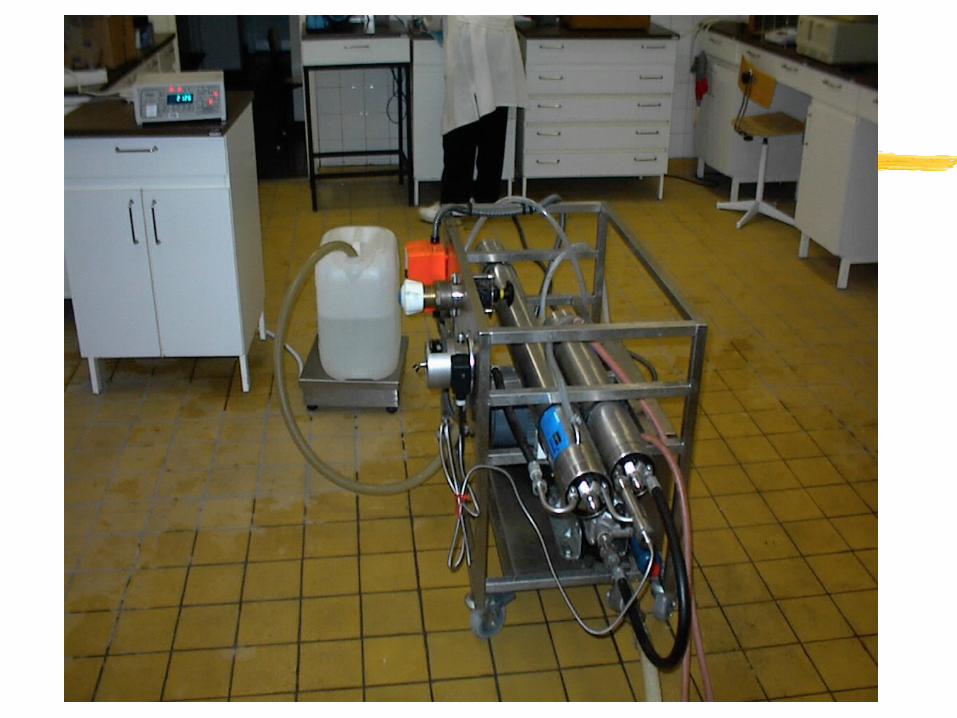
RO equipmentRO equipment

Production of Tomato Paste Production of Tomato Paste by Reverse Osmosisby Reverse Osmosis
Tomato Juice
Centrifuge Serum
PulpRO
module
Water
ConcentratedSerum
Reconstitution
TomatoConcentrate
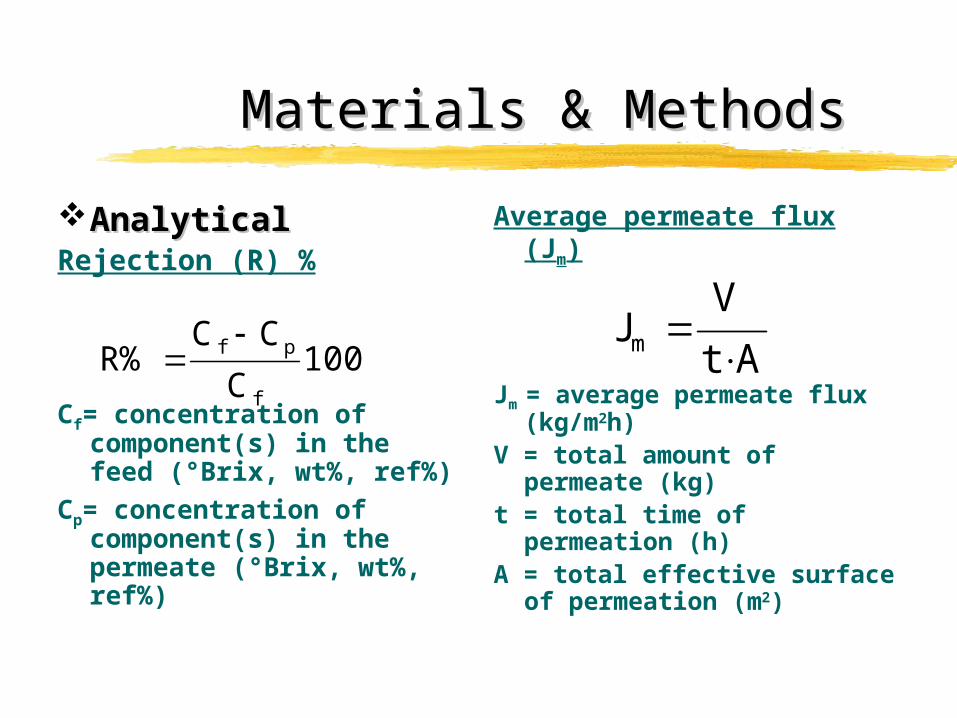
Materials & MethodsMaterials & Methods
AnalyticalAnalyticalRejection (R) %
Cf= concentration of component(s) in the feed (°Brix, wt%, ref%)
Cp= concentration of component(s) in the permeate (°Brix, wt%, ref%)
Average permeate flux (Jm)
Jm = average permeate flux (kg/m2h)
V = total amount of permeate (kg)
t = total time of permeation (h)
A = total effective surface of permeation (m2)
100C
CCR%
f
pf At
VJm

• Physical analysesPhysical analyses• Rheological analysis
• k - consistency• n - flow index
• Coulour analysis• a* - yellowness• b* - redness
• Sensorial analysis• Poretta’s method
Materials & MethodsMaterials & Methods
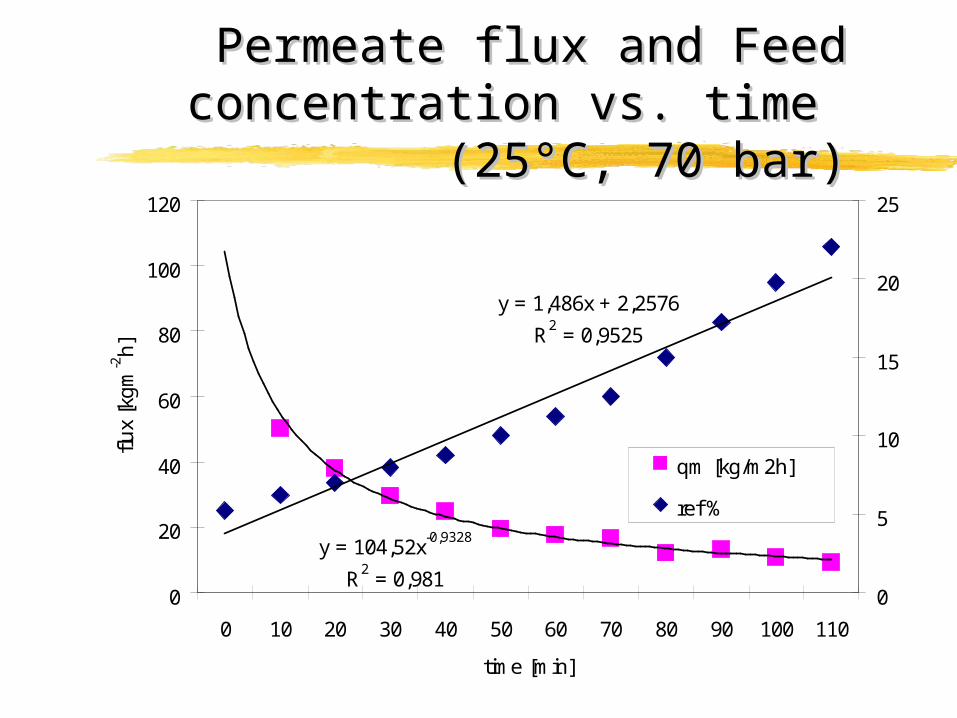
Permeate flux and Feed Permeate flux and Feed concentration vs. time concentration vs. time
(25°C, 70 bar)(25°C, 70 bar)
y = 1,486x + 2,2576
R2 = 0,9525
y = 104,52x-0,9328
R2 = 0,9810
20
40
60
80
100
120
0 10 20 30 40 50 60 70 80 90 100 110
time [min]
flux
[kg
m-2
h]
0
5
10
15
20
25
qm [kg/m2h]
ref %
Lineáris (ref %)
Hatvány (qm[kg/m2h])
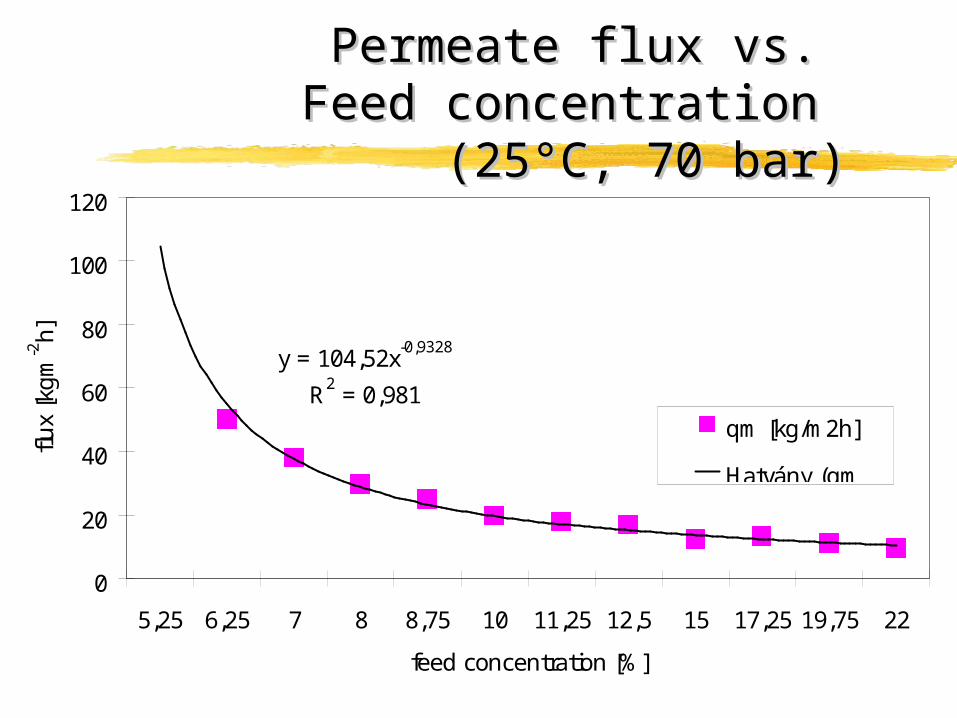
y = 104,52x-0,9328
R2 = 0,981
0
20
40
60
80
100
120
5,25 6,25 7 8 8,75 10 11,25 12,5 15 17,25 19,75 22
feed concentration [%]
flux
[kg
m-2
h]
qm [kg/m2h]
Hatvány (qm[kg/m2h])
Permeate flux vs. Permeate flux vs. Feed concentration Feed concentration
(25°C, 70 bar)(25°C, 70 bar)

Newtonian fluid
0
0,5
1
1,5
2
2,5
3
3,5
4
4,5
viscisity [mPas]
row juice hot breaked
serum concentrate water

Flow curve of concentrate
0 30 60 90 120 150D (1/sec)
0
10
20
30
40
50
tang.stress(Pa)
k = 13.787n = 0.256
t = 20 0C

Redness values (a*/b*)
0
0,5
1
1,5
2
2,5R
ow
juic
e
fib
re
seru
m
con
cen
trat
e
Reb
len
ded
Co
mm
erci
al
sam
ple

Specific energy comsumption
time [min]
feed conc. [%] specific energ.consumption [kJ/kg]
0
5
10
15
20
25
1 1325 37 496173 85 97 109 133 157 181 205 24 5 277 0
500
1000
1500
2000
2500
3000
ref %
Spec.energ. kJ/kg

Sensorial analysis
Concentrate Commercial sample 1 Commercial sample 2
Acidity1= acidical
9= non acidical
8 8 6
Natural flavour1= different
9= fresh tomato
8 5 4
Colour1= heterogen
9=perfect
9 7 6
Viscosity1=flow9=rigid
8 9 5
Total value 33 29 21

Thank you for your attention
The authors are grateful to the Hungarian Government „NKFP 4/0026” project for supporting this work.


