
1
Quantitative Spectroscopic Analysis of Heterogeneous 1
Mixtures: the Correction of Multiplicative Effects 2
Caused by Variations in Physical Properties of Samples 3
4
Jing-Wen Jina, Zeng-Ping Chen*
a, Li-Mei Li
a, Raimundas Steponavicius
b, Suresh N. Thennadil
c, Jing 5
Yanga and Ru-Qin Yu*
a 6
7
a. State Key Laboratory of Chemo/Biosensing and Chemometrics, College of Chemistry and Chemical 8
Engineering, Hunan University, Changsha 410082, China 9
b. School of Chemical Engineering and Advanced Materials, Newcastle University, Merz Court, 10
Newcastle upon Tyne, NE1 7RU, United Kingdom 11
c. Chemical and Process Engineering, University of Strathclyde, 75 Montrose Street, Glasgow, G1 1XJ, 12
United Kingdom 13
* Corresponding author 14
Tel.: (+86) 731 88821916; Fax: (+86) 731 88821916; 15
E-mail Address: [email protected] (Z.P. Chen), [email protected] (R.Q. Yu) 16
17

2
ABSTRACT: Spectral measurements of complex heterogeneous types of mixture samples are often 18
affected by significant multiplicative effects resulting from light scattering, due to physical variations 19
(e.g. particle size and shape, sample packing and sample surface, etc.) inherent within the individual 20
samples. Therefore, the separation of the spectral contributions due to variations in chemical 21
compositions from those caused by physical variations is crucial to accurate quantitative spectroscopic 22
analysis of heterogeneous samples. In this work, an improved strategy has been proposed to estimate the 23
multiplicative parameters accounting for multiplicative effects in each measured spectrum, and hence 24
mitigate the detrimental influence of multiplicative effects on the quantitative spectroscopic analysis of 25
heterogeneous samples. The basic assumption of the proposed method is that light scattering due to 26
physical variations has the same effects on the spectral contributions of each of the spectroscopically 27
active chemical component in the same sample mixture. Based on this underlying assumption, the 28
proposed method realizes the efficient estimation of the multiplicative parameters by solving a simple 29
quadratic programming problem. The performance of the proposed method has been tested on two 30
publicly available benchmark data sets (i.e. near-infrared total diffuse transmittance spectra of 31
four-component suspension samples and near infrared spectral data of meat samples) and compared 32
with some empirical approaches designed for the same purpose. It was found that the proposed method 33
provided appreciable improvement in quantitative spectroscopic analysis of heterogeneous mixture 34
samples. The study indicates that accurate quantitative spectroscopic analysis of heterogeneous mixture 35
samples can be achieved through the combination of spectroscopic techniques with smart modeling 36
methodology. 37
38
39
Keywords: Heterogeneous mixture samples, Multiplicative light scattering effects, Modified optical 40
path-length estimation and correction, Dual calibration strategy, Spectroscopic quantitative analysis 41
42
3
1. Introduction 43
The quantitative analysis of heterogeneous mixture samples using conventional instruments such as 44
HPLC generally involves troublesome and time-consuming sample preparations. Due to their high 45
measuring speed, multiplicity of analysis, non-destructivity, flexibility and especially requirement of 46
less or even no sample preparations, spectroscopic technologies such as near infrared (NIR), mid 47
infrared (MIR) and Fourier-transform Raman spectroscopy (FT-Raman) have been increasingly applied 48
to the analysis of complex systems in areas of chemicals, food processing, agriculture and 49
pharmaceuticals, etc 1-6
. However, when analyzing complex heterogeneous mixture samples that exhibit 50
sample-to-sample variability in physical properties using spectroscopic instrumentation, the 51
multiplicative light scattering effects caused by the uncontrolled variations in optical path length due to 52
the physical differences between samples (e.g. particle size and shape, sample packing, and sample 53
surface, etc) would „scale‟ the entire spectral measurement and hence mask the spectral variations 54
relating to the content differences of chemical compounds in the samples 7. The presence of dominant 55
multiplicative effects in spectral data could invalidate the underlying assumption of commonly used 56
multivariate linear calibration methods such as PCR 8 and PLS
9 which postulates a linear relationship 57
between spectral measurements and the contents of chemical components, and hence significantly 58
deteriorate the predictive performance of calibration models built by multivariate linear calibration 59
methods. The separation of the spectral contributions due to variations in chemical compositions from 60
those caused by multiplicative effects is therefore crucial to the accurate quantitative analysis of messy 61
spectral data with multiplicative effects. 62

4
A number of chemometric pre-processing methods, e.g., Multiplicative Signal Correction (MSC) 7, 63
Standard Normal Variate (SNV) 10
, Inverted Signal Correction (ISC) 11
, Extended Inverted Signal 64
Correction (EISC) 12
, Extended MSC (EMSC) 13
and Modified EMSC 14
have been proposed to remove 65
the multiplicative effects caused by variations in physical properties of samples. However MSC, ISC 66
and EISC could only be applied to a spectrum that has wavelength regions containing no chemical 67
information, i.e. influenced only by the multiplicative effects. Otherwise, they could result in 68
dramatically poor results. The applicability of EMSC and the modified EMSC is limited due to the 69
requirement of the pure spectra for all spectroscopically active chemical components present in the 70
samples which is difficult to satisfy in practice. 71
Recently, Thennadil et al. proposed an interesting approach for the correction of multiple light 72
scattering effects by making use of radiative transfer theory 15-16
. Though this approach can to some 73
extent improve the predictive performance of multivariate calibration models, its implementation 74
complexity and the requirement of three measurements for each mixture sample (i.e. total diffuse 75
transmittance, total diffuse reflectance and collimated transmittance) make it difficult to use in practice. 76
More recently in a review of pharmaceutical applications of separation of absorption and scattering in 77
near-infrared spectroscopy, similar concepts to the approach mentioned above are discussed 17
. Another 78
similar approach to compensate for the scattering effects in reflectance spectroscopy was developed by 79
Kessler et al. by integrating Kubelka–Munk equation with multivariate curve resolution (MCR) 18
. Like 80
the method based on radiative transfer theory, the application of hard model constrained MCR–ALS 81
algorithm is dependent on the availability of two measurements for each mixture sample (i.e. the diffuse 82

5
reflectance spectra of a sample with an optically infinite thickness and a sample of finite thickness). 83
Hence the scope of its applicability is also limited. 84
To overcome these limitations, one of the present authors developed a novel multiplicative effect 85
correction approach, Optical Path-Length Estimation and Correction (OPLEC) 19, 20
. OPLEC adopted 86
the following two-step procedure for the correction of multiplicative effects in spectral measurements. 87
First of all, the multiplicative parameters accounting for multiplicative effects in the spectral 88
measurements of the calibration samples are estimated by a unique method deduced solely from the 89
linear transformation of the calibration spectral measurements. And then the multiplicative effects in the 90
spectral measurements of the test samples are efficiently removed by a dual-calibration strategy. 91
Without placing any requirement on the spectral measurements, OPLEC can efficiently separate the 92
multiplicative effects of samples‟ physical properties from the spectral variations related to the chemical 93
compositions, and hence has much wider applicability than other methods reported in the literature. The 94
development of OPLEC provided an important contribution to the solution of multiplicative light 95
scattering issues. Whereas the first step of OPLEC, i.e. the estimation of the multiplicative parameters 96
for the calibration samples, involves the determination of the number of spectroscopically active 97
chemical components in the systems under study. A poor estimation of the number of chemical 98
components would result in suboptimal performance of OPLEC. For complex systems, the estimation of 99
the number of chemical components is not a trivial task. Therefore, the OPLEC method needs to be 100
refined to realize its full potential for spectroscopic quantitative analysis of heterogeneous mixtures. 101
The objectives of this study were (1) to redesign the method in OPLEC for the estimation of the 102
multiplicative parameters for the spectral measurements of the calibration samples, (2) to develop a 103

6
simple but effective approach for determining the optimal model parameter (i.e. the number of 104
spectroscopically active chemical components) in OPLEC, (3) to improve the robustness of OPLEC 105
when being applied to complex systems, and finally (4) to evaluate the performance of the modified 106
OPLEC method on two publicly available benchmark data sets. 107
108
109
2. Theory 110
2.1 The dual calibration strategy adopted by OPLEC to correct multiplicative effects 111
For spectral measurements with multiplicative effects caused by changes in the optical path-length due 112
to the physical variations of the samples, the measured spectrum (xi, row vector) of sample i composed 113
of J chemical components can be approximated by the following model 6, 7, 21
: 114
J
j
jjiii Iicp1
, ,1,2, , sx
(
1)
Where ci, j is the concentration of the j-th chemical component in the i-th mixture sample; sj represents 115
the pure spectrum of j-th chemical component in the mixtures. The coefficient pi accounts for the 116
multiplicative effects in the spectral measurements of the i-th sample caused by changes in the optical 117
path-length due to the physical variations of the sample; I denotes the number of calibration samples. 118
Assume the first component is the target constituent in the mixtures andJ
j
jjic1
, 1s (which strictly 119
hold for ci,j representing unit-free concentration such as weight fraction and mole fraction), then eq.1 120
can also be expressed as: 121
7
2
3
,211, , ssssssx j
J
j
jjjiiiiii cppcp (2)
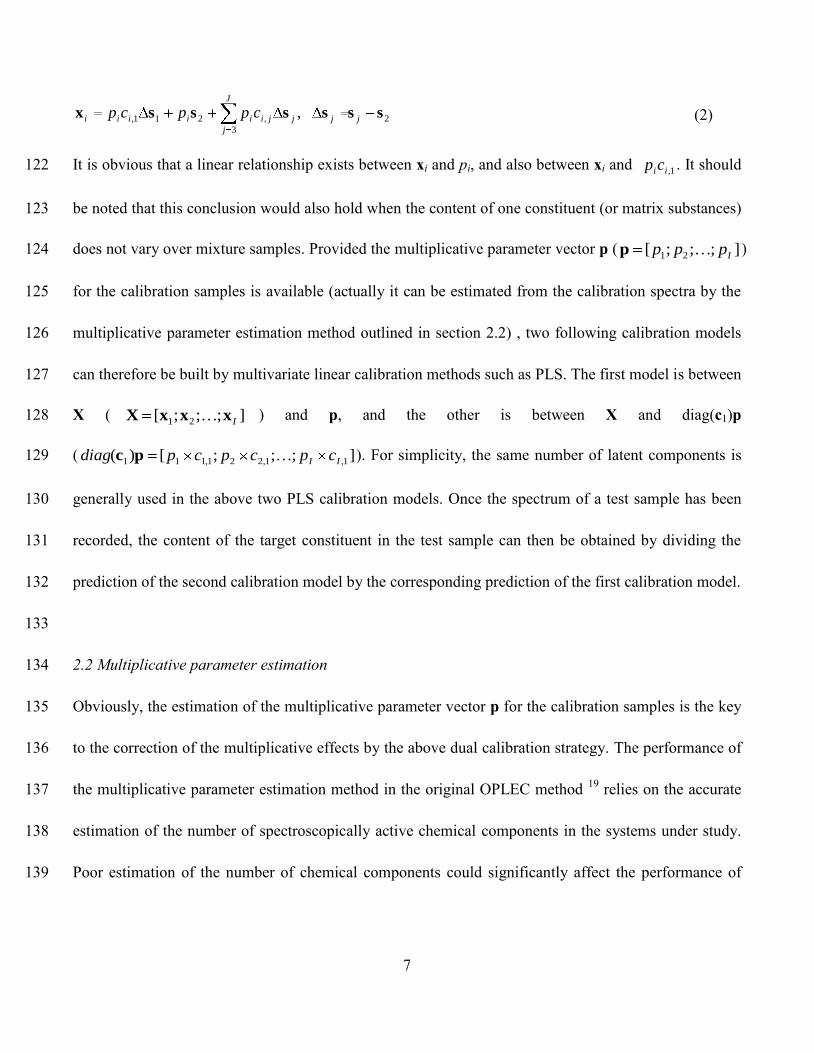
It is obvious that a linear relationship exists between xi and pi, and also between xi and 1,iicp . It should 122
be noted that this conclusion would also hold when the content of one constituent (or matrix substances) 123
does not vary over mixture samples. Provided the multiplicative parameter vector p ( ];;;[ 21 Ippp p ) 124
for the calibration samples is available (actually it can be estimated from the calibration spectra by the 125
multiplicative parameter estimation method outlined in section 2.2) , two following calibration models 126
can therefore be built by multivariate linear calibration methods such as PLS. The first model is between 127
X ( ];;;[ 21 IxxxX ) and p, and the other is between X and diag(c1)p 128
( ];;;[)( 1,1,221,111 II cpcpcpdiag pc ). For simplicity, the same number of latent components is 129
generally used in the above two PLS calibration models. Once the spectrum of a test sample has been 130
recorded, the content of the target constituent in the test sample can then be obtained by dividing the 131
prediction of the second calibration model by the corresponding prediction of the first calibration model. 132
133
2.2 Multiplicative parameter estimation 134
Obviously, the estimation of the multiplicative parameter vector p for the calibration samples is the key 135
to the correction of the multiplicative effects by the above dual calibration strategy. The performance of 136
the multiplicative parameter estimation method in the original OPLEC method 19
relies on the accurate 137
estimation of the number of spectroscopically active chemical components in the systems under study. 138
Poor estimation of the number of chemical components could significantly affect the performance of 139
8
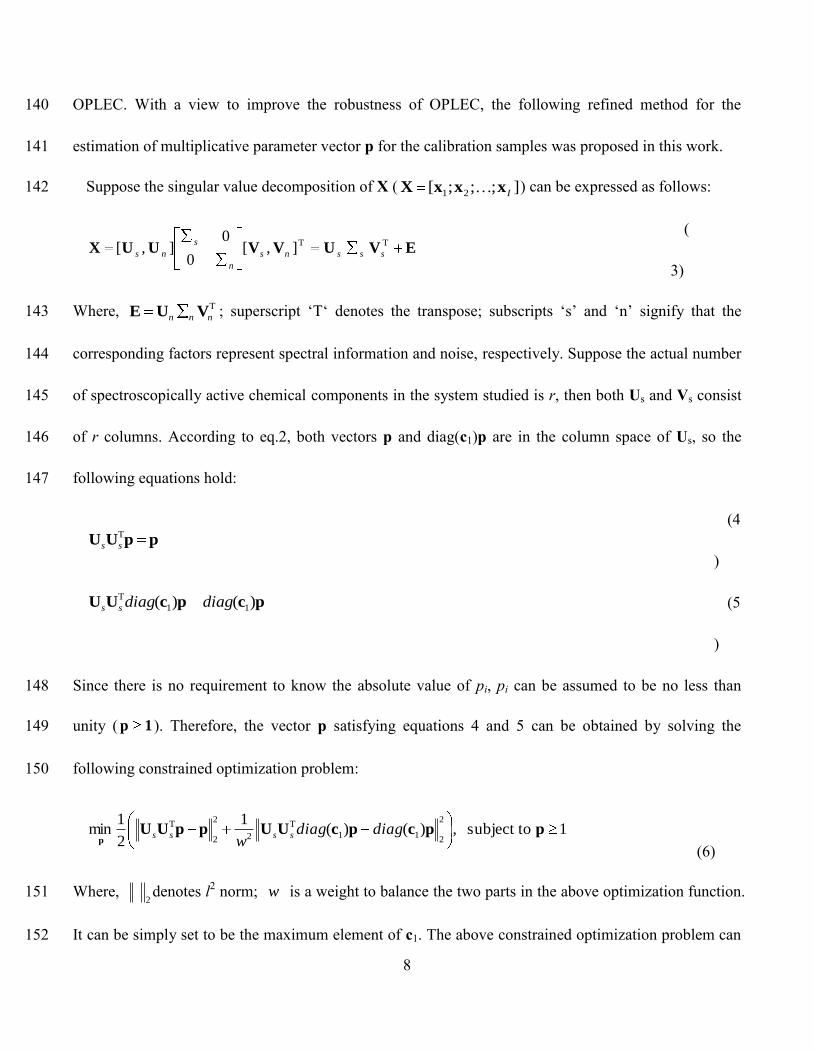
OPLEC. With a view to improve the robustness of OPLEC, the following refined method for the 140
estimation of multiplicative parameter vector p for the calibration samples was proposed in this work. 141
Suppose the singular value decomposition of X ( ];;;[ 21 IxxxX ) can be expressed as follows: 142
EVUVVUUXTT],[
0
0],[ sssns
n
s
ns
(
3)
Where, T
nnn VUE ; superscript „T„ denotes the transpose; subscripts „s‟ and „n‟ signify that the 143
corresponding factors represent spectral information and noise, respectively. Suppose the actual number 144
of spectroscopically active chemical components in the system studied is r, then both Us and Vs consist 145
of r columns. According to eq.2, both vectors p and diag(c1)p are in the column space of Us, so the 146
following equations hold: 147
ppUUT
ss
(4
)
pcpcUU )()( 11
T diagdiagss (5
)
Since there is no requirement to know the absolute value of pi, pi can be assumed to be no less than 148
unity ( 1p ). Therefore, the vector p satisfying equations 4 and 5 can be obtained by solving the 149
following constrained optimization problem: 150
1 subject to ,)()(1
2
1min
2
211
T
2
2
2
TppcpcUUppUU
pdiagdiag
wssss
(6)
Where, 2denotes l
2 norm; w is a weight to balance the two parts in the above optimization function. 151
It can be simply set to be the maximum element of c1. The above constrained optimization problem can 152
9
be transformed into an equivalent quadratic programming problem (which can be resolved by the 153
quadprog function in MATLAB. The MATLAB code for the multiplicative parameter estimation 154
method is available in Supporting Information): 155
1- such that ,))/())(/()((2
1)(min 1
T
1
TTppcUUIcUUIpp
pwdiagwdiagf ssss (7)
156
2.3 Determination of the number of columns in Us 157
Theoretically, the number of columns in Us (i.e. parameter r) should equal to the number of 158
spectroscopically active chemical components in the systems under study. It is generally difficult to 159
determine the exact number of spectroscopically active chemical components in a complex system. 160
Moreover, when the spectral data does not strictly obey the model in eq. 1, the optimal number of 161
columns in Us might not solely depend on the number of spectroscopically active chemical components 162
in the system under study, which would further complicate the situation. Fortunately, a simple 163
mathematical analysis reveals that )(min pp
f decreases dramatically with the increase of r at the very 164
start, and then tends to be steady when r exceeds certain threshold value. Therefore, the optimal value of 165
r can be determined by locating the turning point in the plot of )(min pp
f versus r. 166
167
168
3. Case studies 169
The effectiveness of the modified OPLEC method (hereafter referred to OPLECm) with respect to its 170
ability to estimate multiplicative parameters was first tested on the near-infrared total diffuse 171
transmittance spectra of four-component suspension system consisting of water, deuterium, ethanol, and 172

10
polystyrene (hereafter referred to four-component suspension data). To further explore the potential of 173
OPLECm, another real-world near-infrared transmittance spectra of meat samples recorded on a Tecator 174
Infratec Food and Feed Analyzer (hereafter referred to tecator data) is employed. This spectral data set 175
is publicly available and hence ensures that the interested reader can repeat the analysis. 176
177
3.1 Four-component suspension data16
178
The four-component suspension system is composed of three fully miscible absorbing species of water, 179
deuterium oxide and ethanol and a species that both absorbs and scatters light (i.e., a particulate species 180
of polystyrene). Specifically, the range of particle size and concentration were chosen to be 100~500 nm 181
and 1~5 wt%, respectively, such that the following conditions were satisfied: stable suspension, multiple 182
scattering, and sufficient signals in measurement. A total of 42 samples were prepared using various 183
combinations of the concentrations of the four components and particle sizes of which the total diffuse 184
transmittance (Td) spectra were recorded on a scanning spectrophotometer (CARY 5000) fitted with a 185
diffuse reflectance accessory (DRA-2500). The spectral data were collected in the wavelength region of 186
1500-1880 nm with an interval of 2nm, resulting in measurements at 191 discrete wavelengths per 187
spectrum. Twenty-two suspension samples‟ spectra were randomly selected to construct the calibration 188
data set. The remaining twenty spectra from the other suspension samples made up the test data set. The 189
absorbing-only species of deuterium oxide with concentration range between 20% and 58 wt% was 190
taken as the analyte of interest in the present analysis and all the total diffuse transmittance spectra were 191
transformed into absorbance spectra prior to the analysis. More experimental details can be found in the 192
original paper of Steponavicius and Thennadil16
. 193
11
194
3.2 Tecator data22
195
This benchmark spectral data set consists of the near-infrared absorbance spectra of 240 meat samples 196
recorded on a Tecator Infratec Food and Feed Analyzer working in the wavelength range 850-1050 nm 197
with an interval of 2nm by the Near Infrared Transmission principle. Each sample contains finely 198
chopped pure meat with different moisture, fat and protein contents. A Soxhlet method was used as the 199
laboratory reference for fat determination. The Soxhlet values ranged from 2% to 59% fat. The 240 200
spectra were divided into 5 data sets for the purpose of model validation and extrapolation studies 201
(calibration set: 129; validation set: 43; test set: 43; extrapolation set for fat: 8; extrapolation set for 202
protein: 7). The task in the present work is restricted to predict the fat content (%) of a meat sample on 203
the basis of its near infrared absorbance spectrum, the extrapolation set for protein is therefore excluded. 204
The tecator data is available at http://lib.stat.cmu.edu/datasets/tecator. 205
206
3.3 Data pre-treatment 207
For the aforementioned two data sets, the possible additive baseline effects and wavelength dependent 208
spectral variations were firstly removed by projecting the measured spectra onto the orthogonal 209
complement of the space spanned by the row vectors of ];;[ 2λλ1M
19. The pre-processed spectra 210
were then used to calculate the multiplicative parameter vector p for the calibration samples. The dual 211
calibration models in OPLECm were built on the pre-processed spectra by using PLS method. The 212
predictive performance of OPLECm was compared with those of PLS calibration models with and 213
without the application of data preprocessing methods such as MSC, SNV, EISC and EMSC as long as 214
12
they are applicable. The root-mean-square error of prediction (RMSEP) was used to assess the 215
performance of the calibration models. 216
217
218
4. Results and discussion 219
4.1 Four-component suspension data 220
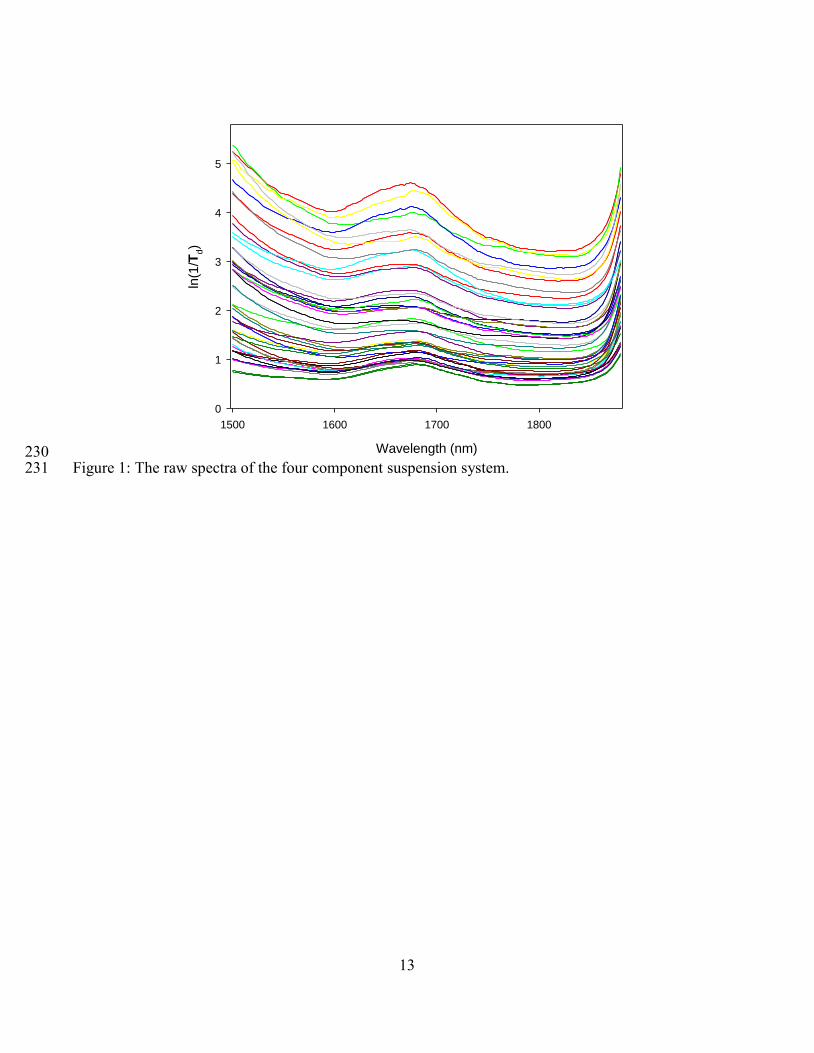
The raw total transmittance spectra of the four-component suspension samples are presented in Figure 1. 221
It can be observed that the variations in polystyrene particle size and concentration across samples 222
resulted in significant additive baseline shift as well as multiplicative effects in the spectral data. 223
Though the additive baseline effects and possible wavelength dependent spectral variations can be 224
readily removed by orthogonal projection pre-processing, the multiplicative effects as a consequence of 225
the changes in sample‟s effective optical path-length are rather difficult to correct. Such multiplicative 226
effects can not be effectively modeled by multivariate linear calibration models either. Without being 227
properly corrected or modeled, they can significantly deteriorate the predictive performance of 228
multivariate linear calibration models 13, 19
. 229
13
Wavelength (nm)
1500 1600 1700 1800
ln(1
/Td)
0
1
2
3
4
5
230 Figure 1: The raw spectra of the four component suspension system. 231

14
As stated in the theory section, OPLECm can effectively correct the multiplicative effects in spectral 232
measurements. OPLECm consists of two main steps. The first step is to estimate the multiplicative 233
parameter vector p for the calibration samples from the orthogonal projection pre-processed spectra. 234
The estimation of the multiplicative parameter vector p for the calibration samples requires the 235
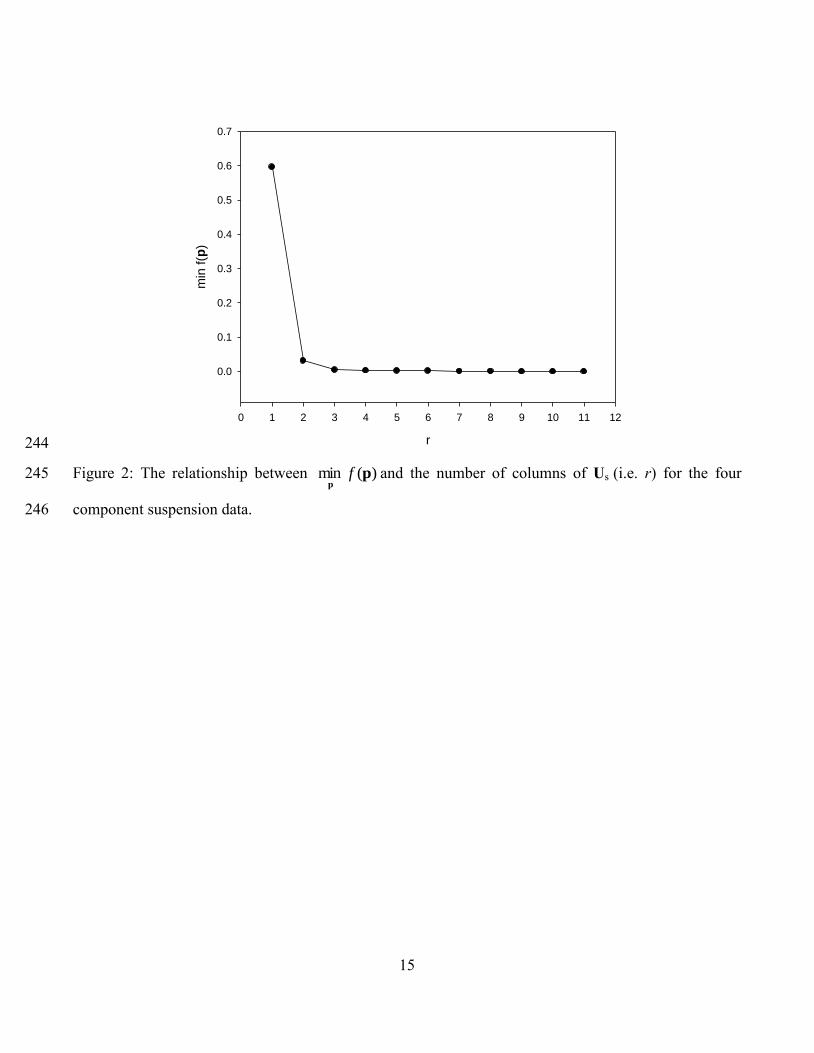
determination of the actual number of spectral variation sources (r) in the calibration spectra, which can 236
be achieved by scrutinizing the plot of )(min pp
f versus r (Figure 2). From Figure 2, it can be seen that 237
)(min pp
f decreases obviously when the number of columns of Us increases from one to three and 238
including more components in Us leads to no significant changes in )(min pp
f , which means the most 239
spectral information relevant to p and diag(c1)p was included in the first three principal components of 240
Us. Therefore, the optimal value of r was then set to three. 241
242
243
15
r
0 1 2 3 4 5 6 7 8 9 10 11 12
min
f(p
)
0.0
0.1
0.2
0.3
0.4
0.5
0.6
0.7
244
Figure 2: The relationship between )(min pp
f and the number of columns of Us (i.e. r) for the four 245
component suspension data. 246
16
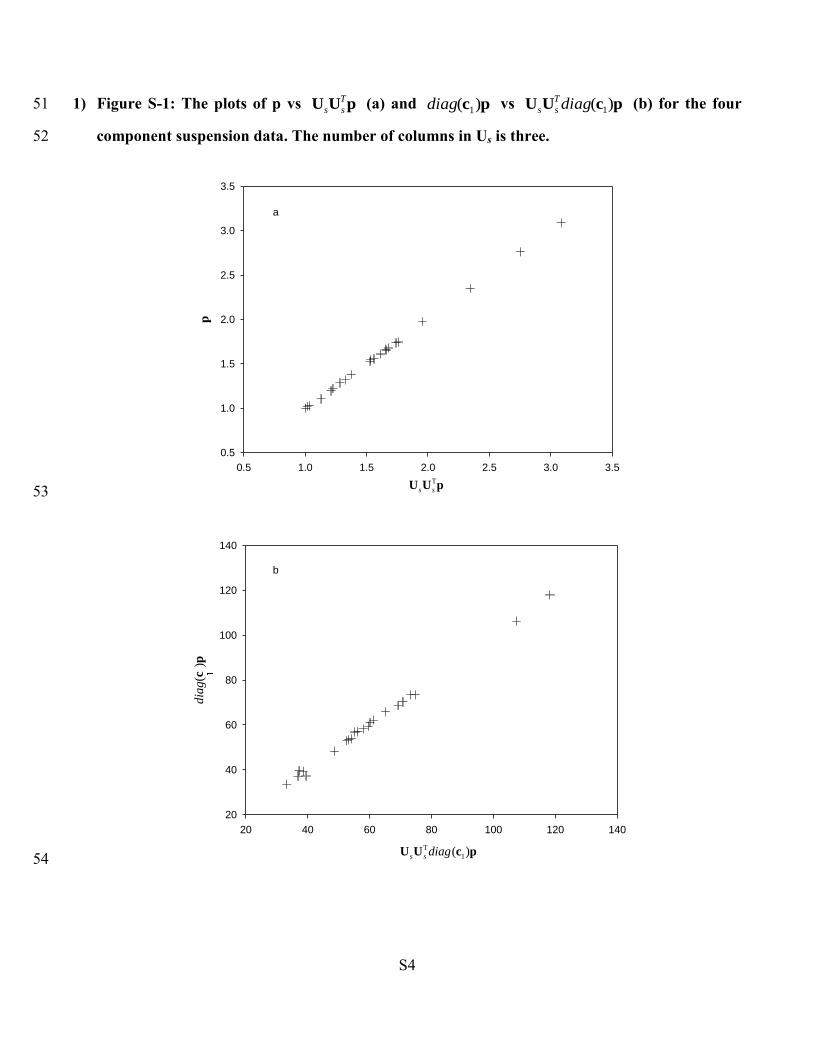
After the estimation of the multiplicative parameter vector p for the calibration samples, one can 247
assess the applicability of OPLECm to the spectral data set by examining the two plots of p vs pUUT
ss 248
and pc )( 1diag vs pcUU )( 1diagT
ss, respectively (supporting information, Figure S-1). As shown in 249
Figure S-1, both p and pc )( 1diag are in good agreement with pUUT
ss and pcUU )( 1diagT
ss , 250
respectively, which confirms that a linear relationship exists between xi and pi, and also between xi and 251
1,iicp . The dual calibration strategy of OPLECm is therefore applicable to the four component 252
suspension data. Figure S-1 also reveals the presence of significant variations of multiplicative effects 253
(pi varying from 1 to 3.09) in the calibration samples. Multiplicative effect correction methods such as 254
OPLECm are therefore needed to remove such significant multiplicative effects in the spectral 255
measurements. 256
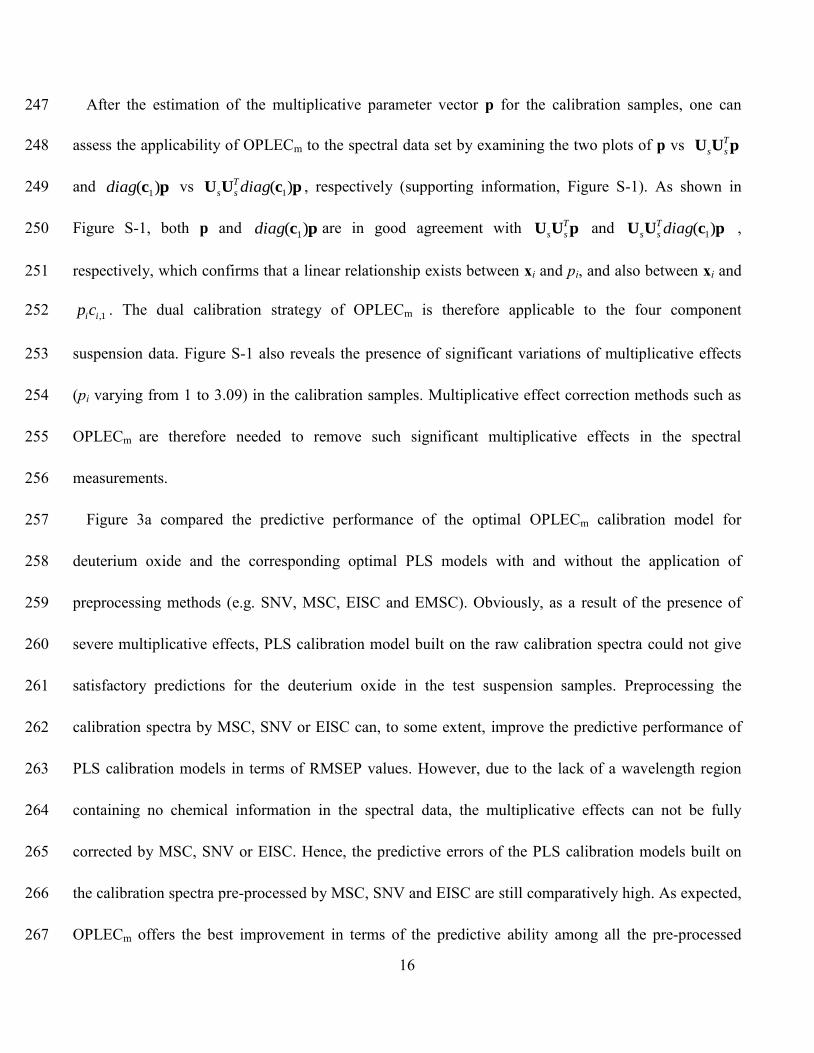
Figure 3a compared the predictive performance of the optimal OPLECm calibration model for 257
deuterium oxide and the corresponding optimal PLS models with and without the application of 258
preprocessing methods (e.g. SNV, MSC, EISC and EMSC). Obviously, as a result of the presence of 259
severe multiplicative effects, PLS calibration model built on the raw calibration spectra could not give 260
satisfactory predictions for the deuterium oxide in the test suspension samples. Preprocessing the 261
calibration spectra by MSC, SNV or EISC can, to some extent, improve the predictive performance of 262
PLS calibration models in terms of RMSEP values. However, due to the lack of a wavelength region 263
containing no chemical information in the spectral data, the multiplicative effects can not be fully 264
corrected by MSC, SNV or EISC. Hence, the predictive errors of the PLS calibration models built on 265
the calibration spectra pre-processed by MSC, SNV and EISC are still comparatively high. As expected, 266
OPLECm offers the best improvement in terms of the predictive ability among all the pre-processed 267

17
methods. The OPLECm calibration model with five underlying components provided the best predictive 268
results with a RMSEPtest value as low as 0.005, while the corresponding best RMSEPtest value of the 269
PLS calibration model with nine underlying components on the calibration spectra pre-processed by 270
EISC is 0.009. Furthermore, the performance of the OPLECm is robust to the number of columns in Us 271
(Figure 3b). Considering the fact that OPLECm does not place any extra requirement on the spectral 272
measurements as other multiplicative effect correction methods do, such a result is quite encouraging. 273
274
18
Number of PLS components
0 1 2 3 4 5 6 7 8 9 10 11 12 13 14 15 16
RM
SE
P (
%)
0
1
2
3
4
5 a
275
r
0 1 2 3 4 5 6 7 8
RM
SE
P (
%)
0.4
0.6
0.8
1.0
1.2
1.4
1.6
1.8
b
276
Figure 3: a) The predictive performance of OPLECm and the PLS models built on the calibration spectra 277
of the four component suspension system preprocessed by different methods (black circle: the raw 278
spectra; red star: MSC; green triangle down: SNV; pink diamond: EISC; blue square: OPLECm); b) The 279
predictive performance of the optimal OPLECm models when Us with different number of columns (r) 280
were used in the calculation of the multiplicative parameter vector p for the calibration spectra. 281

19
4.2 Tecator data 282
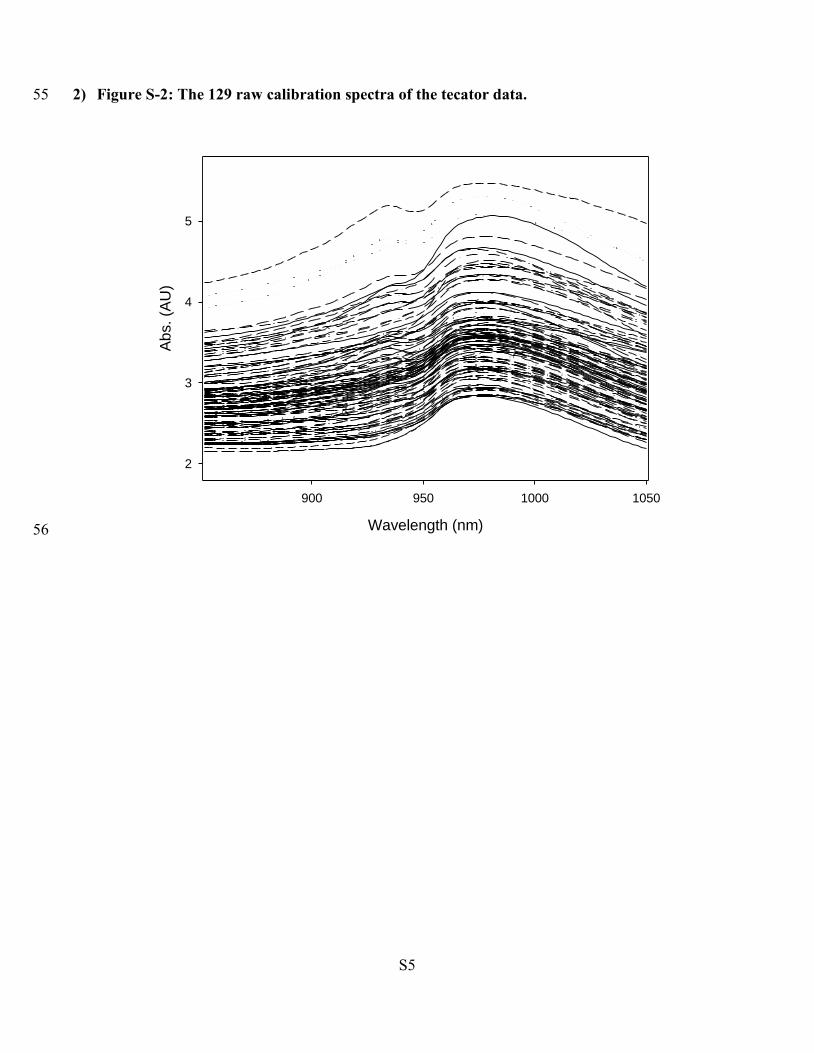
As in four component suspension data, there are significant additive baseline effects in the tecator data 283
(supporting information, Figure S-2). Since the changes in physical properties of samples generally 284
result in both additive baseline effects and multiplicative effects, the presence of significant additive 285
baseline effects strongly suggests the existence of multiplicative effects. OPLECm was therefore used to 286
estimate the multiplicative parameter vector p for the calibration samples from the corresponding 287
orthogonal projection pre-processed calibration spectra as described in section 3.3. During the 288
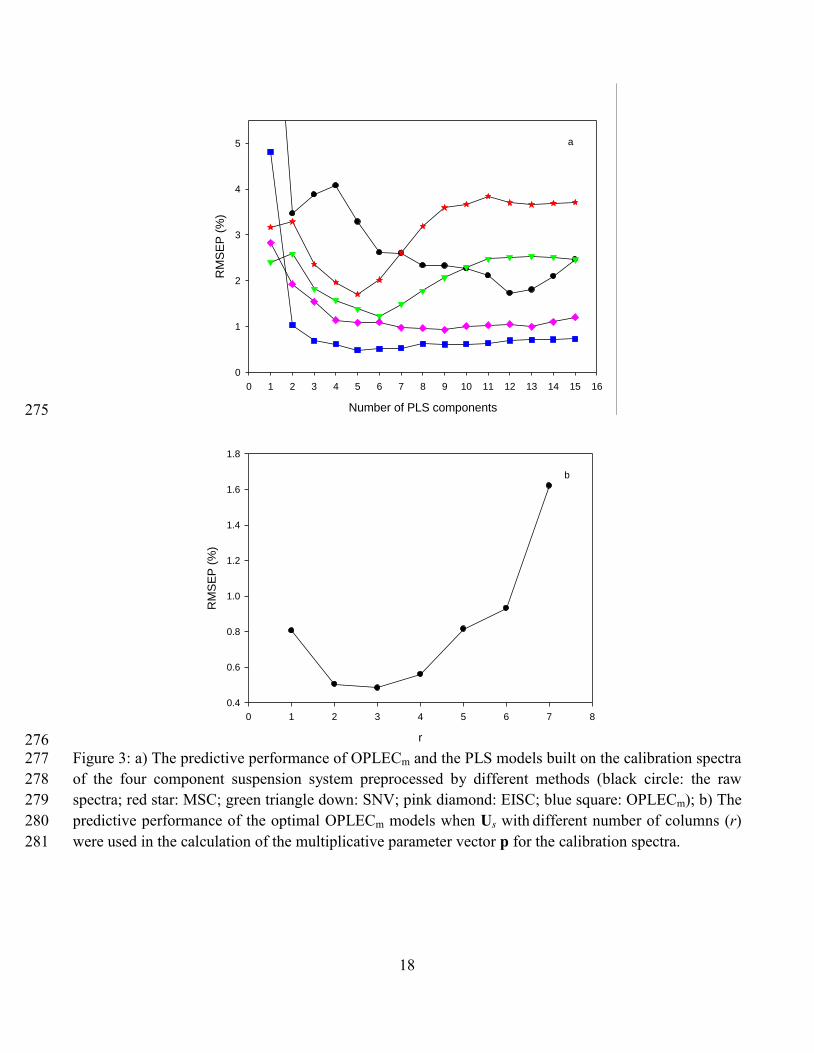
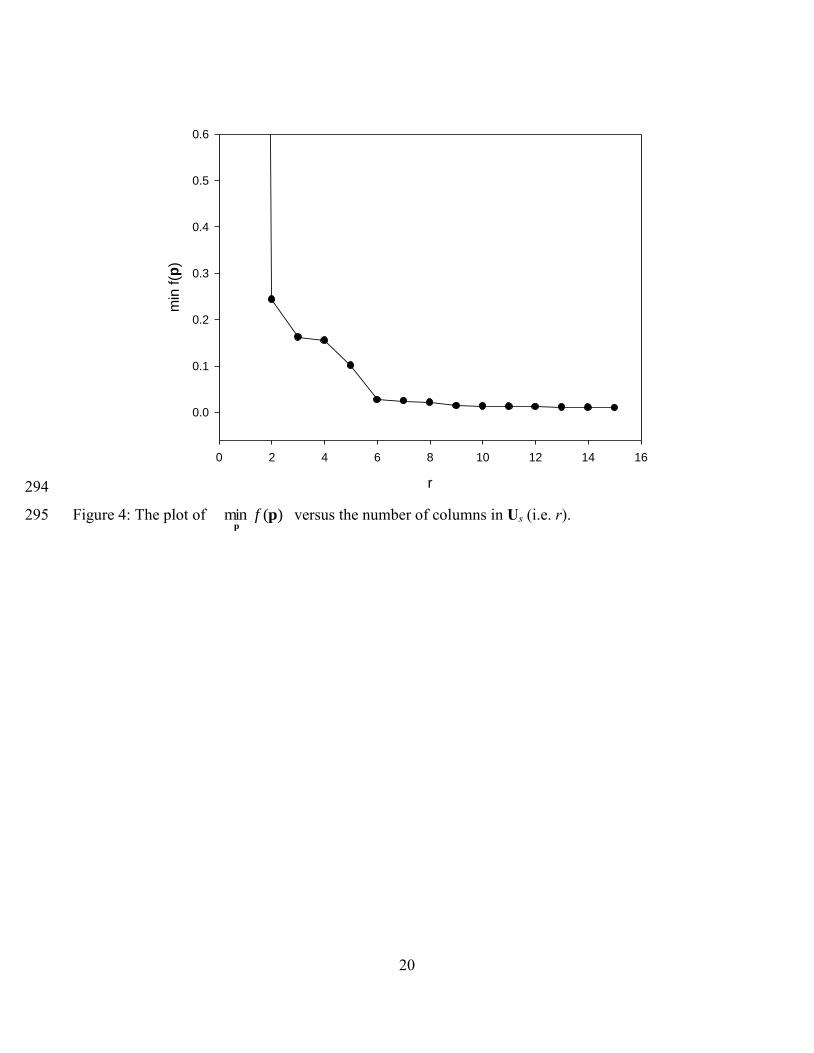
estimation of the multiplicative parameter vector p for the calibration samples using OPLECm, the 289
optimal number of columns included in Us (i.e. r) is determined by scrutinizing the plot of )(min pp
f 290
versus r (Figure 4). It can be seen that )(min pp
f drops sharply as the r increases from one to six, and 291
then decreases slowly along with the further increase of r (Figure 4). One can therefore choose six as the 292
optimal number of columns of Us. 293
20
r
0 2 4 6 8 10 12 14 16
min
f(p
)
0.0
0.1
0.2
0.3
0.4
0.5
0.6
294
Figure 4: The plot of )(min pp
f versus the number of columns in Us (i.e. r). 295

21
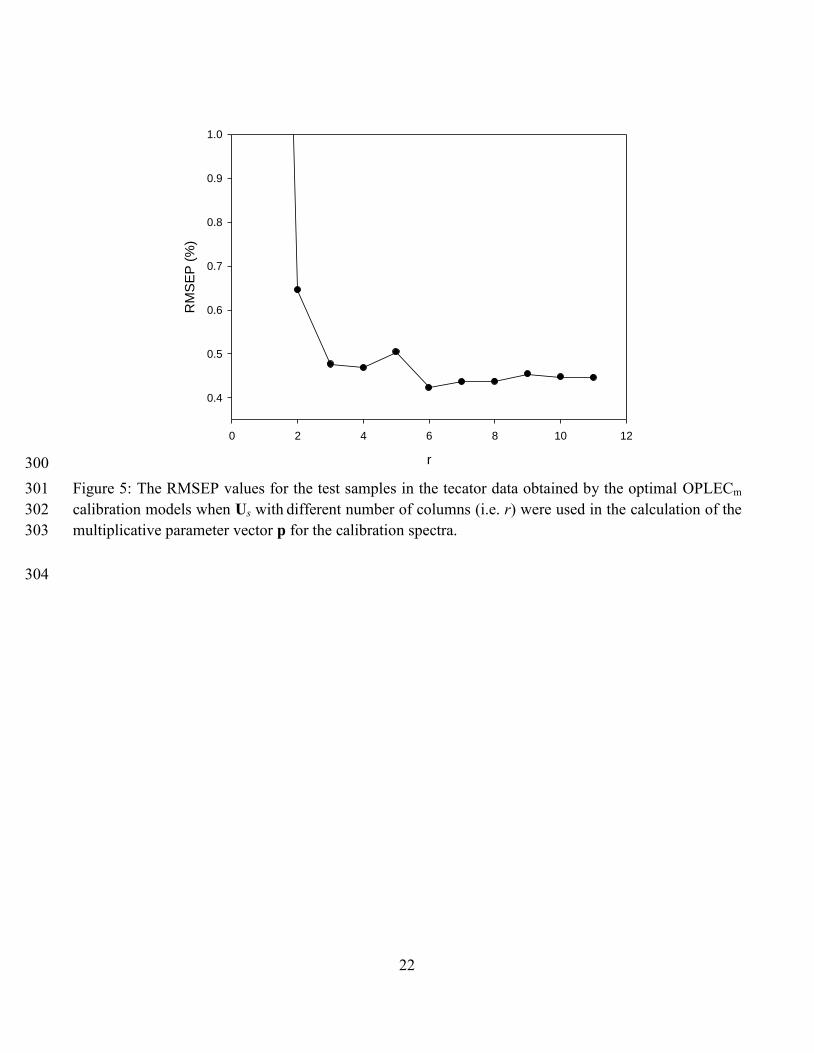
It is worth to point out again that the performance of OPLECm is quite robust to the choice of r as long 296
as r is big enough but not too large. As shown in Figure 5, The RMSEP value of OPLECm for the test 297
samples shows no significant difference when r taking a value between 6 and 11. In practice, such a 298
feature of OPLECm can make it more user-friendly when being applied to complex systems. 299
22
r
0 2 4 6 8 10 12
RM
SE
P (
%)
0.4
0.5
0.6
0.7
0.8
0.9
1.0
300
Figure 5: The RMSEP values for the test samples in the tecator data obtained by the optimal OPLECm 301
calibration models when Us with different number of columns (i.e. r) were used in the calculation of the 302
multiplicative parameter vector p for the calibration spectra. 303
304

23
After the estimation of the multiplicative parameter vector p for the calibration samples, the dual 305
calibration strategy of OPLECm was adopted to mitigate the detrimental of multiplicative effects on the 306
prediction of the fat content. PLS calibration models with and without the application of MSC, SNV and 307
EISC were also established for comparison purposes. The optimal number of underlying components 308
used in the dual calibration models of OPLEC as well as those PLS calibration models was chosen to be 309
the one with minimal root-mean-square error of prediction (RMSEP) for the validation set. The results 310
of OPLECm along with those of the four optimal PLS calibration models with and without the 311
application of MSC, SNV and EISC were shown in Figure 6. 312
24
PLS MSC SNV EISC OPLECm
RM
SE
P (
%)
0
2
8
10
12
14
test set
validation set
calibration set
extrapolation set
313
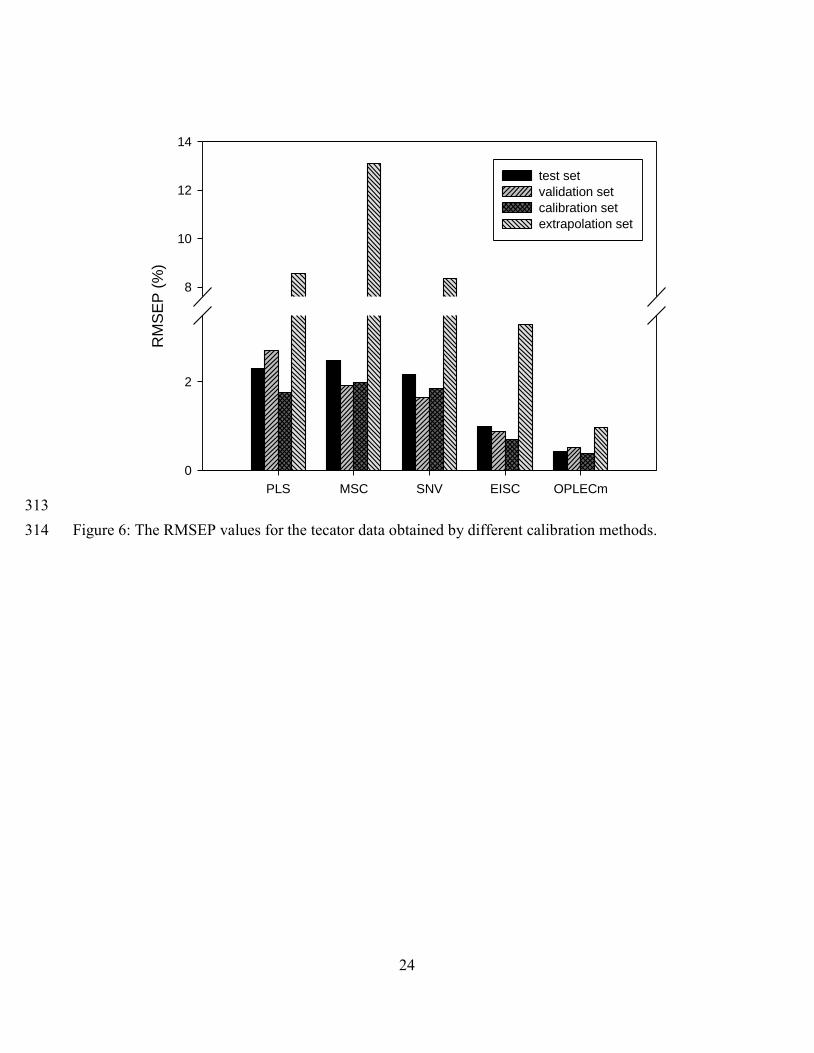
Figure 6: The RMSEP values for the tecator data obtained by different calibration methods. 314
25
Figure 6 reveals that although the number of latent components (i.e. fourteen) used is sufficiently 315
large, the optimal PLS calibration model on the raw calibration spectra did not give satisfactory 316
predictions for all the four data sets. The RMSEP values for the calibration, validation, test and 317
extrapolation sets are 1.7%, 2.7%, 2.3% and 8.5%, respectively. The application of the empirical 318
multiplicative light scattering correction method, SNV saw no significant changes in the RMSEP values 319
for the four data sets. While preprocessing the spectral data by MSC resulted in a dramatic increase in 320
the RMSEP value for the extrapolation set which clearly demonstrates its limitation in practical 321
applications. The EISC preprocessing method surprisingly succeeded in improving the quality of the 322
predictions of PLS calibration model for the tecator data. Its RMSEP values for the calibration, 323
validation, test and extrapolation sets are 0.7%, 0.9%, 1.0% and 3.3%, respectively. The reasons of its 324
success in this particular data set are unclear. As expected, OPLECm outperformed all the other methods 325
with RMSEP values for the calibration, validation, test and extrapolation sets equaling to 0.4%, 0.5%, 326
0.4% and 1.0%, respectively, This remarkable improvement further confirmed the effectiveness of 327
OPLECm in mitigating the detrimental influence of multiplicative effects on the spectroscopic 328
quantitative analysis of heterogeneous mixture samples. 329
330
331
5. Conclusion 332
The separation of the spectral contributions due to variations in chemical compositions from 333
multiplicative effects caused by physical variations is crucial to the accurate quantitative analysis of 334
complex heterogeneous mixture samples using spectroscopic instruments. In this work, a modified 335
26
version of Optical Path-Length Correction and Estimation (OPLECm) method has been developed to 336
correct the multiplicative effects in spectral measurements. OPLECm differs from the original OPLEC 337
method in the way of estimating the multiplicative parameters for the calibration samples. In OPLECm, 338
the multiplicative parameters for the calibration samples were obtained by solving a constrained 339
quadratic programming problem, which is much more efficient than the counterpart in the original 340
OPLEC. Furthermore, a simple but effective method has been proposed for the determination of the 341
model parameter involved (i.e. the number of spectroscopically active chemical components in the 342
system under study). Due to the unique multiplicative parameter estimation strategy, the performance of 343
OPLECm is much more robust to the choice of the model parameter involved, which makes OPLECm 344
more user-friendly when being applied to complex systems. The performance of OPLECm has been 345
tested on four-component suspension spectral data set and one publicly available benchmark spectral 346
data set. Experimental results reveal that OPLECm can achieve satisfactory quantitative results from the 347
spectroscopic measurements of heterogeneous mixtures. Compared with other existing methods 348
designed for the same purpose, OPLECm has features of implementation simplicity, wider applicability 349
as well as better performance in terms of quantitative accuracy, and therefore has great potential in 350
quantitative spectroscopic analysis of complex heterogeneous systems. 351
352
353
354
355
356

27
Acknowledgements 357
The authors acknowledge the financial support of the National Natural Science Foundation of China 358
(grant no. 21075034), “973” National Key Basic Research Program of China (grant no. 2007CB310500) 359
and the Fundamental Research Funds for the Central Universities of China and also Marie Curie FP6 360
(INTROSPECT).. 361
362
363
Supporting Information Available 364
MATLAB code for the modified OPLEC, the plots of p vs pUUT
ssand pc )( 1diag vs pcUU )( 1diagT
ss 365
for the four component suspension data, the 129 raw calibration spectra of the tecator data. This material 366
is available free of charge via the Internet at http://pubs.acs.org. 367
368
369
28
References: 370
(1) H.W. Siesler, Y. Ozaki, S. Kawata, H.M. Heise, Near-infrared spectroscopy: principal, 371
instruments, applications,WILEY-VCH, Weinheim, 2002 372
(2) P. Fayolle, D. Picque, G. Corrieu, Monitoring of fermentation processes producing lactic acid 373
bacteria by mid-infrared spectroscopy, Vib. Spectrosc. 1997, 14, 247-252 374
(3) Y. Roggo, C. Roeseler, M. Ulmschneider, Near infrared spectroscopy for qualitative comparison 375
of pharmaceutical batches, J. Pharm. Biomed. Anal. 2004, 36, 777–786 376
(4) A. Nordon, D. Littlejohn, A.S. Dann, P.A. Jeffkins, M.D. Richardson, S.L. Stimpson, In situ 377
monitoring of a seed stage of a fermentation process using non-invasive NIR spectrometry, The 378
Analyst, 2008, 133, 660-666 379
(5) Z.P. Chen, G. Fevotte, A. Caillet, D. Littlejohn, J. Morris, An advanced calibration strategy for 380
in-situ quantitative monitoring of phase transition processes in suspensions using FT-Raman 381
spectroscopy, Anal. Chem. 2008, 80, 6658-6665 382
(6) Z.P. Chen, J. Morris, A. Borissova, S. Khan, T. Mahmud, R. Penchev, K.J. Roberts, On-line 383
monitoring of batch cooling crystallization of organic compounds using ATR-FTIR spectroscopy 384
coupled with an advanced calibration method, Chemom. Intell. Lab. Syst. 2009, 96, 49–58 385
(7) P. Geladi, D. MacDougall, H. Martens, Linearization and Scatter-Correction for Near-Infrared 386
Reflectance Spectra of Meat, Appl. Spectrosc. 1985, 39 (3), 491-500 387

29
(8) I.A. Cowe, J.W. McNicol, The Use of Principal Components in the Analysis of Near-Infrared 388
Spectra, Appl. Spectrosc. 1985, 39 (2), 257-266 389
(9) H. Martens, M. Martens, Multivariate Analysis of Quality: An Introduction, John Wiley and Sons: 390
Chichester, 2001 391
(10) R.J. Barnes, M.S. Dhanoa, S.J. Lister, Standard Normal Variate Transformation and De-trending 392
of Near-Infrared Diffuse Reflectance Spectra, Appl. Spectrosc. 1989, 43 (5), 772-777 393
(11) I.S. Helland, T. Næs, T. Isaksson, Related versions of the multiplicative scatter correction method 394
for preprocessing spectroscopic data, Chemom. Intell. Lab. Syst. 1995, 29 (2), 233-241 395
(12) D. Pedersen, H. Martens, J. Nielsen, S. Engelsen, Near-infrared absorption and scattering 396
separated by extended inverted signal correction (EISC): Analysis of near-infrared transmittance 397
spectra of single wheat seeds, Appl. Spectrosc. 2002, 56 (9), 1206-1214 398
(13) H. Martens, J.P. Nielsen, S.B. Engelsen, Light Scattering and Light Absorbance Separated by 399
Extended Multiplicative Signal Correction. Application to Near-Infrared Transmission Analysis of 400
Powder Mixtures, Anal. Chem. 2003, 75 (3), 394-404 401
(14) S.N. Thennadil, H. Martens, A. Kohler, Physics-based multiplicative scatter correction approaches 402
for improving the performance of calibration models, Appl. Spectrosc. 2006, 60, 315-321 403
(15) R. Steponavicius, S.N. Thennadil, Extraction of chemical information of suspensions using 404
radiative transfer theory to remove multiple scattering effects: application to a model 405
two-component system, Anal. Chem. 2009, 81, 7713–7723 406
30
(16) R. Steponavicius, S.N. Thennadil, Extraction of chemical information of suspensions using 407
Radiative transfer theory to remove multiple scattering effects: application to a model 408
multicomponent system, Anal. Chem. 2011, 83, 1931-1937 409
(17) Z. Shi, C. Andersen, Pharmaceutical applications of separation of absorption and scattering in 410
near-infrared spectroscopy (NIRS), J. Pharm. Sci. 2010, 99, 4766-4783 411
(18) W. Kessler, D. Oelkrug, R. Kessler, Using scattering and absorption spectra as MCR-hard model 412
constraints for diffuse reflectance measurements of tablets, Anal. Chim. Acta, 2009, 642, 127–134 413
(19) Z.P.Chen, J. Morris, E. Martin, Extracting Chemical Information from Spectral Data with 414
Multiplicative Light Scattering Effects by Optical Path-Length Estimation and Correction, Anal. 415
Chem. 2006, 78(9), 7674-7681 416
(20) Z.P.Chen, L.J. Zhong, A. Nordon, D. Littlejohn, M. Holden, M. Fazenda, L. Harvey, B. McNeil, 417
J. Faulkner, J. Morris, Calibration of Multiplexed Fiber-Optic Spectroscopy, Anal. Chem. 2011, 418
83(7), 2655-2659 419
(21) Z.P. Chen, J. Morris, Improving the linearity of spectroscopic data subjected to fluctuations in 420
external variables by the extended loading space standardization, The Analyst, 2008, 133, 914-922 421
(22) C. Borggaard, H.H. Thodberg, Optimal minimal neural interpretation of spectra, Anal. Chem. 422
1992, 64, 545-551 423
31
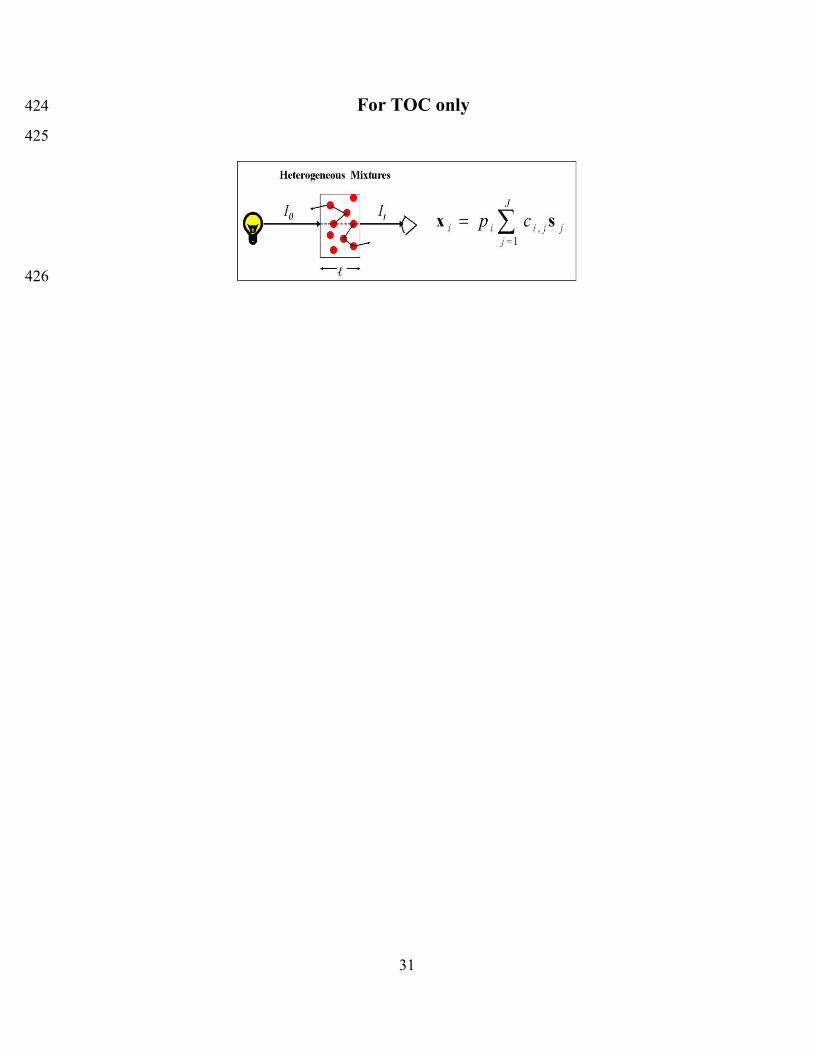
For TOC only 424
425
426
S1
Supporting Information 1
2
Title of the primary article: 3
Quantitative Spectroscopic Analysis of Heterogeneous Mixtures: the Correction of Multiplicative 4
Effects Caused by Variations in Physical Properties of Samples 5
Authors’ names: 6
Jing-Wen Jina, Zeng-Ping Chen*
a, Li-Mei Li
a, Raimundas Steponavicius
b, Suresh N. Thennadil
c, Jing 7
Yanga and Ru-Qin Yu*
a 8
Affiliations: 9
a. State Key Laboratory of Chemo/Biosensing and Chemometrics, College of Chemistry and Chemical 10
Engineering, Hunan University, Changsha, Hunan, 410082, PR China 11
b. School of Chemical Engineering and Advanced Materials, Newcastle University, Merz Court, 12
Newcastle upon Tyne, NE1 7RU, United Kingdom 13
c. Chemical and Process Engineering, University of Strathclyde, 75 Montrose Street, Glasgow, G1 1XJ, 14
United Kingdom 15
Table of content: 16
1) The MATLAB code for the modified OPLEC method 17
2) Figure S-1: The plots of p vs pUUT
ss (a) and pc )( 1diag vs pcUU )( 1
Tdiagss (b) for the four 18
component suspension data. 19
3) Figure S-2: The 129 raw calibration spectra of the tecator data. 20
21

S2
The MATLAB code for the modified OPLEC method 22
% [p, fval] = OPLECm(X, c, CompNumb); 23
% This is an m-file for the estimation of the multiplicative effect vector p for calibration samples; 24
% X contains ix in its rows;
ix ( Ii ,,2,1 ) are the spectra of I calibration samples. 25
% c is the concentration vector of the target chemical component in the calibration samples; 26
% CompNumb is the number of spectroscopically active chemical components in mixture samples; 27
% p is a vector containing the multiplicative scattering parameters for the calibration samples; 28
% fval is the value of objective function at p; 29
30
function [p, fval]=OPLECm(X, c, CompNumb); 31
[U,S,V]=svd(X); 32
Us= U(:,1:CompNumb); 33
n=length(c); 34
w=max(c); 35
H1=eye(n, n)- Us* Us'; 36
H2= diag(c./w)*H1* diag(c./w); 37

S3
H=H1+H2; % matrix H in min(0.5*p'*H*p+f'*p); 38
f=zeros(n,1); % vector f in min(0.5*p'*H*p+f'*p); 39
A=-eye(n,n); % matrix A in A*p<=b; 40
b=-ones(n,1); % vector b in A*p<=b; 41
StartingVect=ones(n,1); 42
options=optimset('quadprog'); 43
options=optimset(options,'LargeScale','off','Display','off'); 44
[p,fval]=quadprog(H,f,A,b,[],[],[],[],StartingVect,options); 45
% After obtaining the model parameter vector p for calibration samples, two calibration models are built 46
using the standard PLS toolbox. One is between the concentration vector ( c ) of the target chemical 47
component and the spectral data X; the other is between pc)(diag and X. The multiplicative effect on 48
the test sample can then be corrected through dividing the prediction of the second calibration model by 49
the prediction of the first calibration model. 50
S4
1) Figure S-1: The plots of p vs pUUT
ss (a) and pc )( 1diag vs pcUU )( 1diagT
ss (b) for the four 51
component suspension data. The number of columns in Us is three. 52
0.5 1.0 1.5 2.0 2.5 3.0 3.5
p
0.5
1.0
1.5
2.0
2.5
3.0
3.5
T
s sU U p
a
53
20 40 60 80 100 120 140
dia
g(c
)p
20
40
60
80
100
120
140
T
1( )s s diagU U c p
b
54
S5
2) Figure S-2: The 129 raw calibration spectra of the tecator data. 55
Wavelength (nm)
900 950 1000 1050
Ab
s. (A
U)
2
3
4
5
56


