

2011 National Geographic Channel Australian Geography Competition
Question Booklet
I N S T R U C T I O N S
1 Fill in your name, school code (your teacher will give you this), school’s
postcode, your gender and age. You must fill in the ovals, not just write the
letters and numbers, as the computer only reads the ovals. For example, a
filled-in postcode (for some other school) would look like the sample on the
right. Also fill in an oval in the school assigned column if instructed to do so by
your teacher. Otherwise leave it blank.
2 If you are 13 years or under on 31 August 2011 complete Questions 1-30, or
continue to Question 40 to be eligible for major prizes.
3 If you are 14 or 15 years old on 31 August 2011 complete Questions 1-40.
4 If you are 16 to 18 years old on 31 August 2011 complete Questions 16-50.
5 Answer all questions by filling in only one oval on the answer sheet
corresponding to the most appropriate answer for each question.
6 You have 35 minutes to answer the questions. The time to fill in the preliminary
information is extra.
7 Do not mark the front or back of the answer sheet in any other way as this can
lead to errors in the computerized marking, or to your not getting a result.

National Geographic Channel Australian Geography Competition 2011
Page 2
1 In Figure 1, which country is located in the western part of the map?
A Cambodia
B China
C Colombia
D Croatia
E Cuba
2 The location of which city is marked with a red square in Figure 1?
A Beijing
B Pyongyang
C Seoul
D Taipei
E Vladivostok
3 Which country to North Korea’s east, feels directly threatened by its missile testing?
A Australia
B Indonesia
C Japan
D New Zealand
E Thailand
Start at Question 1 if you are under 16 years old on 31 August 2011. Start at Question 16 if you are older.
NORTHKOREA
SOUTHKOREA
N
100 km
Figure 1 © D. Dalet, d-maps.com
4 Which crop is shown in the photo in Figure 2?
A peanuts
B potatoes
C rice
D sugar cane
E sunflowers
5 In Table 1, which country is North Korea?
A Country A
B Country B
C Country C
D Country D
E Country E
Figure 2. A farm in South Korea © Minyoung Choi
Table 1. Selected statistics for Australia, China, Japan, North Korea, South Korea Source: CIA World Factbook 2011
Country A Country B Country C Country D Country E
Population (millions) 1 330 127 49 23 22
Population growth rate p.a. (%) 0.494 -0.242 0.258 0.389 1.171
Median age (years) 35.2 44.6 37.9 33.9 37.5
GDP per capita (US $) 7 400 34 200 30 200 1 800 41 300

National Geographic Channel Australian Geography Competition 2011
Page 3
6 In Table 1, which country is Japan?
A Country A
B Country B
C Country C
D Country D
E Country E
7 Western Australia’s booming economy is mainly due to its:
A agricultural industry
B financial industry
C manufacturing industry
D mining industry
E services industry
11 Metamorphic is to marble as igneous is to:
A conglomerate
B granite
C limestone
D sandstone
E sedimentary
8 Which type of diagram is shown in Figure 3?
A disc chart
B halo chart
C pie chart
D ring chart
E round chart
9 From Figure 3, which statement is correct?
A Australia has half the forest area of Brazil.
B Australia has less forest area than Indonesia.
C Australia has more forest area than United States.
D Australia has 1% of the world’s forest area.
E Australia has the seventh largest area of forest in the world.
10 Russia’s very extensive forests are mainly:
A coniferous
B deciduous
C epiphytic
D mangrove
E rainforest
Russian FederationBrazilCanadaUnited StatesChinaDem Rep CongoAustralia IndonesiaSudanOthers (each less than 2% of total)
Figure 3. The world’s forest areas 2010, by country Source: FAO
12 What does Figure 4 show?
A feeding fish-farmed salmon
B installing a shark net off a Gold Coast beach
C removing an algal bloom from Lake Geneva
D skimming oil after the spill in the Gulf of Mexico
E trawling for prawns in the Bay of Bengal
13 The mine from which 33 Chilean miners were rescued in October 2010 is located in the:
A Atacama Desert
B Gobi Desert
C Kalahari Desert
D Mojave Desert
E Sonoran Desert
Figure 4 © J. Radcliffe
National Geographic Channel Australian Geography Competition 2011
Page 4
N
49
48
47
46
45
44
43
49
48
47
46
45
44
43
A
B
C
D
E
F
G
A
B
C
D
E
F
G
73 74 75 76 771 2 3 4 5 6105°40´
73 74 75 76 771 2 3 4 5 6105°40´
10°25´ 10°25´
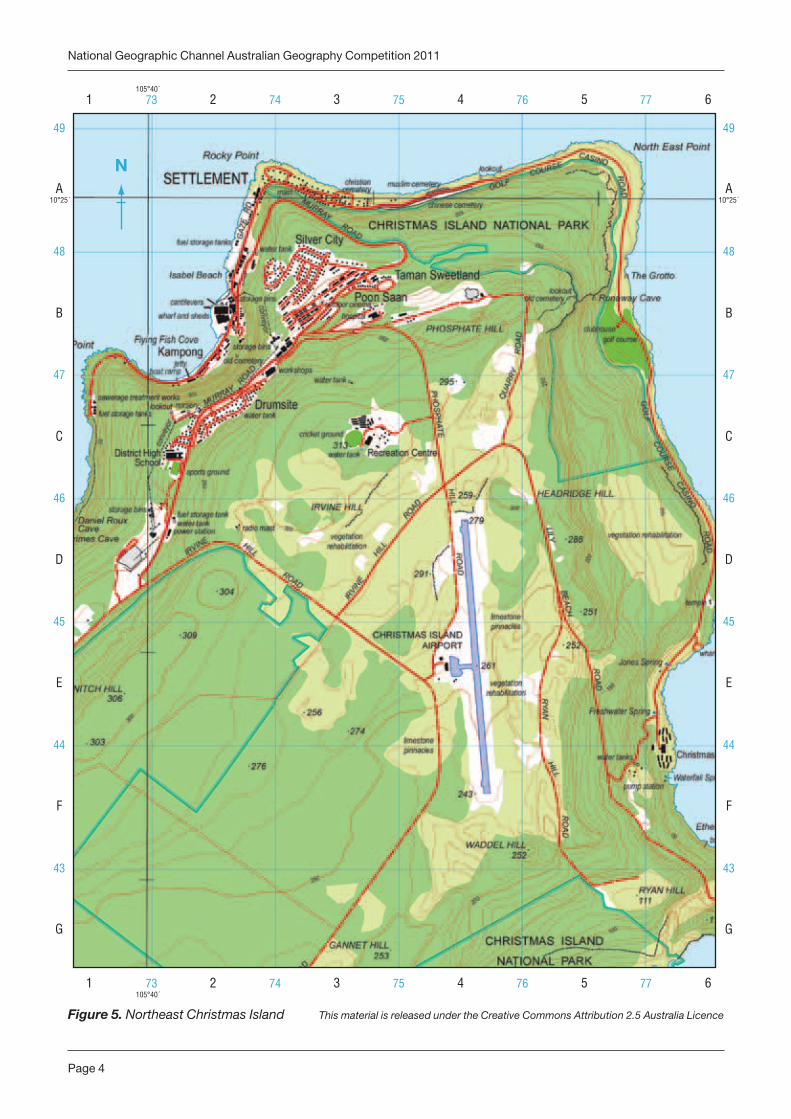
Figure 5. Northeast Christmas Island This material is released under the Creative Commons Attribution 2.5 Australia Licence
National Geographic Channel Australian Geography Competition 2011
Page 5
14 In which ocean is Christmas Island, as shown in Figure 5?
A Arctic
B Atlantic
C Indian
D Pacific
E Southern
15 Which features are found directly to the southwest of North East Point (square A5 in Figure 5)?
A foot track, sealed road, prohibited area boundary
B foot track, unsealed road, reserved area boundary
C sealed road, reserved area boundary, cliff
D sealed road, reserved area boundary, vehicle track
E unsealed road, prohibited area boundary, foot track
Start at Question 16 if you are 16 to 18 years old on 31 August 2011. If you are younger, continue answering questions.
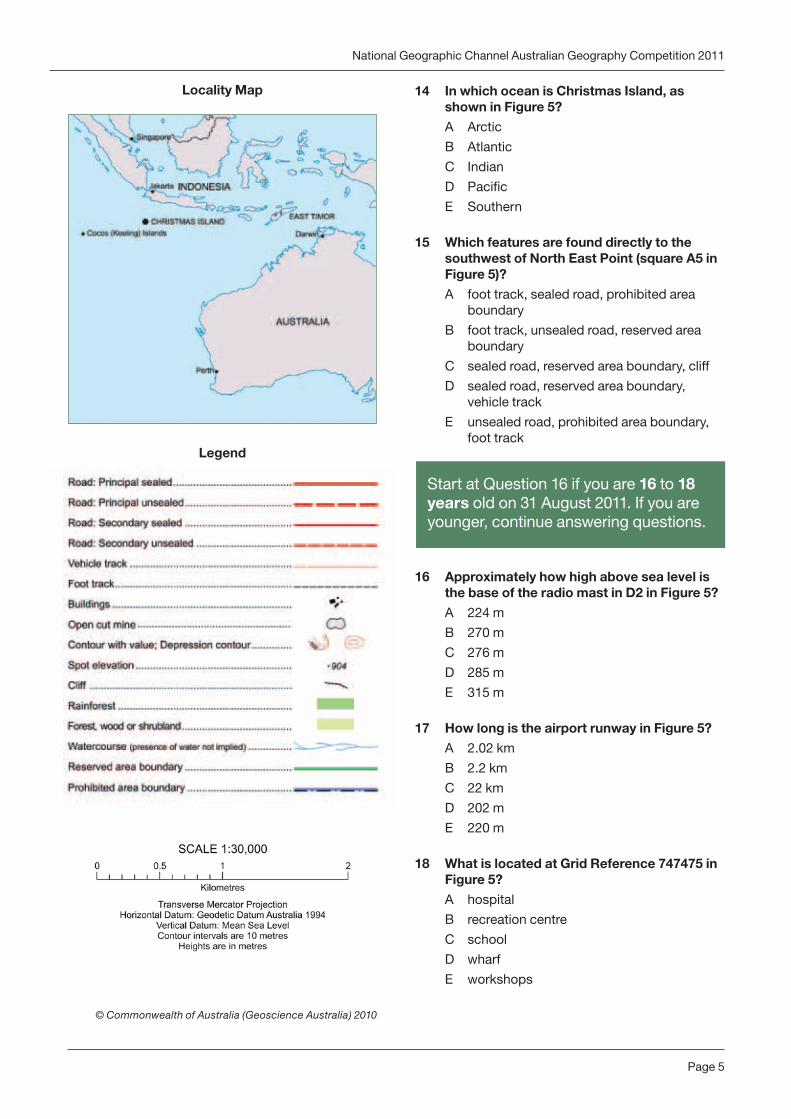
16 Approximately how high above sea level is the base of the radio mast in D2 in Figure 5?
A 224 m
B 270 m
C 276 m
D 285 m
E 315 m
17 How long is the airport runway in Figure 5?
A 2.02 km
B 2.2 km
C 22 km
D 202 m
E 220 m
18 What is located at Grid Reference 747475 in Figure 5?
A hospital
B recreation centre
C school
D wharf
E workshops
Locality Map
Legend
© Commonwealth of Australia (Geoscience Australia) 2010

National Geographic Channel Australian Geography Competition 2011
Page 6
19 This part of Christmas Island is typical of the whole island. Which statement best describes the island’s relief?
A It has a broad coastal plain rising to a high peak.
B It is uniformly flat.
C It rises steeply from the sea to a central plateau.
D It slopes from southern sea cliffs down to a low-lying northern shore.
E It slopes from western sea cliffs down to a low-lying eastern shore.
20 Which type of climate does Christmas Island have?
A alpine
B arid
C Mediterranean
D temperate
E tropical
21 What is the birthplace of approximately 30% of Christmas Island residents? (The features in square A4 and place names in B2 and B3 give clues.)
A Fiji
B Greece
C Ireland
D Malaysia
E New Zealand
22 Which type of island is Christmas Island?
A archipelago
B atoll
C continental island
D coral cay
E summit of a submarine mountain
23 What caused the major air traffic shut-down in April 2010, reportedly the largest ever?
A eruption of Eyjafjallajökull
B global warming
C heavy snow in northern Europe
D prolonged strike by airport staff
E terrorism attack in New York
25 For the city in Figure 6, what is the mean rainfall in March?
A 18 mm
B 25 mm
C 32 mm
D 319 mm
E 422 mm
Fold this page back on itself to see the map at the same time.
Table 2. Asylum applications submitted in selected industrialised countries, 2009 Source: UNHCR
CountryNumber of
applicationsApplications per 1000 inhabitants
Australia 6 170 0.3
France 41 980 0.7
Japan 1 380 0.0
New Zealand 340 0.1
Norway 17 230 3.6
United Kingdom 29 840 0.5
United States 49 020 0.2
24 From Table 2, in 2009 which of these industrialised countries received the largest number of asylum applications on a per capita basis?
A Australia
B France
C Japan
D Norway
E United States
Figure 6. Climate graph for a city
© Bureau of Meteorology
0
100
200
300
400
500
600
Tem
per
atur
e (°
C)
Rai
nfal
l (m
m)
mean maximum temperaturemean minimum temperaturemean rainfall
0
5
10
15
20
25
30
35
DecNovOctSepAugJulJunMayAprMarFebJan
National Geographic Channel Australian Geography Competition 2011
Page 7
26 The city in Figure 6:
A gets most of its rainfall in winter
B has a continental climate
C has distinct wet and dry seasons
D never gets a temperature below 17°C
E all of the above
27 The climate graph in Figure 6 is for which city?
A Adelaide
B Brisbane
C Darwin
D Perth
E Sydney
28 Which Australian state has approximately 32% of Australia’s population and 10% of its area?
A New South Wales
B Queensland
C South Australia
D Tasmania
E Western Australia
29 The Asia Pacific Economic Cooperation (APEC) multilateral forum focusses on:
A cultural and community ties
B defence and security
C emigration and immigration
D human rights and freedoms
E trade and investment
30 Last year (2010) was Queensland’s wettest year on record. This was mainly due to the influence of:
A cold lows
B Coriolis force
C El Niño
D La Niña
E ozone hole
If you are under 14 years old on 31 August 2011 you may stop at Question 30 or continue to Question 40 to be eligible for major prizes.
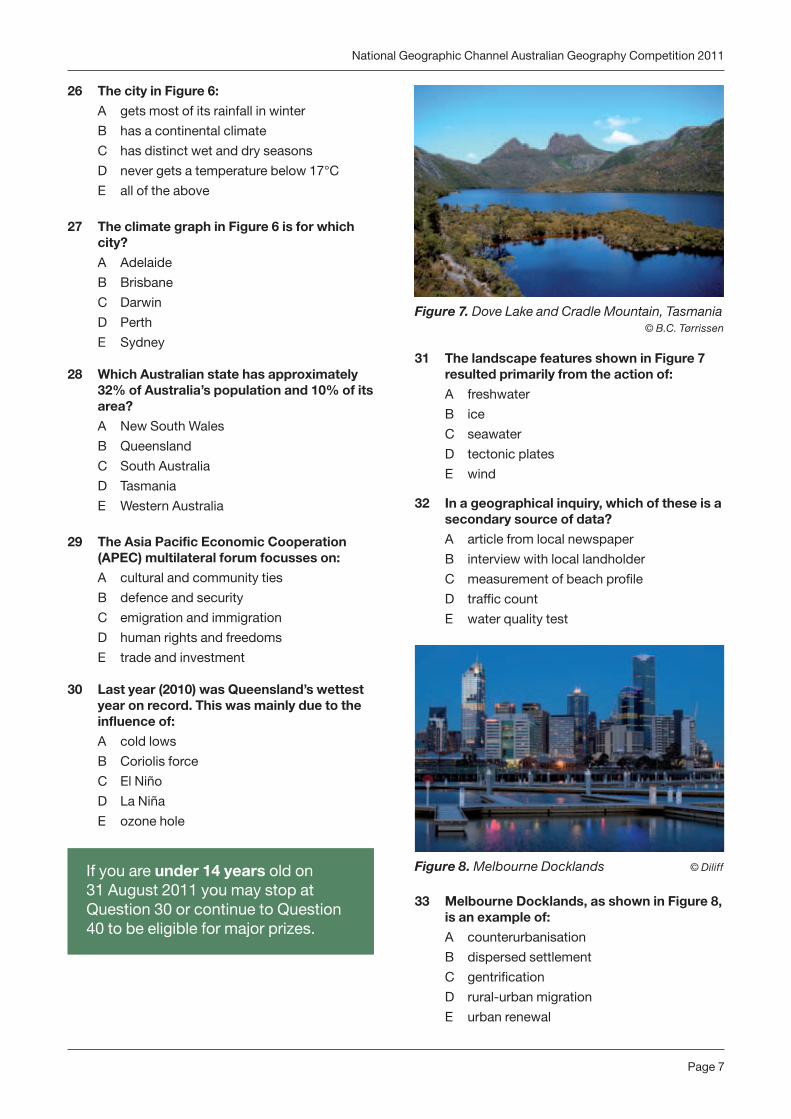
31 The landscape features shown in Figure 7 resulted primarily from the action of:
A freshwater
B ice
C seawater
D tectonic plates
E wind
32 In a geographical inquiry, which of these is a secondary source of data?
A article from local newspaper
B interview with local landholder
C measurement of beach profile
D traffic count
E water quality test
Figure 7. Dove Lake and Cradle Mountain, Tasmania
© B.C. Tørrissen
Figure 8. Melbourne Docklands © Diliff
33 Melbourne Docklands, as shown in Figure 8, is an example of:
A counterurbanisation
B dispersed settlement
C gentrification
D rural-urban migration
E urban renewal
National Geographic Channel Australian Geography Competition 2011
Page 8
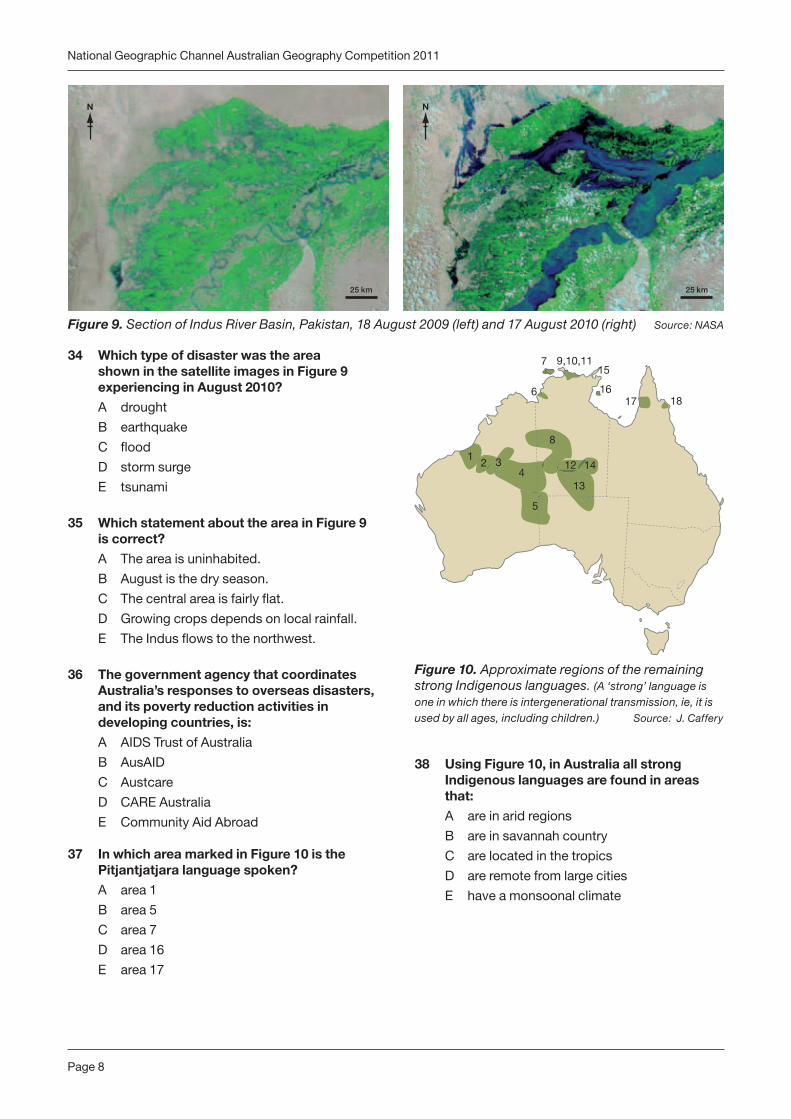
34 Which type of disaster was the area shown in the satellite images in Figure 9 experiencing in August 2010?
A drought
B earthquake
C flood
D storm surge
E tsunami
35 Which statement about the area in Figure 9 is correct?
A The area is uninhabited.
B August is the dry season.
C The central area is fairly flat.
D Growing crops depends on local rainfall.
E The Indus flows to the northwest.
36 The government agency that coordinates Australia’s responses to overseas disasters, and its poverty reduction activities in developing countries, is:
A AIDS Trust of Australia
B AusAID
C Austcare
D CARE Australia
E Community Aid Abroad
37 In which area marked in Figure 10 is the Pitjantjatjara language spoken?
A area 1
B area 5
C area 7
D area 16
E area 17
38 Using Figure 10, in Australia all strong Indigenous languages are found in areas that:
A are in arid regions
B are in savannah country
C are located in the tropics
D are remote from large cities
E have a monsoonal climate
Figure 9. Section of Indus River Basin, Pakistan, 18 August 2009 (left) and 17 August 2010 (right) Source: NASA
25 km 25 km
N N
12 3
4
5
8
6
7 9,10,11
1617 18
1412
13
15
Figure 10. Approximate regions of the remaining strong Indigenous languages. (A ‘strong’ language is one in which there is intergenerational transmission, ie, it is used by all ages, including children.) Source: J. Caffery

National Geographic Channel Australian Geography Competition 2011
Page 9
39 Which of these ecosystems has the least capacity to regenerate after a bush fire?
A eucalypt forest
B grassland
C heathland
D rainforest
E woodland
40 The population of which continent passed 1 billion in 2009/10 and is expected to double by 2050?
A Africa
B Asia
C Europe
D North America
E South America
If you are under 16 years old on 31 August 2011 stop at Question 40. If you are older, continue to Questions 41- 50 on next pages.

National Geographic Channel Australian Geography Competition 2011
Page 10
Figure 11. Distribution and orientation of desert dunefields Source: K.E. Fitzsimmons
Figure 12. Simpson-Strzelecki Dunefields Bioregion Source: National Land & Water Resources Audit
bioregion boundary
state/territory border
N
A
B
C
Figure 14. Strzelecki Desert © C. Grant
• Linear dunefields dominate the arid centre of Australia.
• Linear dunefields show significant variability in their orientation, spacing between dunes, and level of organisation.
• Depressions, called swales, lie between dunes.• Linear dunes lie parallel to the prevailing wind
direction at the time of their formation.• Dune spacing is directly related to sediment
availability – the greater the sediment supply, the closer the dunes.
• Long linear dunes merge at Y junctions, with the ‘tail’ of the Y lying downwind.
Figure 13. Linear dunefield generalisations Adapted from K.E. Fitzsimmons
Figure 15. Satellite image © CNES/SPOT Image Figure 16. Satellite image © CNES/SPOT Image

National Geographic Channel Australian Geography Competition 2011
Page 11
To answer Questions 41 to 50 use the information in Figures 11 to 18, Tables 3 to 4, and your own knowledge.
41 In Australia, desert dunefields form:
A a large anti-clockwise whorl across approximately one-third of Australia
B a large anti-clockwise whorl across approximately two-thirds of Australia
C a large clockwise whorl across approximately one-third of Australia
D a large clockwise whorl across approximately two-thirds of Australia
E a large portion of Australia, but have no apparent pattern
42 In which drainage division are the Simpson-Strzelecki Dunefields?
A Gulf of Carpentaria
B Lake Eyre
C Murray-Darling
D South-East Coast
E Western Plateau
43 What was the prevailing wind direction when the dunes in Figure 15 were formed?
A ESE
B NNE
C NNW
D SSE
E SSW
44 What is the approximate typical distance between dune crests in Figure 15?
A 50 m
B 150 m
C 300 m
D 450 m
E 600 m
45 The dunes shown in Figure 15 are:
A closely spaced and disorganised
B moderately spaced and disorganised
C moderately spaced and organised
D widely spaced and moderately organised
E widely spaced and organised
46 Which option correctly links the satellite images in Figures 15 and 16 with their locations in Figure 12?
A Figure 15 location A; Figure 16 location B
B Figure 15 location A; Figure 16 location C
C Figure 15 location B; Figure 16 location A
D Figure 15 location B; Figure 16 location C
E Figure 15 location C; Figure 16 location A
47 Figure 14 shows the Wild Dog Fence along the Queensland-New South Wales border (with NSW on the right). In which direction was the photographer facing?
A east
B north
C northwest
D south
E west
48 Which feral animal of the Simpson- Strzelecki Dunefields is highly mobile, increasing in number, harming sparse vegetation cover, and damaging pastoral infrastructure such as fences?
A camels
B feral cats
C foxes
D rabbits
E wild dogs
Table 3. Dune spacing classification Source: K.E. Fitzsimmons
Dune spacing Distance between crests
Close <437 m
Moderate 437-623 m
Wide >623 m
Table 4. Dune organisation classification Source: K.E. Fitzsimmons
Level of organisation Junctions/10 km
Disorganised >6
Moderately organised 4-6
Organised <4

National Geographic Channel Australian Geography Competition 2011
Page 12
49 What are the correct age estimates for the samples collected at points A and B in Figure 17?
A A = 10.8 ka; B = 25.1 ka
B A = 21.9 ka; B = 70.8 ka
C A = 32.1 ka; B = 78.8 ka
D A = 44.2 ka; B = 58.6 ka
E A = 53.7 ka; B = 61.4 ka
50 Which statement is accurate?
A Dunes and swales in the Strzelecki Desert are bare of vegetation.
B Dunes in the Strzelecki are typically 300- 500 m wide.
C The dunes in the Strzelecki Desert have been built up continuously over a period of 70,000 years.
D Prevailing winds in the Strzelecki blow from a different direction today than at the time of dune formation.
E The Simpson-Strzelecki Dunefields lie mainly in Queensland.
Thank you for taking part in the 2011 National Geographic Channel Australian Geography Competition.
Figure 17. Cross-section of typical Strzelecki dune, showing sand accumulations from different time periods Source: K.E. Fitzsimmons
modernmobilecrest
modern sandshifting wind
7 mA
B
100 m
Figure 18. Dune building periods in the Strzelecki linear dunes Source: K.E. Fitzsimmons
0 10 20 30 40 50 60 70 80
Thousands of years ago (ka)


