Agenda
Current software in actuarial analysis
What is R?
R as a functional language
Basic Examples
Actuarial pricing
GLM Example
Challenges and opportunities
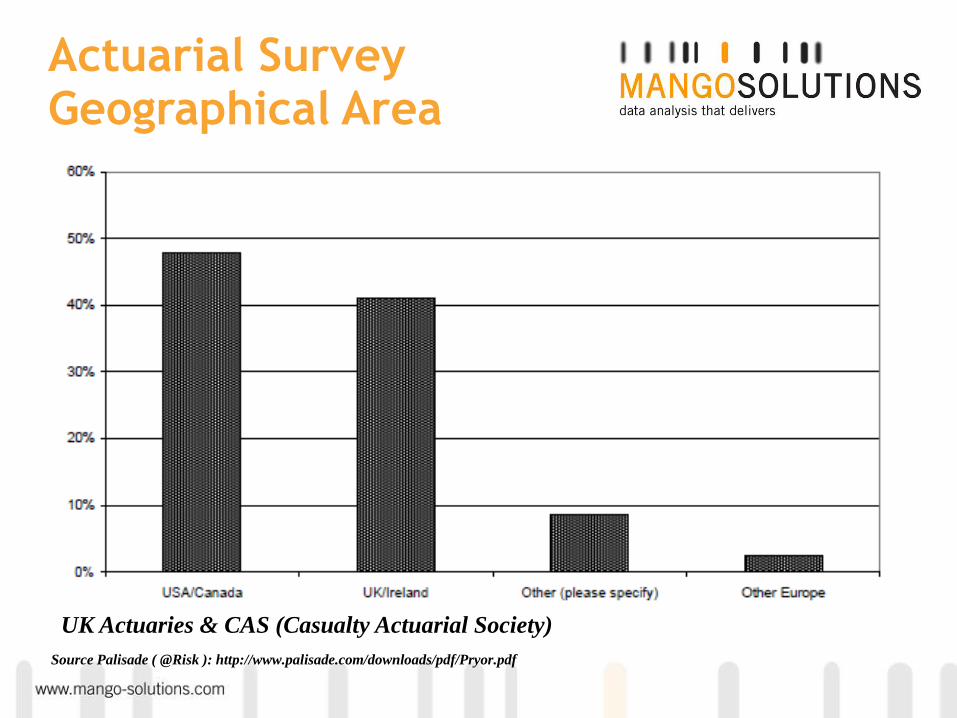
UK Actuaries & CAS (Casualty Actuarial Society)
Source Palisade ( @Risk ): http://www.palisade.com/downloads/pdf/Pryor.pdf
Actuarial Survey Geographical Area
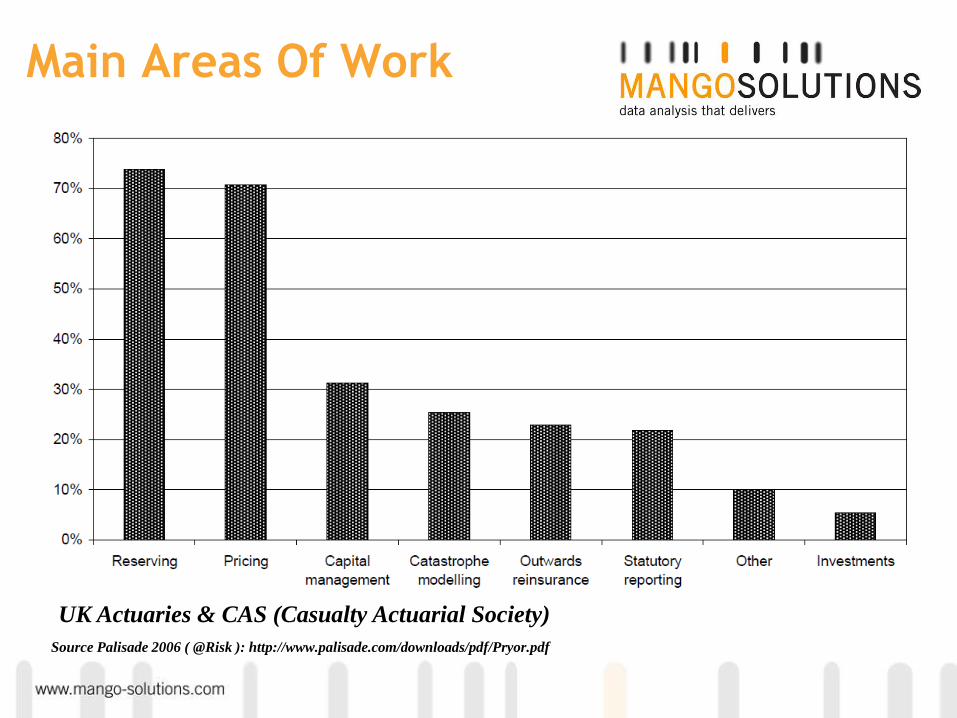
Main Areas Of Work
UK Actuaries & CAS (Casualty Actuarial Society)
Source Palisade 2006 ( @Risk ): http://www.palisade.com/downloads/pdf/Pryor.pdf

UK Actuaries & CAS (Casualty Actuarial Society)
Source Palisade ( @Risk ): http://www.palisade.com/downloads/pdf/Pryor.pdf
Main area of work in which software is used

Percentage of respondents using each package
UK Actuaries & CAS (Casualty Actuarial Society) Source Palisade ( @Risk ): http://www.palisade.com/downloads/pdf/Pryor.pdf
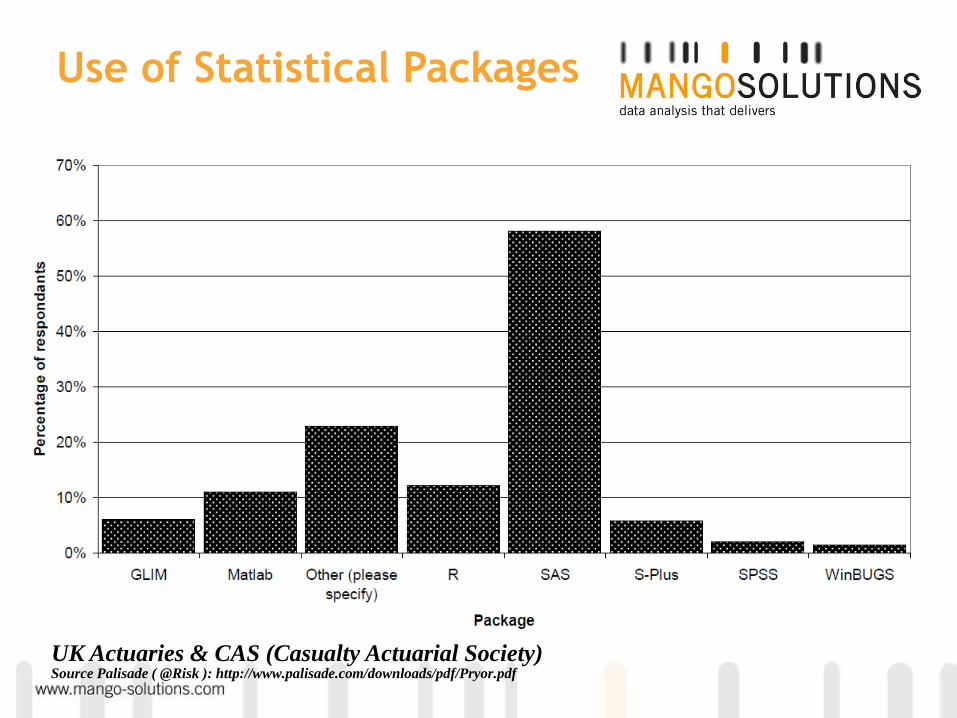
Percentage of statistical package users using individual packages
UK Actuaries & CAS (Casualty Actuarial Society) Source Palisade ( @Risk ): http://www.palisade.com/downloads/pdf/Pryor.pdf
Use of Statistical Packages

R is the programming language of statistics
Why should it not be the programming language of Actuaries?
Inadequate current incumbents
• VBA: huge versioning issues and inadequate data manipulation and statistical function capabilities
• Excel: Inappropriate for analysis
• Proprietary Actuarial Software: No Granular Access To Processing Outputs
R offers so much in terms of data manipulation, statistical models
Spreadsheets are unstructured computer programs:
The Risks Of Using Spreadsheets for Statistical Analysis (IBM White Paper):
http://public.dhe.ibm.com/common/ssi/ecm/en/imw14297usen/IMW14297USEN.PDF

Excel
Very labour intensive
Excel spreadsheets are unstructured computer programs
Problems with checking calculations and types of errors which can be silent and unknown
Do your spreadsheets start to grind to a halt with rather moderate sets of data?
Versioning excel files could be over 50MB each relative to script versions few KB. Imagine this across your network and the waste of space this encourages
Linking spreadsheets stability issues etc
VBA versioning problems, inadequate for data analysis and most useful purposes – harsh but true?
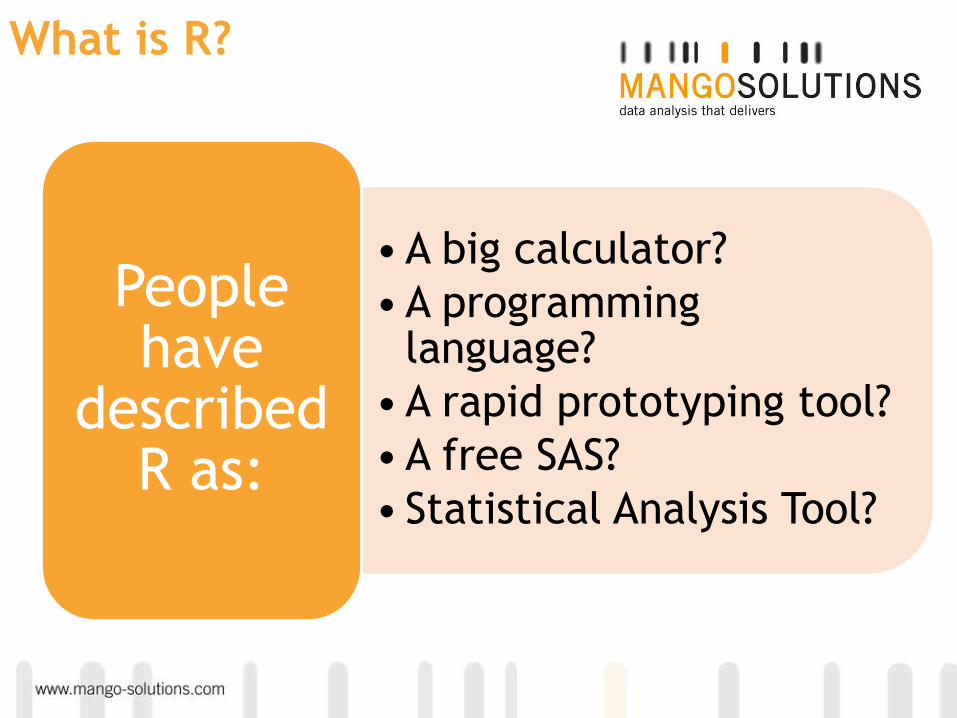
What is R?
• A big calculator?
• A programming language?
• A rapid prototyping tool?
• A free SAS?
• Statistical Analysis Tool?
People have
described R as:
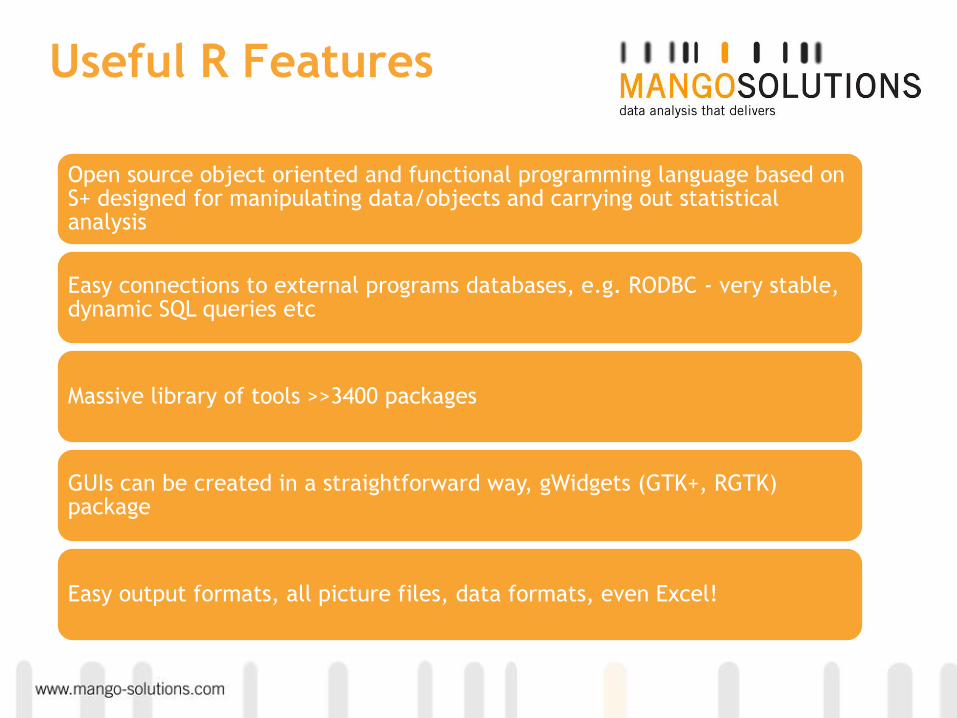
Useful R Features
Open source object oriented and functional programming language based on S+ designed for manipulating data/objects and carrying out statistical analysis
Easy connections to external programs databases, e.g. RODBC - very stable, dynamic SQL queries etc
Massive library of tools >>3400 packages
GUIs can be created in a straightforward way, gWidgets (GTK+, RGTK) package
Easy output formats, all picture files, data formats, even Excel!
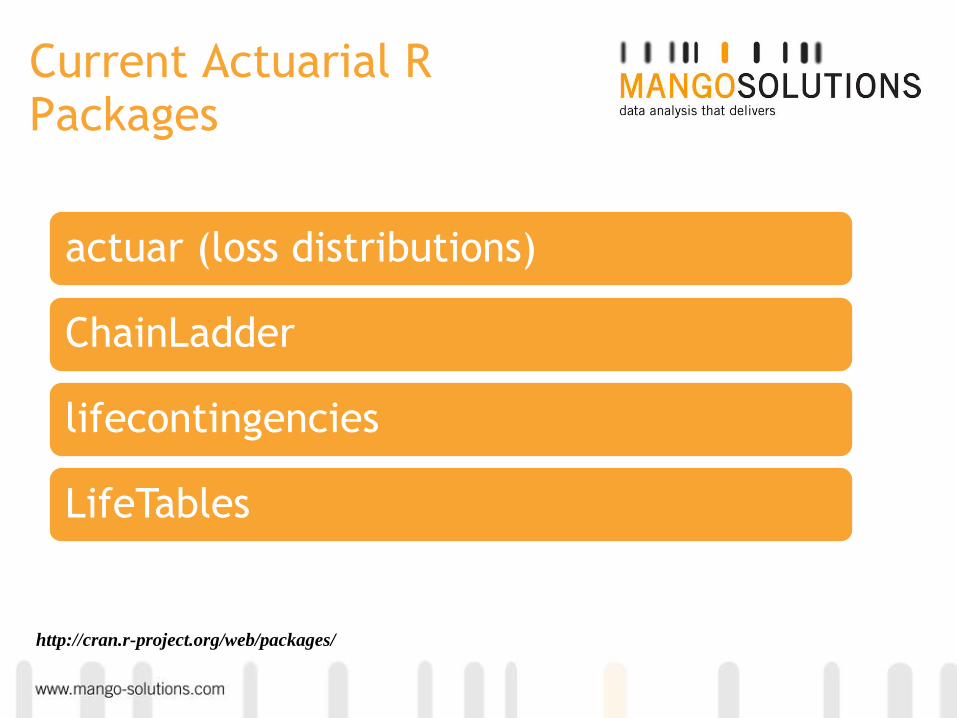
Current Actuarial R Packages
actuar (loss distributions)
ChainLadder
lifecontingencies
LifeTables
http://cran.r-project.org/web/packages/
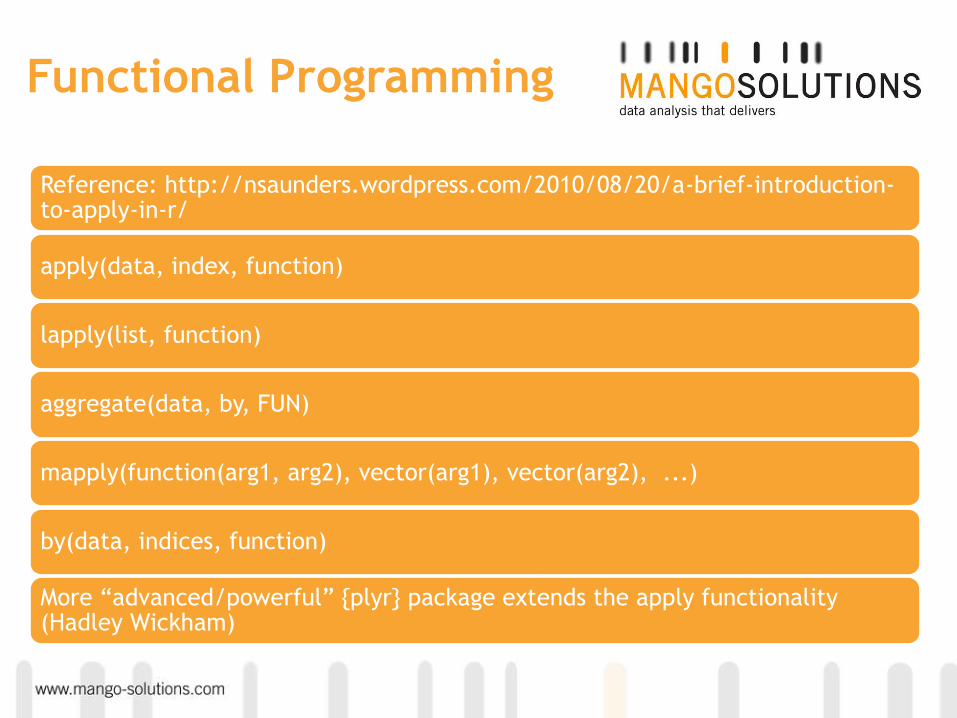
Reference: http://nsaunders.wordpress.com/2010/08/20/a-brief-introduction-to-apply-in-r/
apply(data, index, function)
lapply(list, function)
aggregate(data, by, FUN)
mapply(function(arg1, arg2), vector(arg1), vector(arg2), ...)
by(data, indices, function)
More “advanced/powerful” {plyr} package extends the apply functionality (Hadley Wickham)
Functional Programming

{plyr} Author: Hadley Wickham
http://www.jstatsoft.org/v40/i01/paper
I/O Array Data Frame List Discarded
Array aaply adply alply a_ply
Data Frame daply ddply dlply d_ply
List laply ldply llply l_ply
a*ply(.data, .margins, .fun, ...)
d*ply(.data, .variables, .fun, ...)
l*ply(.data, .fun, ...)

Example Data
Data Source (Simulated): Modern Actuarial Risk Theory Using R: Kaas, Goovaerts, Dhaene, and Denuit.

Dynamic SQL
Query Example
require(RODBC)
doMyAnalysis <- function(myYear = 2001){
sqlString <- paste("SELECT * FROM policyClaims WHERE Year='",myYear,"'", sep = "")
myData <- sqlQuery(channel = odbcConnect(dsn = "InsuranceData"), query = sqlString)
odbcCloseAll()
myGlm <- glm(noclaims ~ age + bonusmalus + region + mileage, data = myData, offset =
log(exposure), family = poisson(link = "log"))
myCoeffs <- summary(myGlm)$coeff
theNames <- colnames(myCoeffs)
myCoeffs <- data.frame(myCoeffs)
myCoeffs <- data.frame(rownames(myCoeffs), myYear, myCoeffs)
colnames(myCoeffs) <- c("Coeff", "Year", theNames)
print(myYear)
return(myCoeffs[1,])
}
analysisOutPut <- lapply(2001:2010, doMyAnalysis)
analysisOutPut <- do.call(rbind, analysisOutPut)
rownames(analysisOutPut) <- 1:nrow(analysisOutPut)
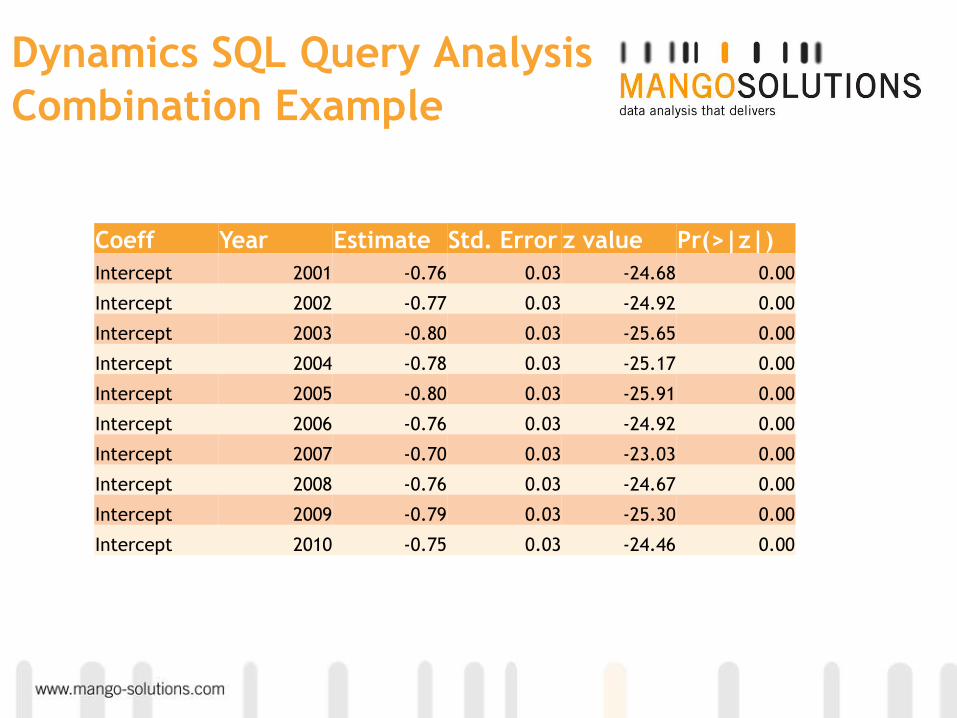
Dynamics SQL Query Analysis
Combination Example
Coeff Year Estimate Std. Error z value Pr(>|z|)
Intercept 2001 -0.76 0.03 -24.68 0.00
Intercept 2002 -0.77 0.03 -24.92 0.00
Intercept 2003 -0.80 0.03 -25.65 0.00
Intercept 2004 -0.78 0.03 -25.17 0.00
Intercept 2005 -0.80 0.03 -25.91 0.00
Intercept 2006 -0.76 0.03 -24.92 0.00
Intercept 2007 -0.70 0.03 -23.03 0.00
Intercept 2008 -0.76 0.03 -24.67 0.00
Intercept 2009 -0.79 0.03 -25.30 0.00
Intercept 2010 -0.75 0.03 -24.46 0.00
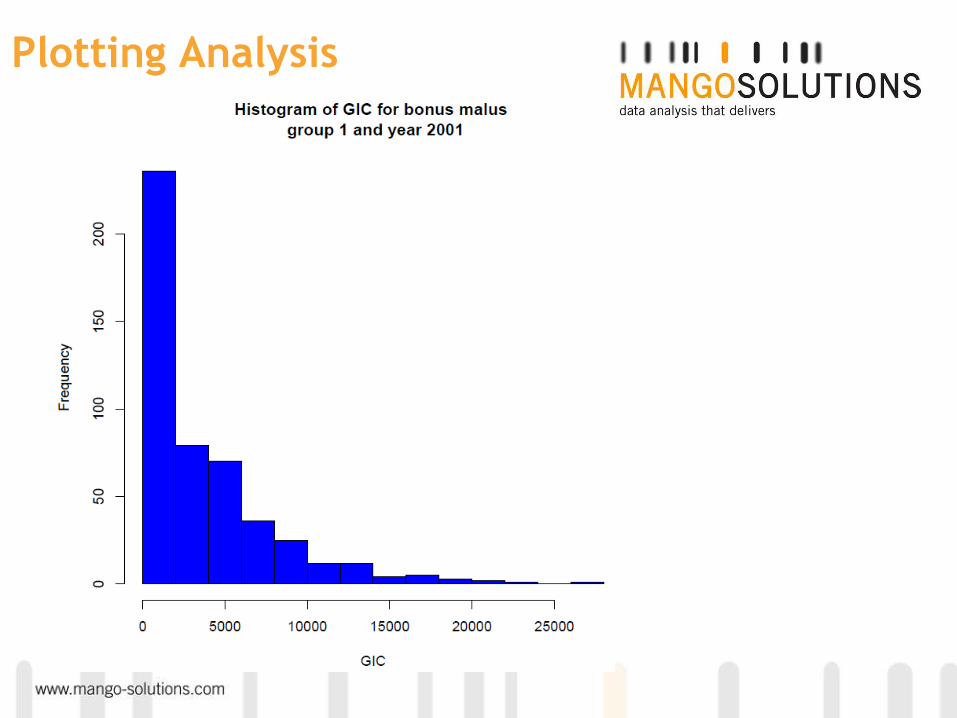
Plotting Analysis
myFun <- function(x){
hist(x$GrossIncurred, col = "blue", xlab = "GIC", main =
paste("Histogram of GIC for bonus malus \n group ", x$BonusMalus[1], "
and year ", x$Year[1], sep = ""))
}
pdf(file = paste(myFolder, "myPlots.pdf", sep = ""), width = 7, height =
7)
by(policyTable, list("Year" = policyTable$Year, "BonusMalus" =
policyTable$BonusMalus), FUN = myFun)
dev.off()
C:\Users\cchima-okereke\Documents\R\RScripts\ActuarialPricing\tmp\myPlots.pdf
Plotting Analysis
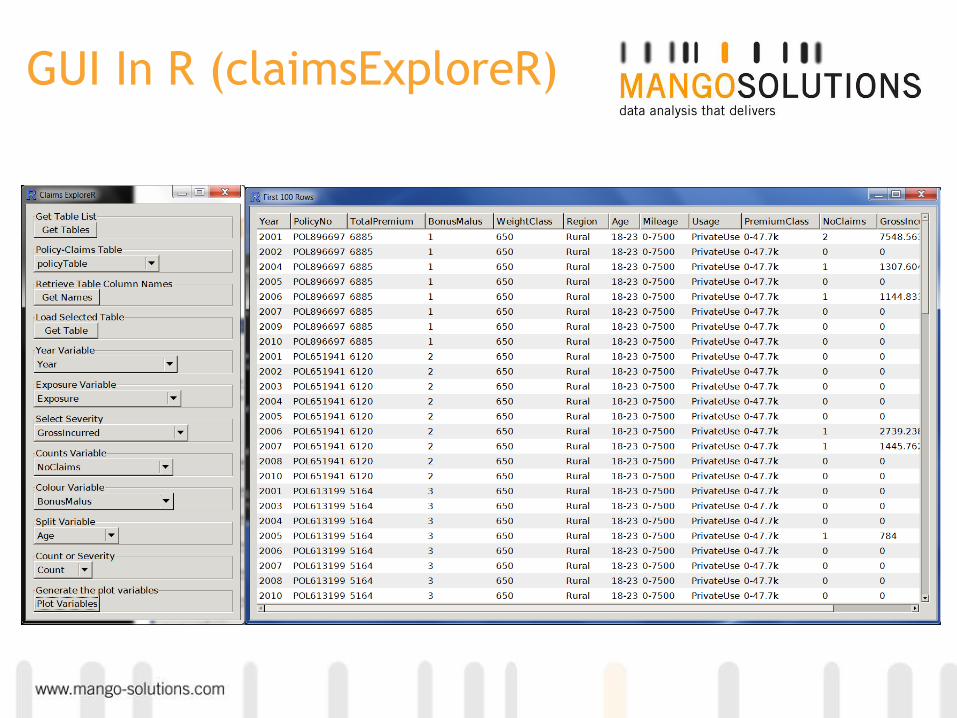
GUI In R (claimsExploreR)
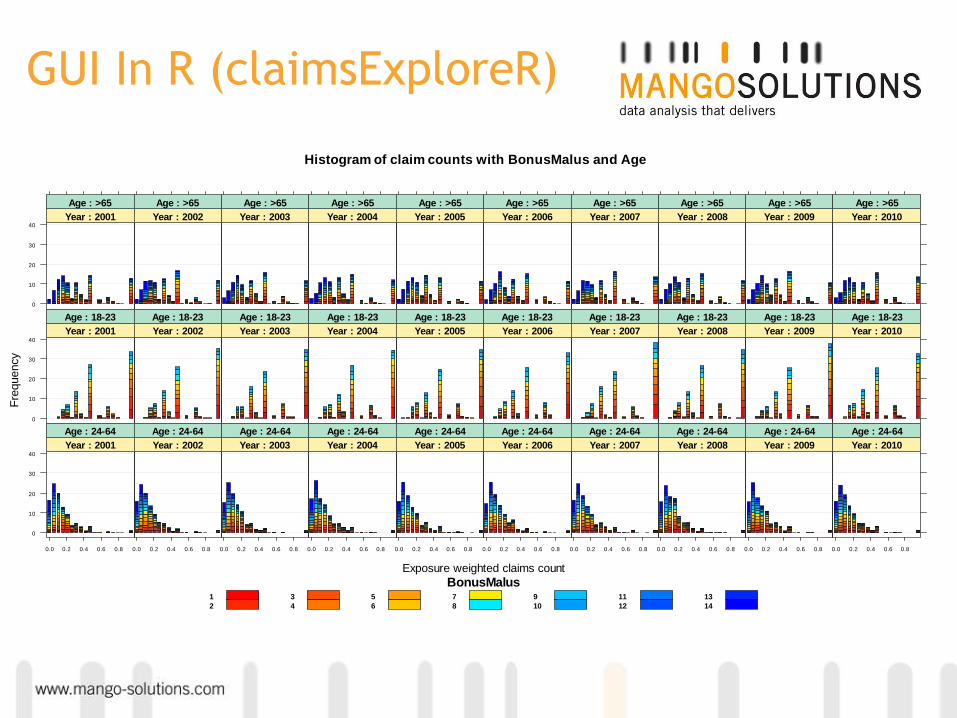
GUI In R (claimsExploreR)
Histogram of claim counts with BonusMalus and Age
Exposure weighted claims count
Fre
quency
0
10
20
30
40
: Year 2001
: Age >65
: Year 2002
: Age >65
: Year 2003
: Age >65
: Year 2004
: Age >65
: Year 2005
: Age >65
: Year 2006
: Age >65
: Year 2007
: Age >65
: Year 2008
: Age >65
: Year 2009
: Age >65
: Year 2010
: Age >65
0
10
20
30
40
: Year 2001
: Age 18-23
: Year 2002
: Age 18-23
: Year 2003
: Age 18-23
: Year 2004
: Age 18-23
: Year 2005
: Age 18-23
: Year 2006
: Age 18-23
: Year 2007
: Age 18-23
: Year 2008
: Age 18-23
: Year 2009
: Age 18-23
: Year 2010
: Age 18-23
0
10
20
30
40
0.0 0.2 0.4 0.6 0.8
: Year 2001
: Age 24-64
0.0 0.2 0.4 0.6 0.8
: Year 2002
: Age 24-64
0.0 0.2 0.4 0.6 0.8
: Year 2003
: Age 24-64
0.0 0.2 0.4 0.6 0.8
: Year 2004
: Age 24-64
0.0 0.2 0.4 0.6 0.8
: Year 2005
: Age 24-64
0.0 0.2 0.4 0.6 0.8
: Year 2006
: Age 24-64
0.0 0.2 0.4 0.6 0.8
: Year 2007
: Age 24-64
0.0 0.2 0.4 0.6 0.8
: Year 2008
: Age 24-64
0.0 0.2 0.4 0.6 0.8
: Year 2009
: Age 24-64
0.0 0.2 0.4 0.6 0.8
: Year 2010
: Age 24-64
BonusMalus1
2
3
4
5
6
7
8
9
10
11
12
13
14
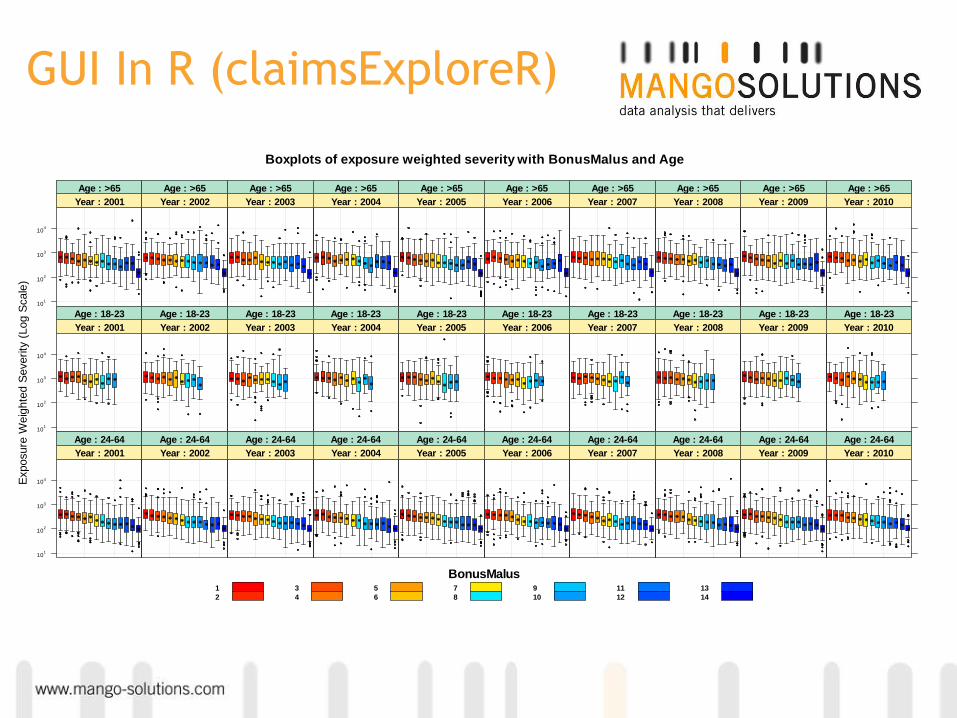
GUI In R (claimsExploreR)
Boxplots of exposure weighted severity with BonusMalus and Age
Exposure
Weig
hte
d S
everity
(Log S
cale
)
101
102
103
104
: Year 2001
: Age >65
: Year 2002
: Age >65
: Year 2003
: Age >65
: Year 2004
: Age >65
: Year 2005
: Age >65
: Year 2006
: Age >65
: Year 2007
: Age >65
: Year 2008
: Age >65
: Year 2009
: Age >65
: Year 2010
: Age >65
101
102
103
104
: Year 2001
: Age 18-23
: Year 2002
: Age 18-23
: Year 2003
: Age 18-23
: Year 2004
: Age 18-23
: Year 2005
: Age 18-23
: Year 2006
: Age 18-23
: Year 2007
: Age 18-23
: Year 2008
: Age 18-23
: Year 2009
: Age 18-23
: Year 2010
: Age 18-23
101
102
103
104
: Year 2001
: Age 24-64
: Year 2002
: Age 24-64
: Year 2003
: Age 24-64
: Year 2004
: Age 24-64
: Year 2005
: Age 24-64
: Year 2006
: Age 24-64
: Year 2007
: Age 24-64
: Year 2008
: Age 24-64
: Year 2009
: Age 24-64
: Year 2010
: Age 24-64
BonusMalus1
2
3
4
5
6
7
8
9
10
11
12
13
14

GLM Models in Pricing
Poisson – Frequency
Gamma – Severity
Negative Binomial for frequency {MASS}
Tweedie combines frequency and severity {statmod}

Variable Selection Criteria
• Information Criteria
• AIC
• BIC (Multiple flavours)
• Significance of variable: Chi-Squared/F-Test
• Consistency measures
• Other Measures
What metrics shall we use to include/exclude
variables?
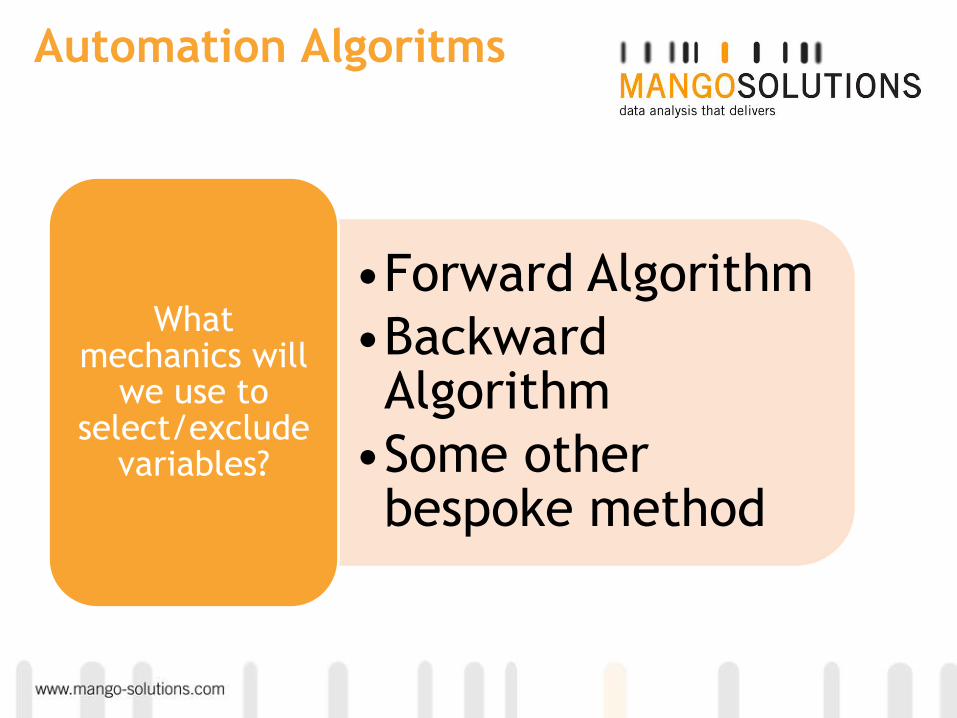
Automation Algoritms
•Forward Algorithm
•Backward Algorithm
•Some other bespoke method
What mechanics will
we use to select/exclude
variables?
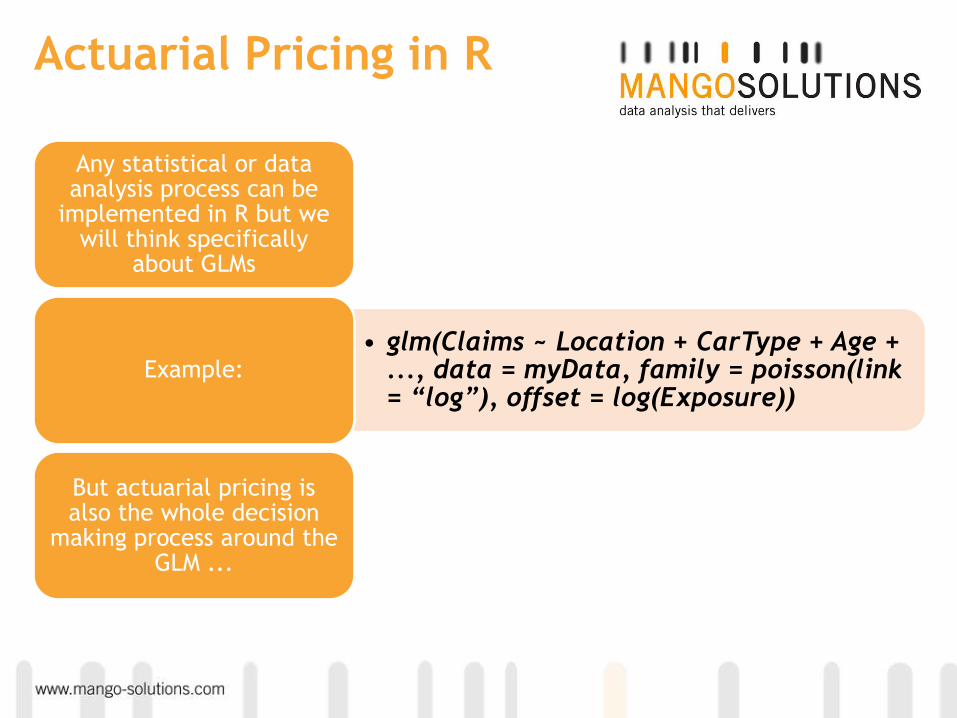
Actuarial Pricing in R
Any statistical or data analysis process can be
implemented in R but we will think specifically
about GLMs
• glm(Claims ~ Location + CarType + Age + ..., data = myData, family = poisson(link = “log”), offset = log(Exposure))
Example:
But actuarial pricing is also the whole decision
making process around the GLM ...
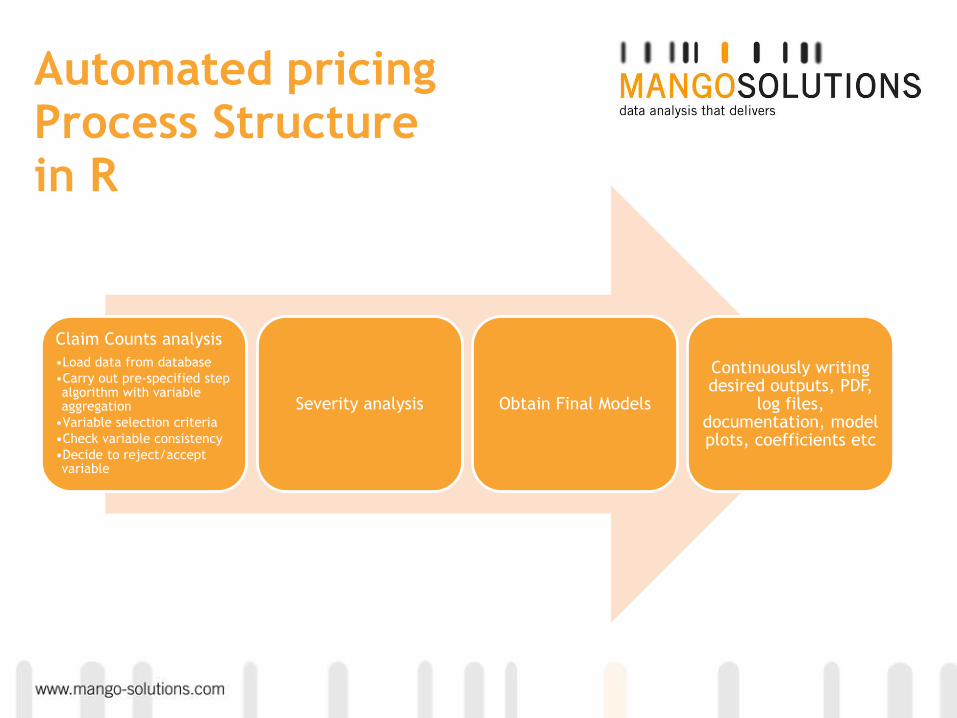
Automated pricing Process Structure in R
Claim Counts analysis
•Load data from database
•Carry out pre-specified step algorithm with variable aggregation
•Variable selection criteria
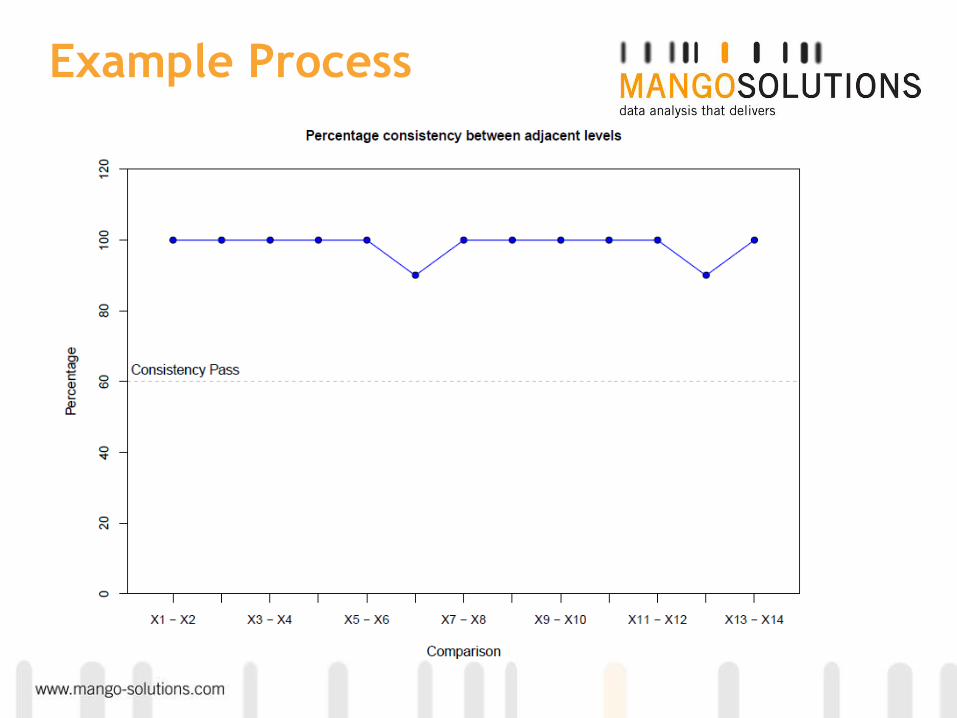
•Check variable consistency
•Decide to reject/accept variable
Severity analysis Obtain Final Models
Continuously writing desired outputs, PDF,
log files, documentation, model plots, coefficients etc

Automated Actuarial Pricing
We need to defined the consolidation structure for categorical variables e.g.
Location 1 Location 2 Location 3 Location 4
North North North North
N.East North North North
N.West N.West N.West North
S.West S.West S.West South
S.East S.East South South
South South South South
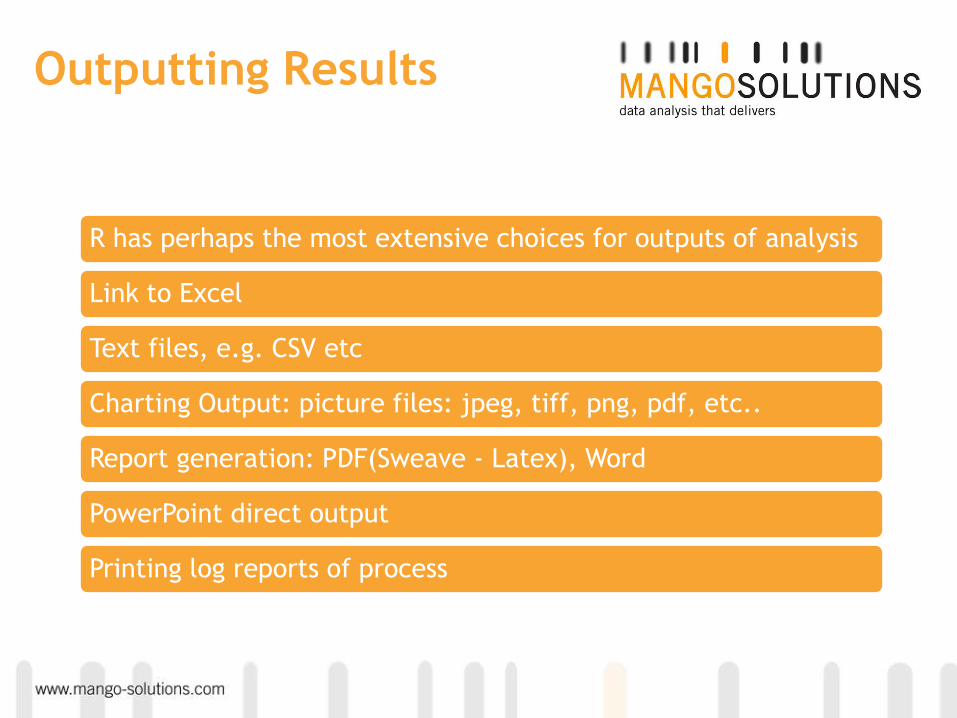
Outputting Results
R has perhaps the most extensive choices for outputs of analysis
Link to Excel
Text files, e.g. CSV etc
Charting Output: picture files: jpeg, tiff, png, pdf, etc..
Report generation: PDF(Sweave - Latex), Word
PowerPoint direct output
Printing log reports of process

Example Process
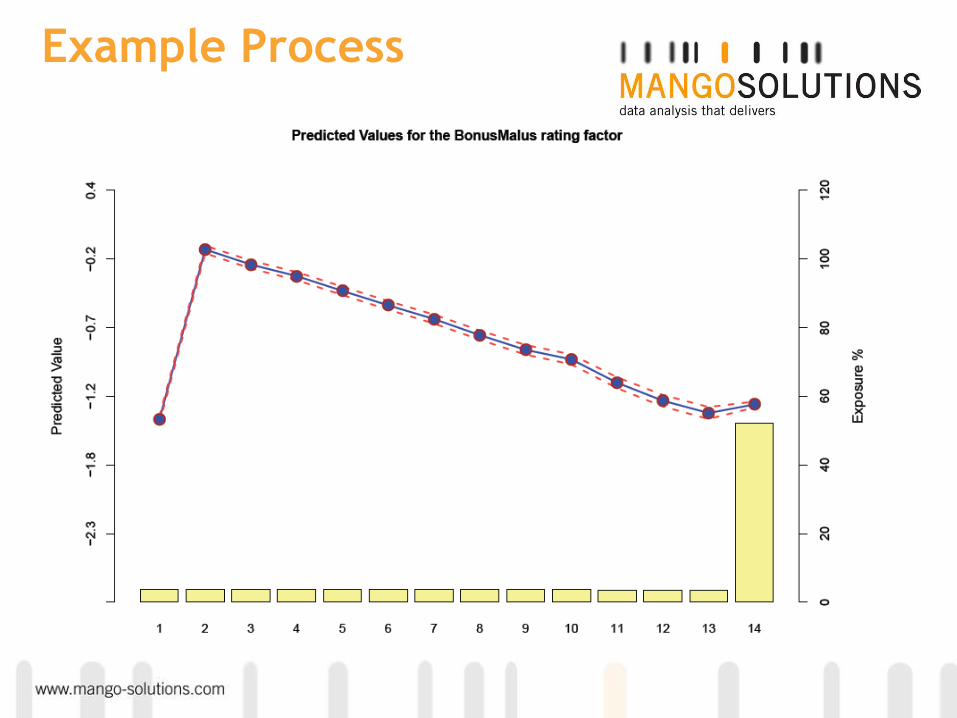
Example Process
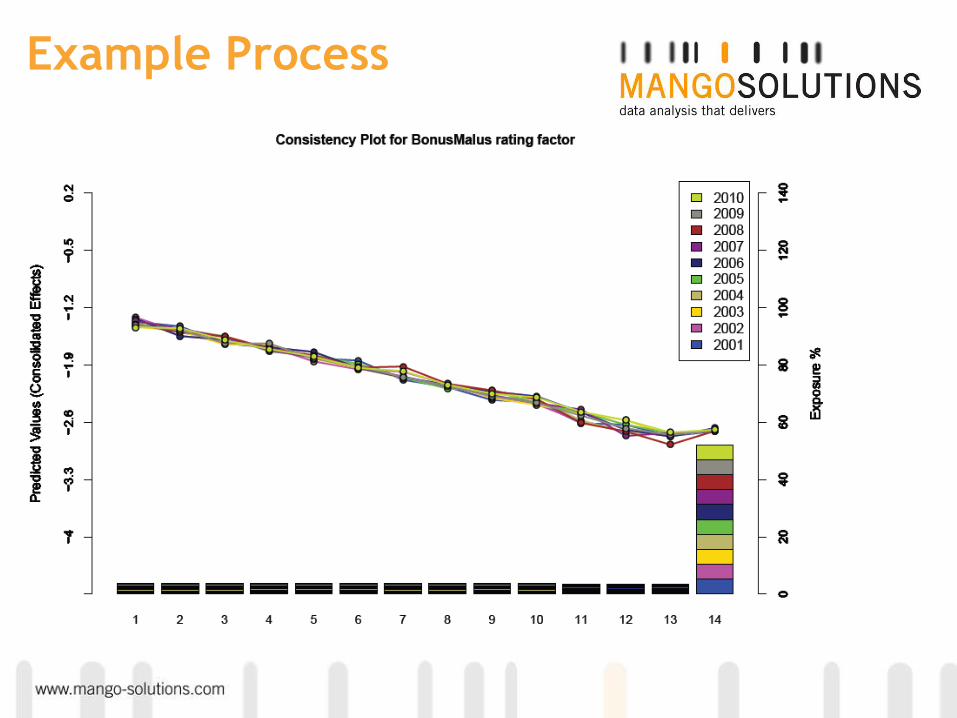
Example Process

Effects package
Effects plot of Age and Bonus Malus
Bonus Malus
Rela
tivity (
%)
110
120
130
140
150
1 2 3 4 5 6 7 8 9 10 11 12 13 14
: Age 18-23
1 2 3 4 5 6 7 8 9 10 11 12 13 14
: Age 24-64
1 2 3 4 5 6 7 8 9 10 11 12 13 14
: Age >65
effects package from John Fox: http://www.jstatsoft.org/v08/i15/paper
Example Process

Example Process: Final Model

Final Charts

Final Model

Potential Scheme for analytical process
Data residing in some database
Connect to R, RODBC,
RPostgreSQL, RODM etc.
Carry out analysis in R
Write results to PDF, any
picture format, push
to Latex, Excel, CSV, etc
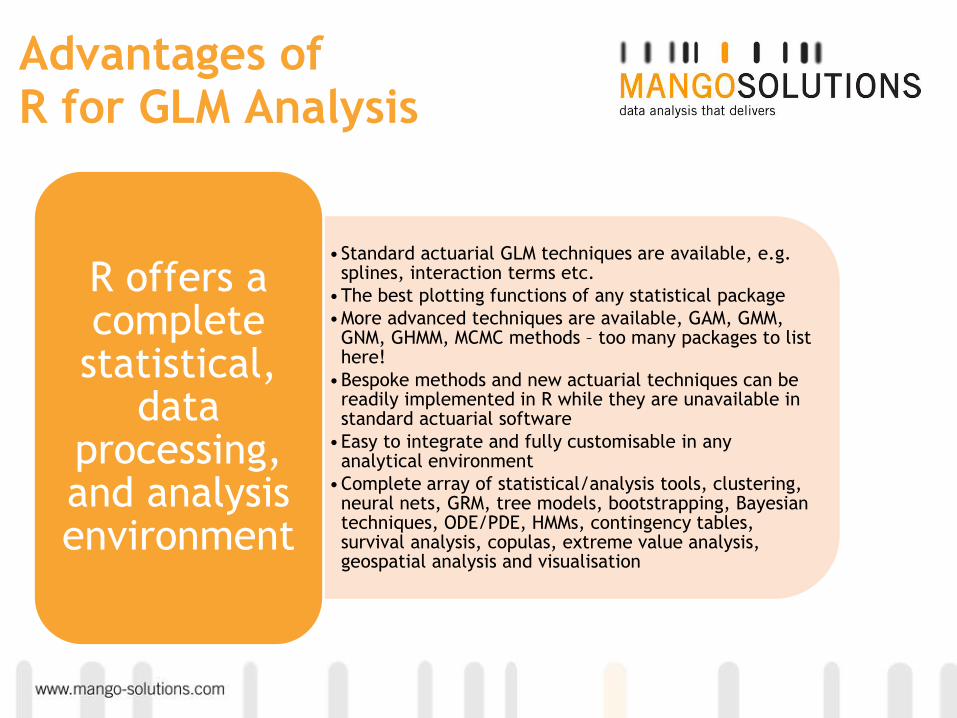
Advantages of R for GLM Analysis
•Standard actuarial GLM techniques are available, e.g. splines, interaction terms etc.
•The best plotting functions of any statistical package
•More advanced techniques are available, GAM, GMM, GNM, GHMM, MCMC methods – too many packages to list here!
•Bespoke methods and new actuarial techniques can be readily implemented in R while they are unavailable in standard actuarial software
•Easy to integrate and fully customisable in any analytical environment
•Complete array of statistical/analysis tools, clustering, neural nets, GRM, tree models, bootstrapping, Bayesian techniques, ODE/PDE, HMMs, contingency tables, survival analysis, copulas, extreme value analysis, geospatial analysis and visualisation
R offers a complete statistical,
data processing, and analysis environment

Challenges & Opportunities
If you are new to R, do something small to begin with test R out
IT support for R
There is great need for training and generation of material to enable actuarial analysts to use R
For mere mortals (like me) the learning curve is tough and the documentation appears ambiguous
R & Hadoop and R & Oracle
See me later for live R demos