

Radical Precursors and Related SpeciesRadical Precursors and Related Speciesfrom Traffic as Observed and Modeledfrom Traffic as Observed and Modeled
at an Urban Highway Junctionat an Urban Highway Junction
Bernhard RappenglückBernhard Rappenglück11,,Graciela LubertinoGraciela Lubertino22, Sergio Alvarez, Sergio Alvarez11, Julia Golovko, Julia Golovko11,,
Beata CzaderBeata Czader11, Luis Ackermann, Luis Ackermann11
1) Department of Earth and Atmospheric Sciences, University of Houston1) Department of Earth and Atmospheric Sciences, University of Houston2) Houston-Galveston Area Council, Houston2) Houston-Galveston Area Council, Houston

• The Houston region is in non-attainment for: 1997 1-hr, and 2008 8-hr ozone standard
• Study focus on ozone precursors: HONO, HCHO, CO, NO/NO2/NOx
• Observational data is compared to modeling data (MOBILE6 and MOVES) at an urban highway junction in Houston
BackgroundBackground

NO
O3
RCH3
CO
RCHO
OH*
O(1D)
+ H2O
O2
O
CO2
HO2*
H*
NO2
O
+O2
H2O
RCH*
RCH2O2 *
+O2
+O2RCH2O*
H2O
RCO*
+O2
RC(O)O*
`
RC(O)O2 *
+O2
PAN’sPANPPN (anthropogenic)MPAN (biogenic)….
Termination byNOx
HNO3
Termination byROx + ROx
+HO2*+HO2*
H2O2
RCH2OOH
NOx-----VOC Photolysis ofO3, RCHO, HONO, H2O2, ClNO2
+ alkene ozonolysis
Daytime Gas-Phase Air ChemistryDaytime Gas-Phase Air Chemistry
Ozone (O3)

NO
O3
RCH3
CO
RCHO
OH*
O(1D)
+ H2O
O2
O
CO2
HO2*
H*
NO2
O
+O2
H2O
RCH*
RCH2O2 *
+O2
+O2RCH2O*
H2O
RCO*
+O2
RC(O)O*
`
RC(O)O2 *
+O2
PAN’sPANPPN (anthropogenic)MPAN (biogenic)….
Termination byNOx
HNO3
Termination byROx + ROx
+HO2*+HO2*
H2O2
RCH2OOH
Photolysis ofO3, RCHO, HONO, H2O2, ClNO2
+ alkene ozonolysis
6
5
4
3
2
1
0
ppbV
/hr
04:005/19/2009
08:00 12:00 16:00 20:00 00:005/20/2009
04:00 08:00 12:00 16:00 20:00 00:005/21/2009
CST
HOX_O3 HOX_HONO HOX_HCHO HOX_H2O2
Moody Tower3x3 cells, PBL
Major HOx production mechanisms: morning: HONO; mid morning: HCHO; throughout the day: O3
Daytime Gas-Phase Air ChemistryDaytime Gas-Phase Air Chemistry
Houston, TX Houston, TX
minor
mostly nighttime
?
radical precursors
Ozone (O3)
6
5
4
3
2
1
0
pp
bV
/hr
04:006/5/2009
08:00 12:00 16:00 20:00 00:006/6/2009
04:00 08:00 12:00 16:00 20:00 00:006/7/2009
CST
Moody Tower3x3 cells, PBL HOX_O3
HOX_HONOHOX_HCHOHOX_H2O2
6
5
4
3
2
1
0
pp
bV
/hr
04:006/5/2009
08:00 12:00 16:00 20:00 00:006/6/2009
04:00 08:00 12:00 16:00 20:00 00:006/7/2009
CST
Moody Tower3x3 cells, PBL HOX_O3
HOX_HONOHOX_HCHOHOX_H2O2
HOX_O3HOX_HONOHOX_HCHOHOX_H2O2
Czader et al.,JGR, 2013
NOx-----VOC

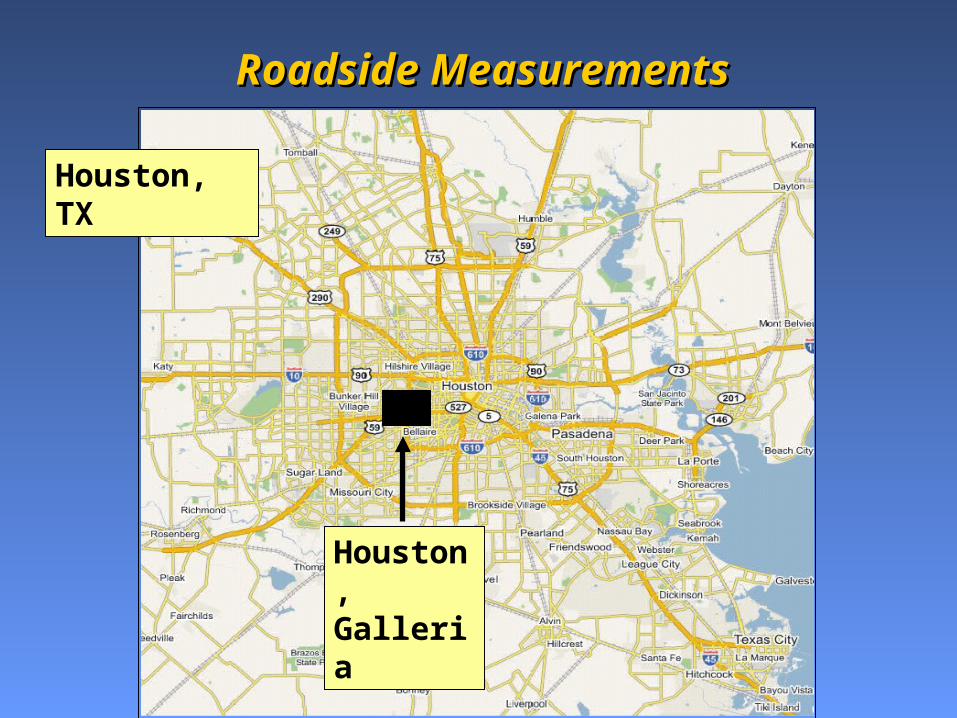
Roadside MeasurementsRoadside Measurements
Houston, TX
Roadside MeasurementsRoadside Measurements
Houston, TX
Houston, Galleria

Houston, TX
Houston, Galleria
TxDOT, 2009
(per day)

Roadside MeasurementsRoadside Measurements
Houston, GalleriaHighway junction I-59 South/610TxDOT pumping station

Roadside MeasurementsRoadside MeasurementsMeasurements (10 min)
Houston, GalleriaHighway junction I-59 South/610TxDOT pumping station
Parameter Method Instrument
NO Chemiluminescence TE 42i TL
NO2 Chemiluminescence/ photolytic conversion
TE 42i TL / BLC
CO Gas Filter correlation TE 48i TLE
CO2 Differential, non-dispersive infrared absoprtion
LI-7000
HCHO Hantzsch/ fluorescence AL4021
HONO Long Path Absorption Photometer
LOPAP 03
Speciated PANs GC/ECD Mod. Metcon GC/ECD
Met. Parameters various Vaisala WXT510
Global radiation Pyranometer Vaisala QMS101
0
200
400
600
800
1000
1200
1400
1600
1800
0:00 3:00 6:00 9:00 12:00 15:00 18:00 21:00 0:00
CST
PA
N [
pp
tv*2
], H
ON
O [
pp
tv],
CO
[p
pb
v],
NO
x [p
pb
v*10
], G
lob
al R
adia
tio
n [
W m
-2]
0
2
4
6
8
HC
HO
[p
pb
v]
Global Radiation
PAN
HONO
CO
NOx
HCHO
I
III
II
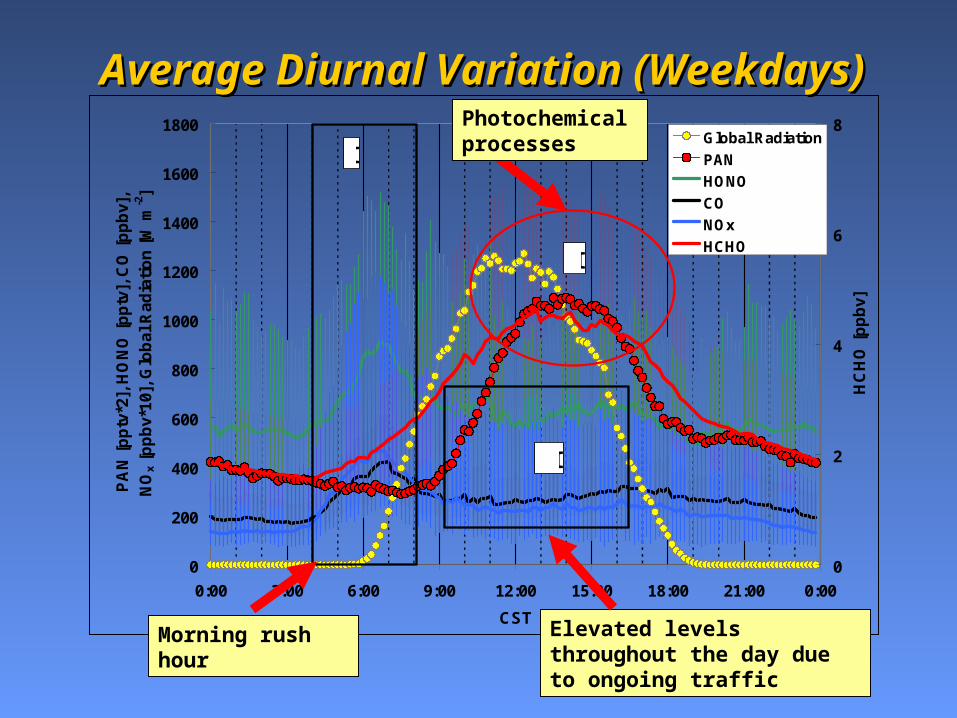
Average Diurnal Variation (Weekdays)Average Diurnal Variation (Weekdays)
Morning rush hour
Photochemical processes
Elevated levels throughout the day due to ongoing traffic

0
200
400
600
800
1000
1200
1400
1600
1800
0:00 3:00 6:00 9:00 12:00 15:00 18:00 21:00 0:00
CST
PA
N [
pp
tv*2
], H
ON
O [
pp
tv],
CO
[p
pb
v],
NO
x [p
pb
v*10
], G
lob
al R
adia
tio
n [
W m
-2]
0
2
4
6
8
HC
HO
[p
pb
v]
Global Radiation
PAN
HONO
CO
NOx
HCHO
I
III
II
Average Diurnal Variation (Weekdays)Average Diurnal Variation (Weekdays)
Morning rush hour
Observational data screened for:
(i) weekdays(ii) Rush hour time 4-8 am CST(iii) Global radiation < 10 W m-2 (iv) PAN < 50 pptv(v) No precipitation(vi) RH > 80%

Roadside MeasurementsRoadside Measurements
Strong relationship of CO vs NOx (r2=0.91). Slope of 6.01 ppbv CO / 1 ppbv NOx is in agreement with Parrish et al. [2009] for rush hour times in selected cities.
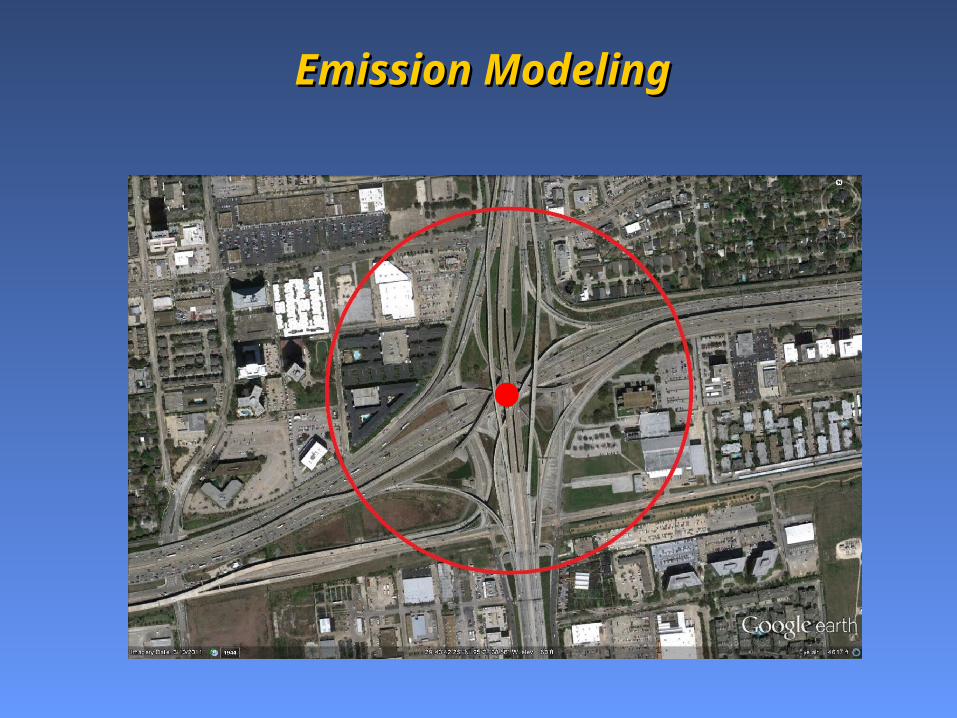
Emission ModelingEmission Modeling

Emission ModelingEmission Modeling
MOBILE6: hourly Harris county emission factors for on-road
• Observed meteorology at the Galleria site for the model day: September 28, 2009• 2009 local registration distribution• 2009 local diesel fractions• 2009 local VMT per hour• Local inspection and maintenance program• Anti-tampering program• Reformulated gasoline

Emission ModelingEmission Modeling
MOVES:
> MOVES2010a used to calculate EF for on-road and off
network for NOx, CO, VOC, HCHO, CO2 (atm), NO, NO2.> MOVES2010b used to calculate HONO.
• Avgspeeddistribution• Dayvmtfraction • Fuelformulation • Fuelengfraction• Fuelsupply • Hourvmtfraction• Hpmsvtypeyear• Imcoverage • Monthvmtfraction• Roadtypedistribution• Sourcetypeagedistribution• Sourcetypeyear• Zonemonthhour
Using the Texas TransportationInstitute suite of programs:
• EFs adjusted for Tx Low Emission Diesel and the motorcycle rule
• Emissions calculated multiplying the hourly adjusted emission factors (according to speed) by the hourly VMT per link, using the 2009 hourly VMT mix.
• Output link-level emissions by vehicle type

Emission ModelingEmission Modeling
Time of day- Facility Type
Diesel percentage
Gasoline percentage
AM_Arterial 7% 93%
AM_Freeway 5% 95%
MD_Arterial 11% 89%
MD_Freeway 9% 91%
PM_Arterial 6% 94%
PM_Freeway 5% 95%
OV_Arterial 7% 93%
OV_Freeway 7% 93%
(i) Meteorology of 09/28/2009(ii) 2009 registration distr.(iii) 2009 diesel fractions(iv) 2009 VMT mix(v) 2009 VMT per hour(vi) 2009 trip length distrib.
Local 2009 diesel/gasoline split on the arterial and freeway facility types
Something to consider:Something to consider:Total NOTotal NOxx emissions from Light Duty Gasoline (LDG) vehicles are about the same as emissions from Light Duty Gasoline (LDG) vehicles are about the same as
from High Duty Diesel (HDD), although LDG vehicles are about 80% of the total from High Duty Diesel (HDD), although LDG vehicles are about 80% of the total registration, while HDD are about 7%....registration, while HDD are about 7%....
6 am – 9 am CST6 am – 9 am CST
9 am – 3 pm CST9 am – 3 pm CST
3 pm – 7 pm CST3 pm – 7 pm CST
7 pm – 6 am CST7 pm – 6 am CST

Diurnal variation of VMT for the Diurnal variation of VMT for the Galleria site study area September 28, 2009Galleria site study area September 28, 2009
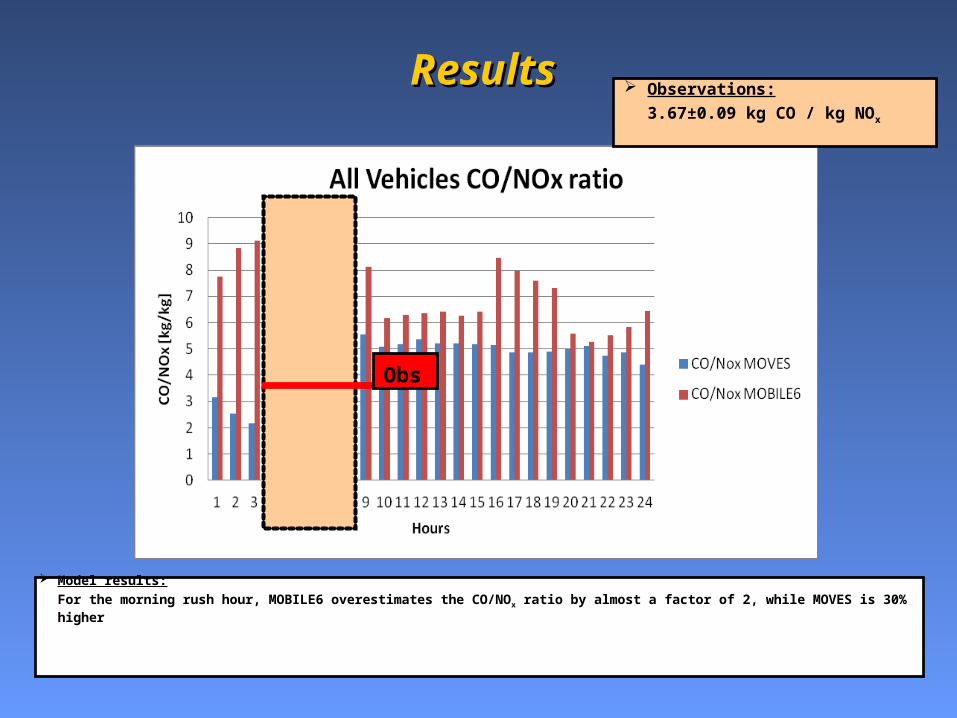
ResultsResults
Model results:
For the morning rush hour, MOBILE6 overestimates the CO/NOx ratio by almost a factor of 2, while MOVES is 30% higher
Observations:
3.67±0.09 kg CO / kg NOx
Obs

ResultsResults
Model results:
MOBILE6 largely underestimates Form/CO ratio
MOVES calculates a very high ratio for very early morning due to heavy duty diesel off-road emissions (idling and starting trucks)
Observations:
3.14±0.14 g HCHO / kg CO
Obs

ResultsResults
Model results:
The differences in CO/NOx and HCHO/CO ratios are largely due to higher NOx and HCHO in MOVES (30% and 57% more than in MOBILE6), while CO emissions are about the same for both models.

ResultsResults
Model results:
MOVES shows a constant HONO/NOx ratio based on a tunnel study done more than 15 years ago.
The observed HONO/NOx ratio is twice the modeled.
Observations:
0.017±0.0009 kg HONO / kg NOx
Obs

ResultsResults
Model results:
Due to the underestimation of HONO/NOx, MOVES also underestimates the HONO/CO ratio. Only at very early morning hours MOVES results are closer to the observations.
Observations:
0.0046±0.0002 kg HONO / kg CO
Obs

ResultsResults
Model results:
Earlier studies showed a NO2/NOx ratio of 5%. MOVES shows a ratio of 9.3% for the rush hour time. The observation ratio is about twice.
Observations:
0.16±0.01 kg NO2 / kg NOx
Obs

ResultsResults
Model results:
MOVES calculates 3 times higher CO/CO2 than observed.
Observations:
0.0033±0.0002 kg CO / kg CO2
Obs

ResultsResults
Model results:
MOVES calculates 3 times higher CO/CO2 than observed.
It seems that MOVES overestimates the CO/CO2 from light duty gasoline vehicles
Observations:
0.0033±0.0002 kg CO / kg CO2

CO/ NOx: observations: 6.01±0.15 ppbv CO / 1 ppbv NOx (r2 = 0.91) in agreement with other studies.
MOBILE6 and MOVES, overestimate the corresponding observed emission ratio. MOVES gets closer, but 30% above the observed value.
HCHO/CO: observations: 3.14±0.14 g HCHO / kg CO. While MOBILE6 largely underestimates this ratio, MOVES calculates higher ratios, but is lower than the observed ratio. MOVES shows high HCHO/CO ratios during the early morning hours due to heavy duty diesel off-road emissions (potential reasons are idling and starting trucks).
Differences of the modeled CO/NOx and HCHO/CO ratios: largely due to higher NOx emissions in MOVES (30% increased from MOBILE6) and
higher HCHO emissions in MOVES (57% increased from MOBILE6); CO emissions about the same in both models.
ConclusionsConclusions

HONO/NOx:
observations: 0.017±0.0009 kg HONO / kg NOx which is twice as high as in MOVES.
NO2/NOx:
observations: 0.16±0.01 kg NO2 / kg NOx, which is ~70% higher than in MOVES.
CO/CO2: observations: 0.0033±0.0002 kg CO / kg CO2
MOVES overestimates by a factor of 3 compared with the observations.
Findings indicate: overestimation of CO for light duty gasoline vehicles underestimation of HONO and NO2 for heavy duty diesel vehicles in MOVES.
ConclusionsConclusions
Acknowledgements: - Houston Advanced Research Center (HARC)- TxDOT, Houston and Austin - TCEQ, Austin


