
Proactively Managing Uncertainty in S&OP
Blake Johnson Consulting Professor Management Science and Engineering Stanford University Founder, Aztral, Inc.
© Blake Johnson
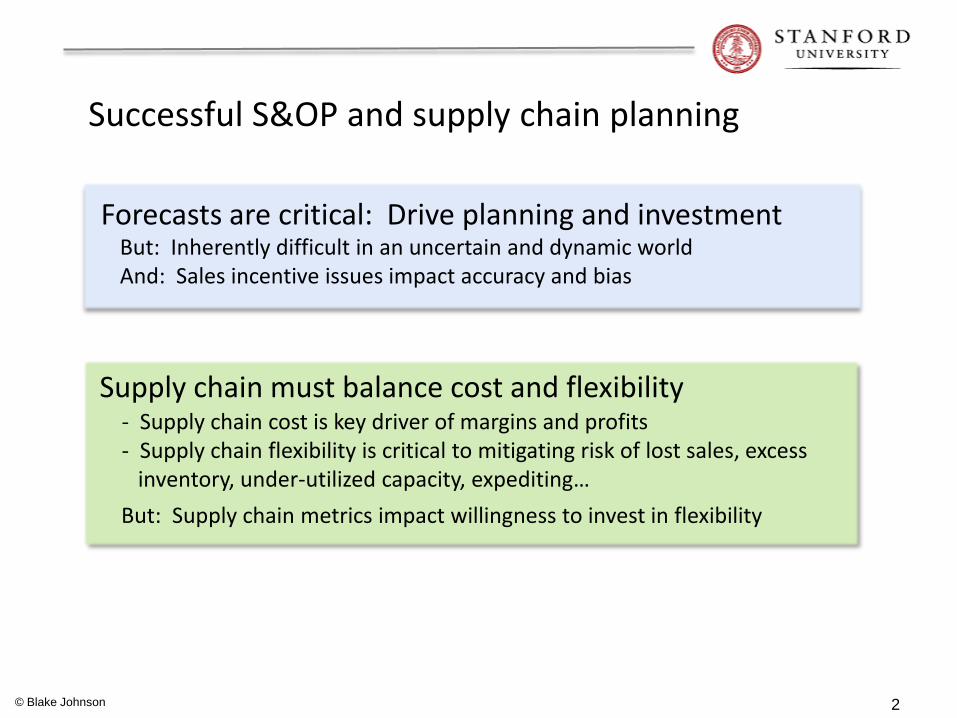
Successful S&OP and supply chain planning
But: Inherently difficult in an uncertain and dynamic world And: Sales incentive issues impact accuracy and bias
Forecasts are critical: Drive planning and investment
- Supply chain cost is key driver of margins and profits - Supply chain flexibility is critical to mitigating risk of lost sales, excess inventory, under-utilized capacity, expediting…
Supply chain must balance cost and flexibility
© Blake Johnson
But: Supply chain metrics impact willingness to invest in flexibility
2

- Shortages - Inventory and liability - Poorly utilized capacity - Expediting and overtime
Profits
Revenues
Costs
Material cost
Write-downs
/ write-offs
Inventory
holding costs
Income statement
Profits
Revenues
Costs
Material cost
Write-downs
/ write-offs
Inventory
holding costs
Income statement
Assets
Inventory
Balance sheet
LiabilitiesMaterial liabilities
CapacityAssets
Inventory
Balance sheet
LiabilitiesMaterial liabilities
Capacity
Too much Cost
Too little
- Ours - Customers - Suppliers - Commitments - Coordination
Plan Reality Operating
performance
- Re-planning - Re-coordinating - Constraints - Fire-fighting - Cost and conflict - Damaged customer relationships
- Income statement and balance sheet impact - Lack of control - Lack of accountability
Impact of basing plans, coordination and metrics on best- guess forecasts
© Blake Johnson
Financial performance
3
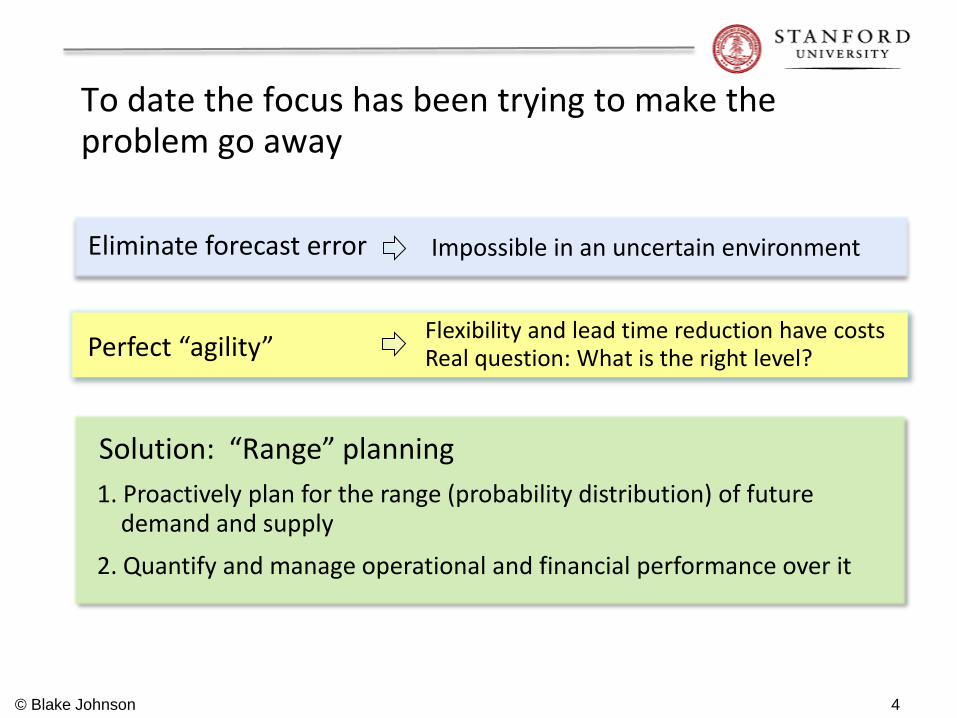
To date the focus has been trying to make the problem go away
1. Proactively plan for the range (probability distribution) of future demand and supply
Eliminate forecast error Impossible in an uncertain environment
Perfect “agility” Flexibility and lead time reduction have costs Real question: What is the right level?
Solution: “Range” planning
© Blake Johnson
2. Quantify and manage operational and financial performance over it
4
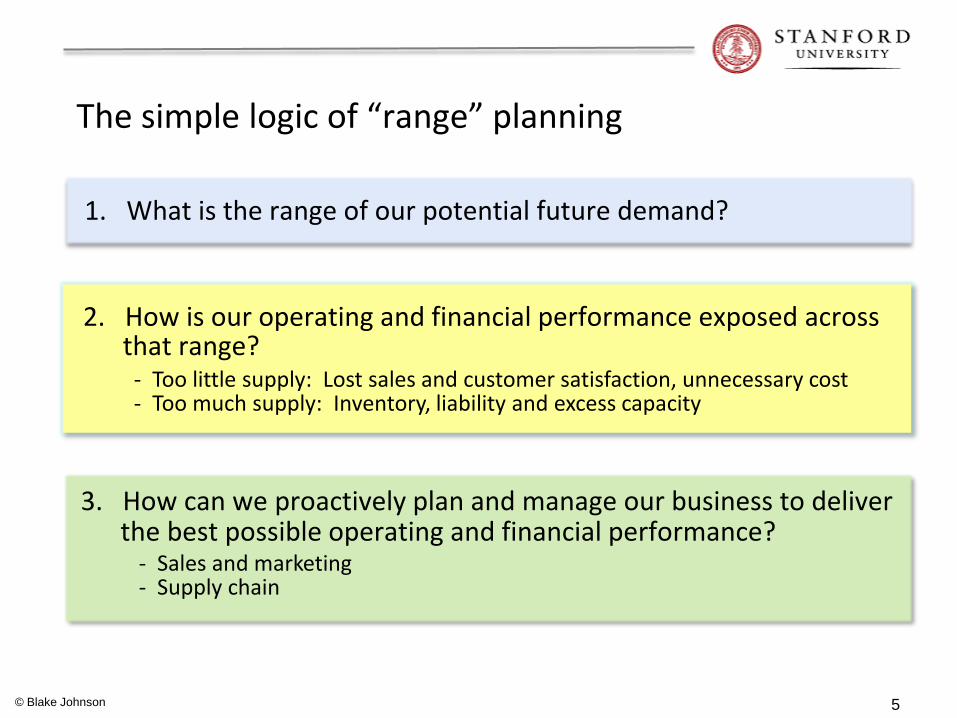
The simple logic of “range” planning
© Blake Johnson
- Too little supply: Lost sales and customer satisfaction, unnecessary cost - Too much supply: Inventory, liability and excess capacity
- Sales and marketing - Supply chain
3. How can we proactively plan and manage our business to deliver the best possible operating and financial performance?
1. What is the range of our potential future demand?
2. How is our operating and financial performance exposed across that range?
5

Capability#1: How forecastable is demand over planning horizon?
Forecasts: Best available demand information over planning horizon
Forecastability varies by:
Demand
Planning horizon
90th
75th
25th
10th
Forecast error percentiles
Forecast error by forecast horizon: Accuracy of that information by lead time
- Product - Stage of lifecycle - Level of aggregation - Market / geography - Season
Customer order lead time
Demand known within customer order lead time
Now
© Blake Johnson 6
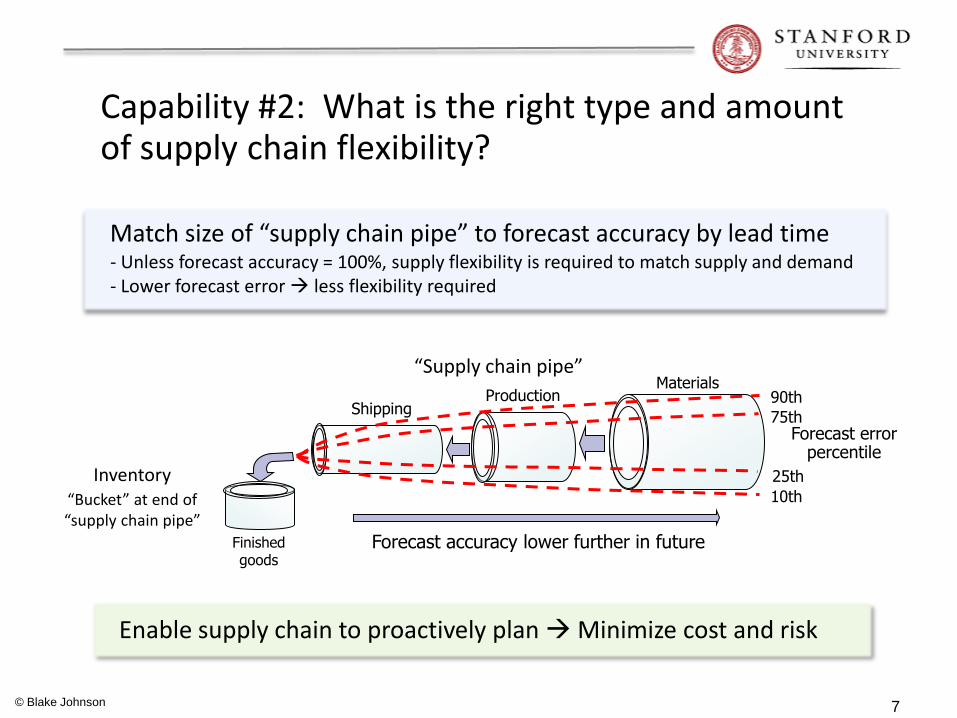
Capability #2: What is the right type and amount of supply chain flexibility?
“Bucket” at end of “supply chain pipe”
Inventory
“Supply chain pipe” Materials
Production Shipping
Finished goods
Forecast accuracy lower further in future
Match size of “supply chain pipe” to forecast accuracy by lead time - Unless forecast accuracy = 100%, supply flexibility is required to match supply and demand - Lower forecast error less flexibility required
90th
75th
25th
10th
Forecast error percentile
Enable supply chain to proactively plan Minimize cost and risk
© Blake Johnson 7

Optimizing planning for high probability portion of demand range
Demand
Time
High probability demand
Cost savings opportunity varies by circumstance, but 5-10% is typical
Low end of Range Forecast as % of forecast
Savings opportunity: Examples
Cost reduction opportunity
70%
60% 5%
10%
X = Reduction in
overall cost (%)
3.5% 6%
Use predictability to reduce cost: - Lowest cost, long lead time production - Efficient capacity, materials and production planning - Large batch sizes, full truckloads, ocean vs. air… - Financial planning and risk management benefits
© Blake Johnson
Certain demand is cheap to serve (100% capacity utilization, no inventory buffer…)
8
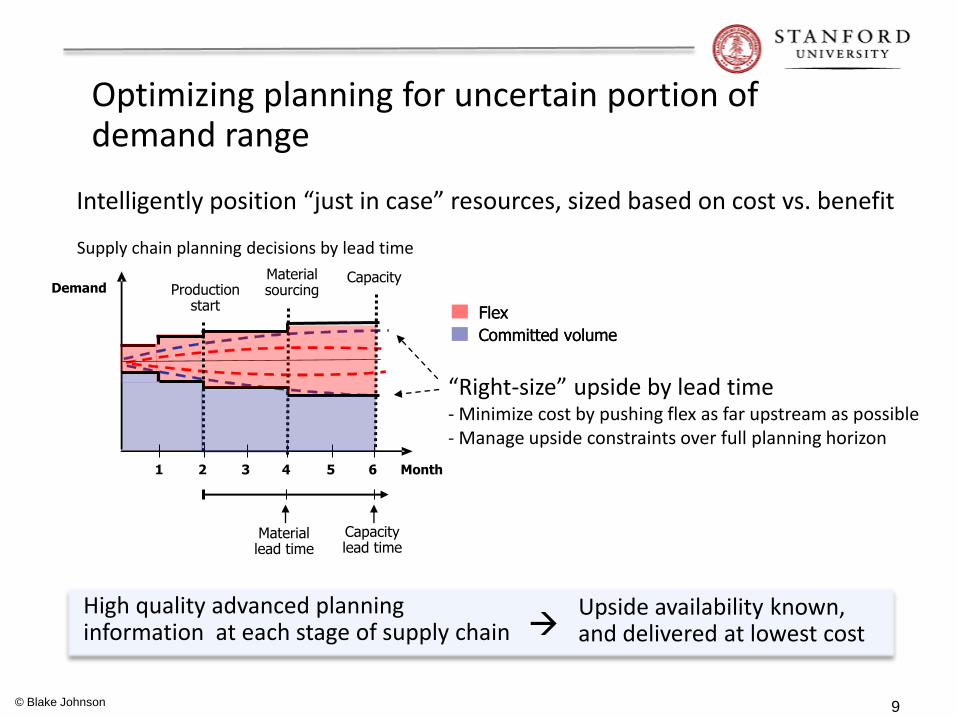
Optimizing planning for uncertain portion of demand range
Flex
Committed volume
Flex
Committed volume
Supply chain planning decisions by lead time
Demand
Month 3 4 5 6 1 2
Production start
Material sourcing
Capacity
Capacity lead time
Material lead time
“Right-size” upside by lead time - Minimize cost by pushing flex as far upstream as possible - Manage upside constraints over full planning horizon
High quality advanced planning information at each stage of supply chain
© Blake Johnson
Upside availability known, and delivered at lowest cost
Intelligently position “just in case” resources, sized based on cost vs. benefit
9

Source: Venu Nagali, HP, presented at Real-options conference June 2007
Manage risks using structured contracts with suppliers
Flexible quantity
contract
Demand forecast (units)
Time
Fixed quantity
contract
0
100
200
300
400 Uncommitted
Hi scenario
Base scenario
Lo Scenario
1. Quantity Terms:
• Fixed Quantity
• Flexible Quantity
• Percent of HP
Demand
2. Pricing Terms:
• Market-based with
specified discounts
• Fixed price
• Price caps and floors
Structured Contract Terms
A combination of objectives from Assurance of Supply, Cost Savings & Cost
Predictability can be enabled by mixing & matching quantity and pricing terms

Capability #2: Quantify cost of supply chain flexibility
Jan Feb Mar Apr May Jan Feb Mar Apr May
Option 1: Low flexibility Option 2: High flexibility
Narrower supply chain pipe Wider supply chain pipe
Higher capacity utilization More inventory turns (materials, WIP, FGI) Lower cost
Lower capacity utilization Fewer inventory turns (materials, WIP, FGI) Higher cost
© Blake Johnson 11
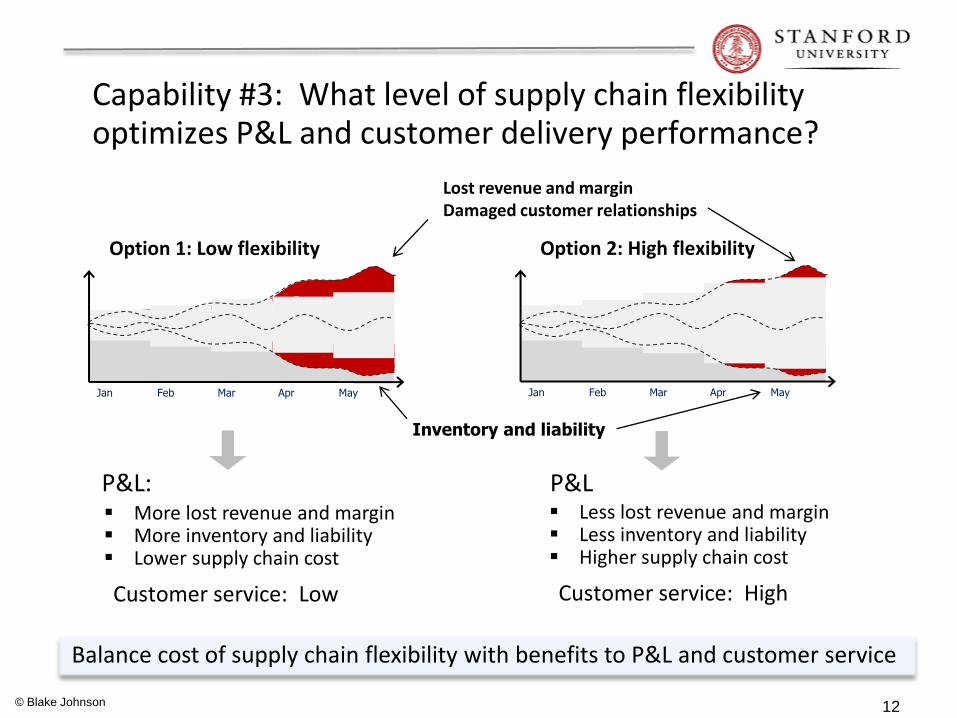
Capability #3: What level of supply chain flexibility optimizes P&L and customer delivery performance?
Jan Feb Mar Apr May Jan Feb Mar Apr May
Option 1: Low flexibility Option 2: High flexibility
P&L:
Customer service: Low
P&L
Balance cost of supply chain flexibility with benefits to P&L and customer service
More lost revenue and margin More inventory and liability Lower supply chain cost
Customer service: High
Less lost revenue and margin Less inventory and liability Higher supply chain cost
Lost revenue and margin Damaged customer relationships
Inventory and liability
© Blake Johnson 12
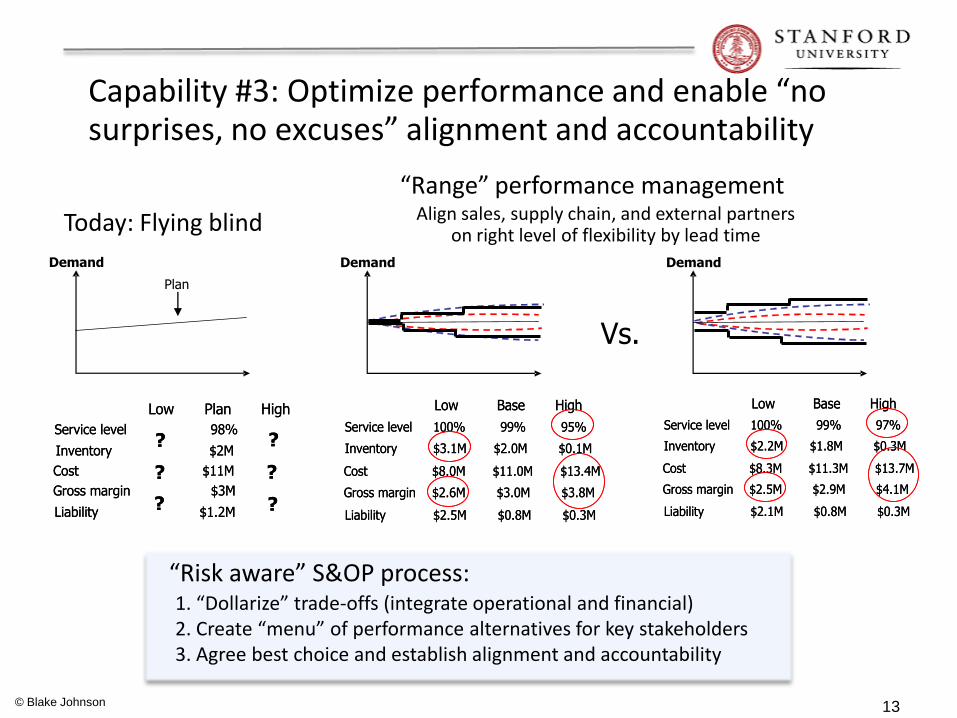
Capability #3: Optimize performance and enable “no surprises, no excuses” alignment and accountability
1. “Dollarize” trade-offs (integrate operational and financial) 2. Create “menu” of performance alternatives for key stakeholders 3. Agree best choice and establish alignment and accountability
Demand Demand
Vs.
“Risk aware” S&OP process:
“Range” performance management
Plan
Demand
Today: Flying blind
Service level 98%
Inventory $2M
Cost $11M
Gross margin $3M
Liability $1.2M
Low Plan High
?
?
?
?
?
?
Service level 98%
Inventory $2M
Cost $11M
Gross margin $3M
Liability $1.2M
Low Plan High
?
?
?
?
?
?
Service level 100% 99% 97%
Inventory $2.2M $1.8M $0.3M
Cost $8.3M $11.3M $13.7M
Gross margin $2.5M $2.9M $4.1M
Liability $2.1M $0.8M $0.3M
Low Base High
Service level 100% 99% 97%
Inventory $2.2M $1.8M $0.3M
Cost $8.3M $11.3M $13.7M
Gross margin $2.5M $2.9M $4.1M
Liability $2.1M $0.8M $0.3M
Low Base High
Service level 100% 99% 95%
Inventory $3.1M $2.0M $0.1M
Cost $8.0M $11.0M $13.4M
Gross margin $2.6M $3.0M $3.8M
Liability $2.5M $0.8M $0.3M
Low Base High
Service level 100% 99% 95%
Inventory $3.1M $2.0M $0.1M
Cost $8.0M $11.0M $13.4M
Gross margin $2.6M $3.0M $3.8M
Liability $2.5M $0.8M $0.3M
Low Base High
Align sales, supply chain, and external partners on right level of flexibility by lead time
© Blake Johnson 13
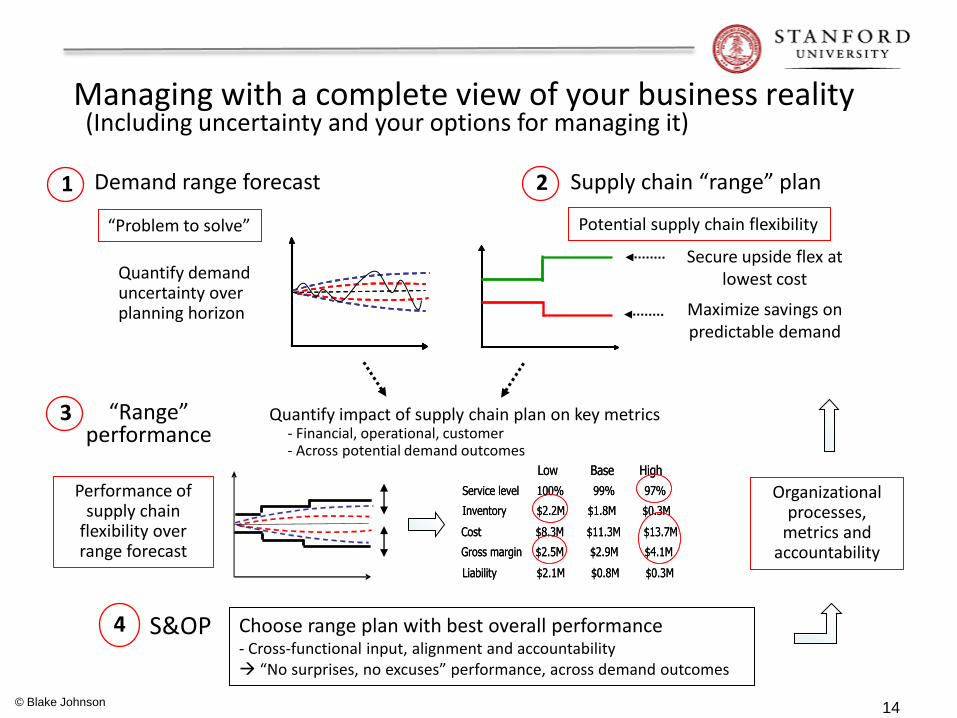
Managing with a complete view of your business reality
© Blake Johnson
Maximize savings on predictable demand
Secure upside flex at lowest cost
Supply chain “range” plan 2
Potential supply chain flexibility
Quantify impact of supply chain plan on key metrics - Financial, operational, customer - Across potential demand outcomes
Service level 100% 99% 97%
Inventory $2.2M $1.8M $0.3M
Cost $8.3M $11.3M $13.7M
Gross margin $2.5M $2.9M $4.1M
Liability $2.1M $0.8M $0.3M
Low Base High
Service level 100% 99% 97%
Inventory $2.2M $1.8M $0.3M
Cost $8.3M $11.3M $13.7M
Gross margin $2.5M $2.9M $4.1M
Liability $2.1M $0.8M $0.3M
Low Base High
“Range” performance
3
Performance of supply chain
flexibility over range forecast
Demand range forecast
Quantify demand uncertainty over planning horizon
1
“Problem to solve”
Choose range plan with best overall performance - Cross-functional input, alignment and accountability “No surprises, no excuses” performance, across demand outcomes
4 S&OP
Organizational processes,
metrics and accountability
(Including uncertainty and your options for managing it)
14

Q&A
© Blake Johnson 15


