

By: Engineering Consultants, Ltd. Stephen Forbes, PhD, PE, P.G.
(Principal investigator and author)
Rapid Socio-Economic and Hydrological Assessment of Prey Lang Forest Summary of Baseline Conditions
Rapid Socio-Economic and Hydrological Assessment of Prey Lang Forest Summary of Baseline Conditions
December 2013

Rapid Socio-economic and Hydrological Assessment of Prey Lang Forest –Summary of Baseline Conditions
Advancing Engineering Consultants, Ltd. 2
Table of Contents
1. INTRODUCTION ......................................................................................................... 5 1.1. Project Background ...................................................................................................... 6 1.2. Rapid Assessment Limitations ..................................................................................... 7
2. METHODOLOGY ........................................................................................................ 7 2.1. Study Area Delineation ................................................................................................. 8 2.2. Data Collection .............................................................................................................. 8 2.3. Hydrology Analysis ....................................................................................................... 8 2.4. Placing a Value on Ecosystems ................................................................................... 9 2.5. Dealing with Uncertainty, Incomplete and Imperfect Information ............................ 11 2.6. Economic Analysis ...................................................................................................... 11
2.6.1 Total Economic Value (TEV) .................................................................................... 12 2.6.2 Benefit Cost Analysis (BCA) ..................................................................................... 13
2.7. Sustainability Matrix .................................................................................................... 16 2.7.1 Matrix Methodology .................................................................................................. 16
3. STUDY AREA ........................................................................................................... 22 4. BASELINE CONDITIONS ......................................................................................... 23
4.1. Prey Lang Forest Baseline .......................................................................................... 24 4.1.1 Area and Physical Characteristics ............................................................................ 25 4.1.2 Carbon Cycle ........................................................................................................... 25 4.1.3 Prey Lang Forest Clearing Rates ............................................................................. 26 4.1.4 Economic Land Concessions ................................................................................... 26
4.2. Hydrology Baseline ..................................................................................................... 26 4.2.1 Watersheds .............................................................................................................. 27 4.2.2 Floodplain ................................................................................................................ 30 4.2.3 River Systems .......................................................................................................... 30 4.2.4 Groundwater............................................................................................................. 32 4.2.5 River Hydraulics ....................................................................................................... 33 4.2.6 Climate & Meteorology ............................................................................................. 34 4.2.7 Water Quality ........................................................................................................... 34 4.2.8 Water Uses .............................................................................................................. 37 4.2.9 Water Inventory Baseline.......................................................................................... 38
4.3. Ecosystem Services .................................................................................................... 40 4.3.1 Non-Timber Forest Products (NTFP) ........................................................................ 44 4.3.2 Fisheries Important to Prey Lang Forest .................................................................. 44
4.4. Socioeconomic Baseline ............................................................................................ 45 4.4.1 Timber Baseline ....................................................................................................... 45 4.4.2 Non-Timber Forest Products (NTFP) Baseline ......................................................... 46 4.4.3 Fisheries Baseline .................................................................................................... 47 4.4.4 Tourism Baseline ..................................................................................................... 47 4.4.5 Agriculture Baseline – Rice ...................................................................................... 48 4.4.6 Carbon Sequestration Baseline ................................................................................ 49 4.4.7 Payment for Environmental Services & Biodiversity ................................................. 50 4.4.8 Forest Ecosystem Services ...................................................................................... 51 4.4.9 Summary of Economic Valuation ............................................................................. 51 4.4.10 Baseline Sustainability Matrix ................................................................................. 52
5. CONCLUSIONS and RECOMMENDATIONS ........................................................... 53 6. APPENDIX A ............................................................................................................. 56
6.1. Supplemental Update Of Baseline Conditions .......................................................... 56

Rapid Socio-economic and Hydrological Assessment of Prey Lang Forest –Summary of Baseline Conditions
Advancing Engineering Consultants, Ltd. 3
6.1.1 Introduction .............................................................................................................. 56 6.1.2 Illegal Logging and migration.................................................................................... 57 6.1.3 REDD+ ..................................................................................................................... 57 6.1.4 FA Conservation Objective ....................................................................................... 59 6.1.5 Large Development Projects .................................................................................... 59 6.1.6 Potential Mining Projects .......................................................................................... 60 6.1.7 Railroad ................................................................................................................... 60 6.1.8 Dams ....................................................................................................................... 61 6.1.9 Political Will .............................................................................................................. 61 6.1.10 Summary ................................................................................................................ 62

Rapid Socio-economic and Hydrological Assessment of Prey Lang Forest –Summary of Baseline Conditions
Advancing Engineering Consultants, Ltd. 4
List of Figures Figure 1.1 Primary Themes of Sustainability .............................................................................................. 6 Figure 2.1 Generalize Study Area Water Balance ....................................................................................... 9 Figure 2.2 Total Economic Value (TEV) Framework ................................................................................. 12 Figure 2.3 Condensed lists of indicator parameters for the matrix ........................................................ 17 Figure 2.4 Matrix scoring ranges (Score = I x V x CL) .............................................................................. 18 Figure 2.5 Simplified Sustainability Matrix ................................................................................................ 20 Figure 3.1 Study & Focus Areas ................................................................................................................. 23 Figure 4.1 Conceptual Model of Prey Lang Forest Area .......................................................................... 24 Figure 4.2 Watershed Boundaries .............................................................................................................. 26 Figure 4.3 Study Area Water Inventory ...................................................................................................... 39 Figure 4.4 Fresh Water Services ................................................................................................................ 41 Figure 4.5 Potential Effects of Deforestation on Ecosystem Services ................................................... 43
List of Tables Table 4.1 Spatial Extent of Study Area ...................................................................................................... 24 Table 4.2 MRC Baseline Water Quality Index (WQI) for Prey Lang Study Area ..................................... 34 Table 4.3 MRC Water Quality Indicator Parameters ................................................................................. 35 Table 4.4 Cambodia Domestic Water Use ................................................................................................. 37 Table 4.5 Logged Timber TEV and NPV over 10 Years ............................................................................ 46 Table 4.6 NTFP TEV and NPV over 10 years ............................................................................................. 47 Table 4.7 Fisheries TEV and NPV over 10 years ....................................................................................... 47 Table 4.8 Tourism TEV and NPV over 10 years......................................................................................... 48 Table 4.9 Agriculture Baseline - Rice TEV and NPV over 10 years ......................................................... 49 Table 4.10 Carbon TEV and NPV over 10 years ........................................................................................ 50 Table 4.11 PES TEV and NPV ...................................................................................................................... 50 Table 4.12 Biodiversity TEV and NPV ........................................................................................................ 51 Table 4.13 Forest Ecosystem Services TEV and NPV .............................................................................. 51 Table 4.14 Baseline TEV, NPV, and GDP Contribution ............................................................................ 52 Table 4.15 Baseline Sustainability Scores ................................................................................................ 53

Rapid Socio-economic and Hydrological Assessment of Prey Lang Forest –Summary of Baseline Conditions
Advancing Engineering Consultants, Ltd. 5
1. INTRODUCTION This report summarizes the Rapid Socio-Economic and Hydrological Assessment of Prey Lang
Forest report dated July 2011 (referred as Primary Assessment Report herein-PAR). Its purpose
is not to replace the Primary Assessment, which contains the study assumptions, basic
information and details regarding the methods, but rather to provide a general overview of the key
elements of the Assessment. The Primary Assessment should be referred for more in depth
clarification. In addition, an informal and cursory follow-up review of the reported development
activities that have occurred in the PAR study area since it was submitted, was conducted as a
supplement to this Summary, and is located in the Appendix.
The objective of Primary Assessment was to conduct a preliminary socio-economic hydrological
analysis of the internal and external natural and social aspects of the Prey Lang Forest, and to
assess net negative and positive impacts on the forest and downstream ecosystems (economic
as well as ecological). The study focused specifically on the hydrological aspects of the forest, as
a whole, on which to build an optimum strategic decision model to maximize prudent sustainable
forest utilization without devaluating the natural capital and services provided by the forest. The
study was conducted in collaboration with the Royal Government of Cambodia (RGC) Forest
Administration and USAIDs Micro, Small and Medium Enterprises (MSME) initiative. It assessed
three forest management strategies taking into account the inherent natural services provided by
the Prey Lang Forest, considering the downstream economics, health and social impacts of the
different land uses relative to the hydrology cycle and environmental effects.
The three forest management strategies (Scenario 1, 2, and 3, respectively) considered were:
1. Conversion is the full exploitation and conversion of the existing forest to other land uses
in order to reap the maximum economic value of the timber in the shortest possible time
frame.
2. Preservation is to provide sufficient funding, policy, regulation and enforcement to protect
the forest from exploitation, environmental disruption and social-economic intrusion, to
preserve the remaining forest as is or better in perpetuity.
3. Conservation is the optimization of forest development and environmental conservation
by developing, implementing and maintaining a balanced sustainable land use
management approach involving local communities, advocacy groups, and economic

Rapid Socio-economic and Hydrological Assessment of Prey Lang Forest –Summary of Baseline Conditions
Advancing Engineering Consultants, Ltd. 6
enterprises in partnership with the national government to maximize optimum economic
returns, while minimizing disruptive environmental and social impacts.
Each scenario seeks to maximize the objective of the specific goals. For conversion, the objective
is to maximize revenues for economic benefits. For preservation, the objective is to maximize
forest protection to mitigate environmental concerns relative to social welfare. And for
conservation, the goal is to maximize the optimum balance between the two extremes. The
scenarios were assessed in term of the three main pillars of sustainability: environmental
protection, economic stability, and social wellbeing (Figure 1.1).
Figure 1.1 Primary Themes of Sustainability
1.1. Project Background The study area was the Prey Lang forest landscape, an evergreen dry forest located within
Kampong Thom, Preah Vihear, Stung Treng and Kratie Provinces in central Cambodia.
CARBON CREDIT PROGRAM
In 2007 the Intergovernmental Panel on Climate Change (IPCC) recognized that prevention of
both deforestation and degradation of tropical forest was the most practical immediate short-term
measure to curb the release of CO2 into the atmosphere. Consequently, Sustainable Forest
Management (SFM) practices encourage reduction of emissions from deforestation and
degradation policies (REDD) to increase carbon stocks by maintaining sinks. Collectively REDD
and SFM are referred to as REDD+. The UN pledged “fast-start” funds between 2010-2012 to
develop SFM in tropics to include production and ecosystem services.
The objectives of the emission reduction initiatives are to increase carbon stock by regulating
timber production and to provide a short term funding source to pay the carbon credit with the
Environmental Protection
Social Wellbeing
Economic Stability
Sustainable
Adapted from Conference Board, NYC 6/04

Rapid Socio-economic and Hydrological Assessment of Prey Lang Forest –Summary of Baseline Conditions
Advancing Engineering Consultants, Ltd. 7
idea that over time a self-sustaining carbon market will develop. The Study assumed that a
successful carbon credit market does develop. If such an effective carbon credit program does
not materialize, it is assumed that maximizing forest production and reforestation efficiencies,
enhancing yield of viable cash crops, and developing a robust ecotourism trade can achieve
equivalent value to that of a successful REDD+ program. In the case of Scenario 3, the carbon
storage capacity retains its value as Indirect Use (IUV as discussed in Section 2), and in the
cases of Scenario 1 and 2 it is a direct use value (DUV); therefore, in either case, carbon storage
is taken into account in the Benefit Cost Analysis (BCA). See Section 2.6.2.
This study relies on secondary information and makes a fair number of assumptions; however,
does try to introduce a level of replicable quantification by interpolating and extrapolating between
established low and high, best and worst case ranges. For the most part, this report relies on
either the mean or median of the ranges. This makes it relatively easy to conduct sensitive
analysis using different factors within the ranges, which is beyond the scope of this study, but
could be a very helpful follow-up.
1.2. Rapid Assessment Limitations The study was a rapid assessment based on existing secondary data and information compiled
during the project. Consequently, without sufficient quantitative information, a comprehensive
quantitative study cannot be conducted, but taking into account these limitations, this study does
provide a starting point and preliminary guidance, and highlights the data gaps that need to be
filled before a more quantitative study can be completed. In the meantime development is
occurring, and the use of the Sustainability Matrix tools discussed in Section 2.7, in combination
with TEV and BCA, as discussed below, provides a basis for determining which scenario most
likely presents an optimum strategy.
2. METHODOLOGY Methodologies used in this Assessment relied on standard methods and procedures to assess
watershed hydrology and river hydraulics, forestry management, soil classification and
environmental assessments (EA), total economic value (TEV), benefit cost analysis (BCA),
geographic information system (GIS), watershed analysis, etc. Preliminary community
participation assessment surveys were incorporated into the study

Rapid Socio-economic and Hydrological Assessment of Prey Lang Forest –Summary of Baseline Conditions
Advancing Engineering Consultants, Ltd. 8
2.1. Study Area Delineation The first step was to identify the regional characteristics within their known spatial boundaries
using available maps. Political and watershed boundaries were used for the initial assessment,
with Prey Lang Forest as the focal point.
Watershed boundaries were the defining factor for the hydrological study area because of the
dynamics of the hydrological cycle in relation to the forest, underlying aquifers, and surface water
hydrology and river hydraulics. All of these were then considered with respect to internal and
downgradient stakeholders, environmental impacts, and socio-economic conditions.
2.2. Data Collection A data and literature review was conducted of available records with respect to the study area to
assess bio-physical conditions including: topography and meteorology, land use and surface
cover, forested area, slopes, soil properties, and rainfall; and surface water flow characterization
such as: surface runoff patterns and infiltration, stream and flow rates, gradients and water
quality; and demographics: current and projected population estimates, public works infrastructure
update, changes in land use, economic sectors, and government policies.
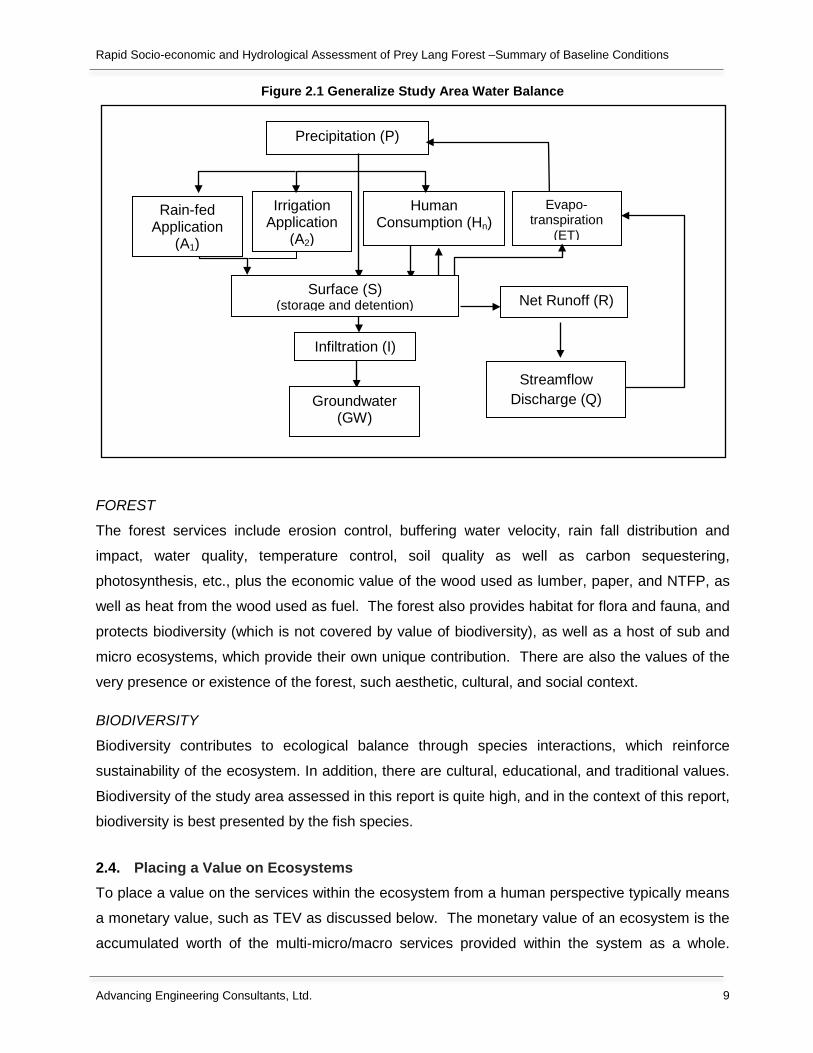
2.3. Hydrology Analysis WATER BALANCE
A generalized study area water balance was prepared using the information discovered. In
general, water balance is the sum of the volume of water flowing into the study area from all
sources versus the sum of water flowing out of study area. It provides a reference framework on
which to base watershed qualitative interpolation and extrapolations. Figure 2.1 shows the inputs
and outputs.
HYDROLOGIC AND HYDRAULIC CHARACTERISTICS
The historical data from available records was used to determine the Baseline Conditions.
Subsequently, a range of hydrological changes associated with each scenario was estimated.
While the data gaps and inconsistencies were many, the quantity of data over an extended period
of time did allow for a conceptual characterization of the study area.
WATERSHED
The watershed ecosystem contains a large set of subsystems each providing a list of unique and
complementary services. The value of the watershed services is the aggregate value of all the
ecosystem services provided within it.
Rapid Socio-economic and Hydrological Assessment of Prey Lang Forest –Summary of Baseline Conditions
Advancing Engineering Consultants, Ltd. 9
Figure 2.1 Generalize Study Area Water Balance
FOREST
The forest services include erosion control, buffering water velocity, rain fall distribution and
impact, water quality, temperature control, soil quality as well as carbon sequestering,
photosynthesis, etc., plus the economic value of the wood used as lumber, paper, and NTFP, as
well as heat from the wood used as fuel. The forest also provides habitat for flora and fauna, and
protects biodiversity (which is not covered by value of biodiversity), as well as a host of sub and
micro ecosystems, which provide their own unique contribution. There are also the values of the
very presence or existence of the forest, such aesthetic, cultural, and social context.
BIODIVERSITY
Biodiversity contributes to ecological balance through species interactions, which reinforce
sustainability of the ecosystem. In addition, there are cultural, educational, and traditional values.
Biodiversity of the study area assessed in this report is quite high, and in the context of this report,
biodiversity is best presented by the fish species.
2.4. Placing a Value on Ecosystems To place a value on the services within the ecosystem from a human perspective typically means
a monetary value, such as TEV as discussed below. The monetary value of an ecosystem is the
accumulated worth of the multi-micro/macro services provided within the system as a whole.
Precipitation (P)
Irrigation Application
(A2)
Evapo-transpiration
(ET)
Rain-fed Application
(A1)
Human Consumption (Hn)
Surface (S) (storage and detention) Net Runoff (R)
Streamflow Discharge (Q)
Infiltration (I)
Groundwater (GW)

Rapid Socio-economic and Hydrological Assessment of Prey Lang Forest –Summary of Baseline Conditions
Advancing Engineering Consultants, Ltd. 10
There are non-empirical methods being used to interpolate and extrapolate ecosystem value and
determine the monetary system of an ecosystem. The methods commonly attempt to base
service values on estimates of the replacement costs that humans would have to pay if the
service was no longer available. The measurable direct economic market value of a forest could
be the financial revenues obtained through logging the trees for lumber, harvesting non-timber
products such as honey and resin, and in some cases ecotourism based to the attraction of the
forest. The ecosystem value would be the environmental services it provides in stabilizing soils,
providing nutrients and pollination, temperature control, provide habitat for biodiversity,
photosynthesis, and sequestering carbon to name but a few. There are three methods commonly
used to assign a monetary value to ecosystems:
Mitigation costs - placing a price based on the cost of offsetting damages as a result of
activity impacting the ecosystem (e.g. pollution, or clearing land).
Willingness to pay (WTP) - WTP is based on surveys of different groups to determine
the amount of money they are willing to pay to preserve or conserve the various
services of an ecosystem.
An alternative to WTP is willingness to accept (WTA) in compensation to give up a
good, or put up with a bad (e.g. pollution).
Maintenance and protection costs - These costs are the estimated expenses it would
take to maintain and protect the system. Carbon sequestering could come under this
method.
All these methods are susceptible to the biases of the evaluator, and the situation of the
interviewee. The price a person says they are willing to pay is affected by their ability to pay.
Currently, there is no generally accepted standard for creating a monetary value for ecosystem
services in terms of dollars, although the UN TEEB method is an attempt at standardizing this
valuation. However, in most cases, including TEEB, no two estimates agree, hence the immense
disparity found in the references. Therefore, the use of any method must be done cautiously and
skeptically. This study integrates the methods with economic analysis discussed in the following
section and incorporated into a Sustainability Matrix (see Section 2.7).
The basic ecosystems addressed in this report are the forest and biodiversity as they affect or are
affected by the hydrology of the watershed, each including a list of services with some overlap.

Rapid Socio-economic and Hydrological Assessment of Prey Lang Forest –Summary of Baseline Conditions
Advancing Engineering Consultants, Ltd. 11
2.5. Dealing with Uncertainty, Incomplete and Imperfect Information In the context of this study, there are a lot of information gaps, resulting in a low confidence level.
Consequently the decision alternatives are:
• Wait and see – to do nothing until physical evidence occurs to confirm there is a concern.
• Conduct proactive scientific studies – confirm whether or not there is a valid concern, and in
the interim:
o Assume the worst case concerns are valid taking aggressive corrective action to
mitigate what might be a non-problem, or
o Assume less than the worst case most likely taking precautionary preemptive
measures to mitigate concerns, adjusting actions as more relevant information
becomes available.
An interpolation alternative is to determine a reasonable likely case within best case and worse
case scenarios based on confidence level in the date available as discussed in the Section 2.7.
2.6. Economic Analysis Total Economic Value (TEV), in conjunction with Benefit Cost Analysis (BCA), determined the Net
Present Value (NPV) of the Study Area in an attempt to consider the negative and positive
impacts of developing the forest.
TEV addresses direct use values, such as timber, NTFP and potentially effected economic
sectors, such as: tourism, fishing, and agriculture, and indirect or inherent services provided by
the forest, which could be valued in monetary terms, such as: carbon sequestering, biodiversity
and watershed stabilization.
BCA weighs the net result value of the benefits less the costs of taking a specific action, policy for
each of the respective scenarios.
While TEV and BCA both use monetary units, the services provided by the various ecosystems
within the study area cannot always be measured in purely financial terms. Consequently, a
“Sustainability Matrix” was established to normalize the measurement units of the different
parameters in order that they could be considered on a common basis. The matrix provides a
platform on which to assess sustainability as a function of its three primary aspects (social,
environmental and economic).

Rapid Socio-economic and Hydrological Assessment of Prey Lang Forest –Summary of Baseline Conditions
Advancing Engineering Consultants, Ltd. 12
Collectively, the TEV, BCA and the Sustainability Matrix can be used by policy makers as a tool to
determine an optimum strategy to achieve a sustainable economic, social, and environmental
policy that will maximize the benefits, and minimize the losses for the greatest good of all aspects.
2.6.1 Total Economic Value (TEV) The TEV is an economic evaluation method, which integrates the various economic values of the
forest, from direct benefits, like timber, to indirect intangible benefits such as forest ecosystem
services. The indirect ecosystem valuation takes into account the various complex dynamics
between the forest, the environment and socio-economic concerns and establishes a monetary
value for its intrinsic services (see Figure 2.2).
Figure 2.2 Total Economic Value (TEV) Framework
(Adapted from Hansen & Neth 2006; OECD, 2000)
The TEV is the sum of all use and non-use values for the given resource or service being
measured. The TEV framework incorporated data from the Cambodia Development Resource
Institute (CDRI), and referenced in “Natural Forest Benefits and Economic Analysis of Natural
Forests Conversion in Cambodia, Working Paper 33” (Hansen and Neth, 2006).
Total Economic Value (TEV)
Use Values Direct Use
Values (DUV) Timber
Non-Timber Forest Products (NTFP)
Fisheries
Agriculture
Tourism
Indirect Use Values (IUV)
Forest Ecosystem Services (FES)
Carbon Sequestration
Payment for Environmental Services (PES)
Biodiversity
Options Values (OP)
Industrial / hydropower
Recreational
Alternative Land Use
Non-use Values
Existence Values (EV)
Aesthetics
Cultural
Religious

Rapid Socio-economic and Hydrological Assessment of Prey Lang Forest –Summary of Baseline Conditions
Advancing Engineering Consultants, Ltd. 13
The formula for Total Economic Valuation (TEV) is (Refer to Figure 2.2).
𝑇𝐸𝑉 = 𝑈𝑉 + 𝑁𝑈𝑉 = (𝐷𝑈𝑉 + 𝐼𝑈𝑉 + 𝑂𝑉) + 𝐸𝑉
For the purposes of this assessment, TEV focused on DUV, IUV, and OV, although the ten-year
study time frame is relatively short in assessing future options of the study area. The TEV does
not include EV, because it is difficult to establish a consensus value to the inputs included in this
parameter. Therefore, this study utilizes the following equation adapted from above:
𝑇𝐸𝑉 = 𝐷𝑈𝑉 + 𝐼𝑈𝑉
The economic value calculated for the baseline year (2010) and the NPV value is projected over
the ten-year study period.
2.6.2 Benefit Cost Analysis (BCA) Benefit Cost Analysis (BCA) is a decision tool, which evaluates projects according to positive
direct and indirect outcomes of a decision and compares them to their negative effects, that is, the
net gain or loss as a result of the implementing the decision. “Direct” refers to conditions for which
a monetary value can be assigned and measured in a national currency, such as the economic
value of harvesting the lumber from a forest, typically in US Dollars (USD). Indirect benefits are
those conditions for which there are no markets to define a monetary value and includes most of
the intangible services provided by environmental systems, such the value of trees to sequester
greenhouse gases, or the unrecovered costs of pollution.
The BCA takes into account direct benefits and costs by calculating TEV, and indirect benefits
and costs using estimated values of ecosystem serves, such as forest watershed services and
biodiversity (TEEB, The Economics of Ecosystems & Biodiversity.)
A weighted matrix allows for scoring of the common major themes (economics, social, and
environmental) of each scenario, using theme specific indicator parameters. Because of the
subjectiveness of the analysis, the longer the list of common indicator parameters the better the
score reflects the position of the stakeholders, and the higher degree of assurance that common

Rapid Socio-economic and Hydrological Assessment of Prey Lang Forest –Summary of Baseline Conditions
Advancing Engineering Consultants, Ltd. 14
∑∑∑=== +
−=+−+=n
tnnn
n
t
nn
n
t
nn r
CBrCrBNPV000 )1(
)1/()1/(
ground will be identified upon which an accord can be reached. Each score provides a qualitative
measure of the respective theme, and collectively, the total score provides the foundation on
which to base a decision with a reasonable level of confidence. The higher the score the greater
the potential net advantages to be gained, the closer the scores are indicates level of consensus
and disparity.
NET PRESENT VALUE (NPV)
The first step of the BCA analysis requires determining the present value of a particular forest
service and then converting the net value of benefits and costs to NPV over 10 years. Any
positive NPV is considered beneficial and the higher the NPV, the more economically viable a
project will be compared those with lower values. A discount rate converts the future value (FV) of
benefits and cost into present day value (PV). While it is not arbitrary, it is discretionary and
subject to debate generally ranging from 6-12% depending on circumstances. It is not the prime
interest rate, but rather a projection of future economic indices, including interest rate, inflation or
recession, and growth rates and therefore referred to as discounted cash flow (DCF, or ‘r’). For
this study, a discount rate of 8% was used due to the shorter time frame of 10 years. It is used
within this study for illustrative purposes only and a project specific DCF should be determined on
a application conditions.
The NPV is calculated as follows (Chheng, 2007):
Net Present Value (NPV):
𝑁𝑃𝑉 = ∑ 𝑃𝑉𝑏𝑒𝑛𝑒𝑓𝑖𝑡𝑠𝑛𝑟=0 + ∑ 𝑃𝑉𝑐𝑐𝑜𝑠𝑡𝑛
𝑟=0
{Note: Σ indicates sum of formula iteration.}
Where:
Bn = value of benefit in year n
Cn = value of cost (loss) in year n
n = year of B and C (0,1,2…………n when is final year of study)
t = starting year of study, 0= current year
r = discounted rate
Rapid Socio-economic and Hydrological Assessment of Prey Lang Forest –Summary of Baseline Conditions
Advancing Engineering Consultants, Ltd. 15
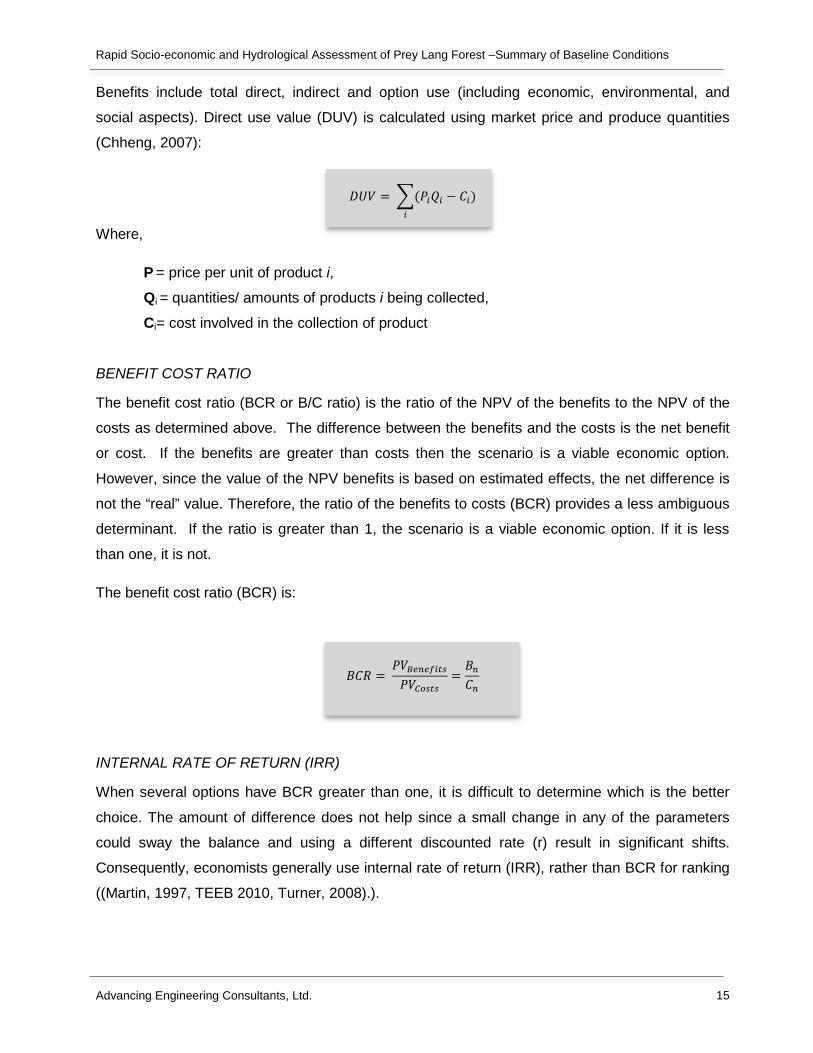
Benefits include total direct, indirect and option use (including economic, environmental, and
social aspects). Direct use value (DUV) is calculated using market price and produce quantities
(Chheng, 2007):
𝐷𝑈𝑉 = �(𝑃𝑖𝑄𝑖 − 𝐶𝑖)𝑖
Where,
P = price per unit of product i,
Qi = quantities/ amounts of products i being collected,
Ci= cost involved in the collection of product
BENEFIT COST RATIO
The benefit cost ratio (BCR or B/C ratio) is the ratio of the NPV of the benefits to the NPV of the
costs as determined above. The difference between the benefits and the costs is the net benefit
or cost. If the benefits are greater than costs then the scenario is a viable economic option.
However, since the value of the NPV benefits is based on estimated effects, the net difference is
not the “real” value. Therefore, the ratio of the benefits to costs (BCR) provides a less ambiguous
determinant. If the ratio is greater than 1, the scenario is a viable economic option. If it is less
than one, it is not.
The benefit cost ratio (BCR) is:
𝐵𝐶𝑅 = 𝑃𝑉𝐵𝑒𝑛𝑒𝑓𝑖𝑡𝑠𝑃𝑉𝐶𝑜𝑠𝑡𝑠
=𝐵𝑛𝐶𝑛
INTERNAL RATE OF RETURN (IRR)
When several options have BCR greater than one, it is difficult to determine which is the better
choice. The amount of difference does not help since a small change in any of the parameters
could sway the balance and using a different discounted rate (r) result in significant shifts.
Consequently, economists generally use internal rate of return (IRR), rather than BCR for ranking
((Martin, 1997, TEEB 2010, Turner, 2008).).

Rapid Socio-economic and Hydrological Assessment of Prey Lang Forest –Summary of Baseline Conditions
Advancing Engineering Consultants, Ltd. 16
IRR determines the interest rate at which the net present value is equal to zero or the BCR=1,
and is determined by trial and error. It determines the order of NPV results and indicates which
option offers the optimum outcome.
𝐼𝑅𝑅 = 𝑖𝑛𝑡𝑒𝑟𝑒𝑠𝑡 𝑟𝑎𝑡𝑒 𝑤ℎ𝑒𝑛 𝑁𝑃𝑉 = 0
𝑟′𝑤ℎ𝑒𝑛 𝑁𝑃𝑉 = �(𝐵𝑛 − 𝐶𝑛)(1 + 𝑟)𝑛
𝑛
𝑖=0
= 0
All these methods provide a metric to help reach a decision with a qualitative level of confidence
when there is not enough information to be able make a quantitative assessment. One decision
could be to fill the data gaps needed to identify a better-defined course of action. In addition, the
matrix provides a good general portrait of different options, themes and indicator parameters,
which provide grounds for understanding and cooperation.
2.7. Sustainability Matrix The Sustainability Matrix is a chart that provides a quasi-quantitative method to systematically
score sets of central themes and indicator parameters to identify, and evaluate areas of conflict
and basis for resolution, and consensus on aspects that can be implemented collaboratively to
solve common problems.
The Sustainable Matrix is used here to weigh and compare the 3 scenarios as presented in
Section 1.0. To be of real value it must be evaluated by all the individual stakeholders
independently and then compiled by process of elimination into a consensus to be used to
establish a plan of action to implement the optimum strategy, a Sustainable Development
Extension Plan, to set goals and identify performance and accountability measures to ensure
continuous improvement is made toward reaching the goals.
2.7.1 Matrix Methodology The Sustainability Matrix is unique in that it integrates economic, social and environmental
themes into one score, which can also be considered either as broad themes or individual
indicator parameters. It is three-dimensional in that it considers the three pillars of Sustainability
(Environmental Protection, Economic Stability and Social Wellbeing) as one system.

Rapid Socio-economic and Hydrological Assessment of Prey Lang Forest –Summary of Baseline Conditions
Advancing Engineering Consultants, Ltd. 17
INDICATOR PARAMETERS (IP)
Like pixels in a photograph the greater the number, the greater the clarity of the image, so too the
greater the number of data points, the better a representation and understanding of the scenarios
is achieved. The lower confidence level in the available data, the greater the number of
parameters needed to offset the weaknesses.
The composite list of IP used for this assessment was derived from Sudex (Forbes, 2009),
Indicators of Sustainable Development (UN), and The Wellbeing of Nations (Prescott-Allen, 2001)
and is comprised of nearly 300 parameters, divided into three aspects of sustainability. The
composite list was reduced to items that were directly or indirectly affected by the forest logging,
and surface water affects. The revised list includes 112 parameters. Figure 2.3 provides a
condensed list of indicator parameters used for the matrix.
Figure 2.3 Condensed lists of indicator parameters for the matrix
CONFIDENCE LEVEL (CL)
Ideally, at least three confirming references would be available for each datum, without which the
confidence level (CL) in the information would be lowered. With each data compromise, the CL
decreases. Figure 2.4 presents the CL ranges.
Economics
•GDP Annual Growth •GDP per Capita •Agriculture •Tourism •Fisheries •Employment •Timber •Water use •Production
Social
•Poverty • Income Ratio •Shelter •Water resource •Health •Education •Governance •Sanitation •Food Security
Environment
•Landuse •Water quality •Water treatment •Forest cover •Carbon •Biodiversity •Air quality •Climate •Erosion •Soil quality

Rapid Socio-economic and Hydrological Assessment of Prey Lang Forest –Summary of Baseline Conditions
Advancing Engineering Consultants, Ltd. 18
Figure 2.4 Matrix scoring ranges (Score = I x V x CL)
The CL can range from subjective personal biases to objective professional experience and
judgments. The total score and overall CL reflect the range of perspectives. The lower the
confidence level, the higher the number of indicator parameters necessary to create a satisfactory
image. The best that a rapid assessment (RA) can attain is a CL of between 0.5-0.7, because it
relies on secondary information. A CL of greater than 0.5 should provide an indication that
consensus can be reached and there is confidence that there at least a 50-50 chance that the
same decision would be reached, even though the relative scores conducted by different
individuals of the same cohort are different.
Cambodia has been diligently and proactively generating essential information over an extended
period of years, but there remain many data gaps. Consequently, the assessment CL ranged
from 0.5-0.7 in each of the three sustainability aspects evaluated for each scenario.
Whether to include CL in the score is dependent upon the objectives of the specific study and the
available data. In this case CL was included to take account of the data gaps, and inconsistencies
in the data. Discretely, the CL and importance (I) can be used to determine which IP have the
most important data gaps that need to be filled.
IMPORTANCE (I)
The list of indicator parameters for potential forest impacts was subdivided into the three
sustainability themes and the scale of relative importance was established from 1-3 to prioritize
their importance. ‘I’ provides a measurable relationship between the individual parameters and
the themes, and helps in strategic planning to rank the different objectives, and along with CL can
help to identify where funds should budgeted for additional investigation.
Importance (I)
• 1 = least important
• 2 = moderately important
• 3 = most important
Value (V)
• 1 = substantial negative impact
• 2 = moderate negative impact
• 3 = no significant change
• 4 = moderate positive impact
• 5 = significant positive impact
Confidence Level (CL)
• < 0.5 not enough information
• 0.5 - 0.6 subjective but based on sufficient research
• 0.6 - 0.7 sufficient quantifiable data available
• 0.8 rigorous confirmed quantitative data or strong consensus

Rapid Socio-economic and Hydrological Assessment of Prey Lang Forest –Summary of Baseline Conditions
Advancing Engineering Consultants, Ltd. 19
VALUE (V)
A value (V) was assigned for each parameter relative to its potential impact within each of the
scenario strategies as it affects the sustainability themes. The value is determined for each
parameter for each scenario by asking the question: “Given the objective of the scenario, how will
the parameter impact each of the themes based on the scale of 1-5?”
ASSSUMED BEST CASE AND WORST CASE
Reasonable worse case/best case scenarios are common methods used in risk and financial
analysis to reach a decision when there is insufficient information to establish a quantifiable level
of confidence. The specific guidelines used for the Study are provided in the Primary Assessment
Report. The following offers a general outline based on the assumed level of confidence (CL) in
the data and/or default conditions assumed represent the reasonable worst and best cases,
where a CL less than 0.5 insufficient, .5 -0.7 low but sufficient and above 0.7 to 0.9 as fair to
good.
Since a low CL is typical for the information discovered during the Study, quantifiable reasonable
likelihood of occurrence could not be established, and an assumed worst and best case
(AWC/ABC) was hypothesized for each variable using professional judgment and experience, and
stakeholder group consensus. Assumed likely case (ALC) was derived from the mean. Small
percentage differences can make a large difference in the baseline values over the ten-year study
period. Relatively low percentages were used for this study to be ultra conservative. The values
are used as default estimates on which to determine the ultimate score tabulated from the
Sustainability Matrix, used to choice between the options under consideration. Furthermore the
CL identifies and prioritizes the data gaps which would need to be filled first, while concurrently
strategic planning and policies can be established implementing the scenario which has the
highest potential for improving the social, economic and environmental aspects, without having to
wait until all the information is complete and adequate, much less perfect. Basis for the
AWC/ABC are summarized in Tables 2.1a and b of the Primary Assessment.
SCORING
The subtotal score (S) is determined by multiplying I x V x CL for each indicator parameter
relative to the respective sustainability theme under each scenario. The total score (S) for the
respective scenario is then determined summing the subtotal S. The subtotals are added for each
parameter theme and the Grand Total Score is the total for each scenario and the CL is averaged
Rapid Socio-economic and Hydrological Assessment of Prey Lang Forest –Summary of Baseline Conditions
Advancing Engineering Consultants, Ltd. 20
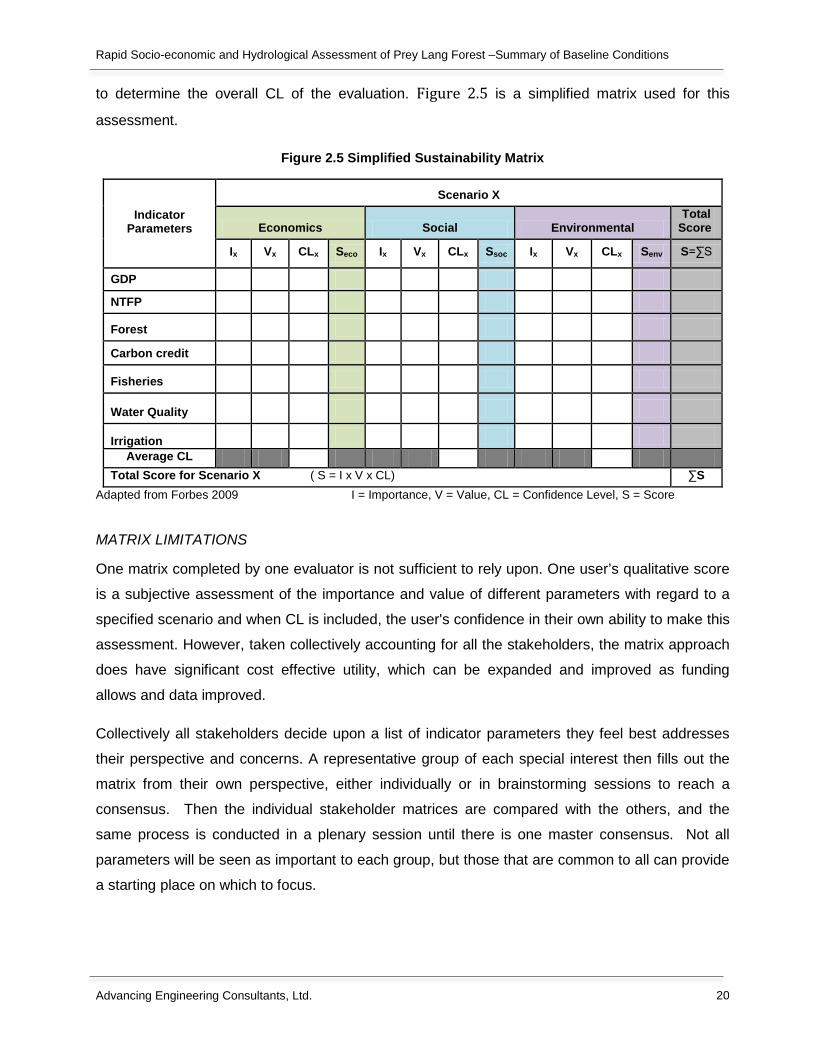
to determine the overall CL of the evaluation. Figure 2.5 is a simplified matrix used for this
assessment.
Figure 2.5 Simplified Sustainability Matrix
Indicator Parameters
Scenario X
Economics Social Environmental Total
Score
Ix Vx CLx Seco Ix Vx CLx Ssoc Ix Vx CLx Senv S=∑S
GDP
NTFP
Forest
Carbon credit
Fisheries
Water Quality
Irrigation
Average CL Total Score for Scenario X ( S = I x V x CL) ∑S
Adapted from Forbes 2009 I = Importance, V = Value, CL = Confidence Level, S = Score
MATRIX LIMITATIONS
One matrix completed by one evaluator is not sufficient to rely upon. One user’s qualitative score
is a subjective assessment of the importance and value of different parameters with regard to a
specified scenario and when CL is included, the user's confidence in their own ability to make this
assessment. However, taken collectively accounting for all the stakeholders, the matrix approach
does have significant cost effective utility, which can be expanded and improved as funding
allows and data improved.
Collectively all stakeholders decide upon a list of indicator parameters they feel best addresses
their perspective and concerns. A representative group of each special interest then fills out the
matrix from their own perspective, either individually or in brainstorming sessions to reach a
consensus. Then the individual stakeholder matrices are compared with the others, and the
same process is conducted in a plenary session until there is one master consensus. Not all
parameters will be seen as important to each group, but those that are common to all can provide
a starting place on which to focus.

Rapid Socio-economic and Hydrological Assessment of Prey Lang Forest –Summary of Baseline Conditions
Advancing Engineering Consultants, Ltd. 21
STRATEGIC PLANNING
The primary purpose of the Sustainability Matrix within the context of this assessment is to
provide a holistic qualitative measurement for each of the individual themes and then a
comparative score for each of the scenarios. The matrix serves as a screening tool providing a
way and means to establish priorities, evaluate thematic interrelations, and identify the most
helpful information gaps that need to be closed in order to conduct a more quantitative
assessment. In addition, once the appropriate data gaps filled, it provides a good foundation for
systems analysis to assess quantitative alternatives and reach optimum decisions.
While beyond the scope of this assessment, the matrix provides a strategic planning tool to
prepare holistic long term Sustainable Development Extension Plan (SuDeX Plan). Using the
matrix, a baseline score can be established for conditions as they are now, and a target score can
be established for where the participating parties would like to be it the future that becomes the
goal to strive for.
It is important to recall that the scores presented in this report, while representative of the findings of this assessment, are for illustrative purposes only, since it represents only the perspective of the investigators, which is of value for its objectivity, but is lacking in cultural perspectives of the stakeholders who are directly affected by the outcome and are essential for the score to have any substantive value.
Taking all these factors into consideration a potential course of action to reach a modified target
will become apparent. Using this course of action as a guide, the SuDeX plan can be prepared
using a phased approach incorporating additional measurements (e.g. funding, political will, best
available appropriate technology, probabilities and feasibility) to establish reasonable attainable
targets as data gaps are filled.
Scores are determined for current conditions (CS1) and target scores (TS) are set for short and
long term goals. As progress is made toward reaching TS, interim baseline score (CSi) is
reassessed at critical milestones, providing a measure performance over time. The ratio of the
CS1 to CSi indicates the degree of improvement from the start and the ratio of the different CS to
the TS provides relative measures of what progress has been made toward achieving goals and
how much more needs to be accomplished. These monitoring and evaluation indices encourage
follow-up and follow-through, and assess progress highlighting where the Plan needs to be
revised and improved. In addition, the indices provide a benchmark to which the responsible

Rapid Socio-economic and Hydrological Assessment of Prey Lang Forest –Summary of Baseline Conditions
Advancing Engineering Consultants, Ltd. 22
parties can be held accountable to assure the desired optimum level of sustainable economic
stability, social wellbeing, and environmental protection can be attained.
3. STUDY AREA There is no official legal boundary that identifying the limits the Prey Lang Forest, and since the
focus of the study is to assess impacts of forest activities on hydrology to evaluate optimum forest
management strategies, to look only to the forest fringe zone would be insufficient. Therefore the
Study Area was defined by the three watershed boundaries that encompass the forest landscape
and those indicator parameters that could be most affected by the impacts. Stung Sen, Stung
Chinit, and Siem Bok are the primary watershed. Within the Study Area are three focus areas
identified as representative of the different perspectives considered in the study affected by the
forest and hydrology. Focus Area A is the Prey Lang Forest itself. Area B is the upgradient area
and potentially important aquifer resources that could affect and be affected by forestry
development. The current conditions within Focus Area C serves as the basis for socio economic
conditions used to assess downgradient changes as a result of the hydrological affects of forestry
development over the ten year study time period. Figure 3.1 shows the Study Area Boundaries of
the general outline of the Focus Areas.
The primary forest activity considered as part of this study was the harvesting of the trees for
logging value, since this would have the most significant economic, social, and environmental
impact on the surface water. The primary social economic impacts focus on the positive and
negative effects of resource development on local populations living in and around the forest and
the urban economic centers downgradient of the forest with in Focus Area C. However what
happens outside the Study Area cannot be excluded because upstream activities along the
Mekong River and within its primary and secondary watersheds to the east of the River have a
major impact on the reach of the river affected by the Forest, and watersheds to the west draining
into the Tonle Sap Lake are significantly affected by changes within the Study Area

Rapid Socio-economic and Hydrological Assessment of Prey Lang Forest –Summary of Baseline Conditions
Advancing Engineering Consultants, Ltd. 23
Figure 3.1 Study & Focus Areas
4. BASELINE CONDITIONS Baseline Conditions are the existing conditions of the Study Area relevant to the assessment and
provide a benchmark with which to measure results of changing conditions, in this case changes
in the forest and hydrology. The Figure 4.1 presents a conceptual model of the Prey Lang Forest
Study Area.
Baseline components include the forest itself, the hydrology of the watershed and how changes to
these might impact the river and lake hydraulics. Those aspects, which can be assessed based
on monetary value, either directly or indirectly, are addressed in the TEV and BCA calculations
(Sections 2.6.1 and 2.6.2), which provide the foundation of the Baseline model. In addition, a
myriad of unquantifiable parameters are evaluated in the Sustainability Matrix (Section 2.7) with
which to assess the potential sustainability of each of the scenarios.

Rapid Socio-economic and Hydrological Assessment of Prey Lang Forest –Summary of Baseline Conditions
Advancing Engineering Consultants, Ltd. 24
Figure 4.1 Conceptual Model of Prey Lang Forest Area
4.1. Prey Lang Forest Baseline A variety of factors contribute to forest loss including: logging (both commercial and illegal),
agriculture, fuel wood, new settlements, roads (logging and development), as well as forest fires
and infrastructure development (MRC, 2003). Using maps showing the area of forest cover at
different stages of development, the rate of area forest decay could be estimated over time.
The Study Area is as defined by the boundaries of the three watersheds is approximately 33,448
square kilometers (3,344,800 ha) in total as shown in Table 4.1.
Table 4.1 Spatial Extent of Study Area
“All systems, biotic and physical, are interrelated, and are important to the optimal state that best suits the needs of the system as a whole.“

Rapid Socio-economic and Hydrological Assessment of Prey Lang Forest –Summary of Baseline Conditions
Advancing Engineering Consultants, Ltd. 25
4.1.1 Area and Physical Characteristics Since the Forest boundary limits have not been officially defined, different limits have been used
to estimate the total landscape, as discussed in the Assessment. Using historical forest cover
maps, the Prey Lang Forest was estimated to be 834,000 hectares (ha) for this study with the
following physical characteristics.
FOREST TYPE DISTRIBUTION
The evergreen, semi evergreen and dry deciduous forests cover an area of 760,000 ha. The rest
of the area is designated as non-forest and includes: degraded/other forest, grass, agriculture,
plantations and shrub lands.
Wood density for evergreen forest is 128 m3/ha with a cover ranging between 70-90% depending
on density. For deciduous forest the density is 95 m3/ha with cover significantly lower and
seasonal. Mixed forests fall somewhere in between.
SOILS
The predominant soils of the forest are shallow hydromorphic soils and deep podzols. These soils
tend to have poor fertility, and consequently low potential for agricultural use. However, there are
small areas of alluvial organic sediments within dry evergreen forests, which provide rich soil
more favorable to farming.
The poor drainage soils are in the low land areas with little infiltration and low velocities. The
storage capacity characteristics of the podzols would indicate a low infiltration with higher
drainage potential, but with slow velocities due to the generally low gradients of the topography.
TOPOGRAPHY
Slopes within the Assessment study area are generally flat, with slopes ranging from 0.15% to
1.8%. Siem Bok has steeper slopes ranging from 0.4%-1.8%.
4.1.2 Carbon Cycle Of all the services provided by the forest, photosynthesis and carbon sequestering may have a
more urgent value today because of the growing awareness of the effects of excess
concentrations of carbon dioxide (CO2) building up in the atmosphere— a likely cause of climate
change.
Some of the carbon is stored in the biomass (sequestered) and the remainder is converted back
into CO2 and respired back into the atmosphere. All plants go through this process, but the large

Rapid Socio-economic and Hydrological Assessment of Prey Lang Forest –Summary of Baseline Conditions
Advancing Engineering Consultants, Ltd. 26
mass of a tree’s biomass makes them especially effective in removing large volumes of CO2 from
the atmosphere. The effectiveness is increased with size of the tree. Tropical and swamp trees
(wetlands or ramsar) are considered among the most effective. The Prey Lang Forest provides
an excellent bank in which to sequester CO2.
4.1.3 Prey Lang Forest Clearing Rates The estimates of forest clearing rates are based on comparing forest cover over the years as
interpreted by the various sources. It is estimated that the Prey Lang cover has decreased by
approximately 6% since 1973 with most of it occurring in the northern most reaches of the forest.
An eight-fold increase since 1998 indicates that significant Prey Lang Forest exploitation has
occurred since then, with a slight decrease after 2004, when a government moratorium was
placed on logging concessions within the forest.
Prior to 2004 the cover loss to date is assumed to be have been primarily through legal logging
and clearing of deciduous forest for settlements, subsistence farming and firewood, with some
illegal. Since that time illegal logging and the encroachment for agriculture is the most likely
cause.
4.1.4 Economic Land Concessions Approximately 288,525 ha have been let as Economic Land Concessions (ELCs) within the
provinces of the study areas, for teak, rubber, Fang lean, acacia, and agro industry. Prey Lang is
governed by the Forest Law, and classified as state private land. ELCs can apply to a forest or
any tract of land; however, the 2004 moratorium on logging forest limited the economic viability of
forestry in many concessions.
4.2. Hydrology Baseline Figure 4.2 shows the layout of the three watersheds that make up the Study Area. The heavy blue
is the boundary to the Study Area and outer limits of the Stung Sen to west ultimately discharging
into the Tonle Sap Lake and River, and the Siem Bok, which for the most part drains into the
West Bank of the Mekong River, except the small area in the southwest end flowing into the Tonle
Sap River A major topographical divide separates the drainage from the Tonle Sap Basin and
the Mekong, with the Stung Chinit and Stung Sen draining to the west into Tonle Sap River, and
the Siem Bok predominantly flowing to the east and south east .
Figure 4.2 Watershed Boundaries

Rapid Socio-economic and Hydrological Assessment of Prey Lang Forest –Summary of Baseline Conditions
Advancing Engineering Consultants, Ltd. 27
4.2.1 Watersheds The primary water sources to the Tonle Sap Lake are the Mekong River (57%), watershed
tributary discharge (30%) and precipitation (13%). The study area is comprised of the three
watersheds, Stung Sen, Stung Chinit, and Siam Bok, mentioned earlier. These three watersheds
make up about 22% of the entire Cambodian Mekong River Basin catchment area and are briefly
described below.
STUNG SEN WATERSHED
The Stung Sen Watershed includes most of the Preah Vihear Province to the north and most of
the northern half of the Kampong Thom Province to the south. This watershed is sparsely
populated, although the river is a major tributary to Tonle Sap.
Hydrological and Meteorological data reported an average precipitation of 1460 mm per year and
evaporation rates of 1550 mm per year. The average runoff is estimated at 11,685 m³/s (WEPA,
2010).
Changes in Stung Sen River flow have been reported since 2000. These changes are reportedly
due to forest concessions in the Prey Lang Forest resulting in an apparent corresponding

Rapid Socio-economic and Hydrological Assessment of Prey Lang Forest –Summary of Baseline Conditions
Advancing Engineering Consultants, Ltd. 28
increase in flooding (Mak, 2005). However, the relative scale would indicate that there is
insufficient information to draw any definitive correlation one way or the other.
Stung Sen Irrigation
There are currently no irrigation systems in this watershed and the river floodwaters provide water
for farmland. Feasibility and environmental studies are being conducted to assess building a large
irrigation/hydropower system on the Stung Sen River to increase irrigated land as much as
130,000 ha; potentially tripling current paddy rice production. In addition, the system would
provide estimates of 40MW of hydropower (Sithi.org, 2009).
Stung Sen River Fisheries
The Stung Sen River is a tributary of the Tonle Sap providing an important migratory path for fish.
Currently, the Stung Sen watershed provinces are generally undeveloped, and the portion of the
Prey Lang forest in the area is relatively small. However if the proposed irrigation/hydropower
plant is constructed and the forest developed, it seems likely that this area will experience
significant growth.
Changes along the river hydraulics as a result of forestry and dam construction, would have a
noticeable effect on local fishing, as well as Tonle Sap fisheries, this includes the irrigation dams
and reservoirs, with the outflow through spills replenishing oxygen concentrations, reduced within
the reservoir due to decay of organic material. The oxygen increase in outflow can be as much as
20% of the inflow into the reservoir (Baran, 2007).
STUNG CHINIT WATERSHED
The Stung Chinit flows into the Tonle Sap Great Lake River. The Stung Chinit watershed includes
the southern portion of the Kampong Thom Province and the northern portion of the Kampong
Cham Province, which lie north of the Mekong River.
The area receives an average of 1400mm of rain per year and evaporates 1,530mm per year
based on data covering the period from 1960-1990. The average discharge (total cumulative
runoff) from the Stung Chinit watershed is estimated to be 6,711 m³/s (WEPA, 2010).
Stung Chinit Irrigation
The Stung Chinit Irrigation System and Rural Infrastructure Project is currently the largest in
Cambodia and has been in operation since 2006, as part of the Second Socio-Economic Plan of
Cambodia, to reduce poverty by improving agricultural production by increasing irrigation
coverage. Therefore, it is anticipated that irrigation capacity will increase substantially over time,

Rapid Socio-economic and Hydrological Assessment of Prey Lang Forest –Summary of Baseline Conditions
Advancing Engineering Consultants, Ltd. 29
within the study area and throughout the country (Baran, 2007).
The Stung Chinit reservoir is approximately 12 km long with a total storage area of 25 km². Up to
60 million m3 (mcm) of water can be stored. The spillway is built across the Stung Chinit River to
irrigate surrounding agricultural land in Santuk and Baray districts of Kampong Thom.
There are two Tonle Sap tributaries in the area: Stung Chinit and Tang Krasang. The project is
intended to benefit 2,400 households within 3 communes and 25 villages, mainly in Kampong
Thmor commune. The irrigated area is projected to be 3,000 ha in the wet season (supplemental
irrigation) and 1,800 ha in the dry season (full irrigation). The project was designed to deliver
economic benefits primarily through increased agricultural income and productivity.
It is too early to assess direct impacts of the irrigation system on socio-economic status of
communities and downstream beneficiaries. Reportedly, there are conflicts with upstream forestry
development, and mining activity. There are engineering controls that could mitigate the issues,
but much more detail would be necessary.
Stung Chinit River Fisheries
The Stung Chinit River system has one of the richest natural fish populations migrating upstream
and downstream (Try, 2008). Seventy-nine species were found in 2003-2004 (Puy, 2004 IN Try,
2009). Prior to the construction of Stung Chinit reservoir, fish catch was 7,000 tons/year from five
commercial fishing lots downstream in Tonle Sap Lake, and 1406 tons/year from families and
professional catches (Try, 2008). It is not known at this time what impact the reservoir may have
had on the production.
The northern portion of the Chinit Watershed is heavily forested. Heavy logging of this area could
affect the richness of the fish populations, and biodiversity along the Chinit River, as well as
reduce fish catch yield without engineering controls to reduce sedimentation and manage flow.
SIEM BOK WATERSHED
The Siem Bok is a long narrow watershed along the west bank of the Mekong, discharging into
the vulnerable biodiverse “Central Section” of the river. Below Kratie, the watershed lies along
the north bank of the southwest trending river, terminating at the Tonle Sap River and Phnom
Penh. The watershed has two directional axes, one running north-south, referred to in this report
as Siem Bok (a); the other running to the south west and referred to as Siem Bok (b). The upper
third of Siem Bok (a) lies in the west portion of the Stung Treng Province, and lower two-thirds lies

Rapid Socio-economic and Hydrological Assessment of Prey Lang Forest –Summary of Baseline Conditions
Advancing Engineering Consultants, Ltd. 30
in the west portion of the Kratie Province. All of Siem Bok (b) lies in northern portion of Kampong
Cham Province. See Figure 4.2.
Essentially all of the Prey Lang Forest focus area is within Siem Bok (a) along the Central Section
of the Mekong, which is the river reach between Stung Treng and Kratie monitoring stations. The
area is rural with a low population density.
There is no hydrological and meteorological data collected directly from the Siem Bok Watershed.
Therefore, the data was interpolated from six monitoring stations in the general vicinity. Between
the years 1960-2004, the average annual rainfall for the area was 1420mm, with average
evaporation rates of 1700mm per year.
The farming activity in the Siem Bok (a) area is relatively minor, hence, little controlled irrigation.
The most vulnerable area to forestry logging operations, would be the Mekong River between the
Stung Treng and Kratie monitoring stations and more specifically the biodiversity rich Central
Section. However, large hydroelectric projects are being considered on both the Stung Treng and
Sambor, Kratie (ICEM, 2010). The impact of forest logging in Siem Bok, would be overwhelmed
by those associated with the impact of these projects. Because of the low topography and nature
of the river channel, the area of inundation would be quite large and could encroach on the forest.
4.2.2 Floodplain The natural flood cycle as a result of the wet season during the months of July and October is the
basis for the high ecosystem productivity in the Lower Mekong floodplains. Changes in the
frequency and amplitude of seasonal flooding due to increased runoff discharge into the Mekong
River and the Great Lake as result of deforestation could significantly affect the flood cycle
system, which would impact the ecosystem yield. In addition, flood delays can have dire effects of
sensitive fish juveniles bred in the floodplains, due to slow arrival of oxygen rich waters.
4.2.3 River Systems The predominant hydrologic system of Cambodia is the phenomenal water basin created by the
drainage system into the Tonle Sap Great Lake within the Mekong River Basin. The vast majority
of the surface area of Cambodia is within the Cambodian Sector of the Mekong River Basin, of
which the Tonle Sap Basin is the centerpiece and the entire system ultimately flows into Mekong
Delta. All activities within Cambodia and many to the north have a direct effect on the hydrology
and hydraulics of the system. The subject of this study, the affects of Prey Lang Forest on
Rapid Socio-economic and Hydrological Assessment of Prey Lang Forest –Summary of Baseline Conditions
Advancing Engineering Consultants, Ltd. 31
hydrology, is a relatively small but significant part of the system as a whole, neither can be fully
assessed without considering the other.
MEKONG RIVER
The length of the Mekong River within Cambodia is about 480 km reaching from the Lao PDR
border to the north to Vietnam border to the south. The flow rate along this reach is 2,860m3/s
(MRC, 2003; WEPA, 2010). The FAO estimated the total annual total discharge of the Mekong
River into Cambodia to be approximately 300 billion m³, and the annual discharge as it flowed into
the South China Sea was estimated to be 500 billion m³. A significant portion of this increase
would be due to the contribution of the Tonle Sap Basin and the Mekong River within Cambodia.
The Mekong River conditions are affected by projects already in existence upstream, creating a
highly complex array of variables that must be considered when considering the impacts from any
new development. The relationship between rainfall, runoff, and pollutant concentration/load is
complex as well, and depends on the size of the river system – the larger the river, the more
difficult it is to assess. And the Mekong is one the world’s largest river systems (MRC, 2008).
TONLE SAP RIVER AND LAKE
The directional flow in the Tonle Sap River is determined by the wet and dry seasonal flow of the
Mekong River. During the monsoon rains of September to October the volume and height of the
Mekong increases to a level where the flow into the Mekong Delta backs up into the Tonle Sap
River which then reverses flow into the Great Lake raising the water elevations from a couple of
meters to as much as 15 meters in elevation, an estimated 8-fold increase in elevation. This
increases the size of the lake from approximately 2,500 square kilometers to about 25,000 square
kilometers at the peak flow, approximately a 10-fold increase in area.
TONLE SAP LAKE
During this unique dynamic stage, the Tonle Sap serves as a huge settling pond for sediments
and each cycle and fresh layer of sediments is deposited in the lake and due to poor drainage
along exposed lowlands returns to marshland, unsuitable for agriculture. Overtime, there is a
natural net gain in the sediments retained in the lake versus those that are transported out, due to
the physical properties and dynamics of the lake. This is a natural lake succession, which over
geologic time would normally lead to the ultimate transition of the lake to a terrestrial biome.
However, in the case of the Tonle Sap / Mekong River system the succession is muted, and if left
undisturbed may well continue indefinitely. Any change within the system, be it due to natural or
anthropogenic occurrences, could affect the balance.

Rapid Socio-economic and Hydrological Assessment of Prey Lang Forest –Summary of Baseline Conditions
Advancing Engineering Consultants, Ltd. 32
As the monsoon rains decrease, the flow in the Mekong recedes and the Tonle Sap River
reverses flow as the Lake recedes and returns to pre-monsoon levels, and the lake volume bleed
into the Bassac River loaded with an immense bounty of fish.
BASSAC RIVER
The Mekong and Tonle Sap Rivers converge at a point called the Chattomukh (Four Faces),
where they diverge into the Mekong and Bassac Rivers. From this point, the two rivers become
independent headwaters of the Mekong Delta.
The Bassac River serves a vital and often overlooked role in the hydraulic system dynamics. In a
sense, the Bassac River serves as a spillway during the wet season, ensuring that a relatively
constant flow reaches the Mekong Delta as the Tonle Sap rises. This sustains the Delta during
the large seasonal water availability fluctuations.
MEKONG DELTA
The Mekong Delta spans from Bassac River south of Phnom Penh to the south shores of Viet
Nam where it discharges into the South China Sea. It is one of the major Deltas of the world
covering and considered a “biological treasure trove” with reported estimates of over 10,000
species including newly discovered and endangered species.
Like all Deltas, the Mekong Delta is extremely sensitive and vulnerable to seemingly minor
disturbances as a result of either or both natural or human related events, including what happens
in the Prey Lang Forest and how it impacts the system as a whole, altering the hydrology,
hydraulics and loading of the Tonle Sap/Mekong Water Basin, including the Delta.
The information is not sufficient to quantify the effect of deforestation on the system, but based on
its unique dynamics and sensitivity and vulnerability any changes, the potential for irreparable
damage is a real risk. The Assessment attempts to provide some preliminary tools to decide how
to manage the forest in order to minimize the negative and maximize the positive effects, when
there is insufficient information.
4.2.4 Groundwater Cambodia has very limited identified information regarding groundwater aquifer resources, yield
and quality. Estimations by the Ministry of Water Resources and Meteorology (MOWRAM) report
the potential groundwater resources to be 17.6 billion m³. While it is not a primary water source at
this time, groundwater is being used at an increasing rate as domestic water supply and for
irrigation. There are at least 25,000 community water supply tube wells and large diameter

Rapid Socio-economic and Hydrological Assessment of Prey Lang Forest –Summary of Baseline Conditions
Advancing Engineering Consultants, Ltd. 33
motorized tube wells for irrigation in place, and about 2,000 manually operated shallow wells
installed annually (Atlas, 2006). There are reports of industrial use of groundwater, but information
on quantities was not available.
One of the main sources of recharging the groundwater is surface water through infiltration and
direct recharge pathways. As the use of groundwater increases, its sensitivity to surface water
quantity and quality becomes increasingly important, and changes in surface water dynamics,
such as runoff velocity and retention times, due to increased open surface area as a result of
deforestation can have significant groundwater consequences.
Due to apparent lack of faulting or karst-like geologic features, direct surface recharge is
suspected to be limited within the Study Area of the three watersheds. In addition, the highly
responsive increases and withdrawal of the Tonle Sap flood zone to seasonal rainfalls would
indicate that there is not a significant recharge system. However, the alluvial deposits of the Tonle
Sap floodplain do present a likely host for extensive shallow water table aquifers. Such aquifers
are relatively easy and inexpensive to tap as a water supply, but also very vulnerable to natural,
agricultural, industrial and domestic waste pollutants.
4.2.5 River Hydraulics Whereas hydrology, as referred to in this Assessment, addresses the characteristics of water flow
over the land surface, hydraulics addresses the characteristics of water flow through open
channels, or in this case rivers.
River Hydraulics data is collected by MRC at monitoring stations along the river reaches. For the
purposes of this Study the two main monitoring stations on the Mekong River are located at Stung
Treng and Kratie, and the downstream stations located around Phnom Penh, and Tonle Sap as
well was the stations located within the study watersheds important to assessing Tonle Sap.
Data collected from monitoring stations include: annual rainfall, evaporation, weather parameters,
discharge rates, Gauge Height and flood levels, and water quality. Data has been reported for the
last 50 years, from 1961-2010, using MRC Hydrological Yearbooks, PDOWRAM records, and the
IWMI World Water & Climate Atlas. However, there are large data gaps that make quantitative
assessment difficult.
Collectively, this data has provided the baseline for the hydrology and hydraulics of the study
area, and have been used to qualitatively estimate the runoff volumes as a result to clearing

Rapid Socio-economic and Hydrological Assessment of Prey Lang Forest –Summary of Baseline Conditions
Advancing Engineering Consultants, Ltd. 34
caused by forestry operations. These have been used as a baseline to compare the potential
magnitude of relative affects based on the three scenarios.
4.2.6 Climate & Meteorology Cambodia’s climate is classified as a tropical with two distinct seasons associated with tropical
monsoons: Dry Season from November to April, Northeast Monsoon and Rainy Season from May
to October, Southwest Monsoon.
The country has three climatic zones: coastal and mountainous area of the southwest, central
plains which include the Mekong River and Tonle Sap Lake, and the North/Northeastern Region.
Annual rainfall estimates vary by region. The lowland area around the Tonle Sap Lake receives
about 1,200mm to 1,900mm of rain annually. The coastal zones receive the heaviest rainfall,
about 3,000mm per year.
4.2.7 Water Quality The MRC Lower Mekong Water Quality Assessment (2008) has established a method of
determining the relative quality of the water using a Water Quality Index (WQI) at the different
monitoring stations along the Mekong River from China to Viet Nam. The generalized MRC
method is to assign a relative score (e.g. 2, 1, 0) if a specific water parameter meets or exceeds
guidelines. The scores are weighted to reflect relative risk and probabilities. The relative
importance is based on three general classifications: aquatic life (al), human impact (hi), and
agriculture (ag). Agriculture is included because it is such a prevalent activity in the Mekong
Basin, and is subdivided into three broad categories: 1) general, 2) paddy rice, and 3) livestock.
Each classification is scored differently based on unique conditions and considerations. All the
parameters are evaluated and the weighted scores are determined.
The MRC established median WQI values over the period of 2000-2005 for three monitoring
stations on the Mekong, which receives runoff from the Study Area, primarily Siem Bok. While
not sufficient to serve as representative for the area as a whole, it does provide general baseline
indication of water quality. The MRC WQI for the study area monitoring station is indicated in
Table 4.2. Table 4.2 MRC Baseline Water Quality Index (WQI) for Prey Lang Study Area
WQI(al) WQI(hi) WQI(ag1) WQI(ag2) WQI(ag3)
Stung Treng 9.8 7.6 10 10 10 Kratie 10 9.5 10 10 10 Kampong Cham 9.8 8.2 10 10 10

Rapid Socio-economic and Hydrological Assessment of Prey Lang Forest –Summary of Baseline Conditions
Advancing Engineering Consultants, Ltd. 35
The MRC indicator parameters and respective water quality base guidelines are shown in Table
4.3. The table has been expanded by additional parameters for which there is some data, which
could be included if more data is acquired.
For the purposes of this study, the guidelines should not be considered binding standards. They
are benchmarks of the baseline water quality characteristics of river water at the present time.
Ideally, water quality parameters should be measured on regular intervals over a sufficiently long
period to include seasonal changes to establish baseline conditions. Heavy metals, in particular
arsenic, need to be considered to establish potential significant health risks.
Table 4.3 MRC Water Quality Indicator Parameters
Water Quality Indicator Parameters MRC
Guidelines Monitoring Stations
St. Treng Kratie Kpg. Cham Dissolved Oxygen (DO) >5.0 mg/L ND 7.4 7 pH 6.5-8.5 SU ND 7.26 7.33 Conductivity < 70 mS/m ND TBD TBD Total Phosphorous (P) 0.13 mg/L ND 0.03 0.03 Ammonia-Nitrate (NH3-N) < 0.10 mg/L ND ND ND Nitrite (NO2-N) < 0.7 mg/L ND 0.15 0.15 Nitrate (NO3-N) < 0.7 mg/L ND 0.15 0.15 Ammonia (NH4-N) < 0.05 mg/L ND ND ND Chemical Oxygen Demand (CODMn) < 4 mg/L ND ND ND Additional Parameters to be considered Total suspended solids (TSS) NE mg/L ND 120 120 Turbidity NE NU ND ND ND Heavy Metals NE mg/L ND ND ND Biological Oxygen Demand (BOD) NE mg/L ND ND ND he transported loads in ton are determined by flow rate (Q) x concentration. ND = no data; NE= Not established by MRC
Stung Treng and Kratie are the primary data points, since they are relatively undisturbed
compared to the stations in the vicinity of Phnom Penh, which has too many point sources to be
able to differentiate the upgradient sources. This logic is also true for Kampong Cham, but it is
included as a “key station” to provide an outer limit comparison point.
In Stung Treng, 25% of the population has access to safe water, which may explain the relatively
low WQI (hi). In Kratie province, the WQI is much higher and reportedly 40% of the population
has access to safe water. The overall number of households that have access to safe water
declines in both urban and rural areas during the dry season (JICA, 1997).
SEDIMENTATION
Sediments play a key role in providing nutrients to the Tonle Sap and Delta landscapes and are

Rapid Socio-economic and Hydrological Assessment of Prey Lang Forest –Summary of Baseline Conditions
Advancing Engineering Consultants, Ltd. 36
critical to maintaining their high productivity and stability. About 70% of the sediment influx to the
Tonle Sap originates from the Mekong. Thus changes in the amount and composition of
sediment caused by upstream development or land use changes can have a major impact on the
sediment flow and Tonle Sap productivity. Analyses detailed in Plinston and He Daming (2000)
showed that about half the sediment reaching the Mekong Delta originates in the Upper Mekong
in China (Carling, 2009).
While sediments are of immense importance to the Lake and Delta ecosystems, it is also the
largest “pollutant” transported by rivers, streams and runoff. As land is cleared for development,
soil transport increases and its impacts are proportional to the area exposed, and the types of
preventive and control measures implemented. Deforestation, and dams presents high potential
high risks to the Lake, Rivers and Delta.
Top soil loss and land degradation by gullying and sheet erosion can lead to excessive levels of
turbidity in receiving waters, and off-site ecological and physical impacts from deposition in river
and lake beds, disrupting natural balances. Agriculture is a primary cause of erosion and
sedimentation and water quality issues, and mining and industrial activity can compound the
effects.
The effects of increased sedimentation into this system as result of the Prey Lang forest are bi-
directional. One direction is runoff flowing to the east from the Siem Bok watershed into the
Mekong River; the other to the west flowing from the Stung Sen and Chinit watersheds into the
Tonle Sap Basin (There is a minor third vector from the lower portion of Siem Bok into the
Mekong and Tonle Sap Rivers, but it is not directly affected by the Prey Lang Forest).
The magnitude of the effect of the deforestation on sedimentation in the river and lake environs is
relative to incoming sediment concentration above the Stung Treng monitoring stations, current
development within the watersheds on both sides of the Mekong River, and the increases to the
sediment concentrations due to construction and development along the Mekong River, Tonle
Sap, and their tributaries.
The existing sediment data exhibits the same variances and quality issues as most of data
available and used in this report. Sediment concentrations are generally determined using two
different measuring methods, suspended-sediment concentration (SSC), and total suspended
solids (TSS), which produce widely divergent estimates (ICEM 2010). It is difficult to correlate the
two, and according to ICEM the margin of error can be as high as 30%.

Rapid Socio-economic and Hydrological Assessment of Prey Lang Forest –Summary of Baseline Conditions
Advancing Engineering Consultants, Ltd. 37
The information is insufficient to quantify the effect of the increase in sedimentation as a result of
deforestation on the river and flood plain, especially in light of the proposed large-scale irrigation
and hydroelectric plants in the area. Therefore it is addresses qualitatively in the Sustainability
Matrix.
4.2.8 Water Uses It is estimated that about 25 million people within the lower Mekong basin live within the 15km
corridor along both sides of the Mekong mainstream. Approximately 70% of Cambodia’s total
population (13,395,682) or 9,376,977 Cambodians reside in this corridor.
Within the Phnom Penh urban area the primary water uses are: drinking, domestic, and
commercial, with relatively minor industrial use. In the rural provinces outside of Phnom Penh the
primary water uses are: drinking, domestic, agriculture and livestock feeding.
According to a study by Water Utilization Program (WUP-JICA), the estimated urban water usage
is approximately 68 mcm per year. At the Phnom Penh Port, water extraction is about 100,000 m3
per day, which is higher than most provincial towns (JICA, 1997).
In Cambodia an estimated 500 mcm is used for industrial purposes, which is about 1% of all uses.
Very little industrial activity takes place within the Study Area. Commercial use is primarily in the
urban areas and not included in the Study area.
DOMESTIC
The MRC has determined Cambodia Domestic Water Use as shown in Table 4.4.
Table 4.4 Cambodia Domestic Water Use
Average per Capita Use (liters / day)
2000 2007 (2008)
2030 2060
Rural Urban
32 No Data
90 130
100 150
100 170
Source: MRC, 2010
Based on this data, it is assumed that the total daily domestic consumption has not significantly
changed from 2007 to 2008. The estimated increase in domestic water consumption over the
ten-year period of this study is calculated from projected population growth rates and
consumption rates.

Rapid Socio-economic and Hydrological Assessment of Prey Lang Forest –Summary of Baseline Conditions
Advancing Engineering Consultants, Ltd. 38
The population of the study area is estimated to be 630,000, of which approximately two-thirds
live in rural communities and one-third may be considered peri-urbanites located south west of
Kratie. Applying the 2007 domestic uses (Table 4.4), the total annual domestic water use for the
study area is approximately 37 mcm. This is considered to be conservative since many living in
peri-urban areas do not have any better access to water than those living in rural settings.
IRRIGATION
In most agricultural societies, irrigation is typically the largest water user. In the Lower Mekong
Basin irrigation uses an estimated 41.8 bcm of freshwater resources (MRC, 2005). In Cambodia
2.7 bcm collected and stored during wet season is used to fully irrigate multi-crops. This implies
significant storage areas, which would affect water balance and watershed discharge.
The total irrigable area in Cambodia for the Study is 504,245 ha. Rice is the primary crop
accounting for 98% of the irrigated land. The remaining 2% is used for other crops such as maize
(MRC, 2003e).
Reportedly, 2% of the precipitation within the Stung Sen and Chinit watershed is used for
irrigation, most is believed to be within the Stung Chinit watershed, which would be equivalent to
460 mcm.
INDUSTRY
At the present time there is relatively little heavy industrial activity in Cambodia. Mining is the one
with the most immediate importance to the study area. In terms of water usage mining is generally
a high consumer, but the entire annual industrial water use for Cambodia is reported to be 500
mcm, which is about 1% of all use. It is presumed that a relatively large portion of this use is for
mining, but the actual percent is not known. Nearly all of the mining activity is outside of the
primary Prey Lang Forest area. If mining made up for all the industrial use of water, the mines in
the study area would use an estimated 90 mcm, which is about 13% of all human water use
(excluding direct rainfall irrigation). Since, in fact mining does not make all industrial use the
actual percentage would be a lot less. Therefore, without more focused study and information
about mining, it was not included directly in the water inventory.
4.2.9 Water Inventory Baseline There is insufficient data to conduct a complete water balance for the study area, but using the
meteorological, hydrological and hydraulic databases available, key parameters were interpolated
to estimate a preliminary inventory of the study area water inflow and outflow.

Rapid Socio-economic and Hydrological Assessment of Prey Lang Forest –Summary of Baseline Conditions
Advancing Engineering Consultants, Ltd. 39
In terms of water inventory within the study area, inputs are: rainfall and upgradient river flow as
measured at the Stung Treng monitoring station. Water balance study area outputs are primarily
natural forest and vegetation uptake and direct rain fed agricultural irrigation, and secondarily
mechanical irrigation and human consumptions as discussed above.
Using percentage estimates, in lieu of more sophisticated hydrologic models provides a
reasonable qualitative rapid assessment within the objectives of this study. Using these
estimates, a preliminary water inventory was prepared for the study areas as a whole, averaging
the inputs of the three watersheds, but separating out the discharges of Stung Sen and Chinit
from Siem Bok(a), since both discharge into the Tonle Sap, while Siem Bok(a) discharges into the
Mekong River. Siem Bok (b) was not included since it is a peri-urban area outside the forest
hydrology influence.
Along with the Mekong River, the Tonle Sap Great Lake is the primary receptor of the Mekong
Basin with in Cambodia. It serves as a critical component of the unique pulsating dynamics of the
river hydraulics and provides extremely important ecological services for the region from both an
environmental and economic perspective, and the basis for an entire Khmer culture. The primary
Assessment report should be referred to for the details. Figure 4.3 provides a summary of the
available water volumes. The boxes without data indicate respective volumes were not
discovered.
Figure 4.3 Study Area Water Inventory
PRECIPITATION (P) 38,200 mcm
Irrigation Application
(A2) 636mcm
Evapo-transpiration (ET)
Rain-fed Application (A1)
9,000 mcm
Human Consumption (Hn) 37mcm
SURFACE/WOODLAND STORAGE (S/W) 16,000 mcm
NET RUNOFF (R) 12,600 mcm
Mekong River (MR) 2,100 mcm
Infiltration (I)/Recharge
River Inflow (Q1)
River Outflow (Q2)
Tonle Sap River (TSR) 10,500 mcm Groundwater (GW)

Rapid Socio-economic and Hydrological Assessment of Prey Lang Forest –Summary of Baseline Conditions
Advancing Engineering Consultants, Ltd. 40
HYDROLOGICAL EFFECTS OF FOREST CLEARING
The forest serves as a hydrology buffer reducing runoff velocity and absorbing a portion of the
precipitation. Clearing the forest removes these natural services (among others) and increases
the amount of net runoff reaching their respective sinks (Tonle Sap or Mekong River) and rates of
and locations of sediment deposits. Due to the size of the area involved and the complexity and
importance of the relationship between the Tonle Sap and Mekong River it would take a
sophisticated quantitative model to determine how much the actual net runoff would be affected,
which is beyond the scope of this study. However, the qualitative assessment conducted
provides a relative objective indication of the potential outcomes.
The effect of forest removal on the hydrology of the region is a function of the characteristics of
area of forest removed, such as slopes, soil drainage characteristics, vegetation, and change in
land use. Therefore, if in the extreme worse case, the entire forests in all three watersheds were
removed, the total net runoff contributed to the Mekong River could significantly increase the river
discharge and sediments from Cambodia into the Mekong Delta, with potentially devastating
effects.
4.3. Ecosystem Services The natural services provided by any ecosystem, such as the forest, are referred to as
“ecosystem services” as defined by the Millennium Ecosystem Assessment (MA) which divided
the services into four broad categories: Supporting, Provisional, Regulating, and Cultural. It
determines services as those activities that affect human wellbeing, so that it may be viable to
exploit a resource and account for ecosystem services, with addressing those disruptions that do
not affect humans. The focus of this Assessment concentrates on how the “natural services” of
the fresh water cycle are affected by the replacement of forest’s services by clearing the land.
The natural services include all services that benefits and sustains an ecosystem, regardless of
the human considerations. And then, with this in mind, the effects of human socio-econ conditions
are considered.
FRESH WATER ECOSYSTEM SERVICES
The list of water ecosystem services can include just about every aspect of life on earth, and is
affected by every aspect of it. While a list of services for a discrete ecosystem, such as a forest,
would apply to the forest itself regardless of whether or not humans involved, those same
services have direct and indirect effects on human wellbeing. Water however, is ubiquitous and

Rapid Socio-economic and Hydrological Assessment of Prey Lang Forest –Summary of Baseline Conditions
Advancing Engineering Consultants, Ltd. 41
any and all changes in the hydrologic cycle, regardless of where these changes take place, have
certain direct and indirect effects on humanity’s wellbeing, as well as other species.
By clearing a forest, all the natural services provided by the forest are lost until (and if) renewed.
By depleting a naturally occurring water source (e.g. over pumping groundwater), the local water
balance is altered, and ecosystem services adjust accordingly, but the water cycle and its
essential service is maintained. Humans can and do effect water quality, quantity and location, all
of which have significant effects on ecosystems, but perhaps its most damaging impact is on
water quality, since by rendering it unfit for consumption, humans in effect reduce their own
usable water supply, potentially threatening its own existence. Figure 4.4 provides a partial
general list of fresh water services ecosystem and socio-economic services.
Figure 4.4 Fresh Water Services
PREY LANG WATER ECOSYSTEM SERVICES
As an ecosystem in its own right, the Prey Lang forest provides services and is dependent upon
the services provided by the water present within its system as defined by the surface hydrology.
Fresh Water Ecosystem
Basic Ecosystem services Agriculture Industry Energy Recreation Domestic Political Cultural Spiritual Transportation Manufacturing Infrastructure Institutions Waste disposal *Each has negative and positive economic and social consequences, and all have negative impact on most, if not all ecosystem services.
Fulfills basic need for life Aquatic fish and biotic habitat Supports terrestrial habitat Promotes biodiversity Biomass Plant growth Climate and local weather Migration pathways Wetlands Mangrove habitat Universal solvent Ocean water recharge
Ecosystem Services Human Socio-Economic Services

Rapid Socio-economic and Hydrological Assessment of Prey Lang Forest –Summary of Baseline Conditions
Advancing Engineering Consultants, Ltd. 42
The Prey Lang Forest potentially stores more carbon than other forests since its undisturbed
timber volume and biomass are relatively high. In addition, the swamp areas are reported to have
significant carbon storage potential.
Figure 4.5 lists the potential Prey Lang Forest Ecosystem Services. It contains most of the
services provided by any forest. Figure 4.6 shows how those services might be affected by
clearing the forest.
Figure 4.5 Potential Prey Lang Forest Ecosystem Services
Photosynthesis Carbon Sequestering Watershed management Flood retention Torrent control (buffering) Erosion Control, Water quality Sediment reduction Stream Flow Wetlands (swamps) Transpiration Biomass Nutrient cycle Stream bank management River bank management Biodiversity Endangered species Pollination Seed dispersal Terrestrial Habitat Natural pest control Land use barrier Protected wildlife migration pathways Flood control Drought mitigation Food Primary production Shading
Timber Fuel wood and biomass Non-wood forest products Tourism Cultural value Spiritual value Recreational Aesthetics Food Pharmaceuticals Land use Residential Industrial Agriculture Employment Energy
Ecosystem Services Human Socio-Economic Services
Prey Lang Forest

Rapid Socio-economic and Hydrological Assessment of Prey Lang Forest –Summary of Baseline Conditions
Advancing Engineering Consultants, Ltd. 43
Figure 4.5 Potential Effects of Deforestation on Ecosystem Services
Decreased Photosynthesis Recreational Food Tourism Carbon Sequestering Watershed management Torrent control Erosion Control Water quality Sediment reduction Biomass Nutrient cycle Stream bank management River bank management Biodiversity Pollination Seed dispersal Terrestrial Habitat Transpiration Land use barrier Drought mitigation Food Primary production Shading Increased Stream Flow Flood potential Sediment load Wetlands vulnerability Altered Endangered species Natural pest control Wildlife migration pathways
Increase Timber Non-wood forest products Pharmaceuticals Land use Residential Industrial Agriculture Transportation Employment Economics Energy Decrease Aesthetics Fuel wood and biomass Fisheries Unknown Cultural value Spiritual value
Ecosystem Services Socio-Economic Services
Potential Prey Lang Effects of Deforestation
Increase Recreational Migration to Forest Area River flow River height Flood intensity Sedimentation Economics Decrease Aesthetics Fisheries Altered Cultural value Spiritual value Social value
Downstream Socio-Economic Services

Rapid Socio-economic and Hydrological Assessment of Prey Lang Forest –Summary of Baseline Conditions
Advancing Engineering Consultants, Ltd. 44
Placing a dollar value on ecosystem services is complex and difficult, if not impossible to
accomplish quantitatively and certainly limited. Identifying interrelations between service and
value can be subjective and contentious. Extrapolations and interpolations between incomplete
or inconsistent data sets tend address a large range to cover a host of inadequacies. The valuing
of the ecosystem is only sustainable as long as funding provider is willing to pay, which is
dependent on social and political will, and economic conditions. Those ecosystem services, to
which some value that can be measured in terms of money are included within the economic
model (TEV); otherwise, they are considered as part of the sustainability matrix scorecard.
4.3.1 Non-Timber Forest Products (NTFP) NTFPs are of particular importance to the Prey Lang area. Typical NTFPs used in and around
the Prey Lang area include types of leaves, bark, frogs, toads, eels, orchids, ginseng, resin,
rattan, honey, firewood, fencing, vegetable, mushrooms, and fish. Local villagers are highly
dependent on NTFP as source of food. Resin is one of the most important NTFPs Cambodia-
wide, and shows significant potential for market development (Prom, 2009). The estimated total
value of resin is about $10 million.
4.3.2 Fisheries Important to Prey Lang Forest Inland fisheries in Cambodia are part of the two interrelated systems made up of the Tonle Sap
and Mekong River. The flow reversal discussed earlier is a critical dynamic of fish productions
and migration. Fish migrations of economically important species are triggered by seasonal
hydrological changes.
The total annual income per year of fisheries in the Prey Lang watershed Provinces is roughly $7
million for small-scale fishermen. Commercially the annual total fish catch is about $36 million
(Mak, 2010; MRC Fisheries, 2010).
Roughly 4,032 households depend on fishing as a primary source of income, and 16,080
households as a secondary source. Households earn roughly $2,200,000 USD and $4,500,000
USD annually, respectively (Mak, 2010; MRC Fisheries, 2010).
MEKONG RIVER FISHERIES
The total 2007 commercial and industrial fish catch for Cambodia was 125,000 tons. In Stung
Treng and Kratie Provinces, the individual catch was 2,000 tons, or together 3.2 % of national
catch. In 2009, these increased to 6,373 tons in Stung Treng, while decreased to 1,885 tons in
Kratie (Mak, 2010; MRC Fisheries, 2010). While portions of these provinces lie within the study

Rapid Socio-economic and Hydrological Assessment of Prey Lang Forest –Summary of Baseline Conditions
Advancing Engineering Consultants, Ltd. 45
area, they also extend across the Mekong and outside the assessment boundaries, so it is
assumed that most of the commercial fishing takes place on either side of the river and is
essentially equally distributed.
COMMUNITY FISHERIES
The community fisheries were established in 2001 with the objective to promote sustainable
fishing practices to help improve community socio-economic conditions and alleviate poverty. In
2006, 388 community fisheries existed. As would be expected nearly all lie along the Mekong and
within the Tonle Sap flood plain along its tributaries. Within the study area, 17 existed in Kampong
Thom mostly along Stung Sen. Oddly, very few existed in the Stung Chinit watershed. Fifty-one
were present in Stung Treng and Kratie Provinces each and again roughly estimated to lie equally
along the Mekong. Therefore, approximately 51 are located within Siem Bok (a) watershed.
Sixteen were located in Kampong Cham province, most of which within Siem Bok (b) (Atlas of
Cambodia, 2006).
4.4. Socioeconomic Baseline While many socioeconomic studies have been conducted in Cambodia, very limited information is
available on the socioeconomics of the study area forests and hydrology. The economic value of
the study area is based on direct use values, for timber, fisheries, NTFP and tourism. Agriculture
is the largest sector of the GDP and it is primarily subsistence farming within the study area.
Tables 4.5 through 4.13 summarize the TEV and NPV for each parameter over the 10-year
period. It is important to note and keep in mind that the data provided in these tables are for illustrative purposes only, and should not to be used for planning or budgeting purposes without further study and confirmation.
Several valuation techniques were used for the main direct use and indirect use values (DUV and
IUV) as described previously. The baseline analysis is dependent on a number of parameters,
such as average forest density, NTFP collection per hectare values, and market costs for fish and
tourism statistics. The values for these DUV are based on previous studies and/or statistical
reports within Cambodia, if not within the study area provinces. Information regarding indirect
values of forest resources in Cambodia was not found during the timeframe of data collection.
Values for IUV were based on research done outside of Cambodia.
4.4.1 Timber Baseline This study focuses on potential values from evergreen, semi-evergreen, and deciduous based on
current loss rates of 1% as advised by the RGC Forestry Administration (FA). The loss rates for
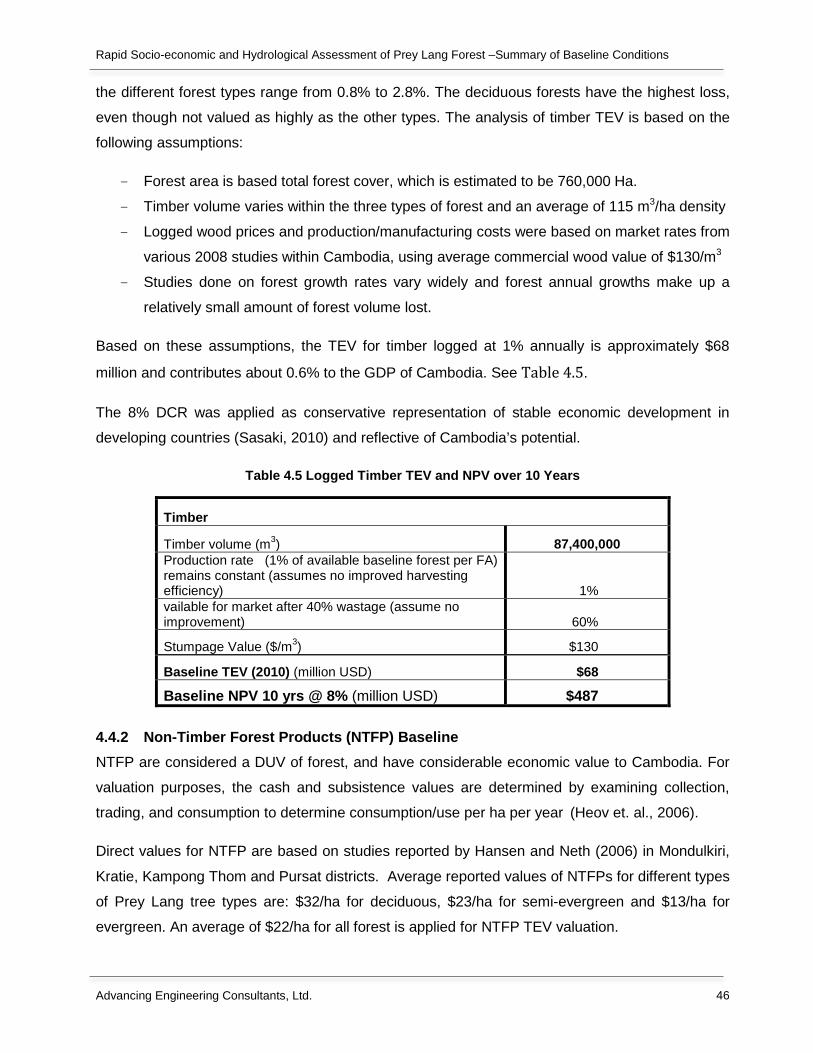
Rapid Socio-economic and Hydrological Assessment of Prey Lang Forest –Summary of Baseline Conditions
Advancing Engineering Consultants, Ltd. 46
the different forest types range from 0.8% to 2.8%. The deciduous forests have the highest loss,
even though not valued as highly as the other types. The analysis of timber TEV is based on the
following assumptions:
- Forest area is based total forest cover, which is estimated to be 760,000 Ha.
- Timber volume varies within the three types of forest and an average of 115 m3/ha density
- Logged wood prices and production/manufacturing costs were based on market rates from
various 2008 studies within Cambodia, using average commercial wood value of $130/m3
- Studies done on forest growth rates vary widely and forest annual growths make up a
relatively small amount of forest volume lost.
Based on these assumptions, the TEV for timber logged at 1% annually is approximately $68
million and contributes about 0.6% to the GDP of Cambodia. See Table 4.5.
The 8% DCR was applied as conservative representation of stable economic development in
developing countries (Sasaki, 2010) and reflective of Cambodia’s potential.
Table 4.5 Logged Timber TEV and NPV over 10 Years
Timber
Timber volume (m3) 87,400,000 Production rate (1% of available baseline forest per FA) remains constant (assumes no improved harvesting efficiency) 1% vailable for market after 40% wastage (assume no improvement) 60%
Stumpage Value ($/m3) $130
Baseline TEV (2010) (million USD) $68
Baseline NPV 10 yrs @ 8% (million USD) $487
4.4.2 Non-Timber Forest Products (NTFP) Baseline NTFP are considered a DUV of forest, and have considerable economic value to Cambodia. For
valuation purposes, the cash and subsistence values are determined by examining collection,
trading, and consumption to determine consumption/use per ha per year (Heov et. al., 2006).
Direct values for NTFP are based on studies reported by Hansen and Neth (2006) in Mondulkiri,
Kratie, Kampong Thom and Pursat districts. Average reported values of NTFPs for different types
of Prey Lang tree types are: $32/ha for deciduous, $23/ha for semi-evergreen and $13/ha for
evergreen. An average of $22/ha for all forest is applied for NTFP TEV valuation.
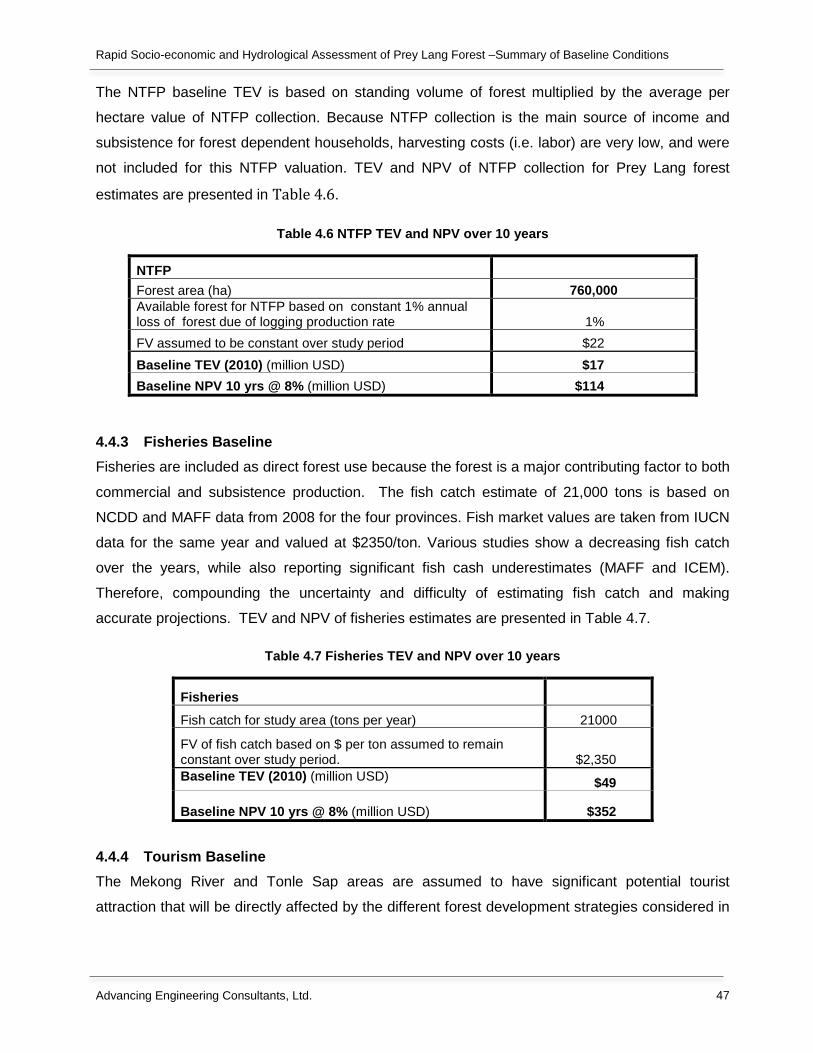
Rapid Socio-economic and Hydrological Assessment of Prey Lang Forest –Summary of Baseline Conditions
Advancing Engineering Consultants, Ltd. 47
The NTFP baseline TEV is based on standing volume of forest multiplied by the average per
hectare value of NTFP collection. Because NTFP collection is the main source of income and
subsistence for forest dependent households, harvesting costs (i.e. labor) are very low, and were
not included for this NTFP valuation. TEV and NPV of NTFP collection for Prey Lang forest
estimates are presented in Table 4.6.
Table 4.6 NTFP TEV and NPV over 10 years
NTFP Forest area (ha) 760,000 Available forest for NTFP based on constant 1% annual loss of forest due of logging production rate 1% FV assumed to be constant over study period $22 Baseline TEV (2010) (million USD) $17 Baseline NPV 10 yrs @ 8% (million USD) $114
4.4.3 Fisheries Baseline Fisheries are included as direct forest use because the forest is a major contributing factor to both
commercial and subsistence production. The fish catch estimate of 21,000 tons is based on
NCDD and MAFF data from 2008 for the four provinces. Fish market values are taken from IUCN
data for the same year and valued at $2350/ton. Various studies show a decreasing fish catch
over the years, while also reporting significant fish cash underestimates (MAFF and ICEM).
Therefore, compounding the uncertainty and difficulty of estimating fish catch and making
accurate projections. TEV and NPV of fisheries estimates are presented in Table 4.7.
Table 4.7 Fisheries TEV and NPV over 10 years
Fisheries
Fish catch for study area (tons per year) 21000
FV of fish catch based on $ per ton assumed to remain constant over study period. $2,350 Baseline TEV (2010) (million USD) $49
Baseline NPV 10 yrs @ 8% (million USD) $352
4.4.4 Tourism Baseline The Mekong River and Tonle Sap areas are assumed to have significant potential tourist
attraction that will be directly affected by the different forest development strategies considered in

Rapid Socio-economic and Hydrological Assessment of Prey Lang Forest –Summary of Baseline Conditions
Advancing Engineering Consultants, Ltd. 48
this assessment and are considered as direct use value (DUV) for economic valuation (MOT
Statistics, 2008).
It is assumed that the majority of tourists visiting Northeast Cambodia visit the Mekong River and
dolphin pools. While Stung Treng province has an estimated budget for ecotourism of $414,575
for 2010 (MRC, 2010), very limited information on ecotourism statistics outside of dolphins was
available. However, the need for alternative costs to replace logging activity for Scenario 2 and
the potential decrease in tourism as a result of Scenario 1 cannot be ignored.
Table 4.8 shows the number of foreign and local tourist as well as the average amount they
spend per day. The annual TEV and NPV estimates are also presented in the table below.
Table 4.8 Tourism TEV and NPV over 10 years
Tourism International visitors/year 13,356 Average expenses per international visitor/year (2 days at $118/day including transportation) $236 FV at 5% growth rate 5% National visitors per year 117,187 Average expenses per national visitor/year (1 days at $22/day including transportation) $22 FV at 3% growth rate 3% Baseline TEV (2010) (millions USD) $6 Baseline NPV 10 yrs @ 8% (millions USD) $49
4.4.5 Agriculture Baseline – Rice The study used rice as the agriculture benchmark, since it is such a significant part of the
agricultural economy and Cambodia’s GDP, as well as its cultural importance, and main food
source. Conversion to other land use, e.g. plantations, etc. would have lower net economic and
social (health and cultural) values. However, much of the soils within the study area are not
conducive to rice and therefore, its value in considering Scenario 3 on applying improved
agriculture practices to increase soil quality and improve yield, as well as, improved water
management. The TEV is based on map imagery metadata and current market values for rice.
TEV and NPV estimates are presented in Table 4.9.

Rapid Socio-economic and Hydrological Assessment of Prey Lang Forest –Summary of Baseline Conditions
Advancing Engineering Consultants, Ltd. 49
Table 4.9 Agriculture Baseline - Rice TEV and NPV over 10 years
Agriculture Study areas under cultivation (ha) assumed to remain constant over study period 39,000 Yield tons based on ton/ha (assumed to be constant). 2 FV of crop value based on $/ton) $625 Sliding scale assumed to be constant over study period. 0% Baseline TEV ( 2010) (millions USD) $49 Baseline NPV 10 yrs @ 8% (millions USD) $384
4.4.6 Carbon Sequestration Baseline Like tourism, carbon credit can significantly alter the benefic cost analysis. Currently there is no
system in place to pay for the carbon storage service, and very little data is available for setup,
monitoring, and management. However, the apparent willingness to pay appears to be sincere
and the potential offsetting benefits and costs for the different scenarios are too great not to be
included as a separate TEV line item. This study limits carbon valuation to above ground biomass
estimates for evergreen, semi-evergreen and deciduous forests only. Evergreen and semi
evergreen forest regrowth rate is 0.33 m3/ha/year (Ashwell, 2008). It would take considerably
longer than 10 years for forest regrowth to contribute to carbon sequestering (FAO FRA Report,
2005). This would be a significant BCA consideration for Scenario 1 and relatively less of one for
Scenario 3 within the 10 year time frame but very important in the long term. Regrowth would not
be a significant factor for Scenario 2, but still a contributing factor restoring existing uncovered
land. Therefore, evergreen and semi-evergreen regrowth were considered in BCA for each
scenario.
The price of carbon can range between $3.50/ton to over $20/ton. This study used $3.50/ton as a
reasonable conservative estimate. Based on the 760,000 ha estimate and conservative carbon
value of $3.50/ton, the TEV of standing forest is about $150 million. Considering the annual loss
rate of 1%, the NPV at 8% is projected just over $1 billion.
Using a range between RWC and RWB would make a significant difference for all scenarios.
Again, limited information is available for set-up, monitoring and management costs, but a recent
REDD+ roadmap has been prepared and estimates that a program could begin mid-2014.
Therefore, the current valuation for 2010 is $0, and assuming a program will take place mid-2014,
the estimated NPV is around $671 million. Refer to Table 4.10.

Rapid Socio-economic and Hydrological Assessment of Prey Lang Forest –Summary of Baseline Conditions
Advancing Engineering Consultants, Ltd. 50
Table 4.10 Carbon TEV and NPV over 10 years
Carbon Storage (sequestering) Forest study area (ha) 760,000 Density (tree volume in m3/ha) 115 Forest study volume(m3) 87,400,000 Standing Stem Volume (SV) is the remaining forest volume after assumed baseline production rate of 1%.{Note: volume loss assumed to an annual rate to account for natural decay and forest degradation due to roads, etc.) -1% Wood density (WD) is the average wood density for natural forest in SE Asia 0.57 Biomass expansion factor (BEF) converts SV to AGB 1.74
Carbon factor (Cf) is the carbon stored in mt based on 0.5 C ton/SVm3 (based on dry volume and weight) 0.5 Above Ground Biomass (AGB= SV*WD*BEF)*Cf in (mt) = .5*SV {Note:1.74*0.57=0.99} 0.5 FV at Carbon value in $/ton $3.50 Baseline TEV (2010) (millions USD) - Baseline NPV 10 yrs @ 8% (millions USD) $671
4.4.7 Payment for Environmental Services & Biodiversity Very limited studies were available covering biodiversity and Payment for Environmental Services
values in Cambodia. Bann conducted a biodiversity study in the Kampot Province (1997), which
placed a total “captural” value $30/ha on forest biodiversity based on Ruitenbeek’s “Rainforest
Supply Price” (1990).
PES values are based on planned community forest (CF) management schemes. In Prey Lang,
there are currently 100,000 ha of CFs with a management value of $2/ha. See Table 4.11.
Table 4.11 PES TEV and NPV
Payment for environmental services (PES) Community forests (CF=26) area within study area (ha) (assume remains constant) 100,000 Rate of change (assume remain constant) 0% FV of CF at ($/ha) $2.00 Baseline TEV ( 2010) (millions USD) $0.2 Baseline NPV 10 yrs @ 8% (millions USD) $1.4
Using a value of $30/ha for biodiversity, the estimated TEV and NPV are shown in Table 4.12.

Rapid Socio-economic and Hydrological Assessment of Prey Lang Forest –Summary of Baseline Conditions
Advancing Engineering Consultants, Ltd. 51
Table 4.12 Biodiversity TEV and NPV
Biodiversity Forest Study Area (ha) 760,000 Forest loss based on annual production rate -1% FV biodiversity value based on $/ha. $30 Baseline TEV ( 2010) (millions USD) $23 Baseline NPV 10 yrs @ 8% (millions USD) $156
4.4.8 Forest Ecosystem Services Studies on forest hydrological services in Cambodia were not found in the literature reviewed.
However, CDRI valuation studies provided several case studies within the South East Asia
region, which this study assumes are relevant and applicable to this assessment.
Watershed protection and soil erosion mitigation values are typical measuring tools for estimating
watershed services provided by a forest (Hansen & Neth, 2006). In a case study by Emerton,
et.al., in Lao PDR, the value of water conservation and soil conservation is estimated at
$70/ha/year and $60/ha/year respectively (2001). This study indicated that deciduous forests can
only provide benefits when a constant crown covers is established; however, forest ecosystem
services are provided by the entire forest and, therefore, applied to the entire study forest area.
The TEV and NPV of watershed protection and soil erosion for the forest are shown in Table
4.13.
Table 4.13 Forest Ecosystem Services TEV and NPV
Forest Ecosystem Service (FES) Forest Area (ha) 760,000 Forest loss based on annual production rate -1% FV of FES at $/ha (assumed watershed protection-$70; soil erosion $60) $130 Baseline TEV (2010) (millions USD) $99 Baseline NPV 10 yrs @ 8% (millions USD) $676
4.4.9 Summary of Economic Valuation The separate TEV for direct and indirect use values are $189 million and $122 million
respectively. When considering only DUV of the forest, timber is the largest contributor with
approximately $68 million. Fisheries and rice each account for $49 million followed by NTFP at
$17 million and tourism at $6 million. In total, these contribute about 1.7% to Cambodia’s GDP of
$11 billion (EIC, 2010; WB 2010). Alternately, when IUV are taken into account, the TEV of the
2010 baseline is drastically altered, and the total contribution to GDP is 2.8%. However, the IUV

Rapid Socio-economic and Hydrological Assessment of Prey Lang Forest –Summary of Baseline Conditions
Advancing Engineering Consultants, Ltd. 52
are based on limited and very subjective resources at this time. Further valuing of ecosystems is
necessary before their values can reliability be incorporated into TEV. On the other hand, even
the DUV are subject to uncertainty based on the limited resources, although not quite as
subjective. One potential way to overcome part of the difficulties is to define ranges between
reasonable worse case (RWC) and reasonable best case (RBC) and interpolate a reasonable
most likely case within the range limits. Like BCA and the sustainability matrix, RWC, and RBC
are best defined by consensus.
In summary the total 2010 economic value of the study area is $311 million, contributing 2.8% to
the overall GDP of Cambodia. The NPV projection over the 10-year assessment at 8%
discounted rate for the Baseline “continuing to do business as usual (BAU) is estimated at $2.9
billon. Table 4.14 summarizes the TEV and NPV values generated in this Section
Table 4.14 Baseline TEV, NPV, and GDP Contribution
STUDY AREA BASELINE
USE VALUES
Economic Value (2010)
Baseline TEV contribution to
GDP1
NPV 10 YR Projection -
Baseline (USD Millions) % (USD Millions)
Direct Use Values
Timber $68 0.6% $487
NTFP $17 0.2% $114
Fisheries $49 0.4% $352
Tourism $6 0.1% $49
Agriculture $49 0.4% $348
PES $0.2 0.0% $1
Subtotal DUV $189 1.7% $1,352
Indirect Use Values
Carbon $0 0.0% $671
Biodiversity $23 0.2% $156
FES $99 0.9% $676
Subtotal IUV $122 1.1% $1,503
TOTAL TEV $311 2.8% $2,855
4.4.10 Baseline Sustainability Matrix The Sustainability Matrix provides a means to consider the external indirect considerations
which are not captured in the economic and financial models, but have an equal and often far
more significant effect on the decision making process. If not taken into account, decisions
made today may be much regretted in the future; there are enumerable examples. The

Rapid Socio-economic and Hydrological Assessment of Prey Lang Forest –Summary of Baseline Conditions
Advancing Engineering Consultants, Ltd. 53
complete Baseline Sustainability Matrix as completed in its entirety can be found in the
appendix of the Primary Assessment Report. Its total scores are summarized in Table 4.15.
Table 4.15 Baseline Sustainability Scores
Potential Forest Impacts
Economics Social Environmental
I V CL S I V CL S I V CL S S Economics 3 3 0.8 264 3 3 0.8 270 3 2 0.9 204 739 Social 3 3 0.7 157 3 3 0.7 176 3 3 0.8 206 540 Environmental 3 3 0.7 246 3 3 0.7 246 3 3 0.9 275 767
Average CL/Sum of S 0.7 667 0.7 692 0.8 685 2045
The importance (I) was held constant for each of the individual parameters, since all were
considered to be of high importance (3), however, importance would not be constant in most
cases, since different stakeholders will see things differently. On the other hand, value (V)
varied from 3 to 1 as rated from good to bad. The confidence level (CL) is higher than in the
scenario matrices, since the relevant data was more readily available.
The Baseline Sustainability Scores present an indication of how current conditions are perceived,
and becomes the benchmark by which progress is measured, or in assessing how the scores
change when one IP adjusted while all other remain constant (i.e. sensitivity analysis). And finally
the baseline score as compared to target score provides the spread from “where we are now”,
relative to where we would like to be. The target score is the ideal ultimate sustainability score
determined by all the stakeholders. It serves as the beacon to strive for, while intermediary targets
are set to measure, monitor, and evaluate progress to ensure accountability and allows the
course to be reset as new information becomes available.
5. CONCLUSIONS and RECOMMENDATIONS The Assessment concluded that there is insufficient information to reach a quantitative decision
regarding the management of the Prey Lang Forest. Until such time as adequate information is
available, a multi-criteria analytical methodology was presented to qualitatively assess the
existing data to provide an interim basis to compare policy options.
While the Primary Assessment worked through the multi-criteria solution for illustrative purposes,
the example was not intended to serve as an ultimate decision, which can only be accomplished
with full participation of all stakeholders. However, it can be concluded with a reasonable level of

Rapid Socio-economic and Hydrological Assessment of Prey Lang Forest –Summary of Baseline Conditions
Advancing Engineering Consultants, Ltd. 54
confidence that the Prey Lang Forest is a highly valuable natural asset to Cambodia, and that
development of the forest and the natural resources within the Study Area without implementing
prudent and diligent management will significantly affect the hydrology, with the potential to cause
traumatic stress to the Tonle Sap Water Basin Lake and the Mekong Delta.
RECOMMENDATIONS
The Assessment is a good starting point to decide upon optimum resource management
strategies, fill data gaps, and provide methods to serve as a screening tool providing a way and
means to establish priorities, evaluate thematic interrelations, and identify the most helpful
information needed. As a reliable and credible information base is created, a phased
comprehensive interagency national integrated resource management program can be prepared
to ensure Cambodia’s social, economic and environment goals are attained prudently and
sustainably.
Building upon the RGC National Forest Programme and this study, the following actions are
recommended:
1. Conduct workshops to train the Forest Administration personnel in the application of
methodologies used in the report, so they can further develop and incorporate this
analytical approach into economic decision analysis by Cambodian policy makers.
2. Conduct stakeholder participation workshops to establish parameters that best represent
Cambodia’s best interest.
3. Identify information gap priorities and organize funding sources, academic and
government institutions and NGOs to conduct the research and investigation necessary to
ensure the quality of the information is sufficient to reach sound decisions with the highest
level of confidence.
4. Using the expanded data base establish values for Cambodia’s ecosystems that are
uniquely applicable to Cambodia to ensure that the values and costs are adequately
accounted for in the decision analysis process.
5. Prepare a holistic integrated resource management plan starting with the Prey Lang
Forest as a model including but not limited to:
1. Community Forests
2. Surface and ground water hydrology
1. Enhanced agricultural practices and food security

Rapid Socio-economic and Hydrological Assessment of Prey Lang Forest –Summary of Baseline Conditions
Advancing Engineering Consultants, Ltd. 55
2. Land use practices and rights
3. River dynamics hydraulics
4. Tonle Sap/Mekong River protection
5. Fish Habitat and migration path protection
6. Biodiversity protection
7. Concession management
1. Mining
2. Plantation
8. Rigorous performance measurements, monitoring and evaluation are
critical to early detection of problems, and proactive follow-up with vigorous
follow-through is essential to resolving the problems.

Rapid Socio-economic and Hydrological Assessment of Prey Lang Forest –Summary of Baseline Conditions
Advancing Engineering Consultants, Ltd. 56
6. APPENDIX A
6.1. Supplemental Update Of Baseline Conditions
6.1.1 Introduction o The following is an informal follow-up to the Summary of Baseline Conditions of the
Rapid Socio-Economic and Hydrological Assessment of the Prey Lang Forest to
which it is included as an appendix. The original Rapid Assessment was dated
July 2011 and is referred to herein as the Primary Assessment Report or PAR.
This summary report is a supplement to the main body of this report. The purpose
of this summary is to review some of the events that have transpired since the
original PAR was submitted that might affect results or recommendations. It is
based on a review of reports and files available online and presented in the
Cambodia news media. It is not intended to provide a numeric update of PAR
scoring results, taking into account the new developments, which is beyond the
scope of this review, but is highly recommended.
o In addition to the literature search, AE staff interviewed recognized authorities of
Cambodian forest management and practices, namely Dr. Keo Omaliss, the
Deputy Director of the Forestry Administration’s Department of Wildlife and
Biodiversity and the Cambodian National REDD Focal Point. Dr. Omaliss provided
invaluable input into the original PAR, as well as FA follow activity since then. In
addition, Sokheng Seng, who is a proactive advocate for protecting the forest,
offered insight into what is happening from the perspective of the Kuy people who
live within the forest and to whom “Prey Lang” literally means “Our Forest”.
o Overall, the general status of the forest has remained the same, although the
Forest Administration (FA) is proactively introducing conservative forest
management strategies to conserve the Prey Lang Forest. Recognizing the need
for more accurate data, which was one of the major conclusions of the PAR, the
Ministry is actively trying to close the data gaps in order to be able to make
informed decisions based on adequate reliable information, a major
recommendation of the PAR. In addition, while REDD funds have not been
forthcoming, the FA continues to prepare REDD initiatives and practical science-
based surveys such as biodiversity, carbon and non-carbon studies, biomass and

Rapid Socio-economic and Hydrological Assessment of Prey Lang Forest –Summary of Baseline Conditions
Advancing Engineering Consultants, Ltd. 57
wetlands inventories to reinforce long term carbon controls and storage. New
initiatives include the demarcation of the Prey Lang, the need for which was also
discussed in the PAR. The FA commented that the workshop conducted by AE
and Forbes was very beneficial and suggested that more should be conducted.
6.1.2 Illegal Logging and migration o While illegal logging was occurring and addressed during the original Assessment,
apparently it has increased significantly since that time. Reportedly,
concessionaires are logging outside concession areas and then reporting the
timber as concession production. If confirmed, this would cause discrepancies in
forest clearing accounting and making it difficult to reconcile different forest
clearing measurement methods. In addition, emigration is increasing as land is
cleared as a result of development, thus causing important demographics shifts.
The growing population increases the reliance of low income families on resin
income from trees, which are the very same trees that are being logged. These
demographic and economic changes place a significant stress on the indigenous
people historically living and caring for “our forest”, increasing poaching of the wild
animals and effecting not only biodiversity, but compounding the loss of ecological
services further increasing pressures on the forest and its inhabitants. The
unintended consequences highlight the value for establishing a good basis for
baseline conditions for the forest using SuDeX methods and following up on the
original assessment recommendations. The resulting positive feedback loop is
indicative of the need to measure the consequences in order to identify changes
using the scoring process to indicate which to prioritize and how to adjust
accordingly.
6.1.3 REDD+ o An important finding of this review is the apparent confirmation of the uncertainty
that REDD+ can assure revenues that can be counted on over time to subsidize
the storage of carbon and support the preservation of the forest. Therefore, as a
backup if not replacement, some sort of economic alternative to REDD+, needs to
be developed, such as sustainable forest management practices to ensure reliable
income, while concurrently assuring the hydrological cycle is sustained to support
reliable long time fish supply, river flow (and therefore hydropower), as well as the
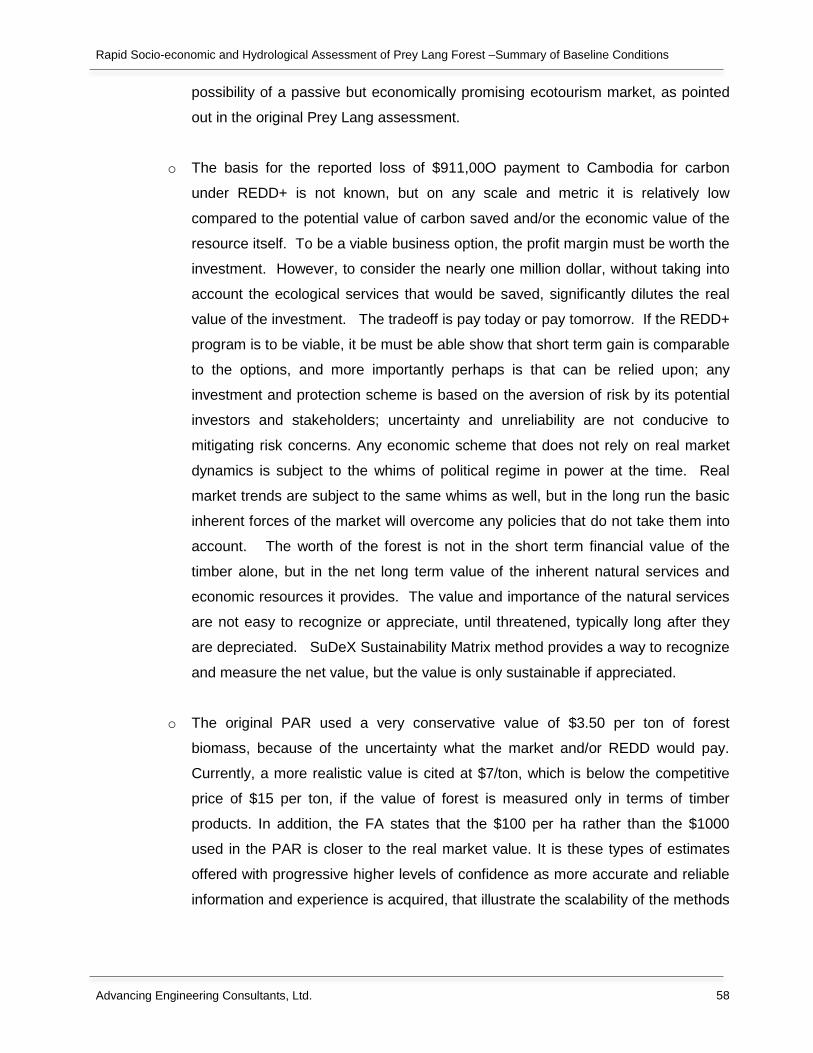
Rapid Socio-economic and Hydrological Assessment of Prey Lang Forest –Summary of Baseline Conditions
Advancing Engineering Consultants, Ltd. 58
possibility of a passive but economically promising ecotourism market, as pointed
out in the original Prey Lang assessment.
o The basis for the reported loss of $911,00O payment to Cambodia for carbon
under REDD+ is not known, but on any scale and metric it is relatively low
compared to the potential value of carbon saved and/or the economic value of the
resource itself. To be a viable business option, the profit margin must be worth the
investment. However, to consider the nearly one million dollar, without taking into
account the ecological services that would be saved, significantly dilutes the real
value of the investment. The tradeoff is pay today or pay tomorrow. If the REDD+
program is to be viable, it be must be able show that short term gain is comparable
to the options, and more importantly perhaps is that can be relied upon; any
investment and protection scheme is based on the aversion of risk by its potential
investors and stakeholders; uncertainty and unreliability are not conducive to
mitigating risk concerns. Any economic scheme that does not rely on real market
dynamics is subject to the whims of political regime in power at the time. Real
market trends are subject to the same whims as well, but in the long run the basic
inherent forces of the market will overcome any policies that do not take them into
account. The worth of the forest is not in the short term financial value of the
timber alone, but in the net long term value of the inherent natural services and
economic resources it provides. The value and importance of the natural services
are not easy to recognize or appreciate, until threatened, typically long after they
are depreciated. SuDeX Sustainability Matrix method provides a way to recognize
and measure the net value, but the value is only sustainable if appreciated.
o The original PAR used a very conservative value of $3.50 per ton of forest
biomass, because of the uncertainty what the market and/or REDD would pay.
Currently, a more realistic value is cited at $7/ton, which is below the competitive
price of $15 per ton, if the value of forest is measured only in terms of timber
products. In addition, the FA states that the $100 per ha rather than the $1000
used in the PAR is closer to the real market value. It is these types of estimates
offered with progressive higher levels of confidence as more accurate and reliable
information and experience is acquired, that illustrate the scalability of the methods

Rapid Socio-economic and Hydrological Assessment of Prey Lang Forest –Summary of Baseline Conditions
Advancing Engineering Consultants, Ltd. 59
introduced in within the PAR that eventually lead to a quantitative basis for
reaching an optimum decision.
6.1.4 FA Conservation Objective o The FA seeks to implement a conservation strategy to manage the forest, because
it understands the long term implications and consequences of following either the
preservation or total conversion policy. In order to garner the support needed to
implement the strategy, it must be able to convince the government, stakeholders,
and the public that the net gain by maximizing the positive and minimizing the
negative consequences is real and can be achieved. This can be accomplished, in
part at least, by following up on the recommendations provided in the original
assessment and outlined in this summary.
6.1.5 Large Development Projects o In addition to the expansion of the development issues discussed above and that
were on going during the original study, three major development initiatives that
will have a significant effect on the Prey Lang landscape, are reportedly at some
stage of planning. It is unclear where, when and if they will actually materialize.
The reports vary diametrically from already in place to not even on the drawing
board, with an apparent lack of intercommunications between the relevant
agencies, indicating a lack of transparency which is vital if the tradeoffs are to be
accurately evaluated, and an optimum decision can be reached.
o The projects include mining exploration and exploitation, additional hydropower
dams, and an expanded railroad network throughout SE Asia. What is known for
certain is that each will have major economic advantages and social benefits, with
significant social tradeoffs and environmental sacrifices. What is uncertain is
whether the initial probable financial gain will offset the ultimate environmental
impact, causing future financial setbacks as the one renewal natural resource,
water, is almost certainly depleted without its natural cycle to recover. All this is
based on using money as the primary unit, but what about the loss of services that
the ecosystem provides in support of local biodiversity, regional hydrological, river
and stream hydraulics, and groundwater hydrogeological stability, and of course
carbon storage capacity…all of which human existence is dependent upon, and

Rapid Socio-economic and Hydrological Assessment of Prey Lang Forest –Summary of Baseline Conditions
Advancing Engineering Consultants, Ltd. 60
arguably (perhaps) has much greater importance, then but not limited to financial
return?
6.1.6 Potential Mining Projects o At the time of the original assessment, mining and potential mining projects were
talked about almost as if rumors and originating source unknown. Currently the
mines seem much better defined; there is still a great deal of apparent uncertainty,
especially regarding scale and impact. Since that time, there have been numerous
reports of large mining ventures at various stages of development, but formal
reliable information is still lacking and conflicting. The full magnitude of the impact
of the mining operation is not known, but how they will affect the Prey Lang forest
most assuredly will be significant. Whether the net affects are negative or positive
will require an additional study.
o Reportedly, an Environmental Impact Assessment (EIA) of the proposed mining
operations has not been conducted (as of March 2013). This type of study takes a
great deal of field investigation, research and modeling over an extended period of
time in order to have any quantitative decision making value. To proceed without a
carefully done EIA would be quite risky environmentally, socially and economically.
These developments do not alter the recommendations of the PAR, but rather
reinforce the need and place a greater urgent priority on them. This will benefit all
stakeholders ensuring the best interests of all are incorporated into the planning.
6.1.7 Railroad o In conjunction with the mining reports are reported plans to construct a major
railroad from the mining area in the southern portion of Preah Vihear Province to a
proposed port in Koh Kong. If constructed, the railroad will be Cambodia’s largest
development project reportedly costing $11.2 Billion USD. It seems unlikely that
such an undertaking would be based on one project alone. However, as is typically
the case information is sorely lacking. Improving Cambodia’s transportation system
including restoring old railways and building new roads will have a major impact on
Cambodia’s development. As always there will be tradeoffs and it is not known at
this time where the optimum coverage is or how the Prey Lang forest will be
affected, but this study alone would have major benefit for Cambodia. Such a study
would take considerable time and effort, although the cost would be relatively low

Rapid Socio-economic and Hydrological Assessment of Prey Lang Forest –Summary of Baseline Conditions
Advancing Engineering Consultants, Ltd. 61
as compared to that of the projects and most likely the cost would be recovered by
being able to make an informed decision and more effective and efficient plans.
6.1.8 Dams o Dams were addressed by the PAR and there was a considerable controversy at
the time concerning the eleven dams proposed on the lower Mekong in addition to
the four built by China on the upper reaches. The controversies are mired with
insufficient and timely information. The controversy continues today with the
increased fervor, conjecture, and urgency. The nonbinding Mekong River
Commission recently restated its recommendation made in December of 2011 for
a ten year moratorium on dam building. It reportedly had little affect with the 1,280
MW Xayaburi Dam in Laos reportedly moving forward. But the reports are
conflicting, although one reporter claims to have visited the construction site, while
ministry head claim not to know about it, since they were “not invited”.
o How can a reasonable assessment be made without a reliable source of
information? Yes the dams will have great economic benefit and provide needed
electricity to many people, and yes the dams will cause significant environmental
degradation, loss of ecological services, and disrupt biodiversity, but to what
objective extent is not known. The best case scenario is brilliant for the near future,
with the gains far exceeding the losses, while in the worst case the benefits are
short term and loses will be devastating, long term, and difficult to reverse. The
most reasonable likely case lies somewhere in between, but where, who
determines, how and when? The methods provided in the PAR offer one
alternative, and at the very least provide a relatively easy starting point, but by no
means the final answers, which require comprehensive, objective, scientific,
engineering and social studies.
6.1.9 Political Will o It has only been two and half years since the original PAR was completed, and yet
much has happened, on paper at least, but the migration issues and the letting of
the Economic Land Concessions are real and disconcerting and the proposed
large project development are both promising and ominous. All these
considerations will affect the SuDeX Sustainability Matrix Score in a negative
direction, although the net gain or loss is difficult to predict. What is known with a

Rapid Socio-economic and Hydrological Assessment of Prey Lang Forest –Summary of Baseline Conditions
Advancing Engineering Consultants, Ltd. 62
high level of confidence is that to proceed too quickly without some basis for
making decisions will have dire consequences. The lack of transparency,
accountability, communication, and information all compound the difficulties.
However, two of the most promising finding of this informal and cursory review is
the continued conscientious and thoughtful direction the various forest
administration ministries are attempting to follow despite the presumed many
pressures there must be to promote development and ignore the illegal activities.
o One of the more unexpected findings of this review, that has the greatest potential
to ensure the best interest of Cambodia are met, is the reported actions of the
government to cancel four economic land concessions totaling approximately
40,000 hectares in the Prey Lang Landscape because of its highly sensitive and
unique environmental qualities. Such action was unlikely 2 years ago and with all
the contentious development that has occurred since then, this cancelation is seen
by many is a strong indication of the willingness of the Government to proceed and
enforce policies to meet their stated goals. It is only with political will and financial
wherewithal that any policy can be realized. This is not to imply that this action
alone ensures the policies can be efficiently and effectively administered, managed
and maintained. Without transparency, accountability, and communication that are
generally lacking, as discussed earlier no system can be sustained.
6.1.10 Summary o The mining and railroad will have direct impact on the Prey Lang forest, both
positive and negative, and will also affect the Mekong River and Tonle Sap Great
Lake. The proposed dams along that reach of Mekong River bordering the Forest
boundary will be affected as well potentially increasing sedimentation, altered
hydraulics, and effecting fish migration and spawning. The effect of the dams on
the forest may be less direct, but the dams present much greater impacted area
with far reaching political consequences. Collectively, these large projects, the
deforestation, emigration into the area, along with the increased infrastructure
needed to support the growth, will most certainly require a great deal of planning,
political will and resource management to promote prudent responsible growth,
which presents its own set of social, environmental and economic considerations.
To fully evaluate the immediate and potential long term consequences all must be
considered.

USAID-Supporting Forests and Biodiversity ProjectPhnom Penh Center, Building F, Room 588Sothearos Blvd, Phnom Penh, CambodiaTel: +855 (0)23 220 714E-mail: [email protected]


